Article

Losing the Plot: The Impact of Urban Agriculture on Household Food Expenditure and Dietary Diversity in Sub-Saharan African Countries

School of Accounting, Finance and Economics, University of Greenwich, Old Royal Naval College, Park Row, London SE10 9LS, UK
*
Author to whom correspondence should be addressed.
Submission received: 14 November 2022 / Revised: 17 January 2023 / Accepted: 20 January 2023 / Published: 24 January 2023
(This article belongs to the Topic Sustainable Development and Food Insecurity)

Abstract

:
Urban agriculture (UA) is proposed as a solution to the social and economic challenges presented by cities by providing urban households with food and income using environmentally friendly food production techniques. To date, most analysis of UA has been based on single-city studies. This paper aims to contribute to the literature by using a cross-country approach and by analysing household level data from nine sub-Saharan countries—Burkina Faso (2014), Ethiopia (2013), Ghana (2009), Malawi (2013), Niger 2014, Nigeria (2012), Tanzania (2010) and Uganda (2013). This paper sets out to answer three questions; the first investigates which are the main characteristics of households engaged in urban agriculture; the second looks at the role played by UA in diversifying household diets and reducing household food expenditure; the third examines the heterogeneity in the impact of UA across the food expenditure distribution. Using an inverse-probability weighted regression adjustment method, the results show that households engaged in agriculture reduced expenditure on food and modified their food expenditure profile by spending more on protein rich food -nuts, legumes, fruits, dairy products, meat and poultry. The study also finds substantial variation on the impact of UA across the food expenditure distribution.

1. Introduction

By 2050, the world population will reach 9.6 billion, and the majority are likely to live in urban areas of less developed regions [1,2]. The urbanisation trend is already evident in sub-Saharan Africa, where the urban population is projected to double between 2010 and 2030 [3]. An expansion of urban populations inevitably puts pressure on rural agricultural production and distribution to provide food to city dwellers [4]. Despite many technological and mechanical improvements in food production—as well as the use of genetically modified crops—distribution bottlenecks and malnutrition remain prevalent and food poverty continues to be problematic in many cities around the world [5]. This situation is going to worsen. It is estimated that 40% of urban inhabitants across the world live on less than US $1 a day, while 70% live on US $2 a day [6]; urban households in the poorer strata of the population spend up to 80% of their income on food, making them extremely vulnerable to food price volatility. The importance of agricultural activities practised in an urban setting—in terms of food access, dietary diversity, health related outcomes and additional income—is clear [7,8].
Urban agriculture (UA) is defined as the growing of crops and the raising of (small) livestock in areas within the urban boundaries of cities and towns with the purpose of either personal consumption or selling the crops in urban markets. UA is practised in several locations, e.g., home gardens, vacant lots, roadsides, green areas and balconies, but also in privately or institutionally owned land [9]. Urban farmers mostly plant vegetables along with fruit, root or leguminous crops, depending on local demand, as well as poultry and small ruminants [10]. Although official numbers on the size of the overall UA phenomenon do not exist, a conservative estimate suggests that between 15 and 20% of the world’s food is currently being produced in cities [11].
A positive narrative has been built around UA, as it is regarded as a solution to the social, economic and environmental challenges cities face [12,13]. Urban farmers engage with UA to meet their daily food requirements; in this regard, UA improves households’ access to food in times of shortage, instability or uncertainty, and provides them with an additional source of income, strengthening households’ resilience in times of crises. The balance between UA intended for individuals’ own consumption and for income generation varies and may depend on several variables, including the gender of the farmer, wealth of the households, area of residence and size of the allotment [14].
Despite the potential benefits that UA can generate (not only in terms of food provision and income, but also in terms of empowerment for women), UA does face several constraints: lack of available and extensive green areas, an absence of clearly defined property rights, a shortage or unavailability of low-cost feed for livestock, and environmental and health concerns regarding waste and soil/water used in the plots [15]. Access to free land is problematic and—alongside the lack of property rights—represents a challenge for long-term farming strategies. In addition, UA still lacks a proper legislative frame capable of reducing negative environmental externalities [16]. Along the same lines, there are several diseases and pathogenic agents that can be passed to, and cause harm to, humans through vegetables, livestock and animal products [17].
Overall, the current scientific literature on UA is vast, but has shortcomings. Most studies are single-city studies [18], and there is need for a larger examination, which can be provided by a cross-country analysis of nine sub-Saharan countries.
In this paper, we set out to answer three questions; the first investigates the typology of households engaged in UA; the second looks at the role played by UA in diversifying household diets and in reducing overall food expenditure for the households; the third examines the heterogeneity in the impact of UA across the food expenditure distribution.
The estimation strategy comes with its own challenges. Household with given traits, as an example, households already employed in agricultural activities, are more likely to practice UA and this could lead to a selection bias in the estimation measuring its impact. To address this, the Propensity Score Matching (PSM) approach can be used, however, the estimate of PSM can itself produce biased results in the presence of misspecification [19]. For this purpose, an inverse-probability weighted regression adjustment (IPWRA) method is used, as it can model both the outcomes and the treatment to control for the endogeneity in the non-random participation in UA by the households [20].
Results indicate that households engaged in agriculture reduced food expenditure by 3 percent and modified their diet by eating more types of protein rich food, such as nuts, legumes, fruits, dairy products, meat and poultry. Although the analysis carried out here highlights that the contribution of UA in increasing food diversity—both in terms of food count and food categories—is on average very modest, it is acknowledged that UA could still play a role in household food security by significantly reducing the food expenditure. The effect UA has on households’ expenditure and diet vary; the country-related quantile analysis suggests the existence of substantial variation, with bigger decreases in percentage points of food expenditure at the higher end of the expenditure distribution.
The paper is organised as follows; the next section will briefly look at part of the existing literature on UA. Section 3 will describe the data used and offer descriptive statistics. Section 4 presents the methodology used and Section 5 provides the results. The concluding remarks are in Section 6.

2. What We Know about Urban Agriculture

The complete literature on UA is vast; in this section we look at the most notable contributions that examine UA participation, its drivers and the main challenges faced.

2.1. Who Practices Urban Agriculture?

It would be unrealistic to expect an urban environment to ever become entirely self-sufficient when it comes to the provision of food; this is prevented by the (lack of) space, as green areas in the urban context are limited and virtually all cereal crops grow more efficiently in rural (larger) fields. Given this, UA already makes a significant contribution to enhance food security in many major cities. The UNDP estimates suggest that the 800 million urban farmers around the world are responsible for about 15% of the global food production [21]. In sub-Saharan Africa, UA agriculture activities are mainly conducted by women. This is overwhelmingly the case in East and Southern Africa, but less so in West Africa, where both women and men are involved in UA activities [22,23]. Two factors explain the higher proportion of women engaged in UA: women overall have lower levels of formal education, which makes it more difficult for them to find formal employment vis-à-vis men, and the localised nature of UA fits well with women’s domestic duties. Practicing UA is compatible with the role they traditionally have within households, i.e., being wives and mothers [24,25]. However, women often face difficulties accessing land, water, labour, capital and technologies, and may be prevented by laws and informal attitudes from owning assets or making decisions about how to use assets [26,27].
UA can be a household business too, where all the family members are involved. Women tend to be more involved in the planting, weeding and hoeing activities [24], and men more responsible for preparing the land beforehand [28]. This stems from the cultural tradition showing that men are more suitable for activities involving harder physical labour. This applies to a lesser extent in urban plots which are smaller and more continuously farmed, making labour less arduous [29].
While keeping livestock is still considered to be a male domain, there is a consensus that women are the ones selling UA products of either vegetable or animal origin [30].

2.2. The Drivers behind Urban Agriculture

UA may help households in two main ways; it improves their diet through the inclusion of more freshly grown produce, and it improves their financial well-being through additional income gained by selling excess produce. Urban farmers engage in agricultural activities to enjoy fresh foods that have higher nutritious qualities—mainly fruits, vegetables and eggs—which otherwise would not necessarily be available for purchase [31,32]. UA improves households’ financial security and resilience in times of uncertainty via the possibility of selling those fresh products in local markets.
In terms of food security—defined as “access by all people at all times to enough food for an active healthy life” [33]—UA represent an alternative to food produced in rural areas. The urbanisation process—which, among other effects, reduces the pool of workers in the agricultural sector—the increasingly harsh climate condition, longer supply chains and transportation represent only a few of the factors making rural agriculture less reliable [34,35]. The production of vegetables and fruits within urban and peri-urban boundaries provides food for millions of urban dwellers as well as livelihoods for urban farmers.
A study using household-level data from 15 developed/transition economies highlights that a high share of households earn income from UA [36]. The overall positive effectiveness of many UA projects has been assessed by Masset et al., (2011) [18]. Their review of 23 existing agricultural programmes points out that UA activities increase the consumption of food rich in protein and micronutrients, although the impact on growth-stunting and children health-related indicators is limited [37].
Poulsen et al., (2015) reviewed 33 studies on UA in sub-Saharan Africa and compiled urban farmers’ perception about UA. Evidence of the positive contribution of UA comes from, among other countries, Kenya, where 40% of surveyed urban farmers “think they would starve if they were stopped from farming” [38]. In Cameroon, urban farmers considered UA to be the most important source of calories for their households [25], and in Zambia, UA is considered a key tool for meeting shortfalls in household food requirements [39].

2.3. Barriers to Urban Agriculture

Land availability within the urban perimeters is a crucial issue. Insecure land tenure can trigger conflicts, and municipalities acknowledging the benefits of UA struggle with outdated regulations as they try to facilitate its expansion [40,41].
Land access is not the only barrier to UA. Farming on contaminated soil, irrigating crops with untreated wastewater and the use of chemicals represent some of the environmental and health issues that must be considered when discussing UA [42]. There are several kinds of potential food hazards, including physical, chemical or microbial. Potential hazards for food contamination relate to fruits and vegetables grown near major roads, railways and industrial sites. Chemical food hazards—i.e., water and soil pollution caused by organic pollutants—endanger the product quality (Nabulo et al., 2010). Microbial contamination may occur throughout the production chain and may be a consequence of contaminated common pool resources [43]. As an example, the presence of pathogens in the soil, application of contaminated manure, irrigation with untreated water or the cleaning of a product by using polluted water. The absence of legislation and protection regarding UA poses a threat to crop yields and overall quality. Even so, banning the use of wastewater for irrigation may not be the solution as there is little access to other water sources. Health implications for producers need to be considered along with concerns about the final product.
Any discussion on barriers to UA should also mention livestock practices; contagious diseases, including zoonoses, have negative impacts on animal production and constitute a severe public health risk. The spread of such diseases is facilitated in areas where there are markets selling live animals. Livestock manure used for local crops or left as waste poses risks for the transmission of diseases to animals as well as to humans. Anecdotal evidence regarding possible sources of COVID-19 may well influence government decision-making regarding UA and animal markets.
At the same time, UA does have the potential to contribute to a healthier environment by recycling and reusing some of a city’s organic wastes. Connecting produced waste with the need for fertiliser solves two problems: decreasing soil fertility and pollution of organic waste into the environment [44]. Compost cannot fully replace other fertilisers as some nutrients—e.g., nitrogen—are low, but the net effect of compost on nutrient poor soils is still positive.

3. Data and Descriptive Statistics

The analysis that follows is based on household level data representative at the urban level, drawn from surveys in sub-Saharan African countries and made available from the World Bank via the Living Standards Measurement Study (LSMS). The data from the following surveys were used (corresponding survey years in parentheses): Burkina Faso (2014), Ethiopia (2013), Ghana (2009), Malawi (2013), Niger 2014, Nigeria (2012), Tanzania (2010) and Uganda (2013) (Table 1). Although the questionnaires used for data collection vary from country to country, data have been standardised for comparison purpose (see Tasciotti and Wagner (2018) on the quality of household level data). While the surveys are recent (collected within the last decade), two of them—Ghana and Tanzania—were launched more than 10 years ago. In the presence of rapid urban transformation, the conclusion we may be drawing for some of the countries may be out of date but will still indicate the contribution UA has had in terms of food security. The number of observations—i.e., urban households—ranges between 800 for Uganda and 4000 in Burkina Faso, with most of the countries having data on approximately 1000 urban households.
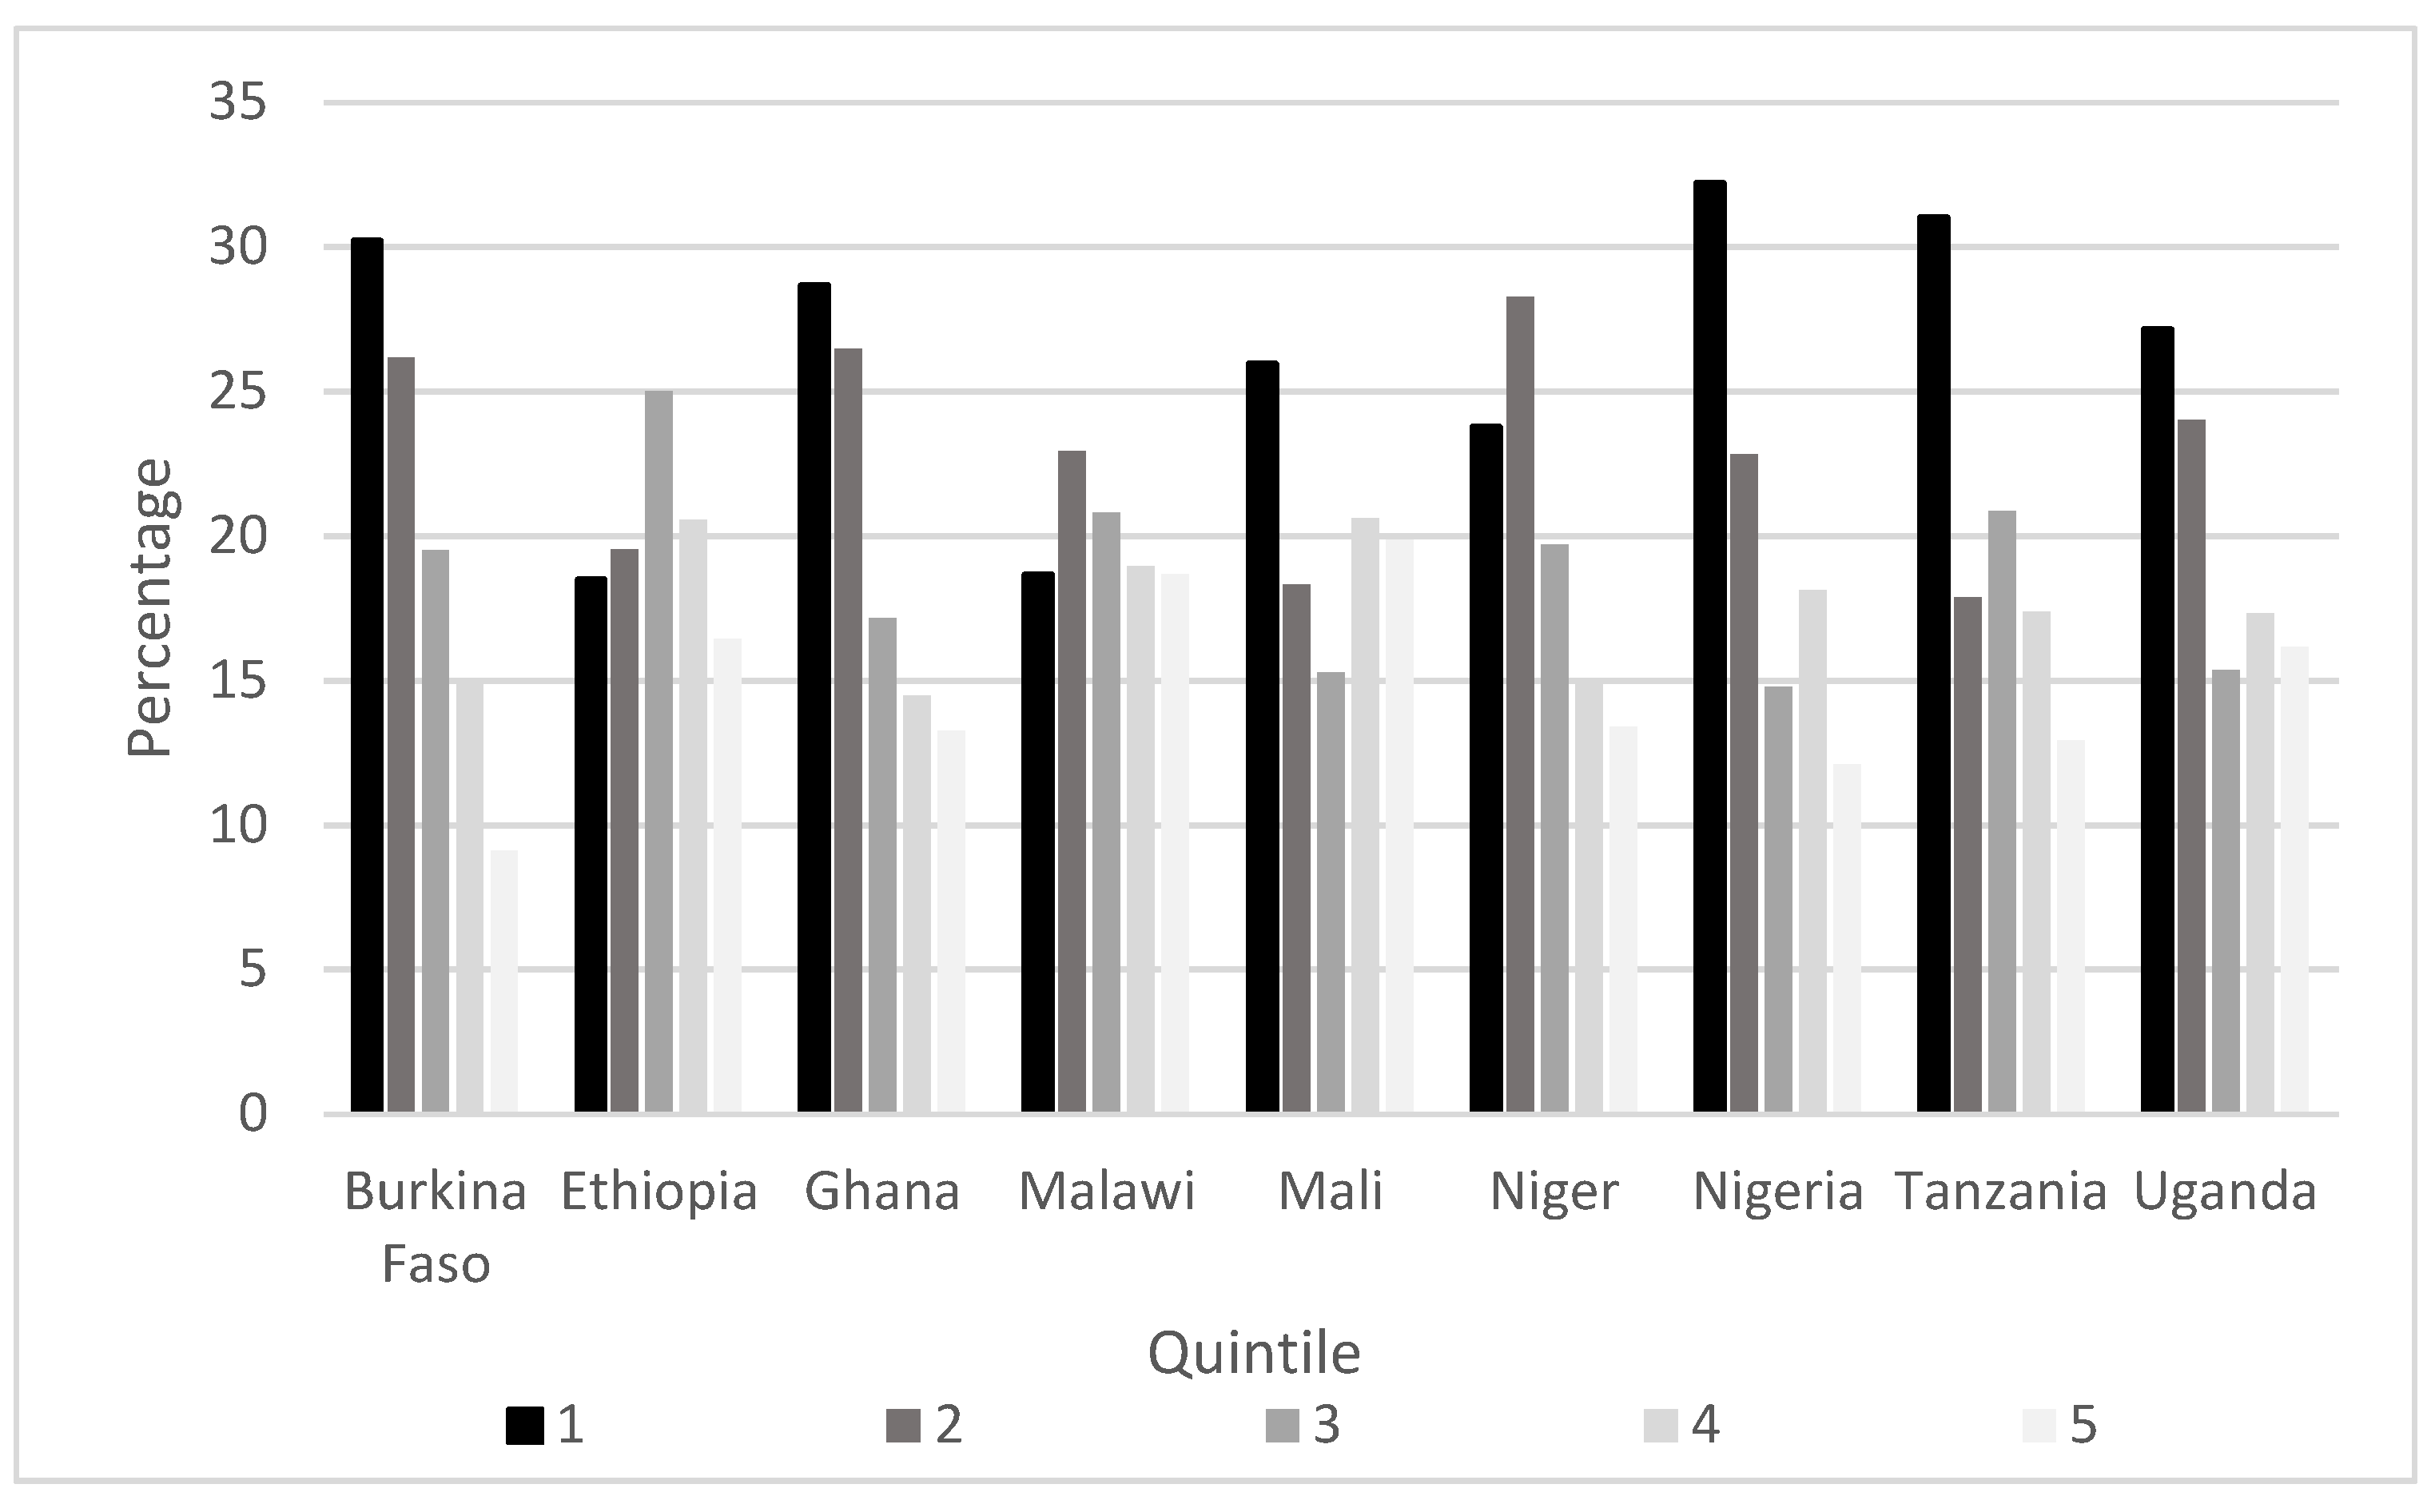
To understand the magnitude of the UA phenomenon we look at the rate of participation in urban agricultural activities in each of the nine countries and in each of the five wealth quintiles. The results are summarised in the histogram presented in Figure 1. Participation rates do vary across countries and across quintiles and generalisation are not easy to make; however, there are some regularities. On average, about 20% of the urban households practice some form of UA. More households in the lower wealth quintiles engage in UA, between 19 and 32%; this regularity does not happen in Ethiopia, where households in the third quintile are the ones engaging in the most UA (25%). The statistics show a lower engagement compared to the one presented by Zezza and Tasciotti (2010) [36] in which between 60 and 70% of the households in the poorest quintile were engaged in UA. The participation statistics show how UA—while it could not be considered negligible—does not appear to be the income generating activity mostly practised in urban areas; instead, it is a side activity mostly practiced by households in the lower income quintiles.
The statistics on the household food expenditure—albeit nonconclusive—show a lower yearly food expenditure profile for those engaging in UA (Table 2). The computation of the food expenditure does not consider in-kind food, e.g., foods being produced by the household via UA or received for free. The difference can be minimal—30 USD in Ghana—or higher, as in the case of Uganda (about 600 USD); the same trend is observed for the per-capita food expenditure. The lower expenditure profile does not necessarily translate to a less diversified diet, as the rest of the table indicates. We employ two indicators related to dietary diversification: the food count and the food group. The first one is a simple count of the different food items the household report having consumed during the survey reference period, while the second one is based on 12 food groups (the 12 food groups considered here are: cereals, starch and tubers, nuts and legumes, vegetables, fruits, milk products, oil and fats, meat and poultry, fish, sugar and syrups, beverages and miscellaneous). The statistics do not show any major difference between the two categories of households (the differences are rarely statistically significant). Results in Table 2 point out that practicing UA is associated with lower food expenditure, and that this does not prevent the household from having a diversified diet.
Table 3 below presents the summary statistics of the variables used in the analysis. The household who are engaged in UA have a lower food expenditure ($1578.39) compared to those who are not engaged in UA ($1904.22). Both the groups have similar food group, food count, and number of food products consumed. Those households not engaging in UA activities tend to have higher scores for the food group and food count categories, although the difference is very marginal. The differences between UA and non-UA households in terms of food count in the 12 categories used here are very negligible. The households practicing UA have a lower amount of assets. (We created an asset index using Principal Component Analysis. The index utilises information on assets such as refrigerator, stove, bed, mobile, TV, video player, sofa, bicycle, motorcycle and car.) The head of the households practicing UA are older (49 years compared to 43.5 years for non-UA households), more likely to be male (82% compared to 74% for non-UA households) and married (81% compared to 69% for non-UA households). The head of UA households has, on average, completed 4.6 years of education; this is significantly lower the head of non-UA households, who have completed 7.69 years of education on average. The households practicing UA are more likely to be employed in agricultural activities and have a higher number of children, adults and senior adults.

4. Methodology

The objective of this study is to analyse the impact of UA on food consumption patterns. This can be calculated by using average treatment on the treated (ATET), which is the difference between the mean outcomes of households engaged in UA and the mean outcome for the same group if they had not been engaged in UA. ATET can be written as:
ATET = E[Y(1) − Y(0)|I = 1] = E[Y(1)|I = 1] − E[Y(0)|I = 1]
where Y(1) and Y(0) represent the variable of interest for households engaged in UA and not engaged in UA, respectively. ‘I’ represents the treatment indicator that takes the value 1 if the household is engaged in UA and 0 otherwise. E[Y (1)|I = 1] is the expected outcome for the household engaged in UA, conditional on practicing UA and E[Y (0)|I = 1] is the expected outcome for those households are not engaged in UA, conditional on practicing UA. However, it’s not possible to observe the outcome for E[Y (0)|I = 1]. It would not be statistically correct to replace it with the outcome of the household not engaged in agriculture (E[Y (0)|I = 0])—since factors that influence the participation in agriculture may also affect decisions on food consumption, leading to bias ATET estimates (Takahashi & Barrett, 2013). To address this issue, we can apply the propensity score matching technique which attempts to approximate a randomised experiment by statistically creating a synthetic sample based on observed covariates xi which are independent of participating in UA.
The ATET psm can be written as:
ATETpsm = E[Y (1)|I = 1, p(x)] – E[Y (0)|I = 0, p(x)]
where ATET psm is propensity score weighted mean difference in outcomes, x is the vector of covariates which are not independent of I, and p(x) is the propensity score.
However, misspecification in the propensity score matching method can lead to bias [19]. To address the misspecification bias, we employ IPWRA methods. The advantage of this method over others—including the PSM one—is that it estimates both the treatment and the outcome model [20]. The resulting estimator may produce consistent and robust results even when one of the models is mis-specified [45], a trait predominately known as double robust [46]. For technical details on IPWRA, see Wooldridge (2010) [19].
Following Wooldridge (2010) [19], the IPWRA estimations can be conducted in two steps. In the first step, we estimate the propensity scores p ( x ; γ ^   ) based on a set of observable variables. In the second step, a series of regressions are conducted to estimate ( α 0   ,   β 0 ) and ( α 1   ,   β 1 ) using inverse probability weighted least squares as indicated in (2) and (3) as seen in Manda et al., (2018) [47]:
min α 0 ,   β 0     i = 1 N (   y i α 0 β 0 x i )   1 p ( x , γ ^   )   i f   I i = 0
min α 1 ,   β 1     i = 1 N (   y i α 1 β 1 x i ) /   p ( x , γ ^   )   i f   I i = 0
By utilizing inverse-probability weights from the difference between equation above, the IPWRA estimates the ATET as follows in (4):
ATET IPWRA = 1 N i = 1 N [ ( a ^ 1 a ^ 0 ) + ( β ^ 1 β ^ 0 ) x i ]
where ( a ^ 1 ,   β ^ 1 ) are estimated inverse probability weighted parameters for households that practice UA while ( a ^ 0 ,   β ^ 0 )   are the parameters for members who did not practice UA, xi represents a vector of exogenous variables that affect the dependent variables used for the analysis (food expenditure, food group, food count and number of food products in the 12 food categories, and N indicates the total number of households who practice UA (since some of outcomes are categorical variables (food group, food count and the 12 categories of food), we used the IPWRA estimation procedure with Poisson regression as an outcome model to perform the analyses).
Additionally, we employ an unconditional quantile treatment effect (QTE) using the residualised quantile regression approach by Borgen, Haupt, and Wiborg (2021) [48]. Unconditional quantile treatment effect (UQTE) is a measure of the average treatment effect on a specific quantile of the outcome distribution that is not conditioned on any covariates. Unlike the conditional quantile treatment effect (CQTE) which estimates the treatment effect at a specific quantile while taking into account the values of one or more covariates, UQTEs estimate the treatment effect for the entire population. (UQTEs are less sensitive to the choice of covariates used in the estimation than CQTEs. Since UQTEs do not depend on any specific set of covariates, they can provide a more robust estimate of the treatment effect. These effects are of particular interest in policy evaluations as they are simple to interpret and can be easily conveyed and summarised [49].)

5. Results

The paper uses a probit model to investigate the profile of the households most likely to engage in UA. The dependent variable in this model is a binary variable which takes the value 1 if the household practices UA, and 0 otherwise, and the probit regression is completed by including all the observations—i.e., all the urban households—in the nine countries. Table 4 presents the probit estimation and marginal effect (second and third column respectively), indicating how each variable affects the likelihood of being engaged in UA activities. Results indicate that the age of the head of the household, whether the head of the household is currently married, whether the head of the household is already employed in agricultural activities, and the number of children, adults and older members (65 years old or more) of the household all increase the likelihood of the household practicing UA. This effect is particularly strong for households where the head of the household is already married (7.4 percent, significant at 1 percent) and employed in agricultural activities (9 percent, significant at 1 percent). Contrary to what some of the literature suggests, the variable ‘female head of the household’ does not increase the likelihood of participating in UA activities. This result is related to the fact that UA is often considered an activity involving all the household members, with the men being more responsible for the harder work and the women being more involved in the planting and weeding activities [28].
The results in Table 4 shows that education level of the head of the household and the household’s assets negatively affect the likelihood of the household practicing UA, while household size—more children and more adults—does positively and significantly affect UA uptake.
To address the issue of non-random engagement of household in UA—i.e., households self-selecting themselves into UA activities—we employ the IPWRA method to balance the covariates. The ATET estimates are presented in Table 5 model (1). We find that households that practice UA reduced their expenditure on food by 3%, freeing up some additional cash for other household non-food needs. This result is in line with the existing evidence (see [9] for a systematic review of the food security related impacts of UA). The 3% saving represents an average across the population that participates in UA; later, we will analyse how those savings differ across the food expenditure deciles.
To further investigate the contribution of UA in terms of households’ diet, we look at the impact of UA on several indicators related to the household’s consumption: the yearly food expenditure, the food group and food count indicators, and the 12 categories of food. The results (Table 5) suggest that households practicing UA do consume more categories of food items in general as the coefficients associated to both food group and food count are positive and significant at the 1% level. The increase in the number and categories of food consumed happen via a re-shuffle of the diet; households engaging in UA reduce the number of vegetables, fish, oil and fats consumed but increase those of fruits, meat and poultry, milk products, starch & tubers, nuts & legumes. This change in the diet—which is minimal but significant—implies that households engaged in UA eat more types of protein rich food—nuts, legumes, fruits, meat and poultry—while cutting down on oils and fats. Regarding the decrease in the number of vegetables consumed, urban farmers are more likely to grow vegetables in their plots, hence they tend to consume only those specific vegetables. Fish is usually a costly luxury product—unless the household lives near the coastline—so households may be consuming fewer types of fish while consuming more types of meat, which are cheaper and easily available. We found no impact of UA on food items such as cereals, sugar products and beverages. The lack of a significant impact of UA on those three categories of food can be interpreted as a falsification test; food in those three categories is not directly produced by the urban farmers [50].
We report the results from PSM methods in Table A2. The ATET estimate from this method shows households engaged in UA reduce their food expenditure by 8 percent. This suggests that the effect of UA would be overestimated without the adjustment of IPWRA method. (To check the robustness of our results, we excluded the data from Ghana (2009), Nigeria (2012) and Tanzania (2010) to make our data consistent with the time span. We ran the same model to find that the coefficients are very similar to our main results.)
The results presented here are in line with findings presented in other studies, which reported a positive association between engagement in UA and indicators related to nutrition. Unlike in this paper, most of the studies on UA only “report a simple association between variables, unadjusted for potential confounding factors, thus making it difficult to draw firm conclusions from the data presented” [51]. Even if the analysis presented here does not consider how UA affects food consumption/calorie intake, this study does indicate a positive role played by UA in terms of increasing food security via an increase in the food count/food group categories and of reducing the overall household food expenditure.
A very similar association is suggested in several studies (for a review of the results on the nexus between UA and food consumption, please refer to [49]). [50] Masashua et al., (2009) [52] shows an increase in the consumption of protein, vitamin and mineral-rich foods and food groups for urban farmers in Dar es Salaam. Likewise, a study conducted in the Philippines found an association between UA and both a decrease in carbohydrate intake and an increase of fruit and vegetables consumption [53].
The number of studies looking at the effect of UA based on indicators related to dietary diversity is rather limited, but their results suggest a positive association between the engagement in UA and the food count/food diversity scores. In another cross-country and cross-sectional study, Zezza and Tasciotti (2010) [36] found evidence that engagement in urban farming is positively correlated with an increase in the food group (food count) indicator in 10 out of 15 (11 out of 15) countries analysed in their study. The size of the change in those two dietary-related indicators varies between countries, with an average increase of 24% in the number of food groups consumed; in this study, we estimate an increase of 20%.
It’s important to highlight that results here and in other studies point out that UA’s direct contribution to food consumption and dietary diversity may be quite small, suggesting that UA is not a magic bullet in terms of food insecurity, but that it does represent a tool urban households have to increase their food resilience [54].
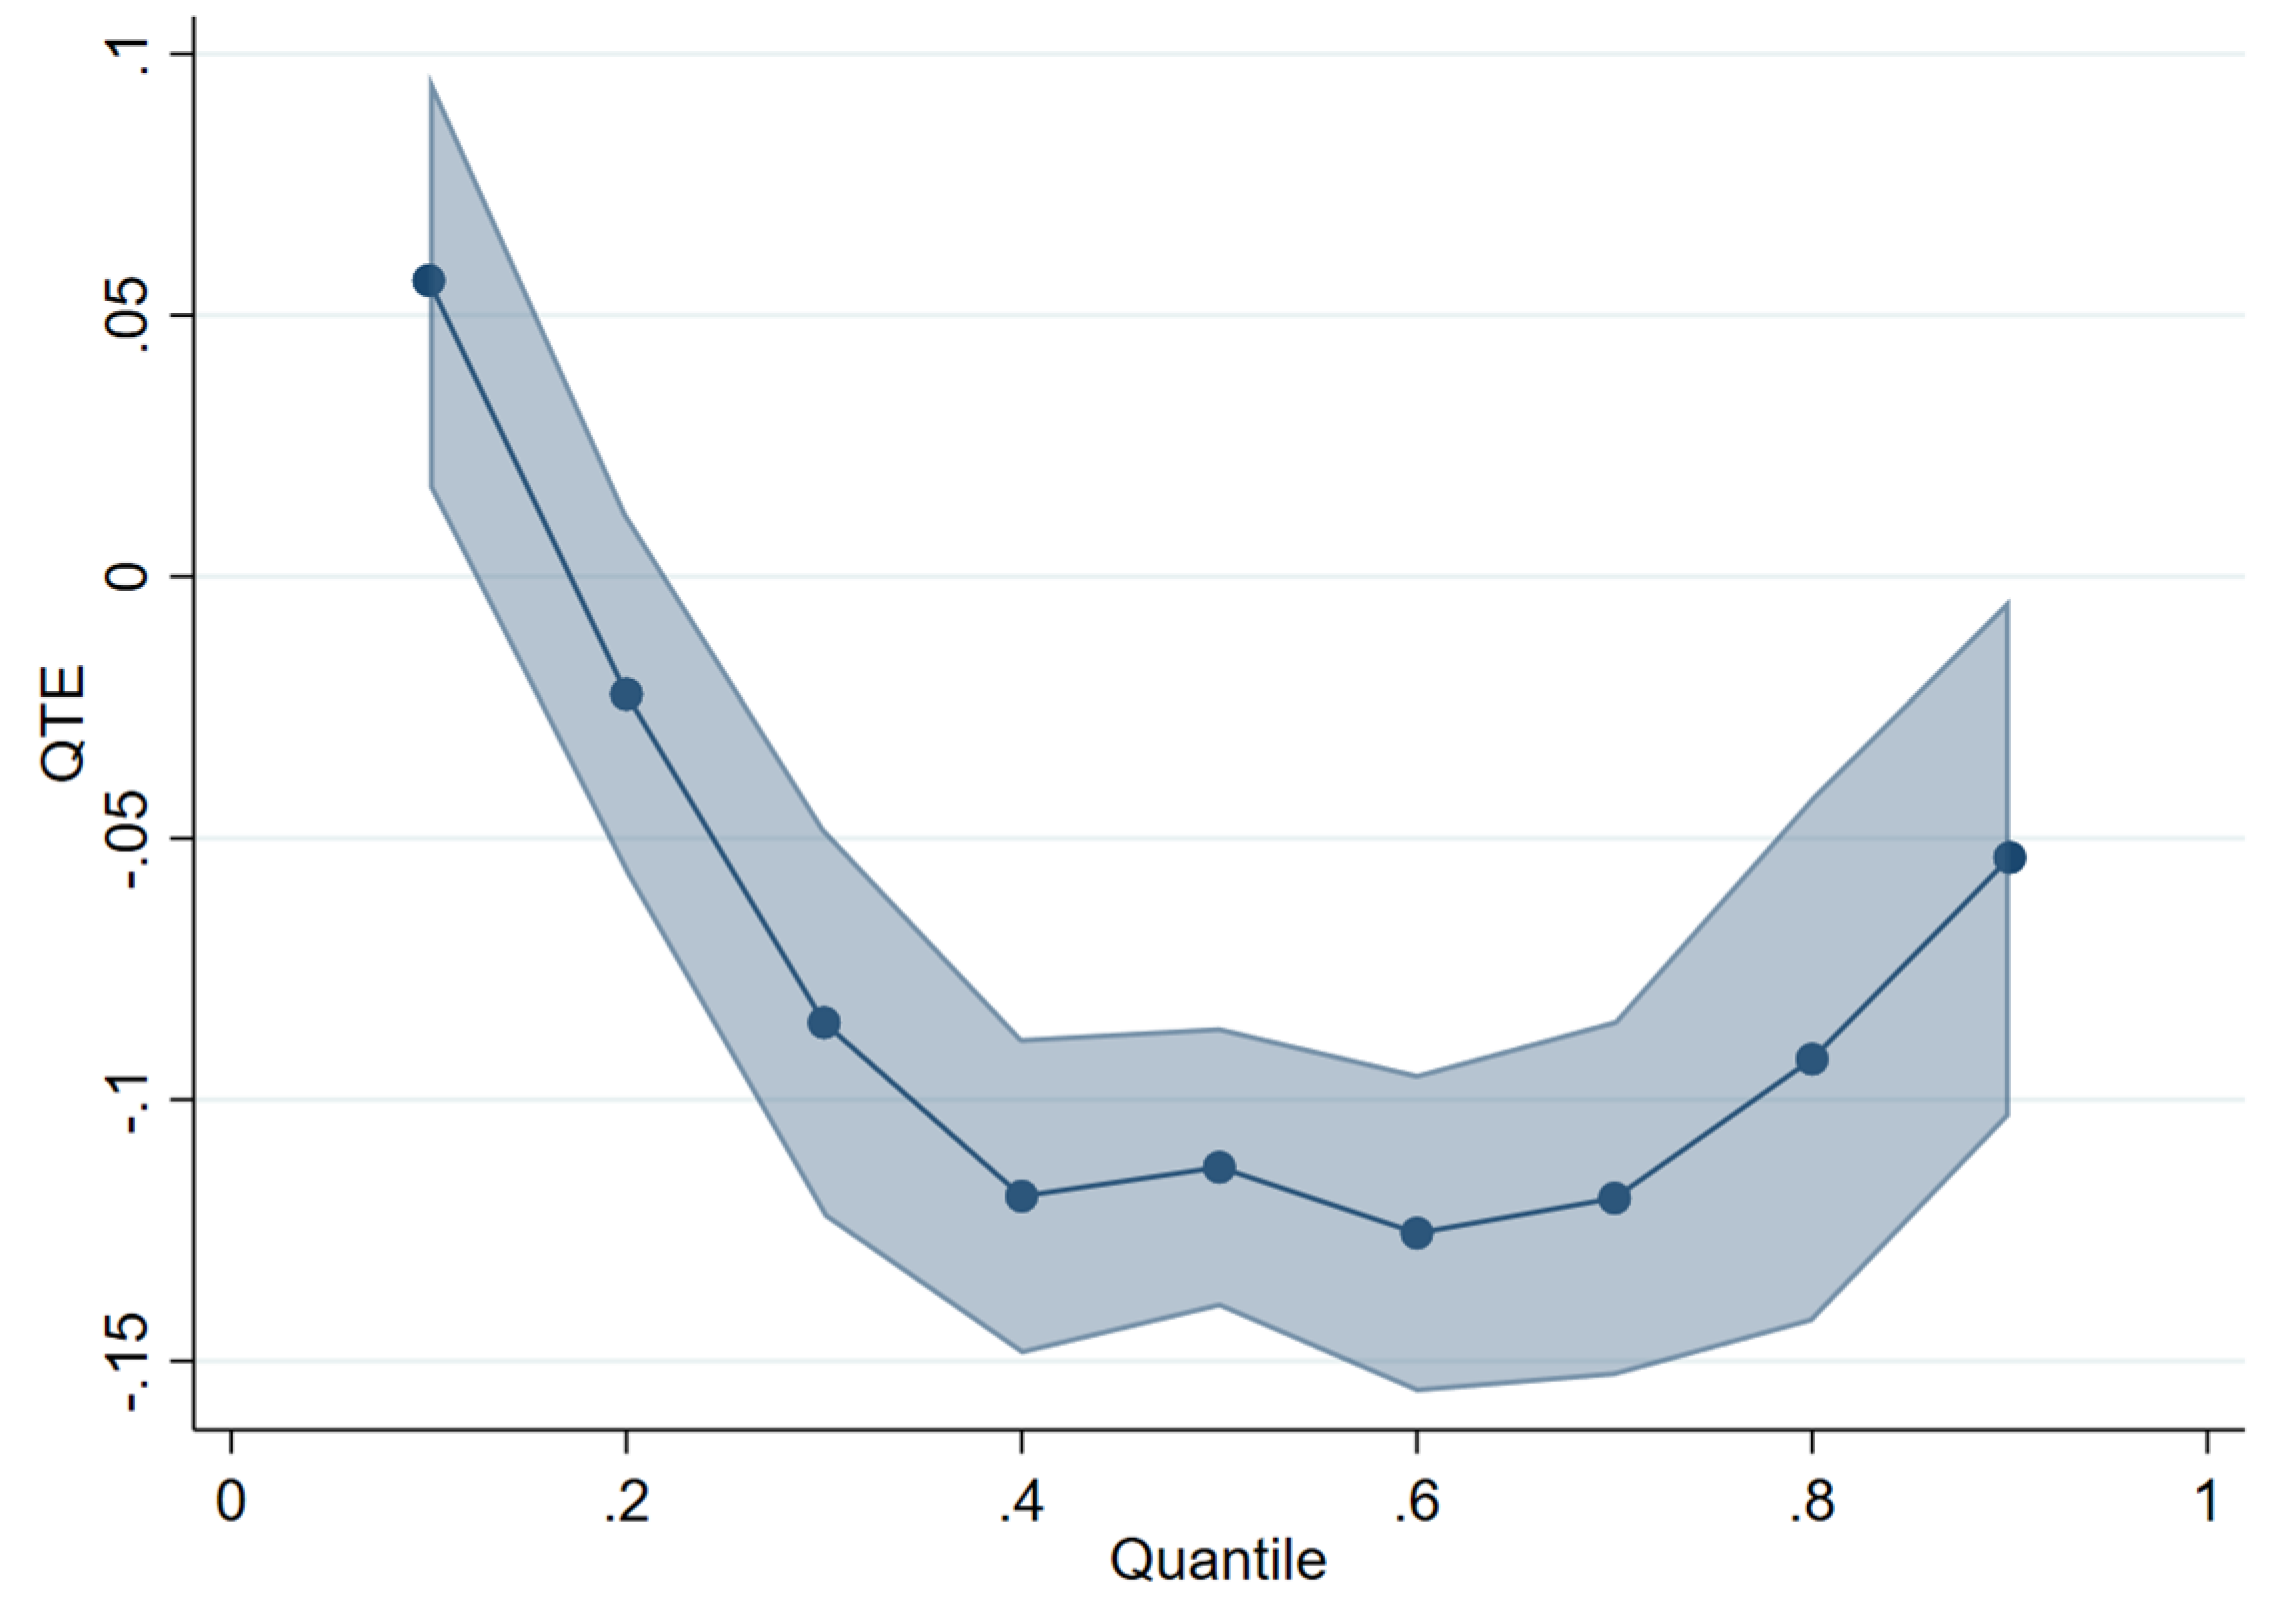
We now move to estimate quantile treatment effects of UA on food consumption expenditure of the households. We find substantial heterogeneity on the impact of UA across the food expenditure distribution (see Figure 2 and Table 6). The coefficient of UA is positive for the households in the first decile of the food expenditure distribution. After that, the coefficients become negative throughout the rest of the distribution, hinting at a reduction of the overall food expenditure via UA. The returns to UA in terms of food expenditure savings are the largest at the 60th percentile, where households engaged in UA enjoy a saving of 12.6%, declining thereafter to 5.4 percent at 90th percentile. Thus, the effects of UA are more negative (meaning they reduce the amount of food expenditure) as we move along the food expenditure distribution; this suggests that UA is more beneficial for households displaying a higher food expenditure profile. 
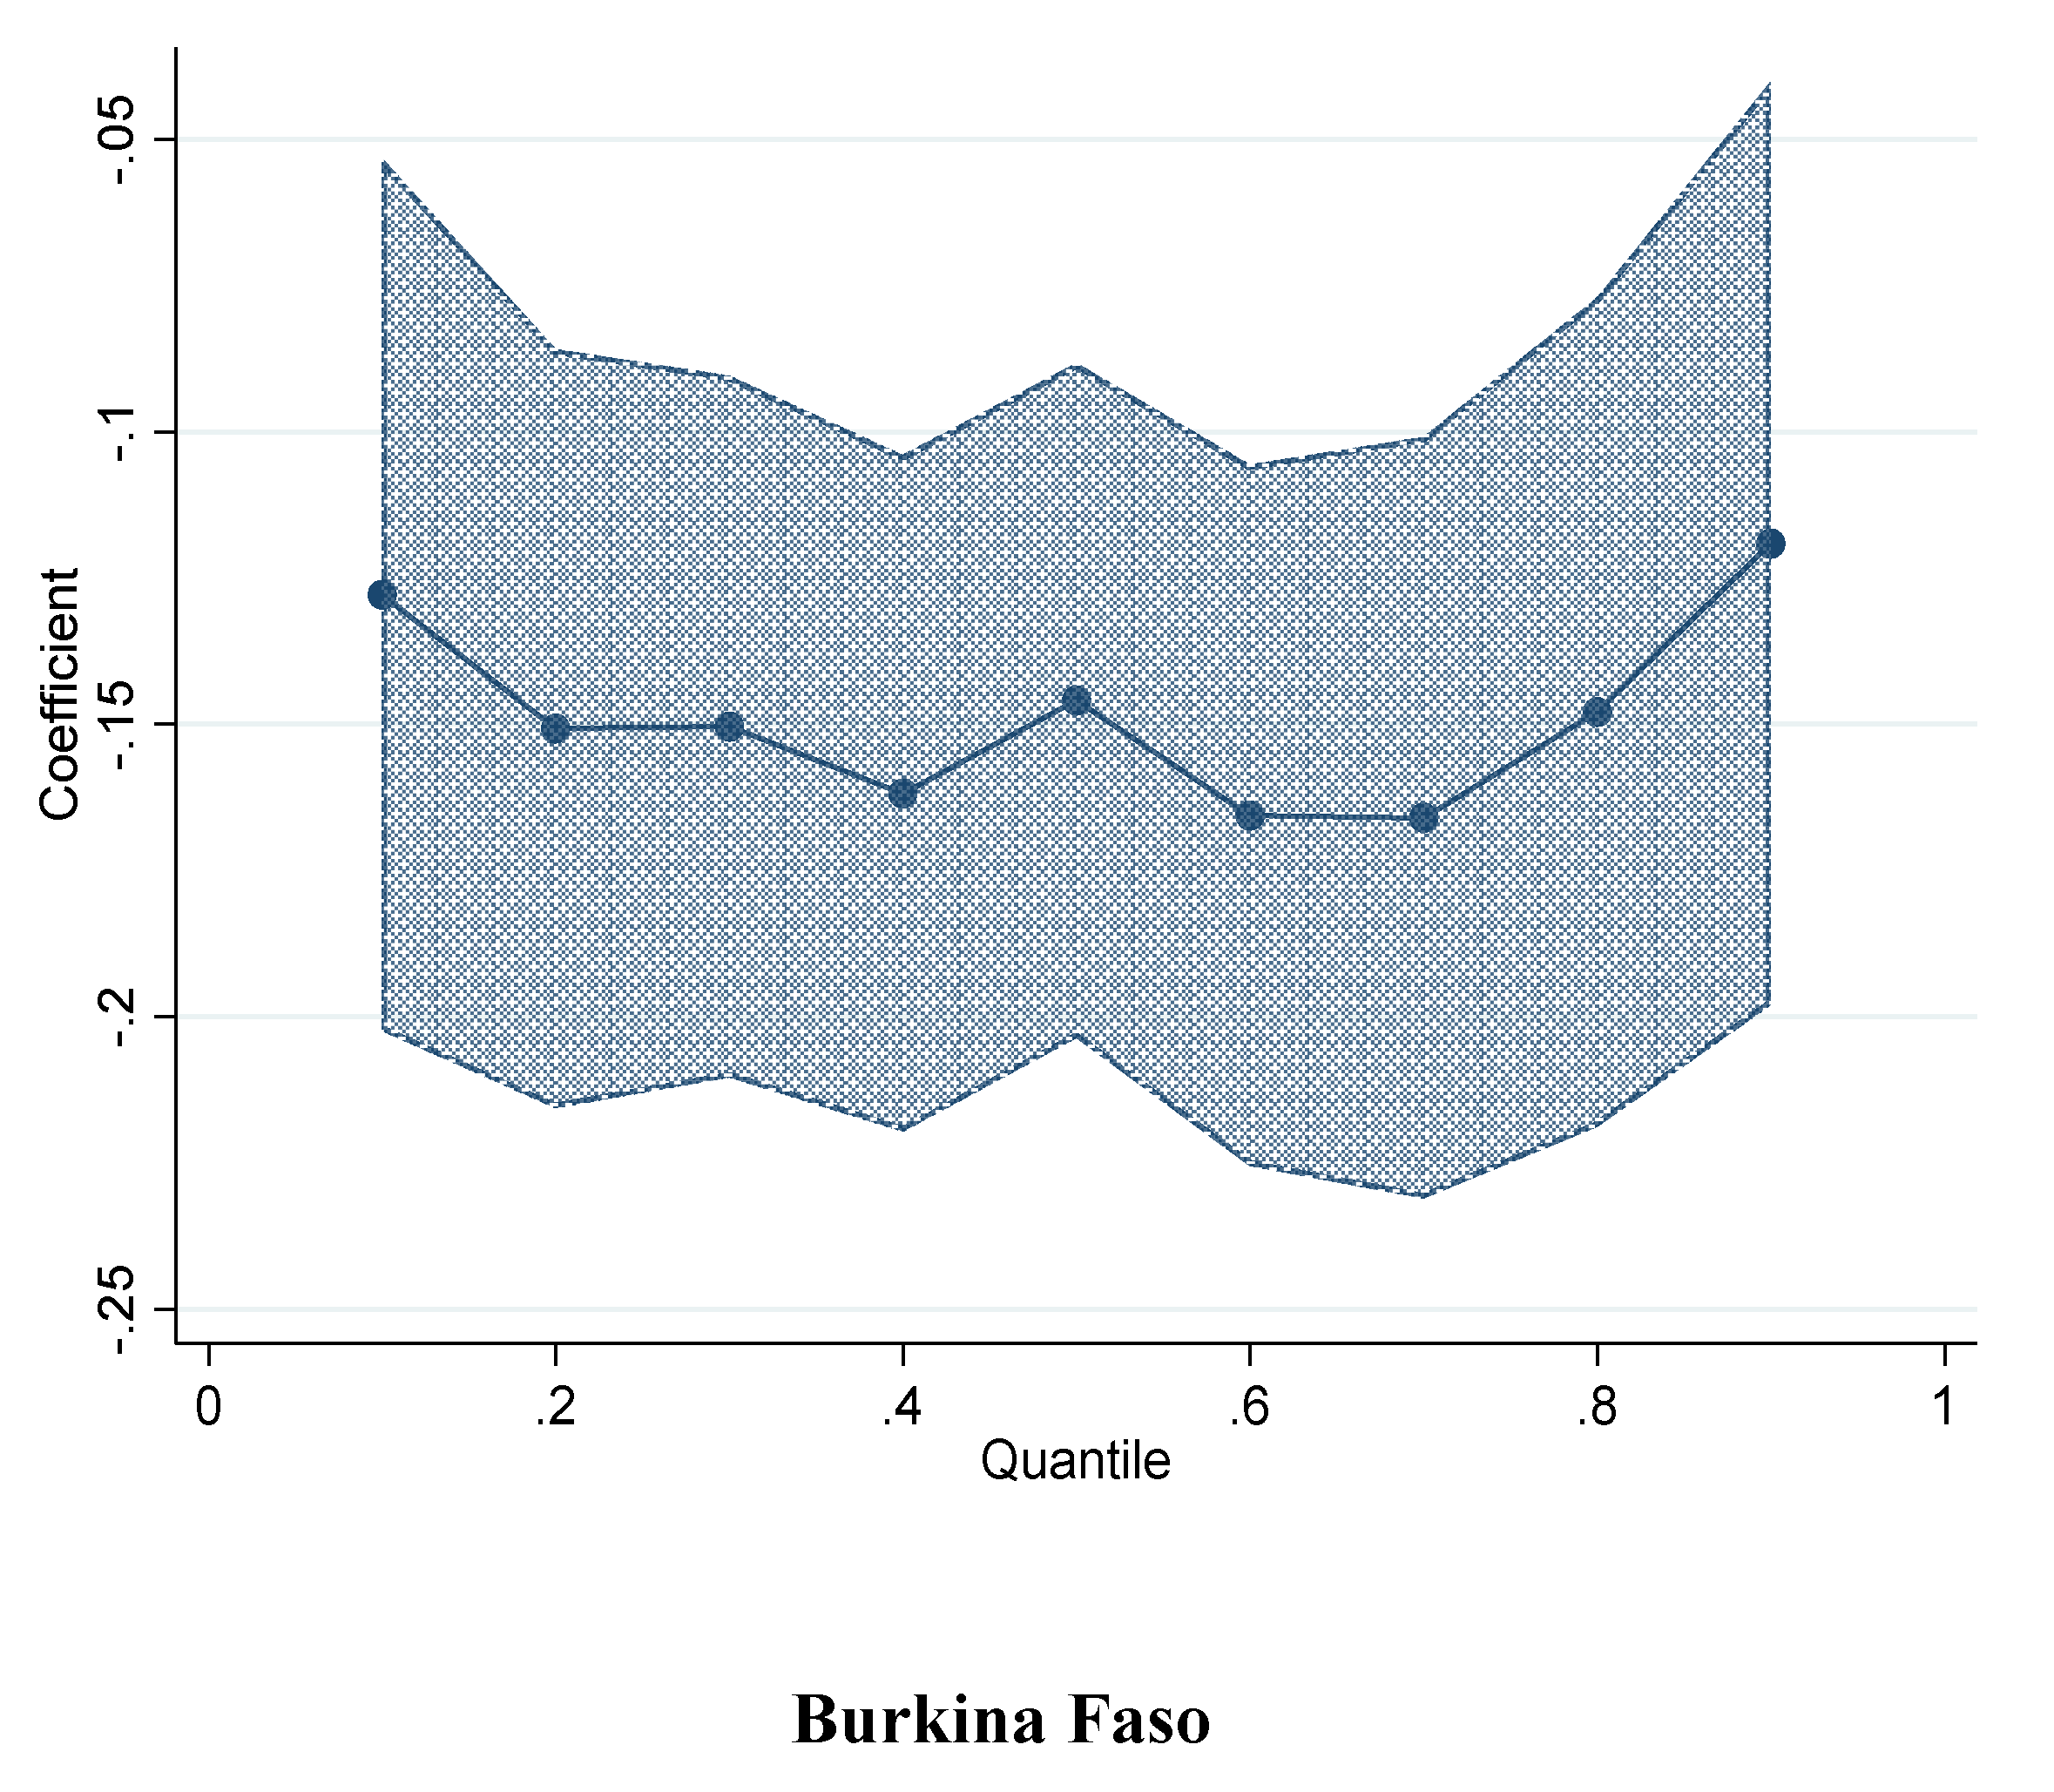
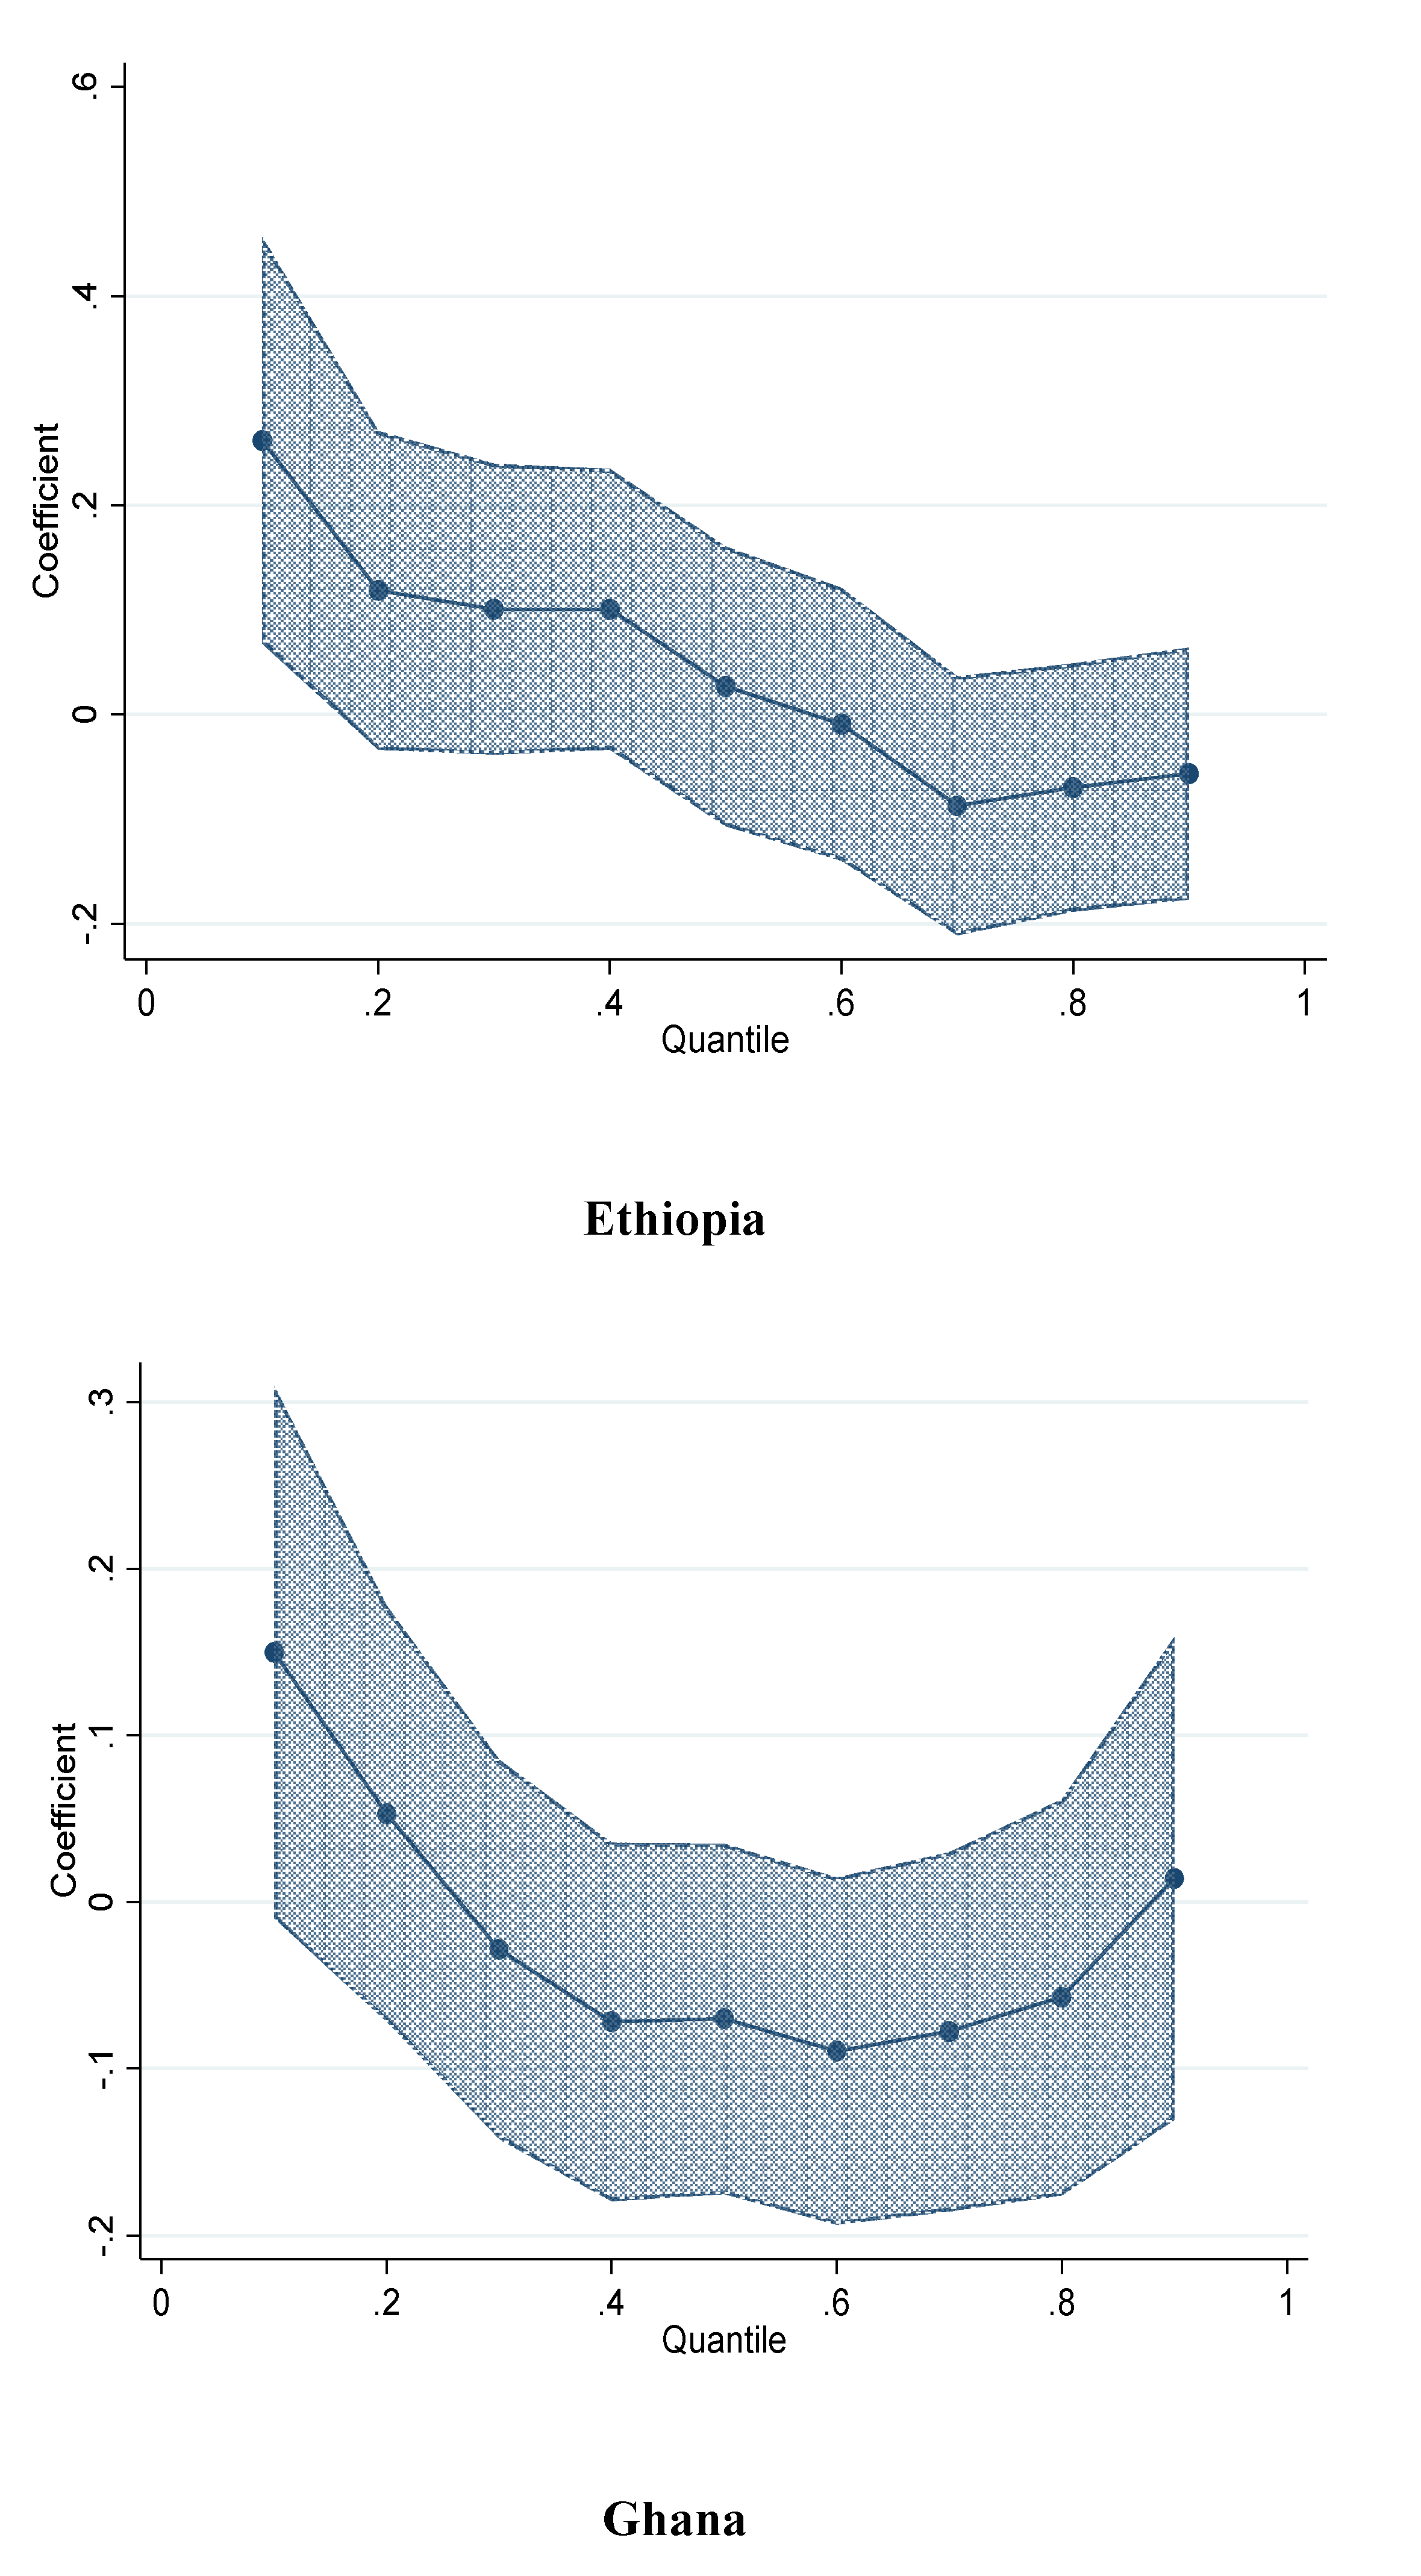
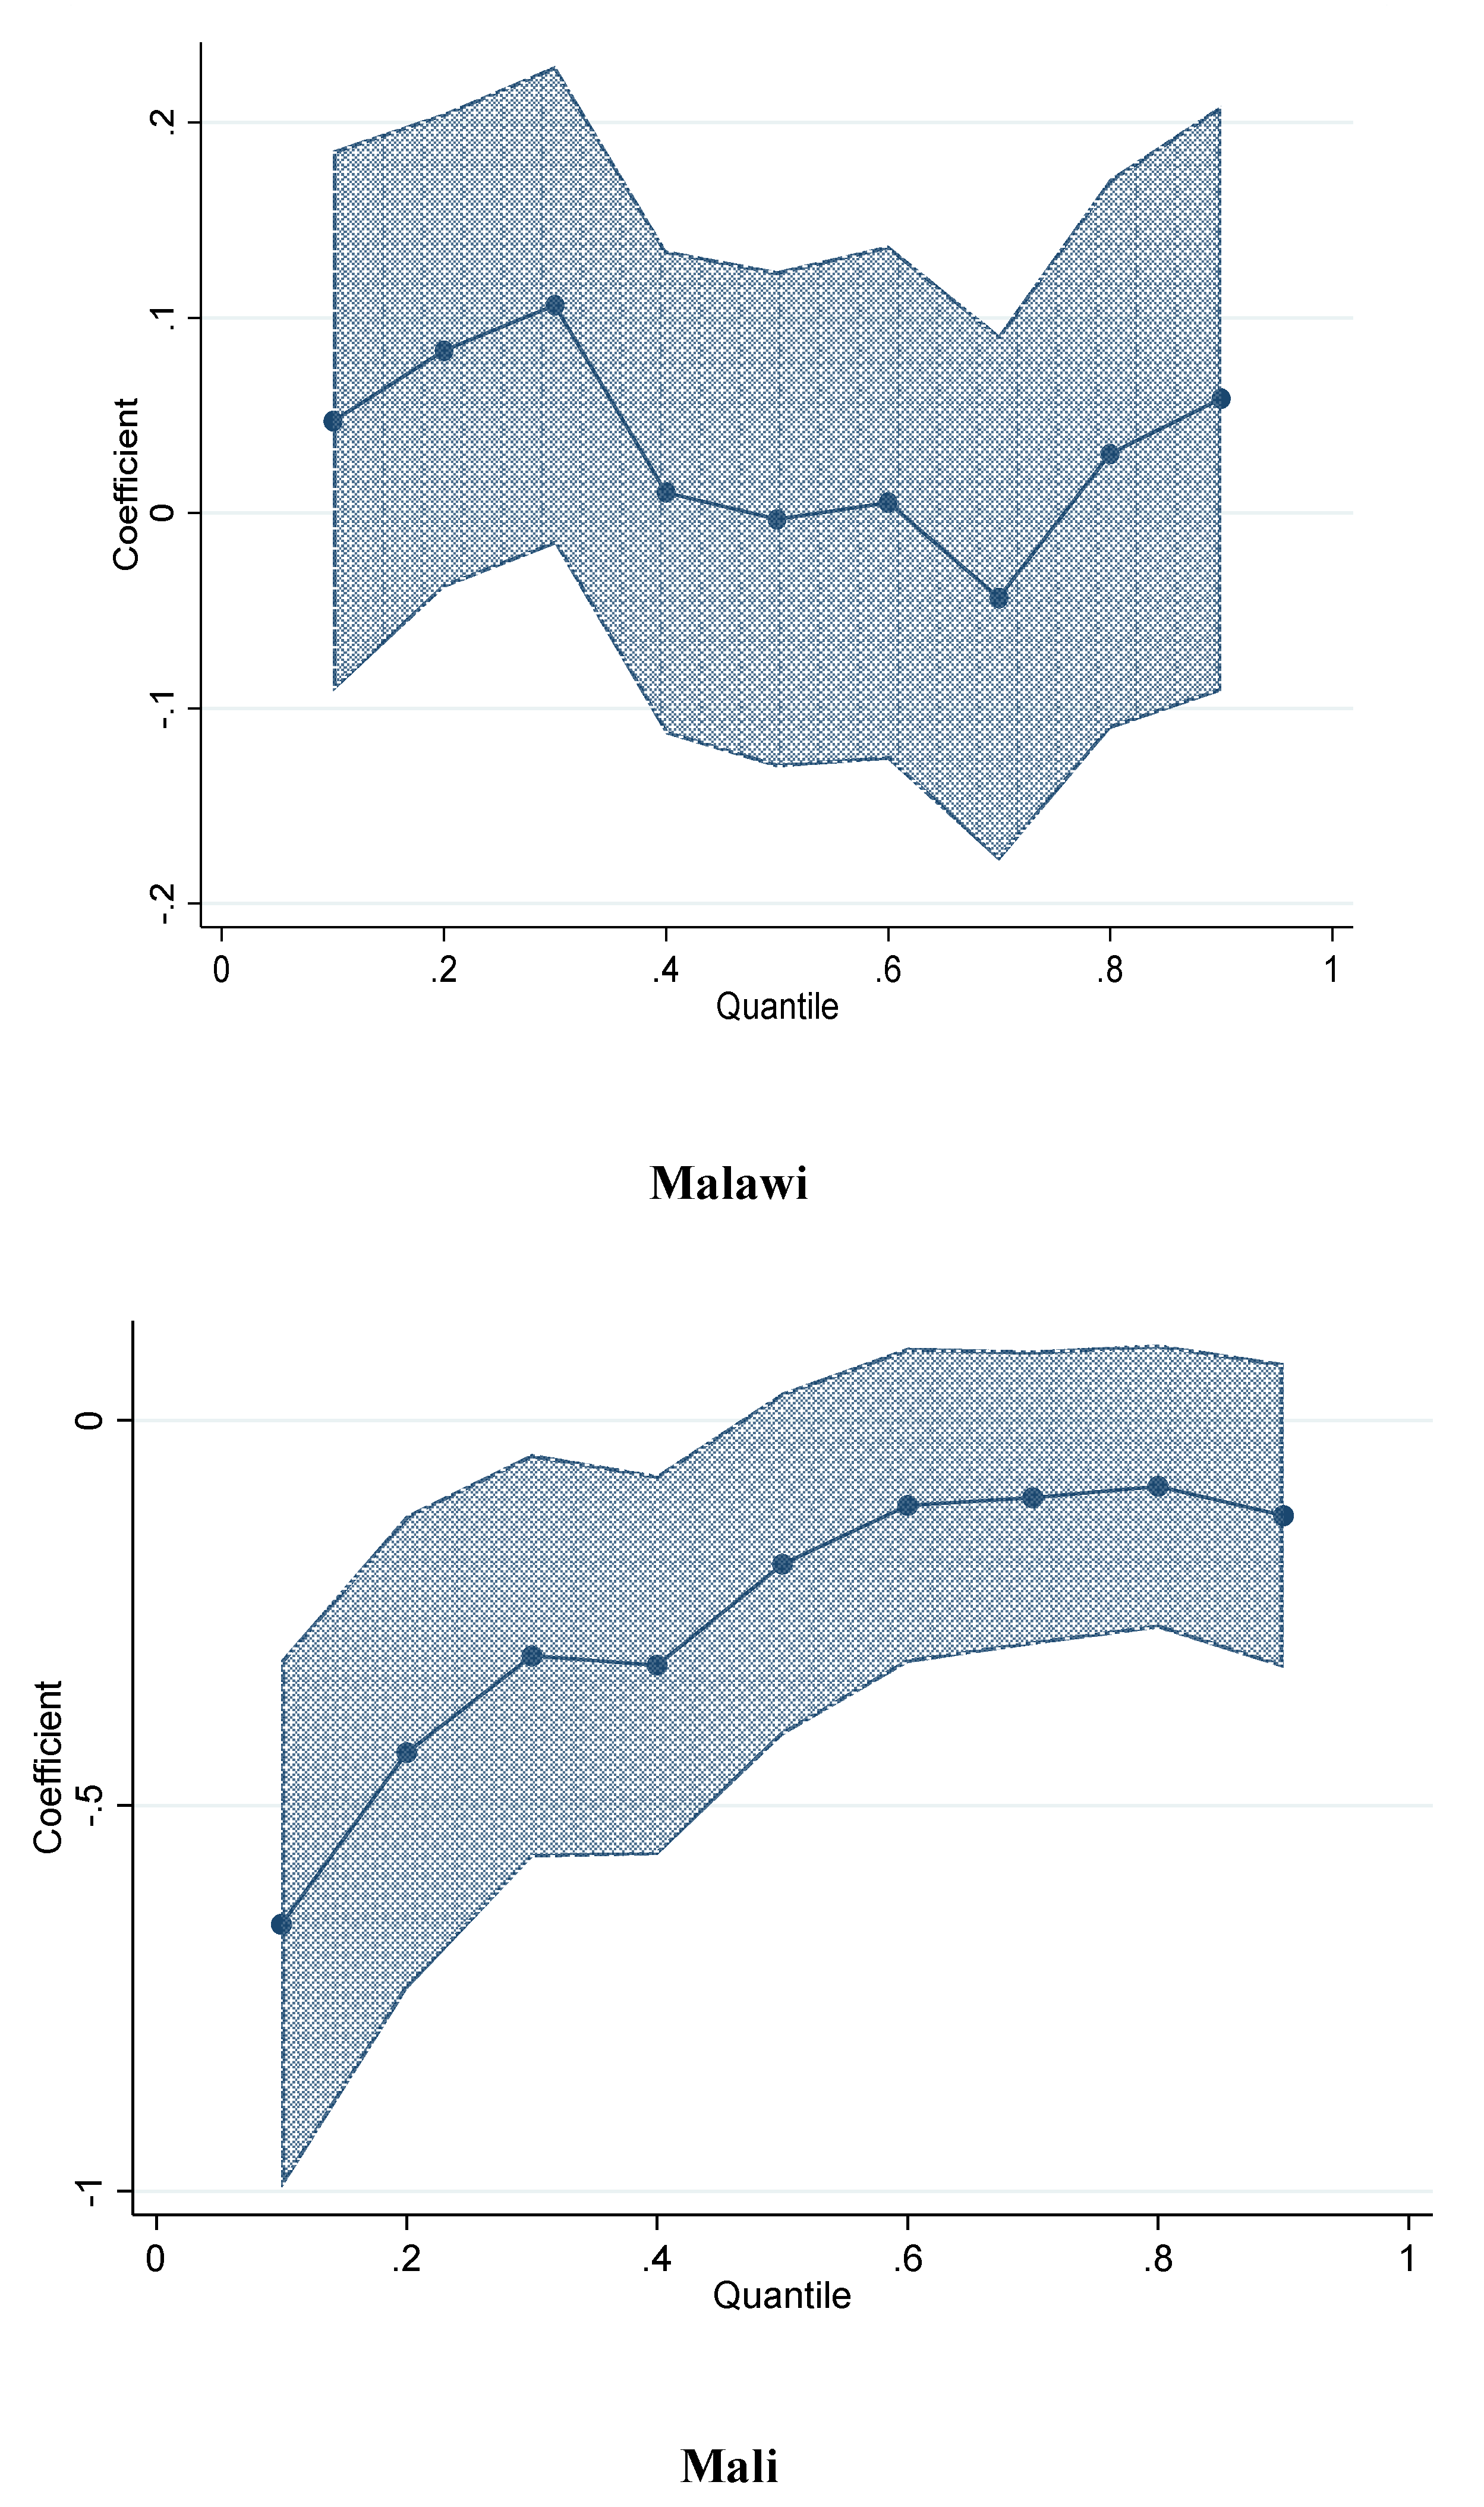
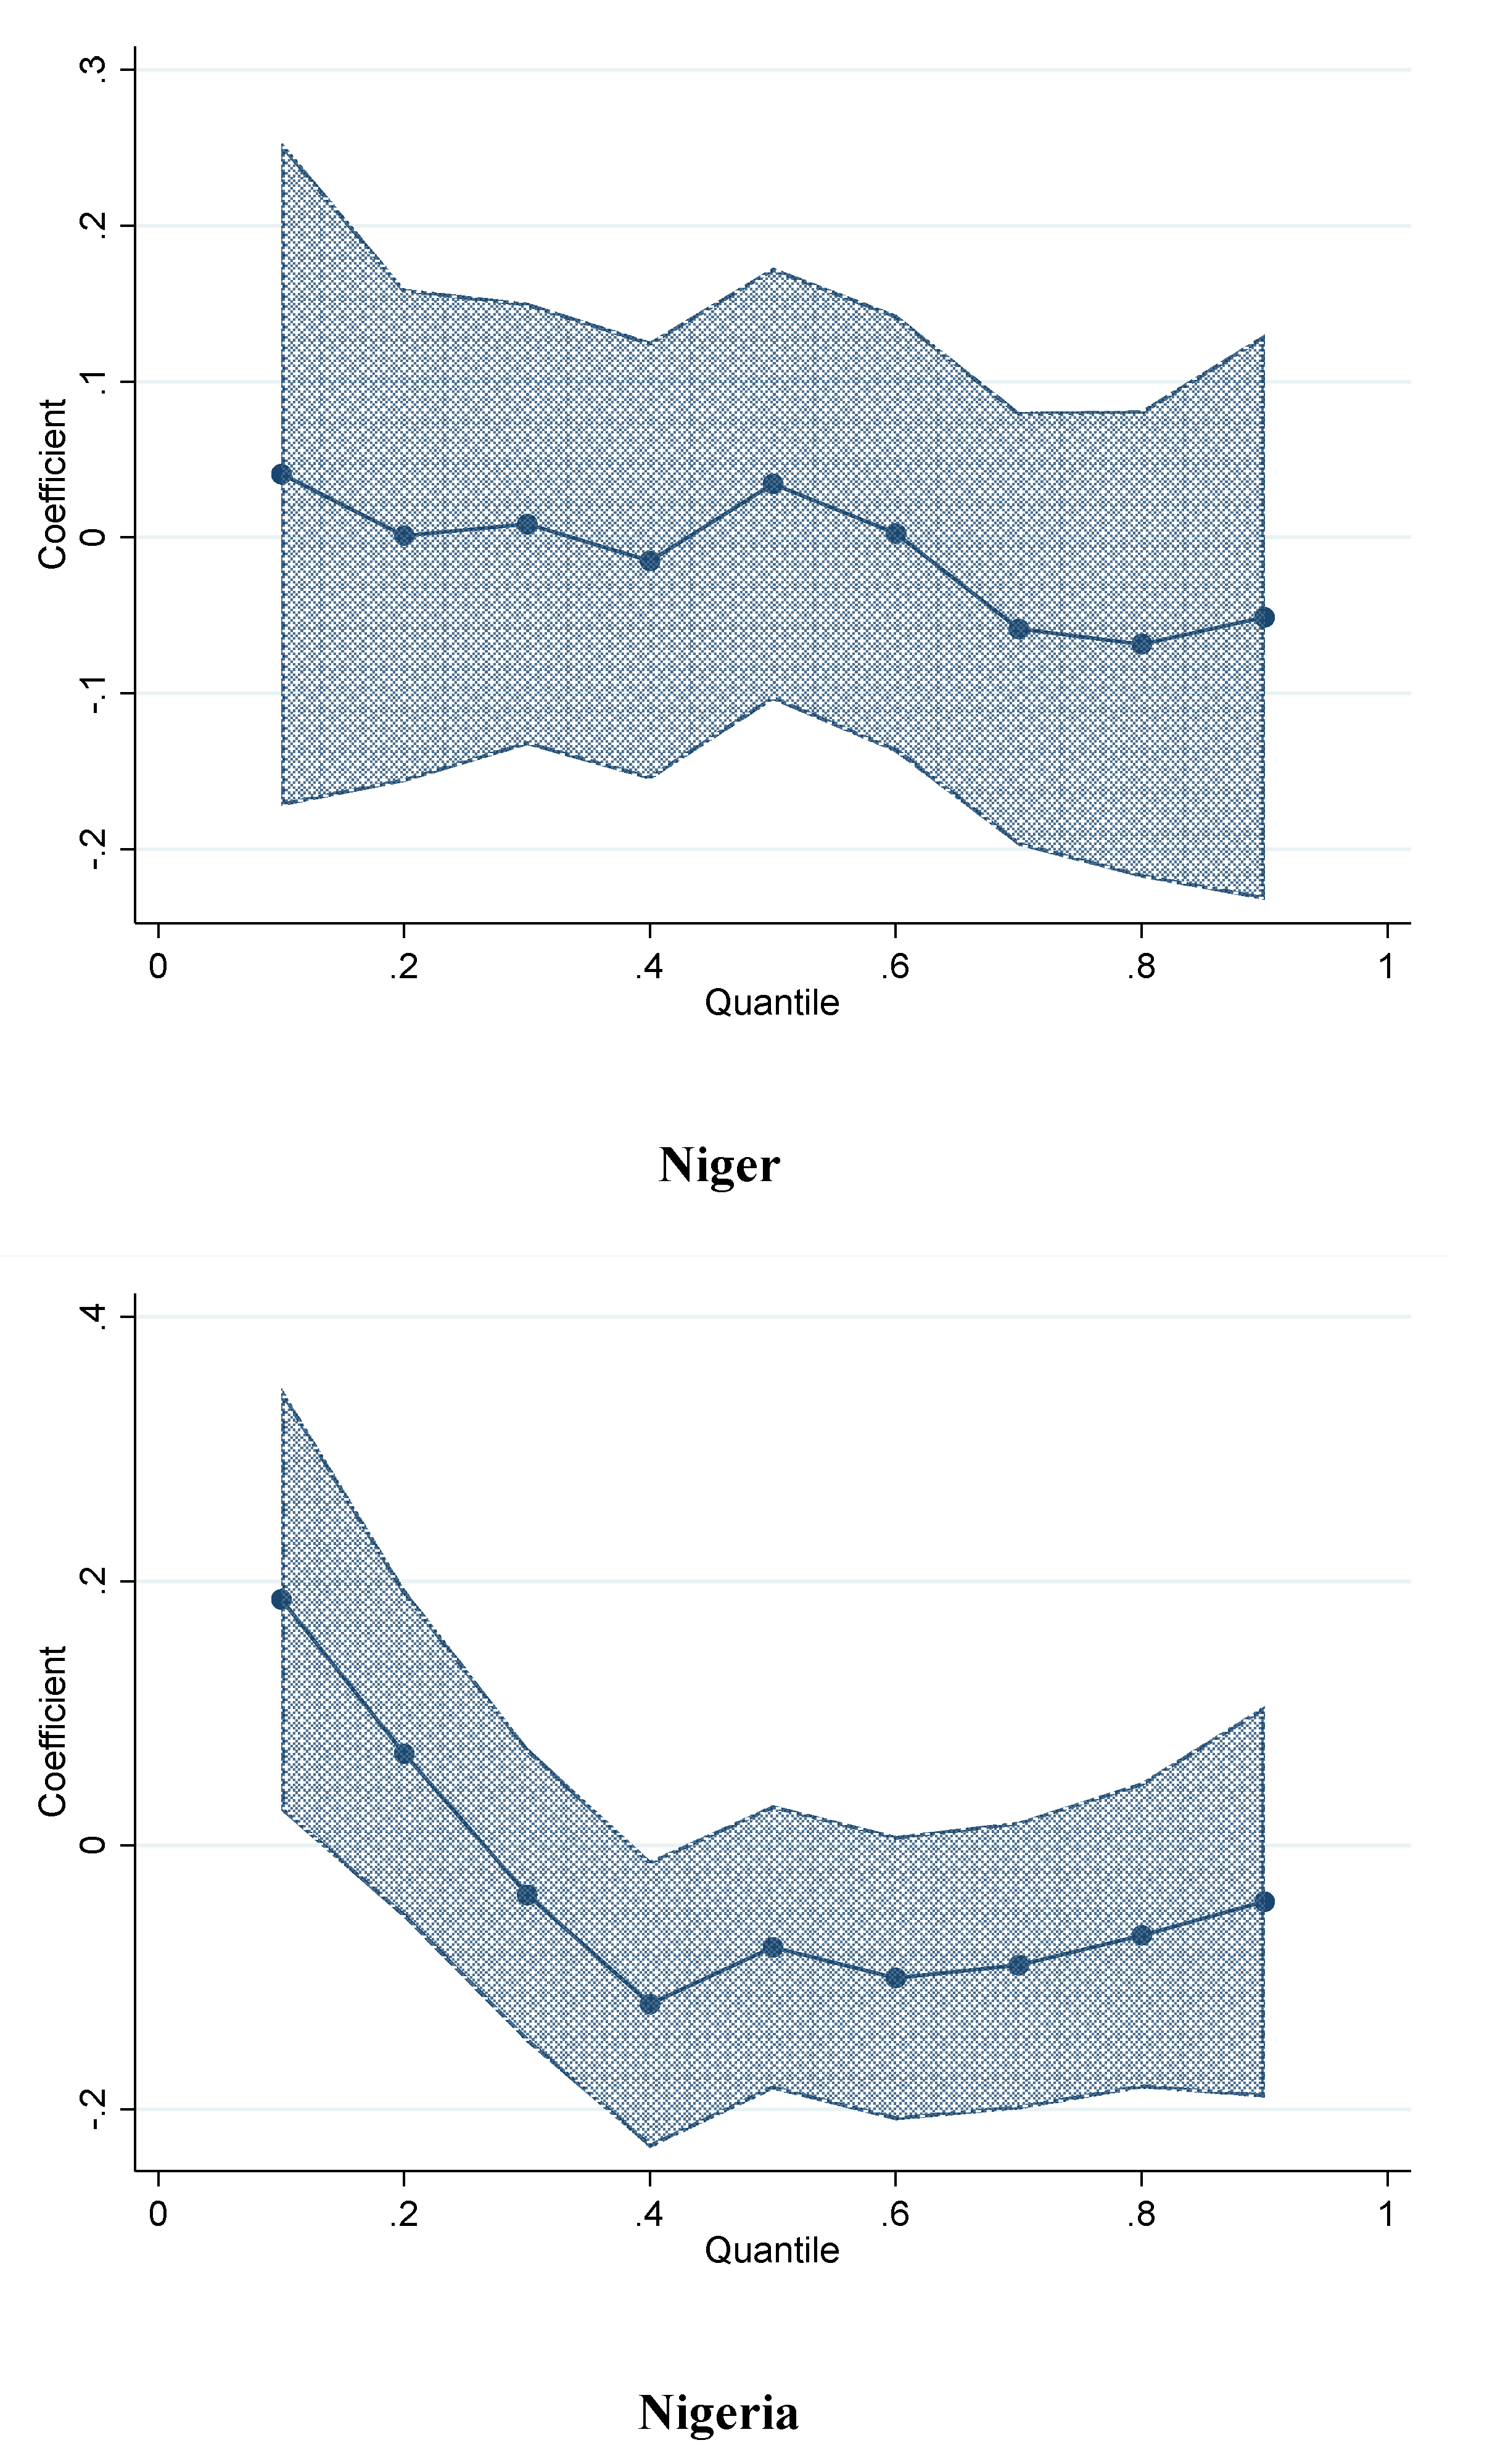
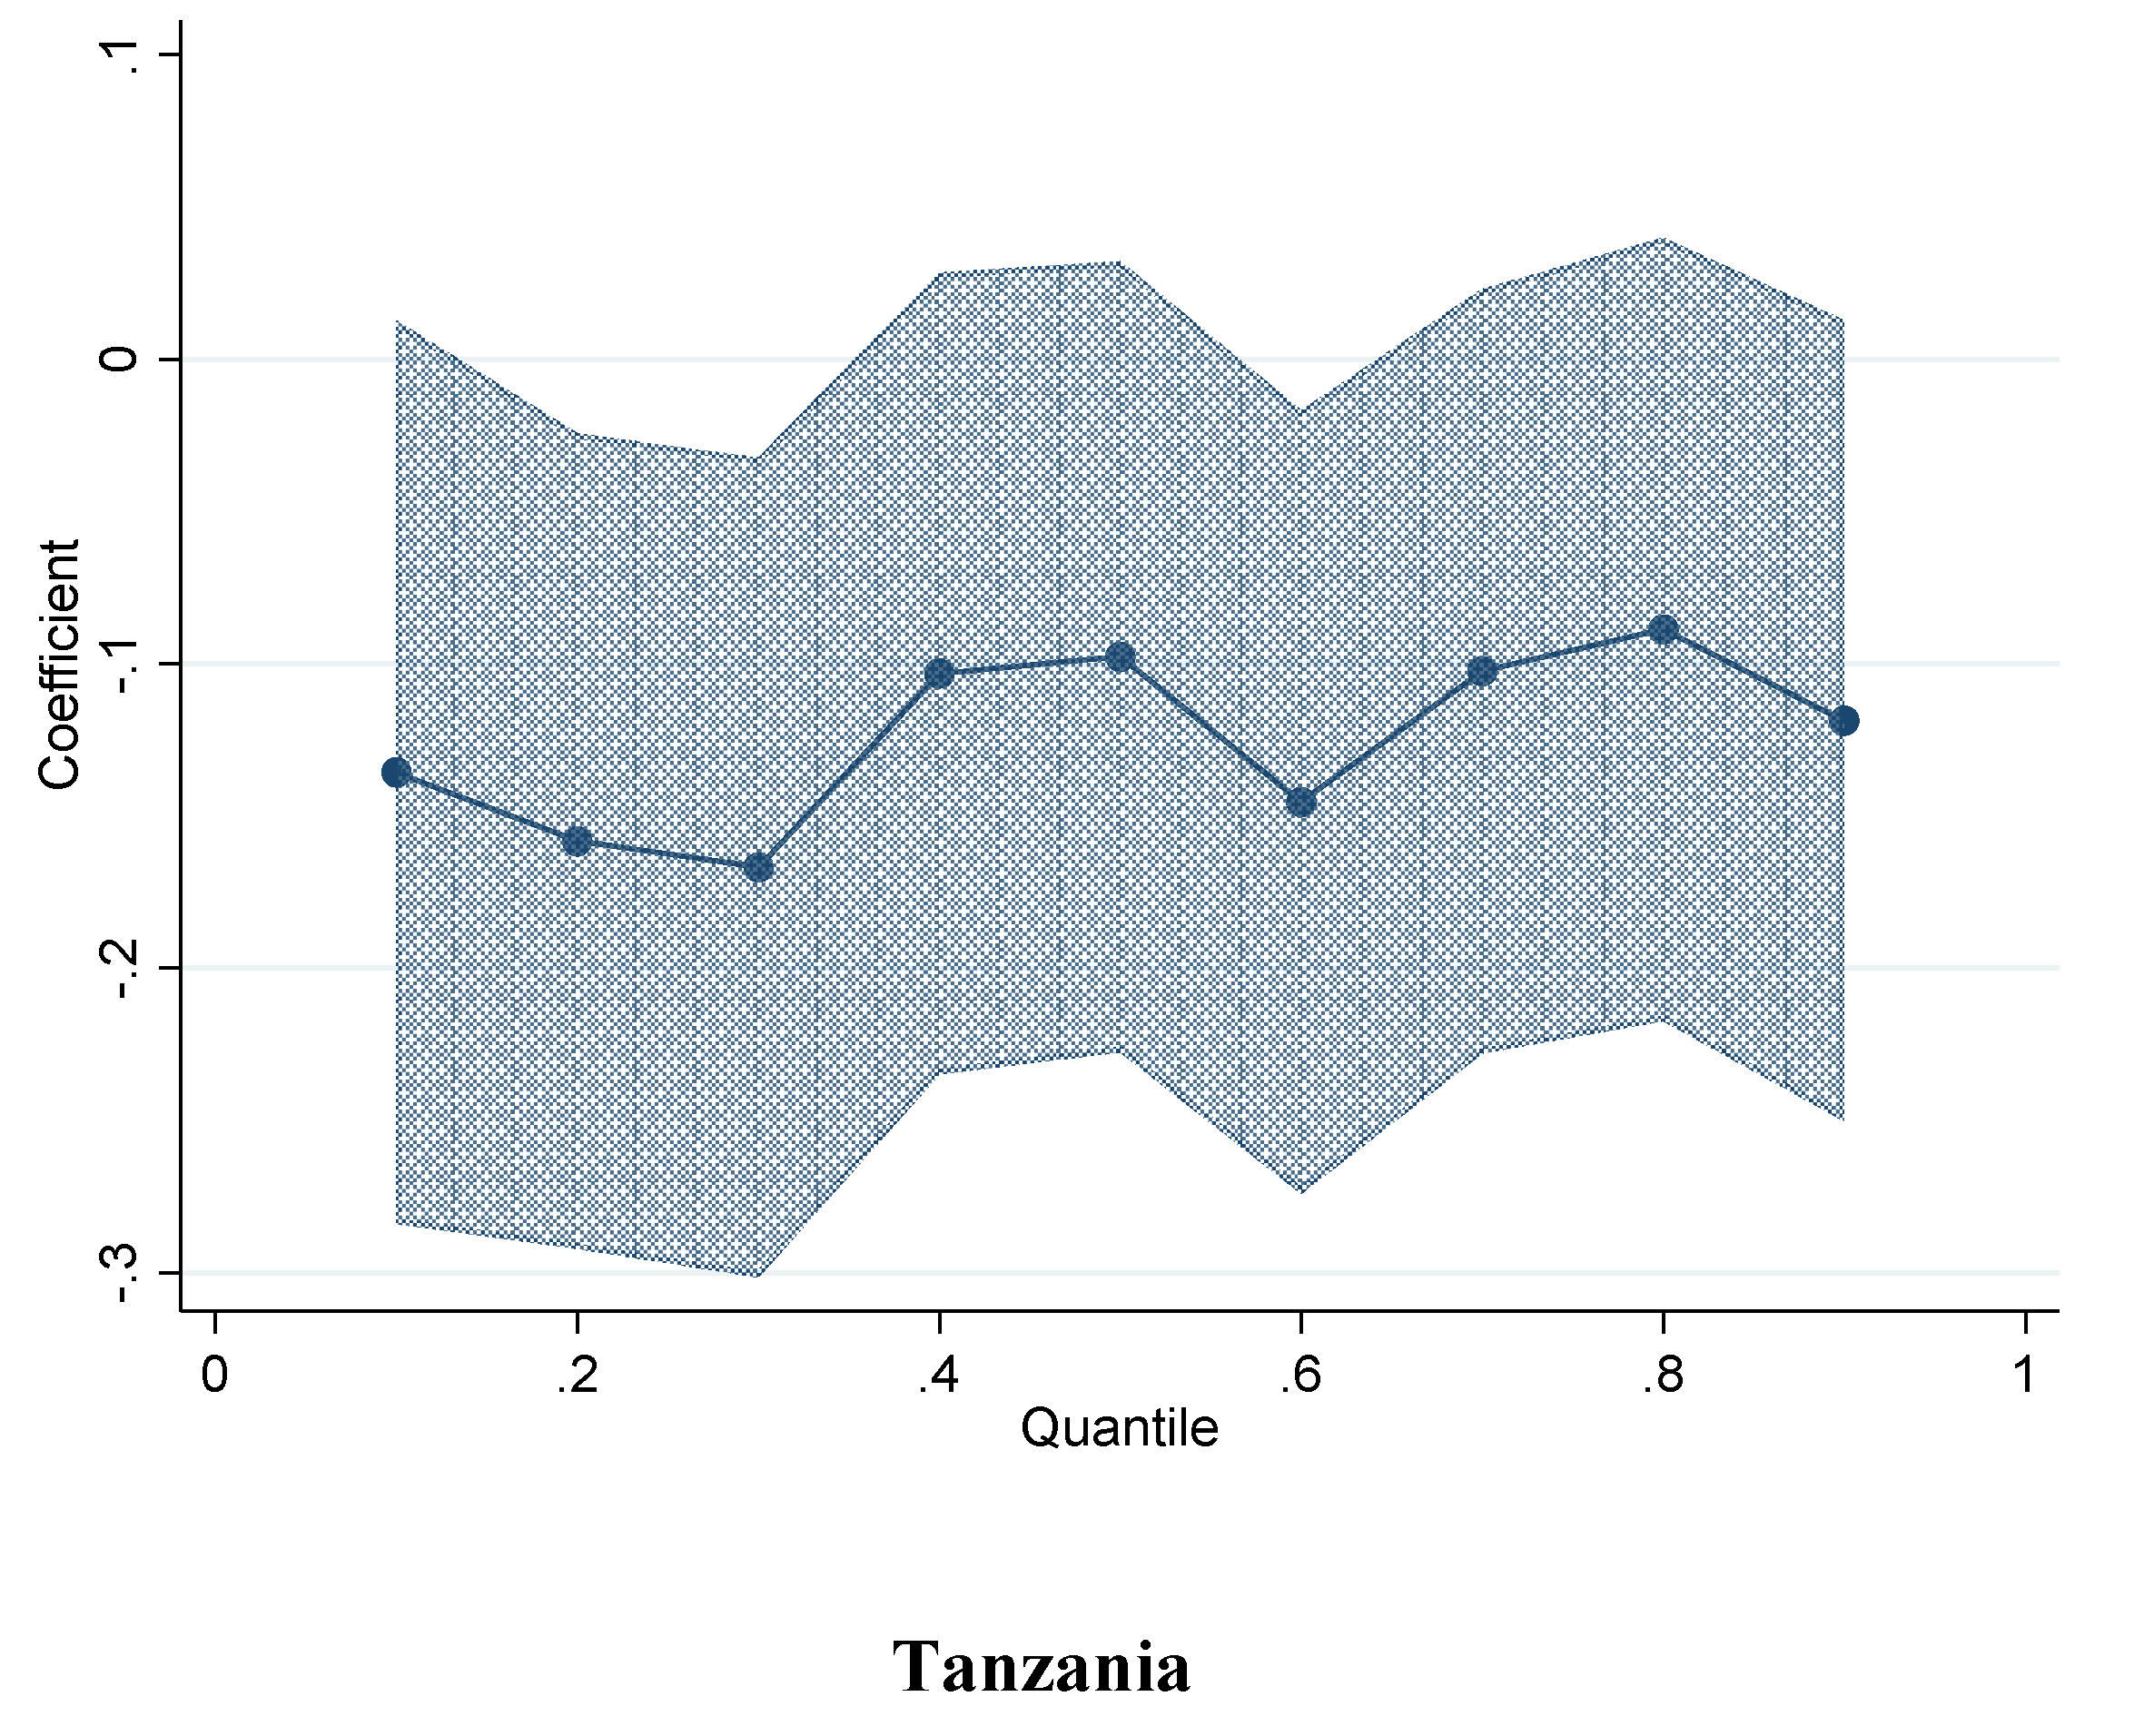
Figure 2 partially explains the contribution of UA in terms of reducing food expenditure as it is a pooled representation; when we observe the UA contribution in terms of food expenditure at the country level (Figure A1 in the Appendix), we don’t see a homogenous pattern. Ethiopia, Nigeria, Burkina Faso, Tanzania and Ghana show similar trends in the lower quantiles—the coefficients decrease as we move along the food expenditure distribution. The coefficients associated with the households in the upper quantiles increase in Ethiopia, Malawi, Nigeria, Ghana, Burkina Faso and Niger, which is similar to the pooled results. The country level results show that households engaged in UA reduced food expenditure on average by 8.7 percent in Tanzania, 9.9 percent in Burkina Faso, and 17.9 in Mali (Table A1 in the Appendix). No significant impact is found in Ethiopia, Malawi, Nigeria and Niger (See Table A1 for country level impact of UA on food expenditure, food counts and groups).
Taken together, we find an overall negative relationship between UA and household food expenditure; however, this relation presents a significant level of heterogeneity with higher and negative impacts mostly for the middle and top end of the distribution.

6. Conclusions

The UA phenomenon has received significant attention in the literature over the past 15 years; multiple studies present evidence that highlights the importance of UA in terms of dietary diversity scores, food consumption and caloric intake. The contribution of UA in terms of food resilience is particularly important in times of food crises, such as the surge in the price of staple foods during the COVID-19 pandemic and ongoing war between Russia and Ukraine, both of which affected the food supply chain and made the provision of food in urban areas more challenging.
This paper sets out to answer three questions; the first investigates the typology of households engaged in UA; the second looks at the role played by UA in diversifying household’s diet and in reducing household food expenditure; the third examines the heterogeneity in the impact of UA across the food expenditure distribution. Although the analysis carried out here highlights that UA does contribute to increasing food diversity—both in terms of food count and food categories—and to reducing food expenditures, it is important to acknowledge that its impacts are very modest on average. The analysis here presented uses household level data representative at the urban level for nine sub-Saharan countries—Burkina Faso (2014), Ethiopia (2013), Ghana (2009), Malawi (2013), Niger 2014, Nigeria (2012), Tanzania (2010) and Uganda (2013).
The results show that the profile of those engaging in UA activities does not show much regularity; unlike what anecdotal literature suggests, female heads of the households do not necessarily engage in UA; on the contrary, male headed households and households which are bigger in size tend to practice UA more often.
UA is associated with improved performance of two indicators of dietary diversity: food groups and food counts. After controlling for the wealth status and for a set of household characteristics, the results of the IPWRA estimation indicate that practicing UA is associated with a decrease in food expenditures of 3%.
It is important to stress that the econometric results, albeit statistically robust to models’ specification, indicate a moderate impact of UA on several indicators of dietary diversity. This should be considered when assessing the overall contribution of UA in terms of food security in urban areas. On one hand, this paper represents a contribution to the relatively large and positive literature on the effect of UA on food diversity and composition; on the other, it emphasises that country ad-hoc case studies are needed to better measure the magnitude of those dietary changes and to explore the existence of causal links to UA diets. To our knowledge, and apart from a few countries and across countries studies, most of the research on UA has been limited to single cities, which fail to provide a nationally representative picture of the contribution of UA. At the same time, we would like to see more support from local governments in terms of investing in and training of UA farmers, but we recognise that food produced using UA is not sufficient to feed the urban population.

Author Contributions

Conceptualization, N.S. and L.T.; methodology, N.S. and L.T.; formal analysis, N.S. and L.T.; writing—original draft preparation, N.S. and L.T. All authors have read and agreed to the published version of the manuscript.

Funding

This research received no external funding.

Institutional Review Board Statement

Not applicable.

Data Availability Statement

Data come from Living Standard Measuring Studies and ara available at https://www.worldbank.org/en/programs/lsms.

Acknowledgments

The authors would like to thank Natascha Wagner and Johannes Brehm for their contribution to the data gathering. The authors would like to thank the Institute of Political Economy, Governance, Finance and Accountability (PEGFA) for its support.

Conflicts of Interest

The authors declare no conflict of interest.

Appendix A

Table A1. Impact of urban agriculture using IPWRA estimates, country level.
AggregateBurkina FasoEthiopiaGhanaMalawiMaliNigerNigeriaTanzaniaUganda
Food Expenditure−0.099 ***0.0380.105 **0.030−0.179 **0.0040.006−0.087 **N/A
(0.021)(0.044)(0.054)(0.033)(0.076)(0.041)(0.037)(0.035)
Food Group0.305 ***0.195 *0.496 ***0.023−0.1830.462 ***−0.1170.214 *−0.288 *
(0.055)(0.110)(0.141)(0.083)(0.171)(0.175)(0.146)(0.128)(0.161)
Food Count0.320 *0.677 ***2.304 ***1.047 **−0.7501.3520.3200.225−1.063 **
(0.180)(0.224)(0.547)(0.493)(0.649)(0.833)(0.396)(0.333)(0.524)
Cereals−0.0460.264 ***−0.0090.1560.326 **0.515 **0.180*−0.321 ***−0.270 **
(0.050)(0.074)(0.101)(0.107)(0.153)(0.202)(0.101)(0.083)(0.105)
Starch & Tubers0.074 **0.109 ***0.380 ***0.0190.0730.194 *0.307 ***0.087−0.025
(0.037)(0.032)(0.089)(0.071)(0.130)(0.108)(0.088)(0.091)(0.105)
Nuts & Legumes0.0870.282 ***0.0870.323 ***0.0620.258 **−0.056−0.128 ***0.117
(0.070)(0.076)(0.070)(0.099)(0.090)(0.116)(0.046)(0.046)(0.078)
Vegetables−0.285 ***N/A0.244 **0.250 **−0.875 ***−0.2400.0980.074 **−0.206
(0.054)N/A(0.110)(0.105)(0.208)(0.191)(0.094)(0.032)(0.149)
FruitsN/A−0.2400.183 **0.084N/A0.111−0.0030.096−0.188
(0.191)(0.090)(0.087) (0.183)(0.065)(0.077)(0.129)
Milk Prod0.0190.093 **0.056−0.0610.0840.080−0.0470.084 **−0.018 *
(0.019)(0.038)(0.039)(0.089)(0.094)(0.095)(0.038)(0.040)(0.010)
Oil & Fats−0.109 ***−0.0230.076−0.064**−0.165 **−0.0870.0370.009−0.064 **
(0.030)(0.021)(0.048)(0.032)(0.083)(0.059)(0.039)(0.012)(0.032)
Meat & Poultry0.190 ***0.077 *−0.0380.0630.0810.056−0.176 **0.151 ***0.057
(0.031)(0.041)(0.069)(0.069)(0.076)(0.069)(0.070)(0.045)(0.061)
Fish−0.075 ***−0.0070.002N/A−0.0260.0320.097 **0.012−0.048
(0.021)(0.009)(0.024) (0.071)(0.070)(0.048)(0.029)(0.050)
Sugar & Syrup0.007−0.008−0.0300.0290.051−0.005−0.007−0.028N/A
(0.005)(0.020)(0.034)(0.048)(0.045)(0.047)(0.014)(0.031)
Beverages0.077*N/A0.0500.1380.0440.130−0.0300.035−0.116
(0.040) (0.050)(0.096)(0.093)(0.135)(0.115)(0.039)(0.073)
Miscellaneous0.114 ***0.1300.047−0.021−0.177−0.197N/A−0.081 ***−0.004
(0.029)(0.135)(0.062)(0.040)(0.107)(0.166) (0.024)(0.007)
Source: Authors’ calculation from LSMS data. Note: Robust standard errors in parentheses. *** p < 0.01, ** p < 0.05, * p < 0.1.
Table A2. Propensity score matching estimates.
(1)(2)(3)(4)(5)
VariablesFood expenditureFood groupFood CountCerealsStarch & tubers
Urban Agriculture−0.079 ***0.0610.335 *−0.089 **0.083 *
(0.023)(0.053)(0.184)(0.042)(0.043)
Observations13,88015,06315,06314,4719135
(6)(7)(8)(9)(10)
VariablesNuts & legumesVegetablesFruitsMilk productsOil & fats
Urban Agriculture0.055−0.115 **−0.0190.036−0.034 *
(0.034)(0.049)(0.049)(0.024)(0.018)
Observations10,06114,1127373662913,834
(11)(12)(13)(14)(15)
VariablesMeat & PoultryFishSugar & SyrupBeveragesMiscellaneous
Urban Agriculture0.093 ***−0.026−0.0180.0410.099 ***
(0.023)(0.018)(0.013)(0.029)(0.033)
Observations918310,92211,96510,89511,846
Source: Authors’ calculation from LSMS data. Note: Robust standard errors in parentheses. *** p < 0.01, ** p < 0.05, * p < 0.1.
Figure A1. Quantile treatment effect of urban agriculture, country level.
Agriculture 13 00284 g0a1aAgriculture 13 00284 g0a1bAgriculture 13 00284 g0a1cAgriculture 13 00284 g0a1dAgriculture 13 00284 g0a1e

References

  1. United Nations. World Urbanization Prospects: The 2011 Revision; CD-ROM Edition; United Nations Population Division, Department of Economic and Social Affairs: New York, NY, USA, 2012. [Google Scholar]
  2. UNDESA. World Urbanization Prospects 2014; United Nations Department of Economic and Social Affairs, Population Division: New York, NY, USA, 2014. [Google Scholar]
  3. Chari, F.; Ngcamu, B.S. Climate change and its impact on urban agriculture in Sub-Saharan Africa: A literature review. Environ. Socio-Econ. Stud. 2022, 10, 22–32. [Google Scholar] [CrossRef]
  4. Fåhraeus, C. Gender dimensions of urban and peri-urban agriculture in sub-Saharan Africa. Urban Peri-Urban Agric. Food Secur. Low-Income Ctries. 2014, 1–17. [Google Scholar]
  5. Thys, E.; Oueadraogo, M.; Speybroeck, N.; Geerts, S. Socio-economic determinants of urban household livestock keeping in semi-arid Western Africa. J. Arid. Environ. 2005, 63, 475–496. [Google Scholar] [CrossRef]
  6. FAO. Growing Greener Cities in Africa: First Status Report on Urban and Peri-Urban Horticulture in Africa; Food and Agriculture Organization of the United Nations: Rome, Italy, 2012. [Google Scholar]
  7. Baiphethi, M.N.; Jacobs, P.T. The contribution of subsistence farming to food security in South Africa. Agrekon 2009, 48, 459–482. [Google Scholar] [CrossRef]
  8. Cohen, M.; Garrett, J. The food price crisis and urban food (in)security. Environ. Urban. 2010, 22, 467–482. [Google Scholar] [CrossRef]
  9. Poulsen, M.N.; McNab, P.R.; Clayton, M.L.; Neff, R.A. A systematic review of urban agriculture and food security impacts in low-income countries. Food Policy 2015, 55, 131–146. [Google Scholar] [CrossRef]
  10. Drechsel, P.; Dongus, S. Dynamics and sustainability of urban agriculture: Examples from sub-Saharan Africa. Sustain. Sci. 2010, 5, 69–78. [Google Scholar] [CrossRef]
  11. Armar-Klemesu, M. Urban agriculture and food security, nutrition and health. In Growing Cities, Growing Food: Urban Agriculture on the Policy Agenda; Bakker, N., Dubbeling, M., Gundel, S., Sabel-Koschella, U., de Zeeuw, H., Eds.; Deutsche Stiftung fur internationale Entwicklung (DSE): Feldafing, Germany, 2020. [Google Scholar]
  12. Miccoli, S.; Finucci, F.; Murro, R. Feeding the Cities Through Urban Agriculture the Community Esteem Value. Agric. Agric. Sci. Procedia 2016, 8, 128–134. [Google Scholar] [CrossRef]
  13. Nkrumah, B. Edible backyards: Climate change and urban food (in)security in Africa. Agric. Food Sec. 2018, 7, 1–5. [Google Scholar] [CrossRef] [Green Version]
  14. Komakech, A.; Banadda, N.E.; Kinobe, J.R.; Kasisira, L.; Sundberg, C.; Gebresenbet, G.; Vinnerås, B. Characterisation of Municipal Waste in Kampala, Uganda. J. Air Waste Manag. Assoc. 2013, in press.
  15. Davies, J.; Hannah, C.; Guido, Z.; Zimmer, A.; McCann, L.; Battersby, J.; Evans, T. Barriers to urban agriculture in Sub-Saharan Africa. Food Policy 2021, 103, 101999. [Google Scholar] [CrossRef]
  16. Crush, J.; Hovorka, A.; Tevera, D. Food security in Southern African cities: The place of urban agriculture. Progr. Develop. Stud. 2011, 11, 285–305. [Google Scholar] [CrossRef]
  17. Amoah, P.; Drechsel, P.; Abaidoo, R.C.; Ntow, W.J. Pesticide and pathogen contamination of vegetables in Ghana’s urban markets. Arch. Environ. Contam. Toxicol. 2006, 50, 1–6. [Google Scholar] [CrossRef]
  18. Masset, E.; Haddad, L.; Cornelius, A.; Isaza-Castro, J. A Systematic Review of Agricultural Interventions that Aim to Improve Nutritional Status of Children; EPPI-Centre, Social Science Research Unit, Institute of Education, University of London: London, UK, 2011. [Google Scholar]
  19. Wooldridge, J.M. Econometric Analysis of Cross Section and Panel Data; MIT Press: Cambridge, MA, USA, 2010. [Google Scholar]
  20. Cattaneo, M.D.; Drukker, D.M.; Holland, A.D. Estimation of multivalued treatment effects under conditional independence. Stata J. 2013, 13, 407–450. [Google Scholar] [CrossRef] [Green Version]
  21. UNDP. Urban Agriculture. Food, Jobs, and Sustainable Cities. United Nations Development Programme; Publiocation Series for Habitat II; UNDP: New York, NY, USA, 1996; Volume One. [Google Scholar]
  22. Drechsel, P.; Hope, L.; Cofie, O. Gender mainstreaming: Who wins? Gender and irrigated urban vegetable production in West Africa. J. Gend. Water 2013, 2, 2. [Google Scholar]
  23. Hovorka, A.J.; Smith, D.L. Gendering the Urban Agriculture Agenda. In Cities Farming for the Future: Urban Agriculture for Green and Productive Cities; van Veenhuizen, R., Ed.; International Institute of Rural Reconstruction and ETC Urban Agriculture: Dasmariñas, Philippines, 2006; pp. 125–144. [Google Scholar]
  24. Hovorka, A.J. Urban agriculture: Addressing practical and strategic gender needs. Dev. Pract. 2006, 16, 51–61. [Google Scholar] [CrossRef]
  25. Ngome, I.; Foeken, D. “My garden is a great help”: Gender and urban gardening in Buea, Cameroon. GeoJournal 2012, 77, 103–118. [Google Scholar] [CrossRef] [Green Version]
  26. Azunre, G.A.; Amponsah, O.; Peprah, C.; Takyi, S.A.; Braimah, I. A review of the role of urban agriculture in the sustainable city discourse. Cities 2019, 93, 104–119. [Google Scholar] [CrossRef]
  27. Slater, R.J. Urban agriculture, gender and empowerment: An alternative view. Dev. South. Afr. 2001, 18, 635–650. [Google Scholar] [CrossRef]
  28. Adeoti, A.; Cofie, O.; Oladele, O. Sustainabilities of Livelihoods through Urban Agriculture: Gender Dimensions in Accra. J. Sustain. Agric. 2012, 36, 236–248. [Google Scholar] [CrossRef]
  29. Maconachie, R.; Binns, T.; Tengbe, P. Urban farming associations, youth and food security in post-war Freetown, Sierra Leone. Cities 2012, 29, 192–200. [Google Scholar] [CrossRef]
  30. Kadenyaka, M.V. The effect of gender on the food security of urban agriculture households: A case of Eldoret, Kenya. J. Agric. Biol. Sci. 2012, 7, 595–608. [Google Scholar]
  31. Jagganath, G. The Transforming City: Exploring the Potential for Smart Cities and Urban Agriculture in Africa. Orient. Anthropol. 2022, 22, 24–40. [Google Scholar] [CrossRef]
  32. Tasciotti, L.; Wagner, N. Urban agriculture and dietary diversity: Empirical evidence from Tanzania. Eur. J. Dev. Res. 2015, 27, 631–649. [Google Scholar] [CrossRef]
  33. Reutlinger, S. Poverty and Hunger: Issues and Options for Food Security in Developing Countries; A World Bank Policy Study; 1818 H Street, NW, The World Bank: Washington, DC, USA, 1986. [Google Scholar]
  34. de Oliveira Alves, D.; de Oliveira, L. Commercial urban agriculture: A review for sustainable development. Sustain. Cities Soc. 2022, 104185. [Google Scholar] [CrossRef]
  35. Foeken, D.; Uwuour, S. Farming as a livelihood source for the urban poor of Nakuru, Kenya. Geoforum 2008, 39, 1978–1990. [Google Scholar] [CrossRef]
  36. Zezza, A.; Tasciotti, L. Urban agriculture, poverty, and food security: Empirical evidence from a sample of developing countries. Food Policy 2010, 35, 265–273. [Google Scholar] [CrossRef]
  37. Wagner, N.; Tasciotti, L. Urban agriculture, dietary diversity and child health in a sample of Tanzanian town folk. Can. J. Dev. Stud. Rev. Can. D’études Du Développement 2018, 39, 234–251. [Google Scholar] [CrossRef]
  38. Memon, P.A.; Lee-Smith, D. Urban agriculture in Kenya. Can. J. Afr. Stud. La Rev. Can. Des Études Afr. 1993, 27, 25–42. [Google Scholar]
  39. Simatele, D.M.; Binns, T. Motivation and marginalization in African urban agriculture: The case of Lusaka, Zambia. In Urban forum; Springer: Dordrecht, The Netherlands, 2008; Volume 19, pp. 1–21. [Google Scholar]
  40. Cilliers, E.J. Reflecting on green infrastructure and spatial planning in Africa: The complexities, perceptions, and way forward. Sustainability 2020, 37, 105–129. [Google Scholar] [CrossRef] [Green Version]
  41. Rice, J.; Rice, J.S. The concentration of disadvantage and the rise of an urban penalty: Urban slum prevalence and the social production of health inequalities in the developing countries. Int. J. Health Serv. 2009, 39, 749–770. [Google Scholar] [CrossRef]
  42. WHO. Guidelines for the Safe Use of Wastewater, Excreta and Greywater. 2006. Available online: http://apps.who.int/iris/bitstream/handle/10665/78265/9241546824_eng.pdf;jsessionid=0EB659208D88791499580E56BF956820?sequence=1 (accessed on 23 January 2023).
  43. Nabulo, G.; Young, S.D.; Black, C.R. Assessing risk to human health from tropical leafy vegetables grown on contaminated urban soils. Sci. Total Environ. 2010, 408, 5338–5351. [Google Scholar] [CrossRef] [PubMed]
  44. Ermolaev, E.; Sundberg, C.; Pell, M.; Jönsson, H. Greenhouse gas emissions from home composting in practice. Bioresour. Technol. 2014, 151, 174–182. [Google Scholar] [CrossRef] [PubMed]
  45. Słoczyński, T.; Wooldridge, J.M. A general double robustness result for estimating average treatment effects. Econom. Theory 2018, 34, 112–133. [Google Scholar] [CrossRef] [Green Version]
  46. Lu, W.; Addai, K.N.; Ng’ombe, J.N. Impact of improved rice varieties on household food security in Northern Ghana: A doubly robust analysis. J. Int. Dev. 2021, 33, 342–359. [Google Scholar] [CrossRef]
  47. Manda, J.; Gardebroek, C.; Kuntashula, E.; Alene, A.D. Impact of improved maize varieties on food security in Eastern Zambia: A doubly robust analysis. Rev. Dev. Econ. 2018, 22, 1709–1728. [Google Scholar] [CrossRef] [Green Version]
  48. Borgen, N.T.; Haupt, A.; Wiborg, Ø.N. A New Framework for Estimation of Unconditional Quantile Treatment Effects: The Residualized Quantile Regression (RQR) Model. 2021. Available online: https://www.rand.org/pubs/working_papers/WR824-1.html (accessed on 23 January 2023).
  49. Frölich, M.; Melly, B. Unconditional quantile treatment effects under endogeneity. J. Bus. Econ. Stat. 2013, 31, 346–357. [Google Scholar] [CrossRef] [Green Version]
  50. Tasciotti, L.; Wagner, N. How much should we trust micro-data? A comparison of the socio-demographic profile of Malawian households using census, LSMS and DHS data. Eur. J. Dev. Res. 2018, 30, 588–612. [Google Scholar] [CrossRef]
  51. Warren, E.; Hawkesworth, S.; Knai, C. Investigating the association between urban agriculture and food security, dietary diversity, and nutritional status: A systematic literature review. Food Policy 2015, 53, 54–66. [Google Scholar] [CrossRef]
  52. Masashua, H.; Dimoso, P.; Hawassi, F. Potentials of Urban Horticulture for Poverty Reduction in Dar es Salaam: A Case of Kinondoni Municipal. 2009. Available online: https://agris.fao.org/agris-search/search.do?recordID=GB2013202014 (accessed on 23 January 2023).
  53. Miura, S.; Kunii, O.; Wakai, S. Home gardening in urban poor communities of the Philippines. Int. J. Food Sci. Nutr. 2003, 54, 77–88. [Google Scholar] [CrossRef]
  54. Saha, B.; Sangwan, N. Credit where credit’s due: The enabling effects of empowerment in Indian microfinance. World Dev. 2019, 122, 537–551. [Google Scholar] [CrossRef]
Figure 1. Share of households engaged in urban agriculture, by country and quintiles of wealth. Source: Authors’ calculation from LSMS data.
Agriculture 13 00284 g001
Figure 2. Quantile treatment effect of UA on food expenditure. Note: QTE on the y-axis indicate the quantile treatment effect of participating in UA on the food expenditure. Source: Authors’ calculation from LSMS data.
Agriculture 13 00284 g002
Table 1. List of countries, year of the surveys and number of observations.
CountryYear of the SurveyNumber of Observations
Burkina Faso20144260
Ethiopia20131939
Ghana20092010
Malawi20131046
Mali20141405
Niger20141298
Nigeria20121488
Tanzania20101295
Uganda2013816
Total 15,557
Source: Authors’ calculation from LSMS data. Notes: the number of observations (column three) relates to only urban households.
Table 2. Food expenditure (household and per-capita), food count and food group for UA/non-UA households, by country.
CountriesYearly Household Food Expenditure (in USD)Yearly per-Capita Food Expenditure (in USD)Food CountFood Group
Not Engaged in UAEngaged in UANot Engaged in UAEngaged in UANot Engaged in UAEngaged in UANot Engaged in UAEngaged in UA
Burkina Faso1847142851521216176.606.50
Ethiopia84893925922610106.036.01
Ghana1172114050236124238.508.77
Malawi1412136839128423238.738.57
Mali2999289053136322238.077.69
Niger2520247247132825247.247.38
Nigeria2919284469052016167.267.23
Tanzania1998166355835015167.988.21
Uganda25341929109156017198.157.91
Source: Authors’ calculation from LSMS data. Notes: The expenditure values have been converted from local currency to USD 2020. The variable ‘food count’ counts the number of foods consumed by the household; this variable ranges between 0 and the maximum number of foods surveyed (which varies from country to country). The variable ‘food group’ ranges between 0 and 12 for all the countries.
Table 3. Summary statistics.
VariableHouseholds Engaged in UAHouseholds Not Engaged in UA
ObsMeanStd. Dev.ObsMeanStd. Dev.
Food Expenditure35801578.391335.8210,6801904.221718.72
Food Group38537.311.8811,7047.372.43
Food Count385317.817.211,70418.38.66
Cereals37963.111.5611,0663.341.54
Starch & Tubers20702.171.373231.981.21
Nuts & Legumes27131.711.0176651.69.87
Vegetables37543.991.7910,73042.15
Fruits15241.841.1460881.831.15
Milk Prod13131.250.5955591.270.58
Oil & Fats35381.450.6510,6641.540.7
Meat & Poultry20951.410.6873881.370.65
Fish27921.090.5683461.070.72
Sugar & Syrup30241.20.4692521.290.51
Beverages28541.590.9682961.681
Miscellaneous34092.421.3887832.71.73
Head’s Age384949.0215.0611,55143.5614.93
Female Head38520.180.3811,7030.260.44
Head Married38450.810.3911,6270.690.46
Head’s Education37914.65.2411,3867.695.84
No of Children38532.812.3811,7041.81.91
No of Adults38533.442.3511,7042.832.03
No of Senior Adults38530.290.5611,7040.150.4
Assets Index38530.231.7911,7041.532.15
Employed in Agri38530.530.511,7040.340.47
Source: Authors’ calculation from LSMS data.
Table 4. Participation in urban agriculture using probit model.
Variables(1) Urban Agriculture(2) Marginal Effects
Head’s Age0.011 ***0.002 **
(0.001)(0.000)
Female Head−0.265 ***−0.066 ***
(0.038)(0.009)
Head Married0.296 ***0.074 ***
(0.037)(0.009)
Head’s Education−0.025 ***−0.006 ***
(0.003)(0.000)
No of Children0.109 ***0.027 ***
(0.007)(0.001)
No of Adults0.040 ***0.009 ***
(0.007)(0.001)
No of Senior Adults0.0090.002
(0.034)(0.008)
Ethiopia0.819 ***0.205 ***
(0.069)(0.017)
Uganda1.091 ***0.273 ***
(0.075)(0.018)
Malawi1.477 ***0.370 ***
(0.073)(0.017)
Nigeria0.867 ***0.217 ***
(0.071)(0.017)
Tanzania1.242 ***0.311 ***
(0.070)(0.017)
Ghana1.193 ***0.298 ***
(0.068)(0.016)
Burkina Faso1.123 ***0.281 ***
(0.060)(0.014)
Mali−0.015−0.003
(0.078)(0.019)
Niger (reference group)--
Assets Index−0.175 ***−0.043 ***
(0.008)(0.001)
HH occupation (1 employed in agriculture.; 0 otherwise.)0.358 ***0.089 ***
(0.027)(0.006)
Constant−2.526 ***
(0.088)
Observations15,06315,063
Source: Authors’ calculation from LSMS data. Notes: Robust standard errors in parentheses. *** p < 0.01, ** p < 0.05.
Table 5. Impact of urban Agriculture using IPWRA estimates.
(1)(2)(3)(4)(5)
VariablesFood expenditureFood groupFood CountCerealsStarch & tubers
Urban Agriculture−0.03 ***0.206 ***0.660 ***0.0160.143 ***
(0.013)(0.035)(0.124)(0.032)(0.021)
Observations13,38015,06315,06314,4719135
(6)(7)(8)(9)(10)
VariablesNuts & legumesVegetablesFruitsMilk productsOil & fats
Urban Agriculture0.090 ***−0.076 ***0.066 **0.042 **−0.057 ***
(0.020)(0.031)(0.032)(0.019)(0.014)
Observations10,06114,1127373662913,834
(11)(12)(13)(14)(15)
VariablesMeat & PoultryFishSugar & SyrupBeveragesMiscellaneous
Urban Agriculture0.10 ***−0.041 ***0.0060.0680.059 ***
(0.018)(0.012)(0.008)(0.022)(0.017)
Observations918310,92211,96510,89511,846
Source: Authors’ calculation from LSMS data. Note: Models (2) to (15) are estimated using Poisson regression as an outcome model. Robust standard errors in parentheses. *** p < 0.01, ** p < 0.05.
Table 6. Quantile Treatment Effect.
Q.1Q.2Q.3Q.4Q.5Q.6Q.7Q.8Q.9
UA0.057 *−0.022−0.085 ***−0.118 ***−0.113 ***−0.126 ***−0.119 ***−0.092 ***−0.054 *
(0.032)(0.025)(0.022)(0.021)(0.021)(0.021)(0.022)(0.024)(0.028)
Constant6.155 ***6.556 ***6.829 ***7.056 ***7.256 ***7.440 ***7.640 ***7.865 ***8.167 ***
(0.014)(0.011)(0.010)(0.009)(0.008)(0.008)(0.008)(0.008)(0.010)
Observations13,88013,88013,88013,88013,88013,88013,88013,88013,880
Source: Authors’ calculation from LSMS data. Note: Q stands for ‘quintile’. Robust standard errors in parentheses. *** p < 0.01, * p < 0.1.
Disclaimer/Publisher’s Note: The statements, opinions and data contained in all publications are solely those of the individual author(s) and contributor(s) and not of MDPI and/or the editor(s). MDPI and/or the editor(s) disclaim responsibility for any injury to people or property resulting from any ideas, methods, instructions or products referred to in the content.

