Article

Estimation of Productivity and Above-Ground Biomass for Corn (Zea mays) via Vegetation Indices in Madeira Island

by
Fabrício Lopes Macedo
1,2,*,
Humberto Nóbrega
1,
José G. R. de Freitas
1,
Carla Ragonezi
1,2,3,
Lino Pinto
1,
Joana Rosa
1 and
Miguel A. A. Pinheiro de Carvalho
1,2,3
1
ISOPlexis Centre of Sustainable Agriculture and Food Technology, Campus da Penteada, University of Madeira, 9020-105 Funchal, Portugal
2
Centre for the Research and Technology of Agro-Environmental and Biological Sciences (CITAB), Inov4Agro—Institute for Innovation, Capacity Building and Sustainability of Agri-Food Production, University of Trás-os-Montes and Alto Douro, 5000-801 Vila Real, Portugal
3
Faculty of Life Sciences, Campus da Penteada, University of Madeira, 9020-105 Funchal, Portugal
*
Author to whom correspondence should be addressed.
Submission received: 28 April 2023 / Revised: 19 May 2023 / Accepted: 21 May 2023 / Published: 24 May 2023
(This article belongs to the Special Issue Remote Sensing Technologies in Agricultural Crop and Soil Monitoring)

Abstract

:
The advancement of technology associated with the field, especially the use of unmanned aerial vehicles (UAV) coupled with multispectral cameras, allows us to monitor the condition of crops in real time and contribute to the field of machine learning. The objective of this study was to estimate both productivity and above-ground biomass (AGB) for the corn crop by applying different vegetation indices (VIs) via high-resolution aerial imagery. Among the indices tested, strong correlations were obtained between productivity and the normalized difference vegetation index (NDVI) with a significance level of p < 0.05 (0.719), as well as for the normalized difference red edge (NDRE), or green normalized difference vegetation index (GNDVI) with crop productivity (p < 0.01), respectively 0.809 and 0.859. The AGB results align with those obtained previously; GNDVI and NDRE showed high correlations, but now with a significance level of p < 0.05 (0.758 and 0.695). Both GNDVI and NDRE indices showed coefficients of determination for productivity and AGB estimation with 0.738 and 0.654, and 0.701 and 0.632, respectively. The use of the GNDVI and NDRE indices shows excellent results for estimating productivity as well as AGB for the corn crop, both at the spatial and numerical levels. The possibility of predicting crop productivity is an essential tool for producers, since it allows them to make timely decisions to correct any deficit present in their agricultural plots, and further contributes to AI integration for drone digital optimization.

Graphical Abstract

1. Introduction

The above-ground biomass (AGB) is the most used indicator related to crop production since is considered the key trait in crop production estimation [1]. Donald and Hamblin [2] state that when crop yields are analyzed, it is usually divided between biological and economic aspects. According to Yue et al. [3], biological yield refers especially to the organic matter content produced and accumulated by the crop during its growth cycle. At the same time, the economic yield was referred to as grain production and corresponds to the final quantity produced by a given crop. Battude et al. [4] and Jin et al. [5] contend that the early and predictive monitoring of biomass production, as well as the yield of grain production, is essential for management agencies since it enables the adjustments of activities related to agricultural production.
Traditionally, the way to obtain the AGB consists of the use of destructive sampling methods, involving the harvest, weight, and account of crop biomass [6]. This method is reliable and shows great results; however, it is time-consuming and impractical to use for large field areas. The advent of remote sensing (RS) techniques has made it possible to analyze large areas in shorter periods, compared to traditional techniques, thus reducing the analysis costs and obtaining results almost in real time for the farmer. The applications of RS can range from high throughput-yield phenotyping to the analysis of abiotic or biotic stress incidence, which can limit crop growth [7].
The advances in the use of both, unmanned aerial vehicles (UAV) and multi/hyperspectral cameras with increasingly smaller sizes and lower costs have made it possible to obtain images covering given areas with a greater range of temporal and spatial scales and much higher resolutions than those provided by satellite images. Sankaran et al. [8] emphasized that UAVs can be used in environmental and agricultural studies, offering many advantages such as low-cost acquisition, controlled flight speeds and altitudes, and increasingly lower weight of the equipment.
The joint processing of satellite and UAV images makes it possible to obtain vegetation indices (VIs), which are used in different works. VIs are mathematical combinations of the reflectance in different spectral bands of the electromagnetic spectrum, which can be indicators of photosynthetic activity and vegetation vigor [9]. Most VIs use wavelengths referring to the red, red edge, and the near-infrared spectral [10], but there are other VIs that still make use of wavelengths referring to the blue and green bands. The vegetation in the field does not present the same spectral reflectance since it does not have homogeneous development and growth. Once a certain VI is generated, it becomes possible to distinguish and verify the higher and lower values of the pixels, according to the test sensitivity, which allows for building estimation/prediction models of the imaged field surface and crops held on it [11].
VIs have been increasingly used in scientific studies, since they are very easy to obtain and especially because of their reliability concerning the results obtained. It is worth mentioning some of their uses in different scientific studies, such as for estimating forest biomass [12], predicting the biomass of crops [4,13], the determination of water stress in crops [14,15], the determination of chlorophyll concentration in leaves [16], and measuring nitrogen content [17], among other applications.
Madeira is an island region, characterized by mountain agriculture practiced in terraces, on average with less than one hectare [18]. Some factors limit the use of satellite images in the region, such as the coarse spatial resolution of the images, since normally the fields on the island are small and the nature of agriculture determines the mixture of various crops in small areas; and secondly, optical remote sensing is virtually impossible due to persistent cloud cover.
This agriculture, except for monocultures of vine and banana production, is majorly low input pluricultural, whereas several crops coexist in the same field terrace. The high agrodiversity is expressed in the use of local landraces and genetic resources in many crop cultures [19]. In the present work, UAV imagery is applied to a maize field with Santana landrace, one of the most traditional crops cultivated by local farmers [20,21]. The development of this prediction model is important for future application in the assessment of the maize production cycle, and determination of the abiotic or biotic constraints that could result from climatic conditions.
This study presents for the first time an estimation of productivity and above-ground biomass (AGB) for corn landrace production using different VIs from high-resolution aerial UAV imagery.

2. Materials and Methods
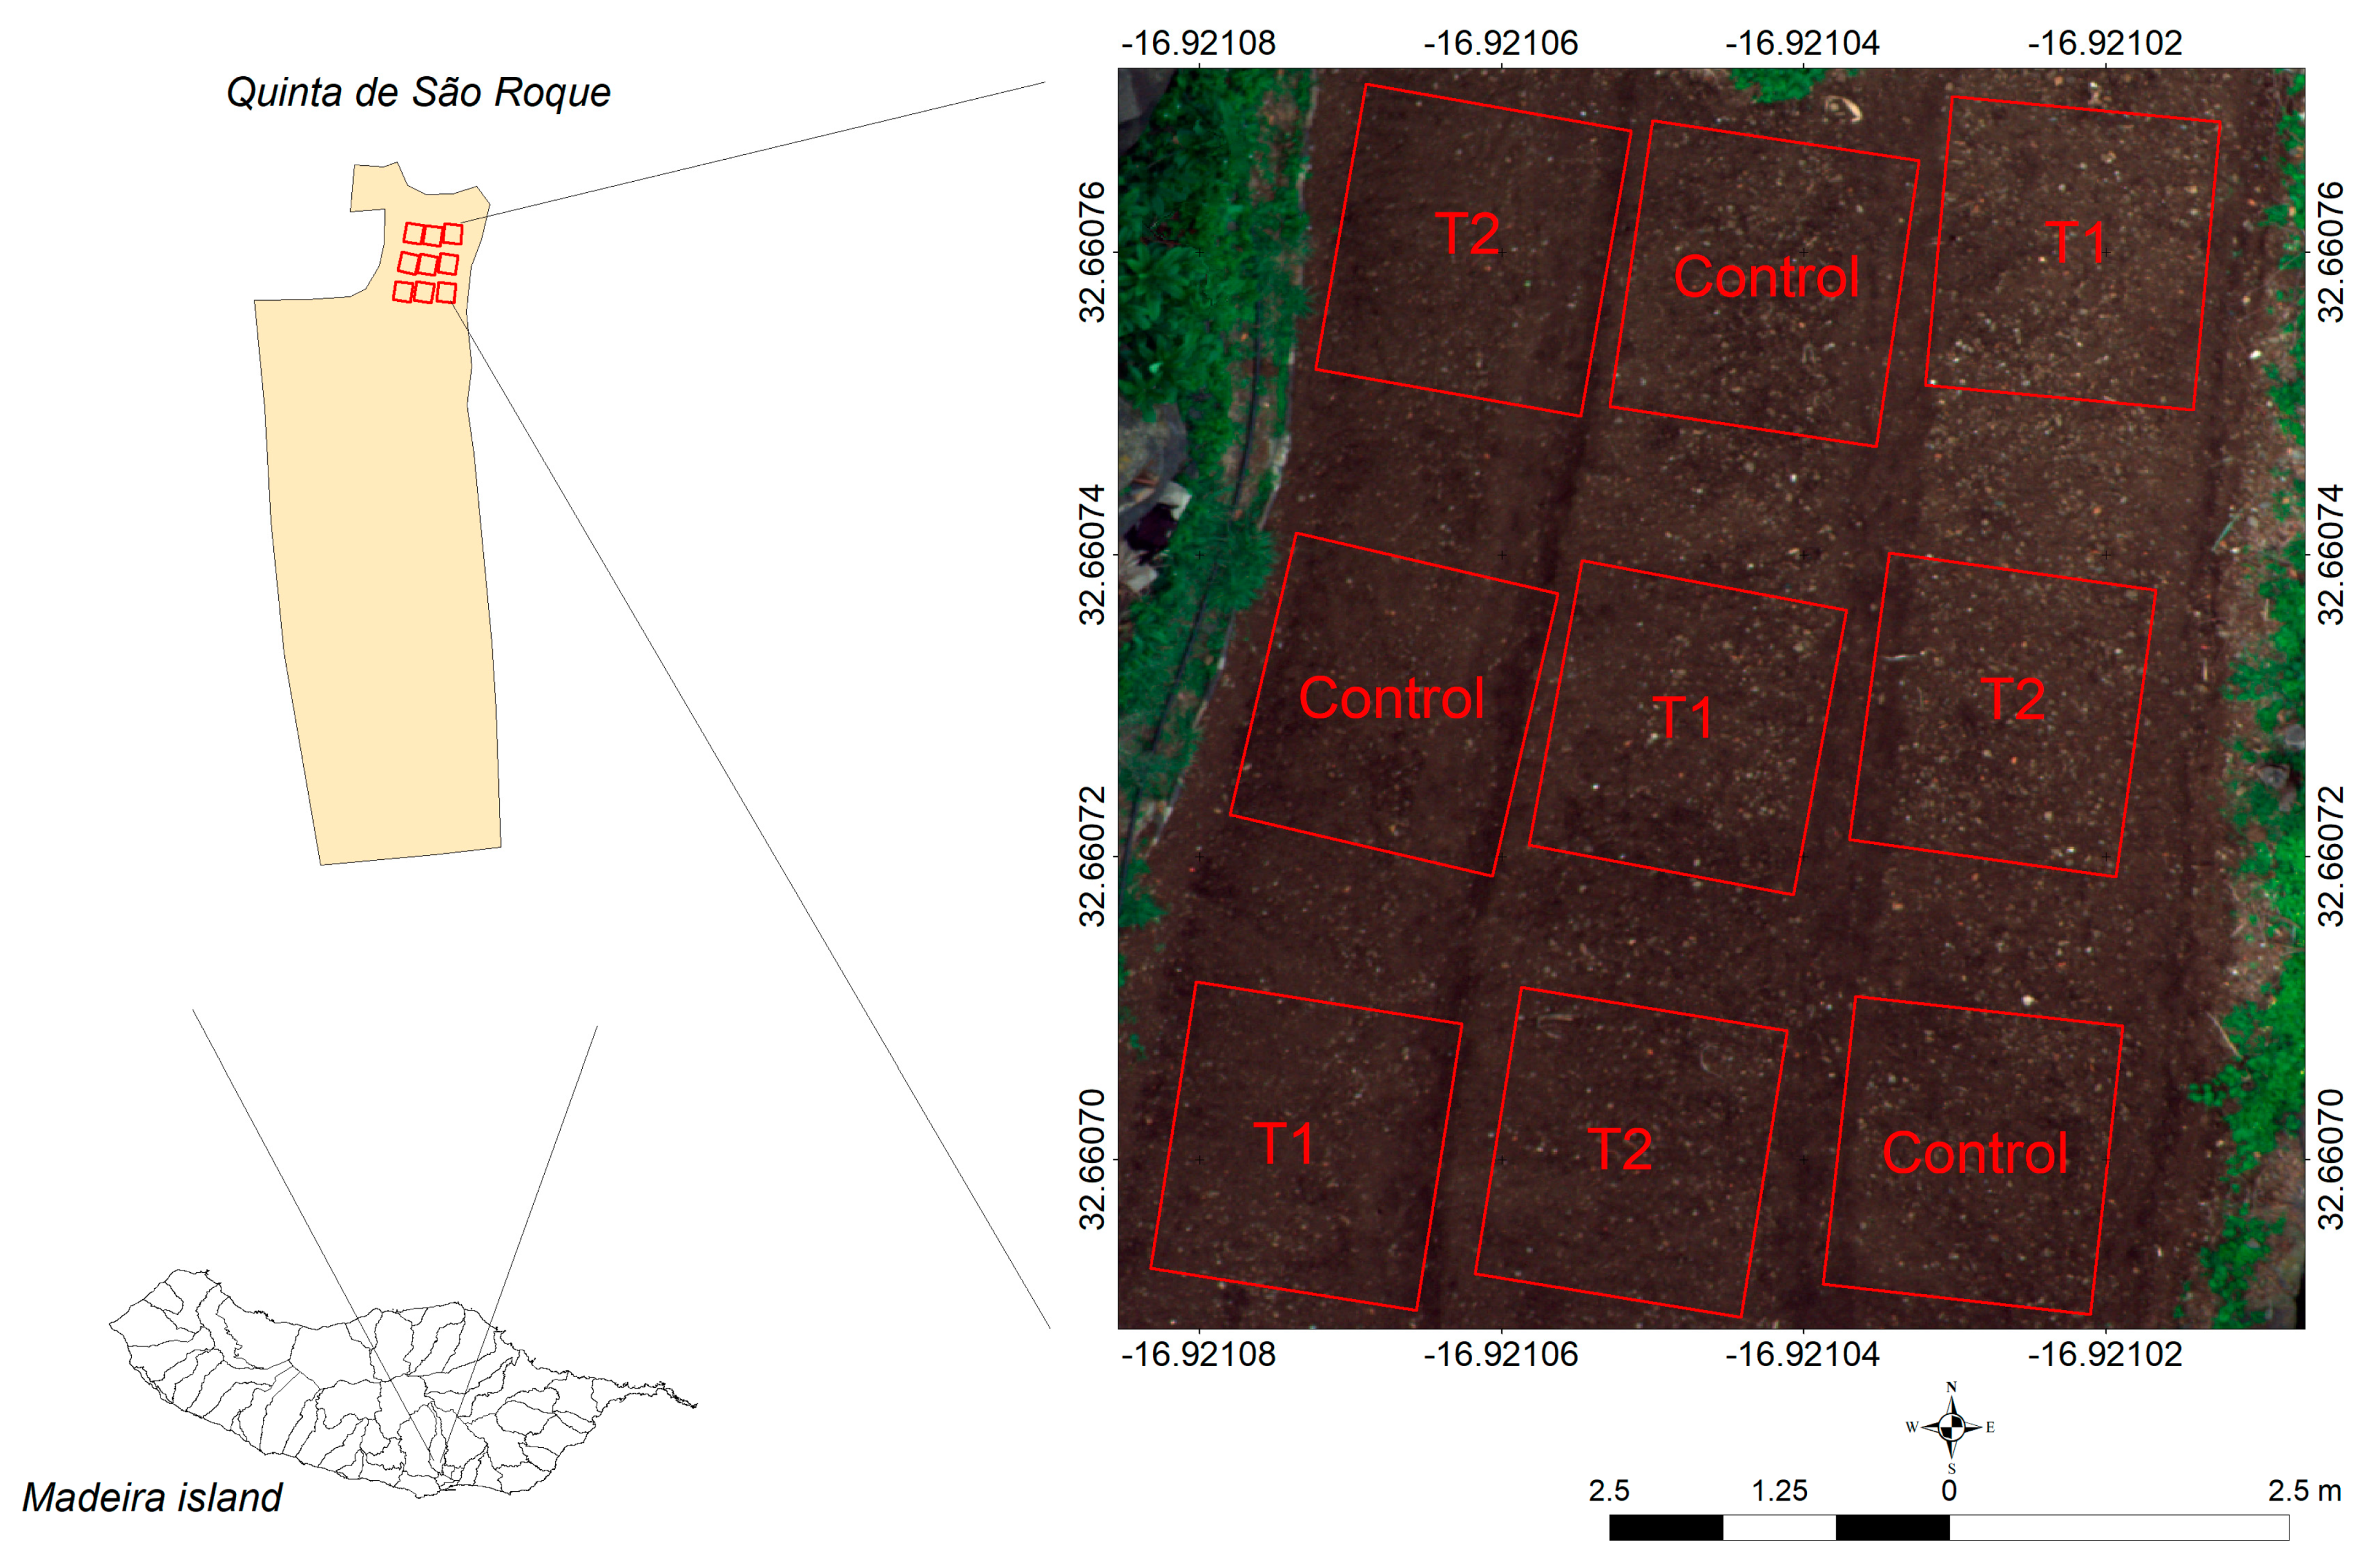
2.1. Study Area

The present study was conducted at Quinta de São Roque (32°39′37″ N, 16°55′15″ W, altitude 198 m) of the University of Madeira, Funchal—Portugal in 2022. The soil of the study area is classified as Chromic Cambisol, with a clayey texture. According to the Köppen classification, the study area is classified as having a temperate climate with hot and dry summers (Csa), with average, maximum, and minimum temperatures of 18.5 °C, 26.4 °C, and 11.1 °C and average annual accumulated precipitation of approximately 653 mm.

2.2. Field Test

In the present study, 3 treatments were analyzed, where the control treatment (Control) consisted solely of corn planting without the use of any type of compost; the other treatments used distinct dosages of organic compost, 10 kg m−2 (T1) and 5 kg m−2 (T2), used to verify if they influence the productivity of the crop (Figure 1). A corn landrace, Santana, was used in the field assay. The assay was set up under a random block design in plots, with 1.60 × 2.50 m, inter-row, and spacing between plants of 30 cm and 25 cm, respectively. An average of 60 seeds per treatment was used.
One hundred and thirty (130) days after planting, the crop completed its production cycle, and the plots were harvested and weighed individually. Total biomass production was quantified by weighing all the material collected in each plot, while productivity was quantified by weighing only the cobs in each plot. In the present study, no fertilizer was applied beyond the initial dose of compost, no phytosanitary treatment was done on the crop, and no irrigation was performed.

2.3. Vant Platform

A DJI Matrix 210 RTK V2 multirotor quadcopter was used for image acquisition, through flights at 30 m above the field surface. The UAV was equipped with a gimbal, mounting a Micasense Altum multispectral and thermal imager. It collects images in 5 spectral bands (blue, green, red edge, and near-infrared), along with the thermal LWIR, with a size of only 8.2 cm × 6.7 cm × 6.45 cm and a weight of 407 g. The Altum multispectral camera can collect images with a ground sample distance (GSD) of 5.2 cm at a height of 120 m above ground, with a view field of 48 degrees × 37 degrees for the multispectral channels.

2.4. Data Acquisition

A start flight mission (time 0) was performed before the corn sowing. Three flights were performed over the corn canopy, during stages V8 (plants with 8 leaves), flowering (R1), and before harvest (R6—physiological maturity, [22]). Details of each flight mission are listed in Table 1.
The flight missions were programmed and carried out in the proximity of solar noon to avoid differences in the quality of the images with shading. The processing of the obtained images was performed using Pix4D Mapper 4.6.4 (Pix4D, Prilly, Switzerland), a software specifically designed to process UAV images using techniques based on computer vision and photogrammetry.

2.5. Vegetation Indices Obtention via UAV

In this study, 5 VIs were used (Table 2). All indices and the processing of the productivity and AGB maps were performed using ArcGIS software version 10.6.1. Two analyses were tested in the present study. The first consisted of obtaining the average values of the VIs for the 9 study plots, obtained throughout the entire cycle of the crop; these data were obtained for flights 2, 3, and 4. The second consisted of obtaining the average values of the VIs for the 9 study plots; however, this used data only from flight 4, which was performed before the crop harvest.

2.6. Statistical Analysis

The statistical analysis was performed using Jamovi computer software version 2.3.16 (The Jamovi project, [28]). Once obtained the VIs values, they were analyzed to verify the normality or not of the obtained samples. The Shapiro–Wilk normality test was performed, aiming to verify the normality of a random sample, i.e., whether it comes from a normal or non-normal distribution Shapiro–Wilk, test. From this test, there was no evidence to reject the null hypothesis, and the values came from a normal distribution, with a significance of 1% probability.
The Pearson correlation coefficient (r) was used to evaluate the correlation between productivity and AGB with VIs. The interpretation of Pearson’s correlation coefficient can be obtained from its value, and the correlation is classified as very weak (0.00–0.19), weak (0.20–0.39), moderate (0.40–0.69), strong (0.70–0.89), and very strong (0.90–1.00) [29].
The root means square error (RMSE) between observations and predictions was used to evaluate the accuracy of productivity and AGB predicted by different models. The correlations with the most relevant values were used in the development of linear correlations between productivity and AGB VIs.

3. Results and Discussion

3.1. Effect of Organic Compost

The applied dosages of organic compost in the assays seem not to significantly influence the variation of productivity and AGB between the treatments (Table 3). Even though the treatments did not present significant differences, the vegetation indices were checked for the correlation between corn productivity and the AGB.

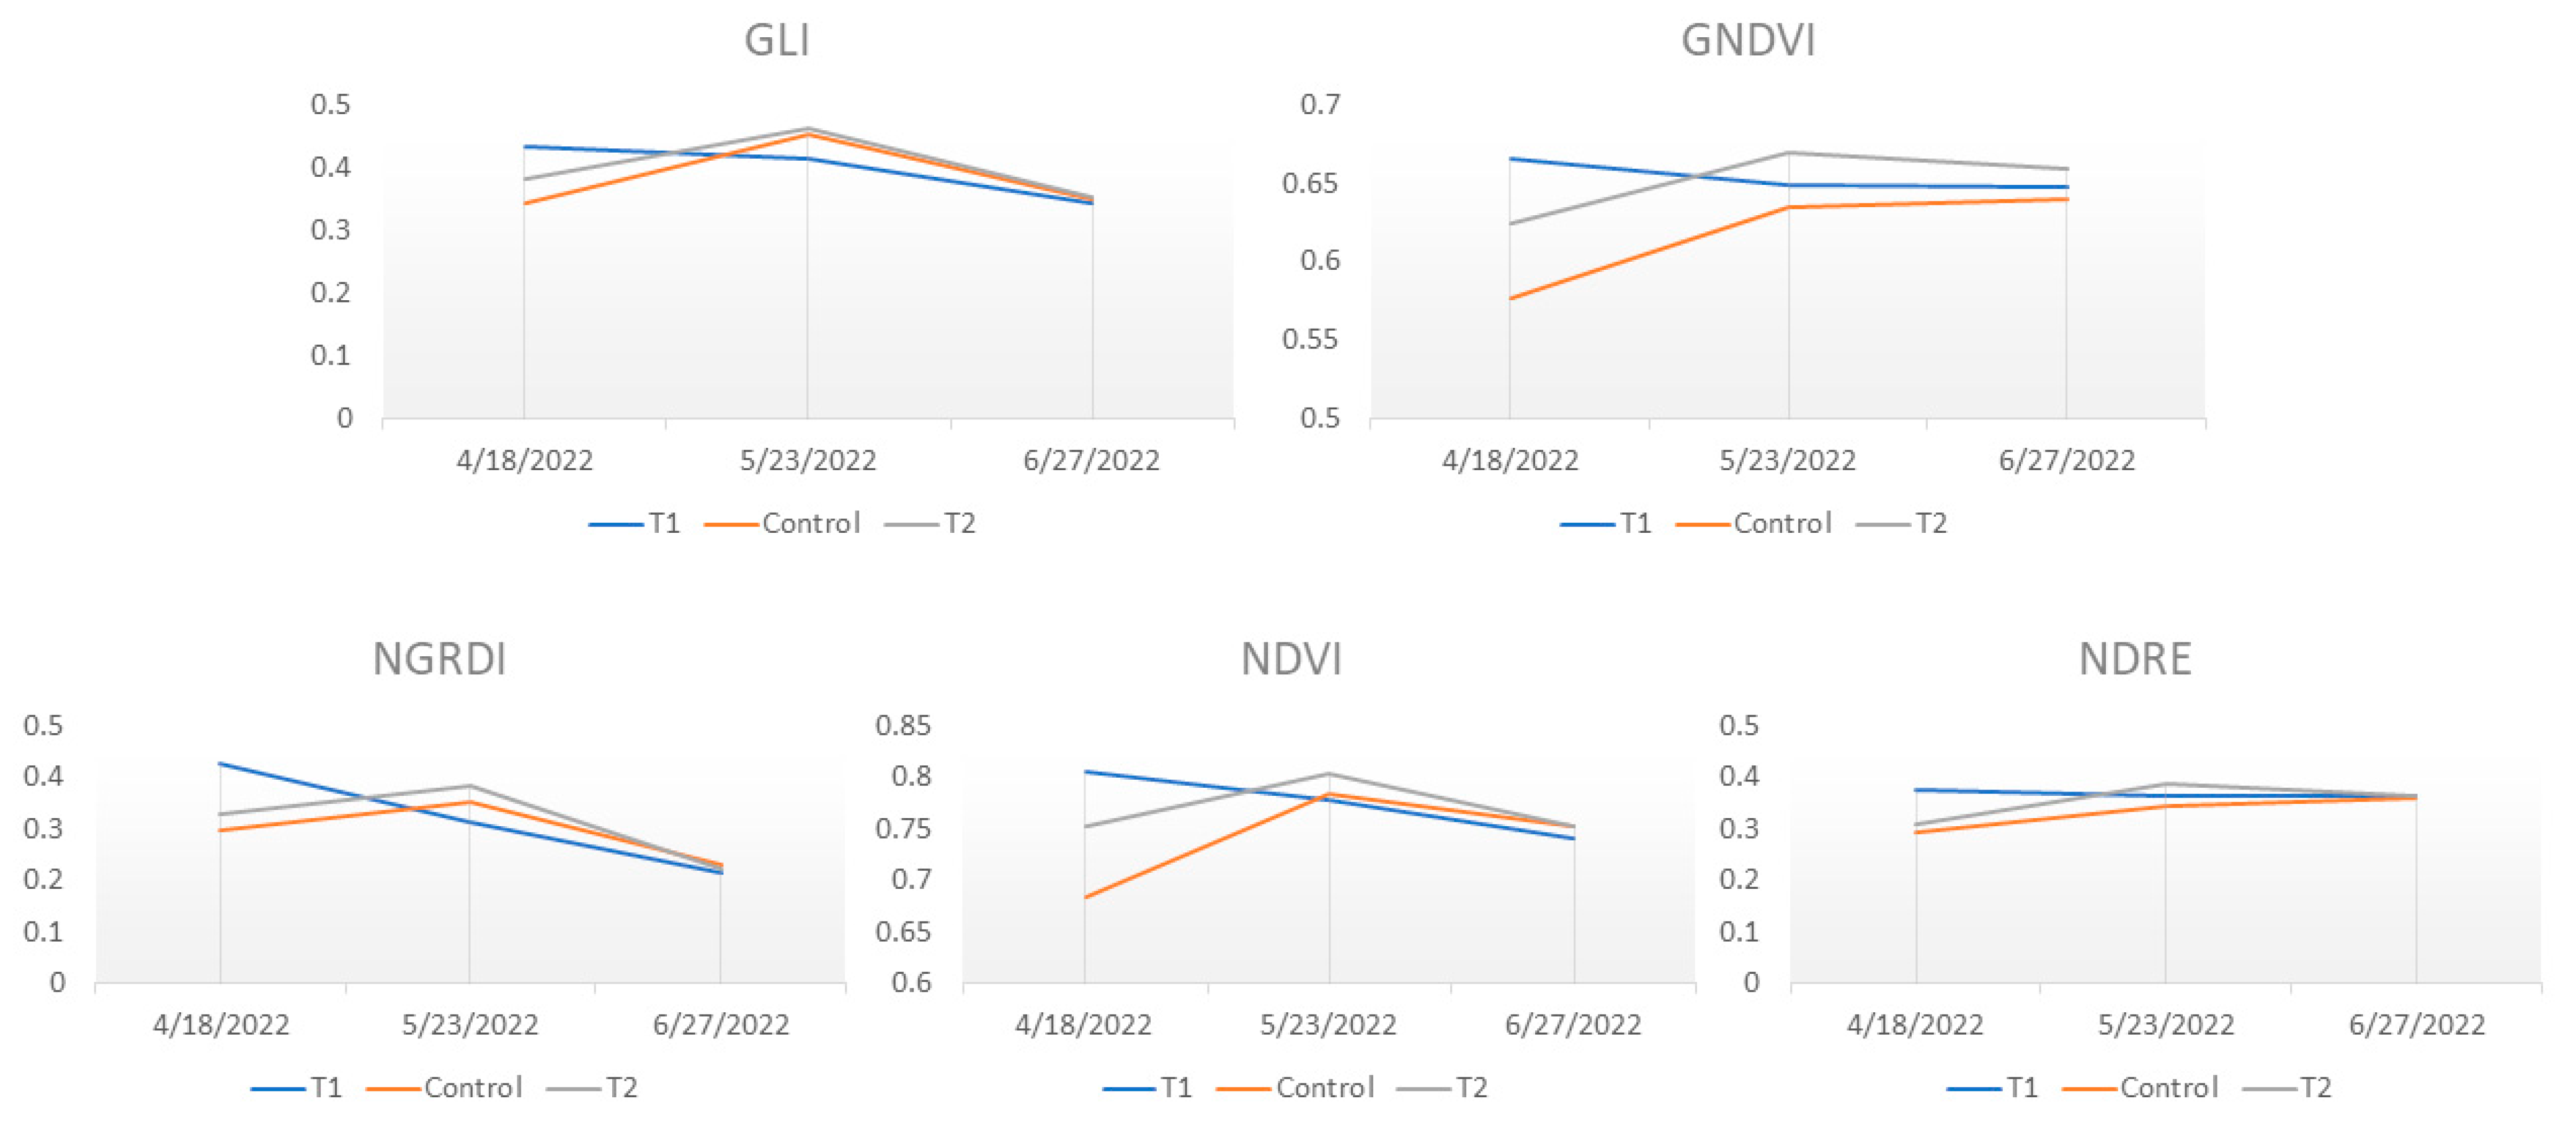
3.2. Spectral Behavior of Tested VIs

With the average values of the five indices tested, it was possible to present the evolution of their spectral behavior throughout the crop cycle (Figure 2). For all indices, it was found that at 60 days after sowing, the highest values obtained were for treatment 1. In the flowering period, it was found that the values for all indices increased considerably, especially for the control and for treatment 2. At 130 days after sowing, it was found that treatment 1, for all indices tested except for GNDVI, had the lowest values. In general, at the end of the trial, the results for all treatments were very close, except for the GNDVI, which showed a greater discrepancy between the values obtained by the other indices analyzed.

3.3. Productivity and AGB Analysis via VIs

After running the samples through the Shapiro–Wilk normality test, they were found to have a normal distribution. Once this was verified, the correlation matrix was obtained using Pearson’s test (Table 4).
For the first analysis, strong positive correlations were obtained between productivity and normalized difference vegetation index (NDVI) (0.719) with a significance level (p < 0.05); strong correlations were also obtained between normalized difference red edge (NDRE, and green normalized vegetation index (GNDVI) with crop productivity (p < 0.01), according to the classification proposed by Devore [29]. The same was observed regarding AGB results, where NDRE (0.695) and GNDVI (0.758) showed the highest positive correlations, with a significance level of p < 0.05, while NDVI does not show variation in the significance level, concerning productivity analysis. Since the other analyzed indices (green leaf index (GLI) and normalized green red difference index (NGRDI) did not show significant correlations with productivity and biomass, they were eliminated from further analyses for the first analysis.
Regarding the correlation analysis for the second analysis, it was found that the GLI and GNDVI indices showed strong negative and positive correlations, respectively (−0.820 and 0.834) (p < 0.01) for productivity. For AGB, both indices showed strong correlations again, with results equal to those obtained for productivity (−0.841 and 0.701). However, the correlation of GNDVI with AGB was slightly lower with productivity (p < 0.05).
Detailing each analysis further, it was found that in the first analysis, both GNDVI and NDRE were the indices that showed the better correlations (0.859 and 0.809, respectively) with productivity. Our results differ greatly from other published works, where NDVI represents the best indices for the estimation of crop productivity [30,31].
According to Gitelson and Merzlyak [32], the GNDVI replaces the red band with the green band in comparison to the NDVI, showing greater sensitivity to the variations in chlorophyll concentration. This replacement of bands favored the improvement in the estimation processes. Zhou et al. [33] and Khosravirad et al. [34] stated that the use of GNDVI is commonly adopted in productivity-related studies for sugarcane. Sankaran et al. [35], analyzing biomass estimation in bean plantations in Othello, WA, USA, obtained a good correlation between GNDVI and biomass, with a Pearson’s coefficient greater than 0.52.
The results obtained in the present study agree with those obtained by Marques Ramos et al. [36], in which they found that NDVI, GNDVI, and NDRE were the indices that showed a strong correlation with corn productivity. Similar results were also found by Kayad et al. [37], Schwalbert et al. [38], and Peralta et al. [39].
Regarding the NDRE, Gitelson, and Merzlyak [32] explained that the red edge band used by this index provides higher sensitivity in the estimation of productivity, because it is linked with leaf chlorophyll content, allowing the high absorption of incident energy in the leaf surface and at the same time avoiding the high degree of reflectance occurring in the lower parts of the leaf internal structure. Zhang et al. [40] demonstrated the strong link between leaf chlorophyll content and biomass, and that the prediction of maize productivity using reflectance related to the red edge is not impeded by noise related to O2 and water absorption. Taskos et al. [41] state that the red edge band can decrease the index saturation found in crops with high canopy density, which easily occurs with the NDVI. Henriques et al. [13], analyzing a VI’s series, concluded that NDVI, NDRE, and GNDVI showed a strong correlation with maize production in Chapadão do Sul, Brazil. Again, results were very similar to those obtained in the present work, in which NDVI was the VI with the lowest correlation value of 0.83, compared to GNDVI (0.91) and NDRE (0.94).
Maresma et al. [42] and Vian et al. [43] reported that the corn yield can be estimated using the NDVI vegetation index. The present study only in parts agrees with this, since the use of the NDVI in the estimation of productivity and aboveground biomass shows significant correlations at the level of p < 0.05. However, the coefficient of determination of this index for productivity and aboveground biomass shows much lower results than those obtained with GNDVI and NDRE, with stronger correlations (Table 5).

3.4. Estimation of Productivity and AGB via VIs

Linear equations allowing the estimation of productivity and AGB were generated using the values of the selected VIs (Table 5). The estimation of corn productivity for the first analysis, using GNDVI and NDRE, allowed us to obtain an equation with high values of determination coefficients (R2) of 0.738 and 0.654, respectively. At the same time, the value of R2 obtained for NDVI reaches only 0.517, relatively much lower than the other VIs. For ABG, the indices that obtained the highest values for the coefficient of determination were again the GNDVI and NDRE, with values of R2 0.701 and 0.632, respectively. The AGB estimations values obtained were relatively higher than those found for productivity. The GNDVI was considered the most relevant index for the present study since it presented the highest values for the coefficient of determination, both for the estimation of corn productivity and biomass. For the second analysis, the results show that for the yield estimation, the GNDVI obtained a coefficient of determination slightly higher than the GLI (0.695 and 0.673); however, when the AGB was analyzed, the results were inverted, and the GLI presented results much higher than the GNDVI (0.708 and 0.492, respectively). Henriques et al. [13] obtained similar results for R2 for the GNDVI index in their study (0.71) also analyzing the corn crop; however, Kayad et al. [37] obtained much lower results for GNDVI × productivity in 3 cycles of the corn crop in Northern Italy; it should be noted that they used images coming from Sentinel-2. Wahab et al. [44], using GNDVI derived from UAV images, stated that the index works very well in estimating the maize vigor and yield for small farms; this statement corroborates with our results. Rahman and Robson [45], analyzing the productivity estimation of sugarcane, obtained valid results with GNDVI, obtaining a linear relationship between the index and crop productivity, with values of R2 = 0.69 and RMSE = 4.2 t ha−1. Regarding the NDRE when compared with the NDVI, according to Taskos et al. [41], thanks to the red-edge band used by the second index, it becomes less susceptible to the index of saturation. This is the most acceptable statement when comparing different VIs. According to Li et al. [46], the use of a vegetation index that makes use of the red-edge band favors deeper penetration into the crop canopy, besides being highly sensitive in determining the leaf chlorophyll content present which shows strong correlations with biomass and productivity [32]. Several works claim that the NDRE presents better results compared to other Vis for estimating crop productivity. Duan et al. [47] estimate the productivity of rice crops, obtaining a value for the coefficient of determination of 0.67, as well as a correlation value of 0.73 for the index with crop productivity. Cordero et al. [48] also analyzed rice fields under different fertilizations and concluded that the NDRE was the index that performed the most favorably in biomass estimation (R2 = 0.76). The NDRE and the chlorophyll index red edge (CIRE) showed a coefficient of determination of 0.61 in maize [49]. Peng and Gitelson [50] analyzed the soybean gross primary productivity, testing and comparing VIs, and concluded that the NDRE showed a stronger linear relationship with the analyzed parameter (R2 = 0.87), being superior to NDVI (R2 = 0.83).

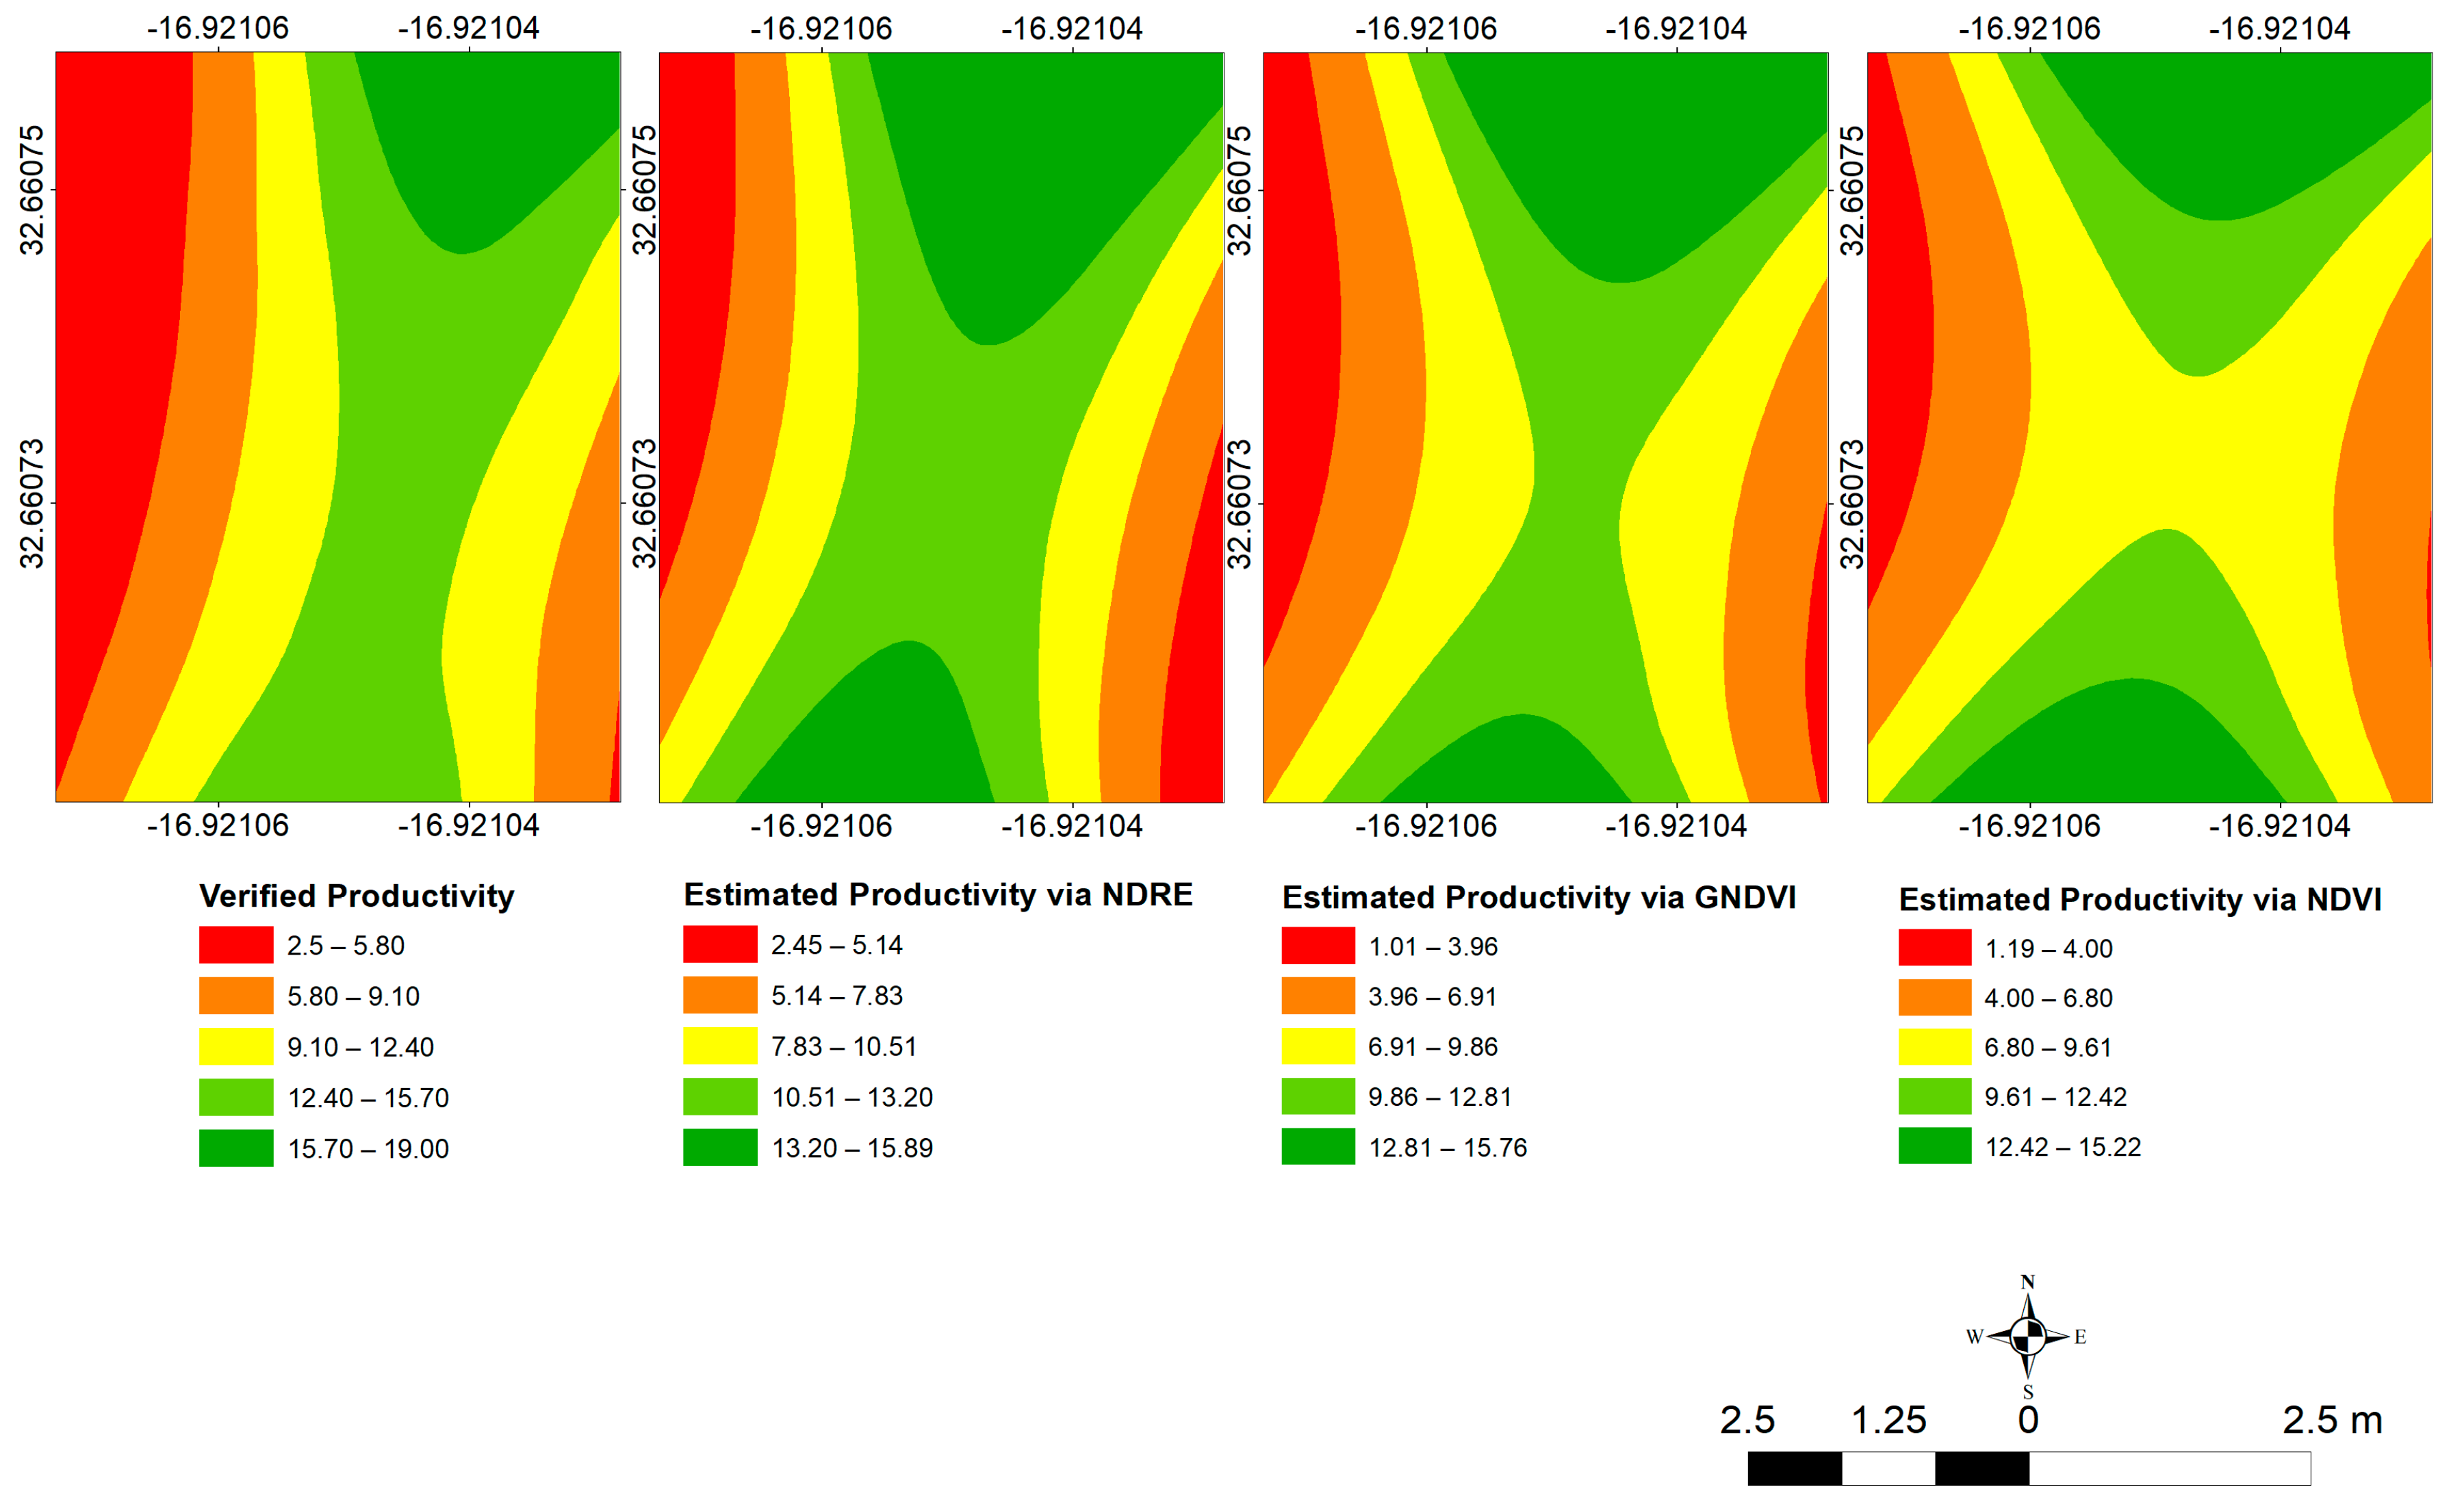
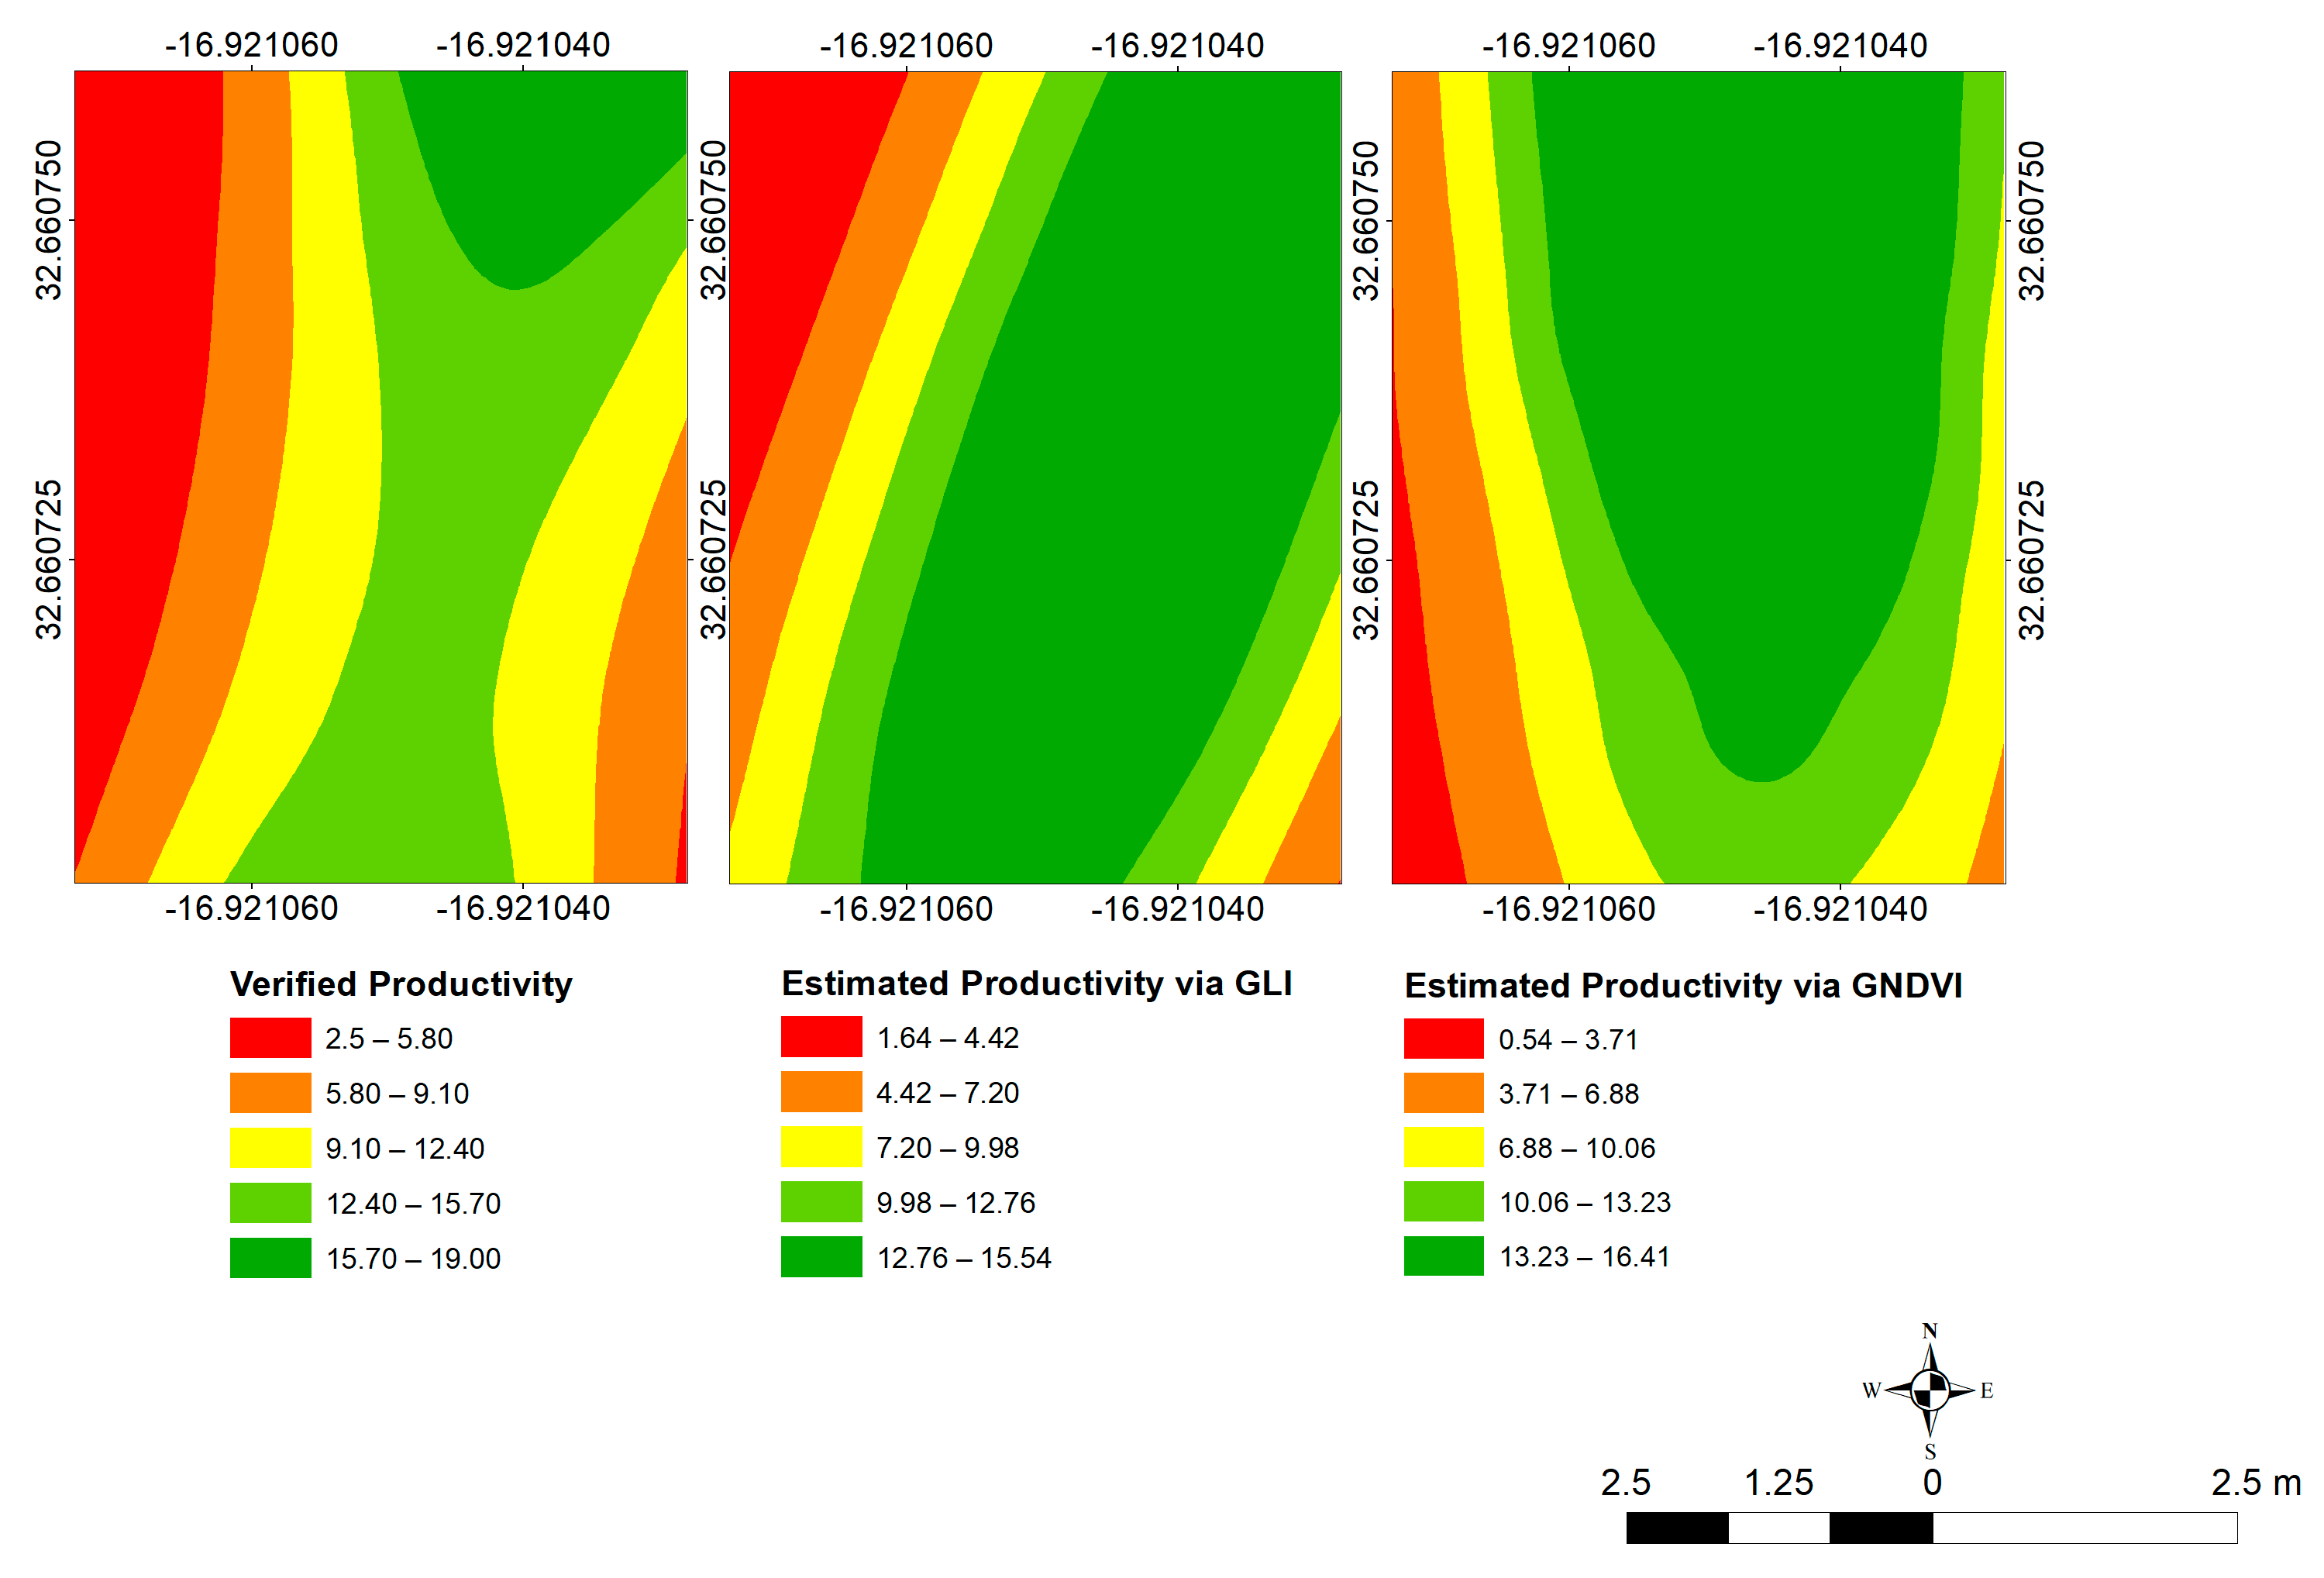
3.5. Spatialization of Productivity

After the analysis and selection of the VIs that presented the highest R2, the spatialization of the observed productivity and biomass were performed, and the estimates were obtained, disentangling the VIs.
The realization of the spatialization of both productivity and AGB, in comparison with the data observed in the field, demonstrates that the results from the first analysis resemble very closely the observed reality (Figure 3); totally different results were obtained with data from the second analysis (Figure 4). NDRE and GNDVI present a great similarity with the spatialization with the verified production of the present study. It is noteworthy that both the R2 and RMSE values of the second analysis were higher than those found for the NDRE; however, the results of the spatialization are different from reality, in that there is a large extrapolation of the highest yields in a central band (for GLI and the GNDVI2).
However, it should be noted that even though the spatializations of the first analysis present a great similarity with the spatialized verified production, there are several points that both overestimate and underestimate the real results. The models obtained, especially with the use of equations from the GNDVI and NDRE, can be improved with future work, seeking to refine the analysis, and consequently bringing the simulated results closer to the verified reality.

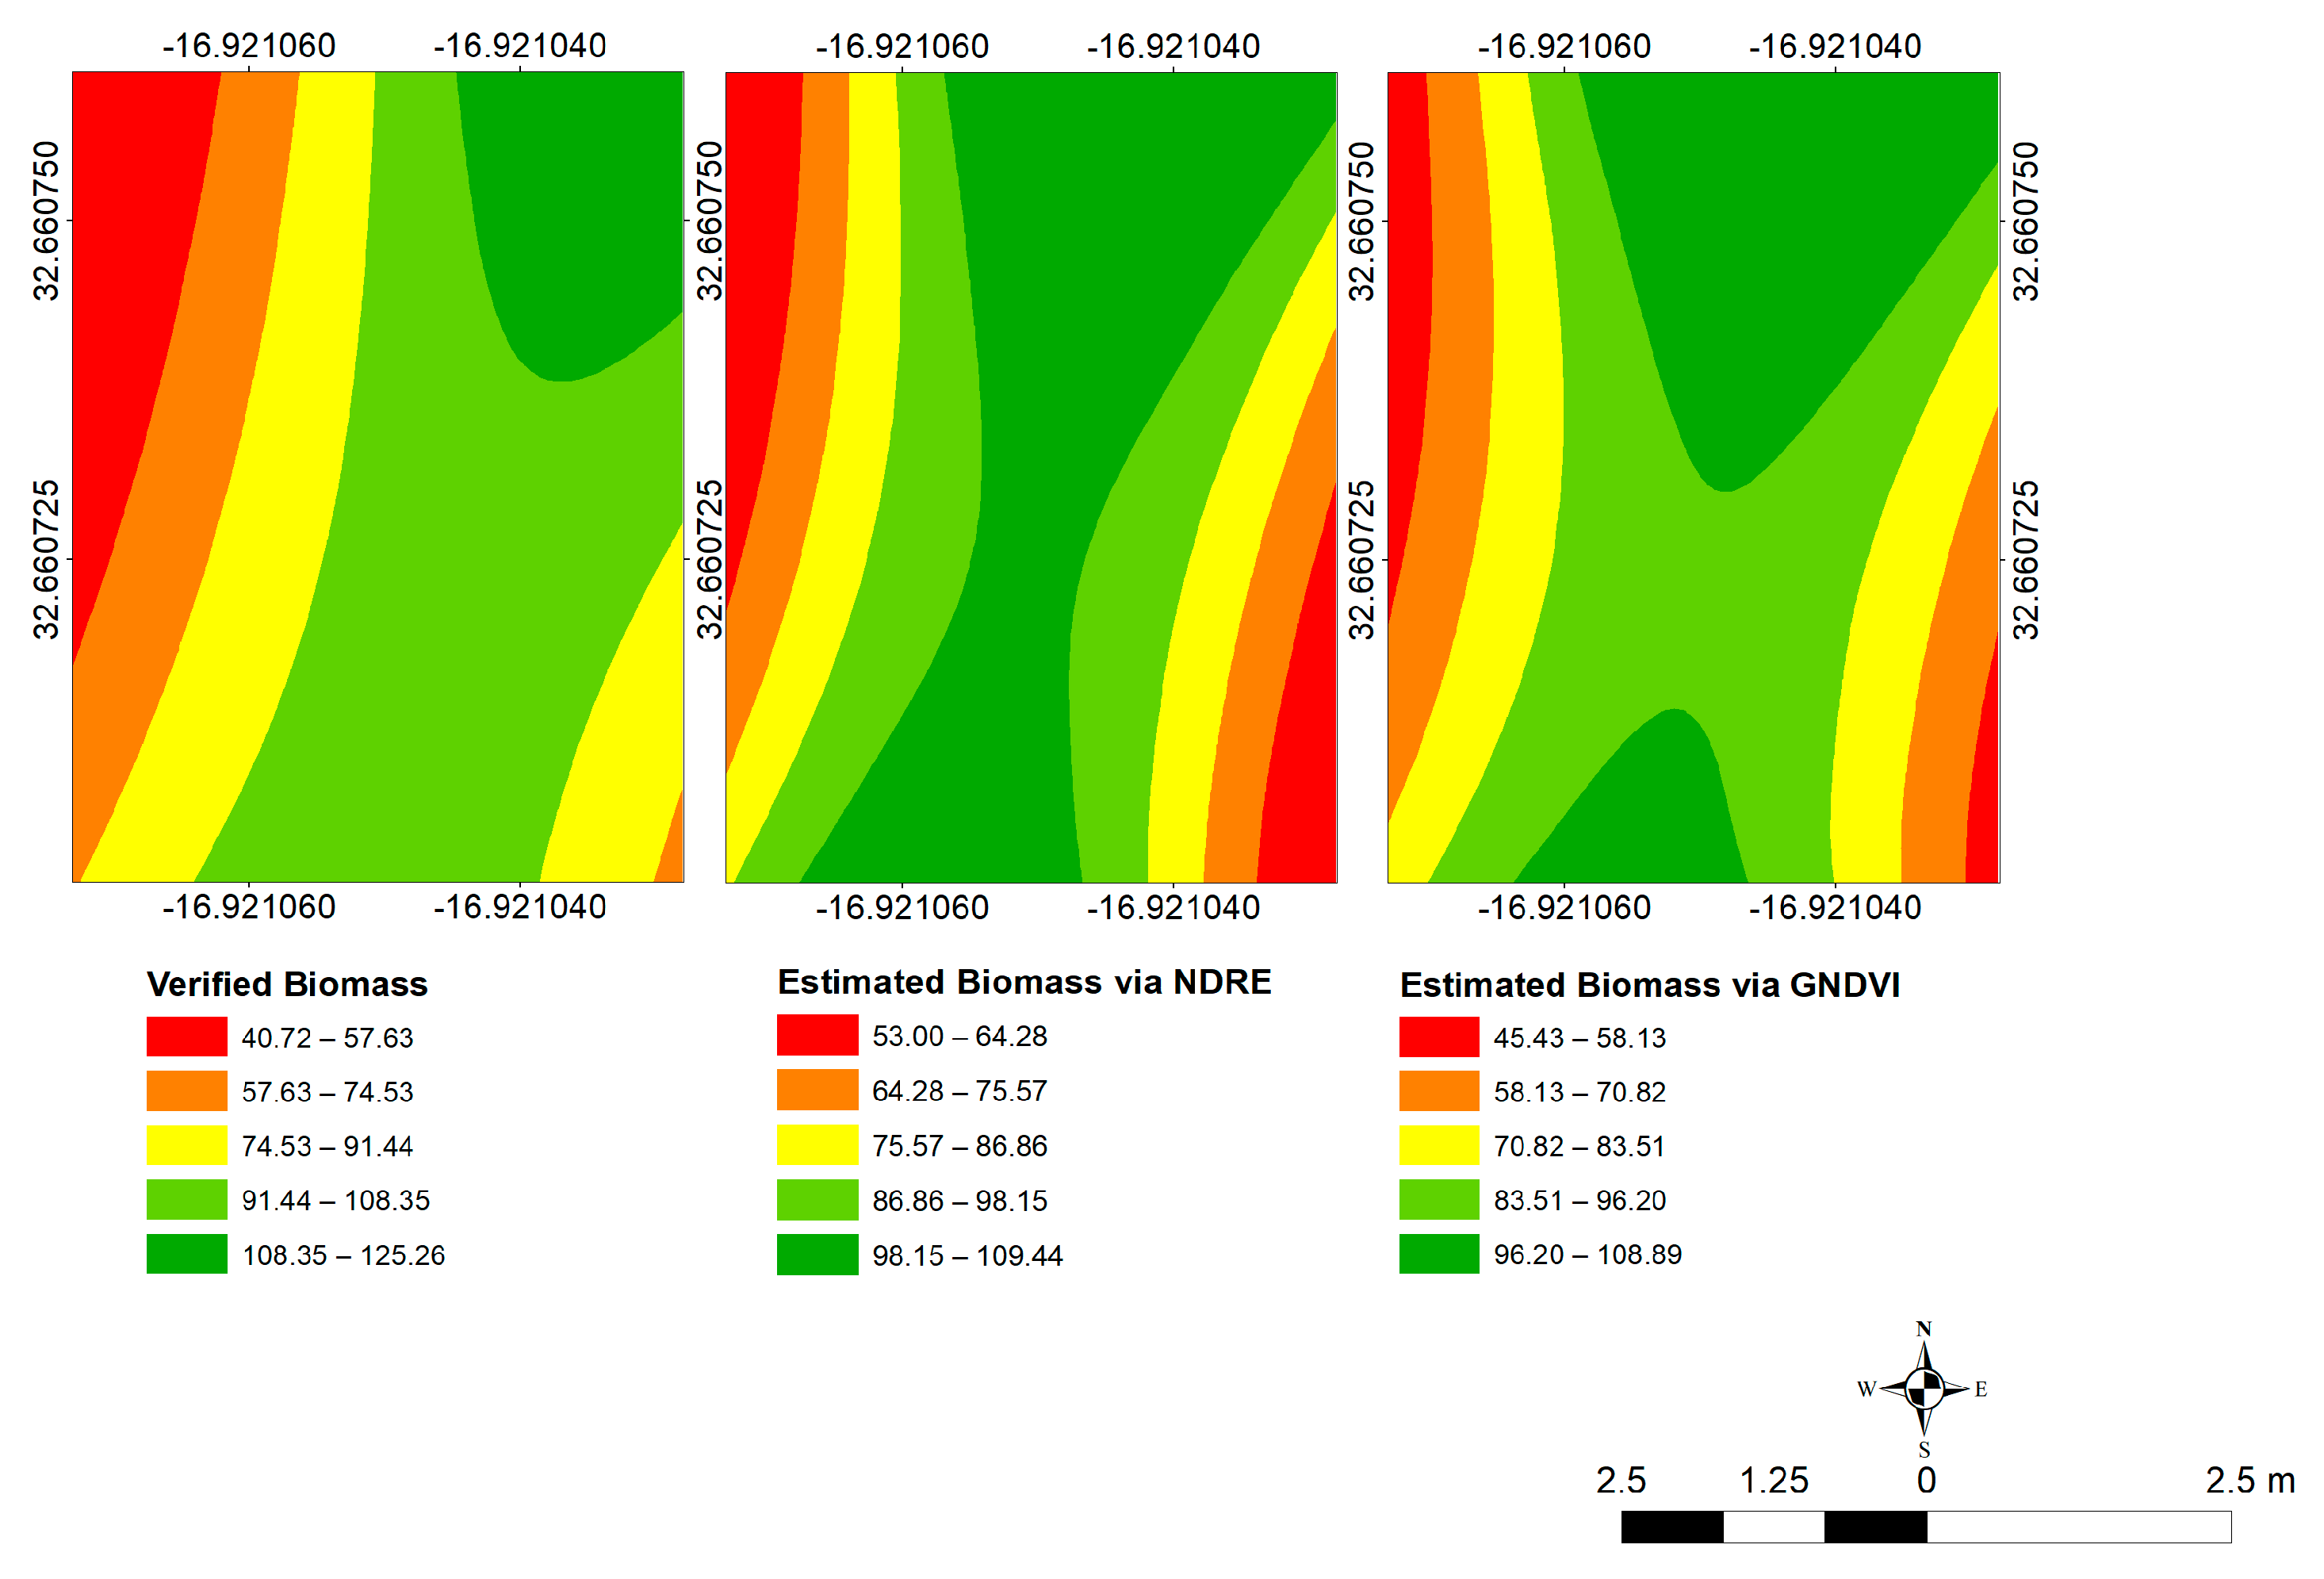
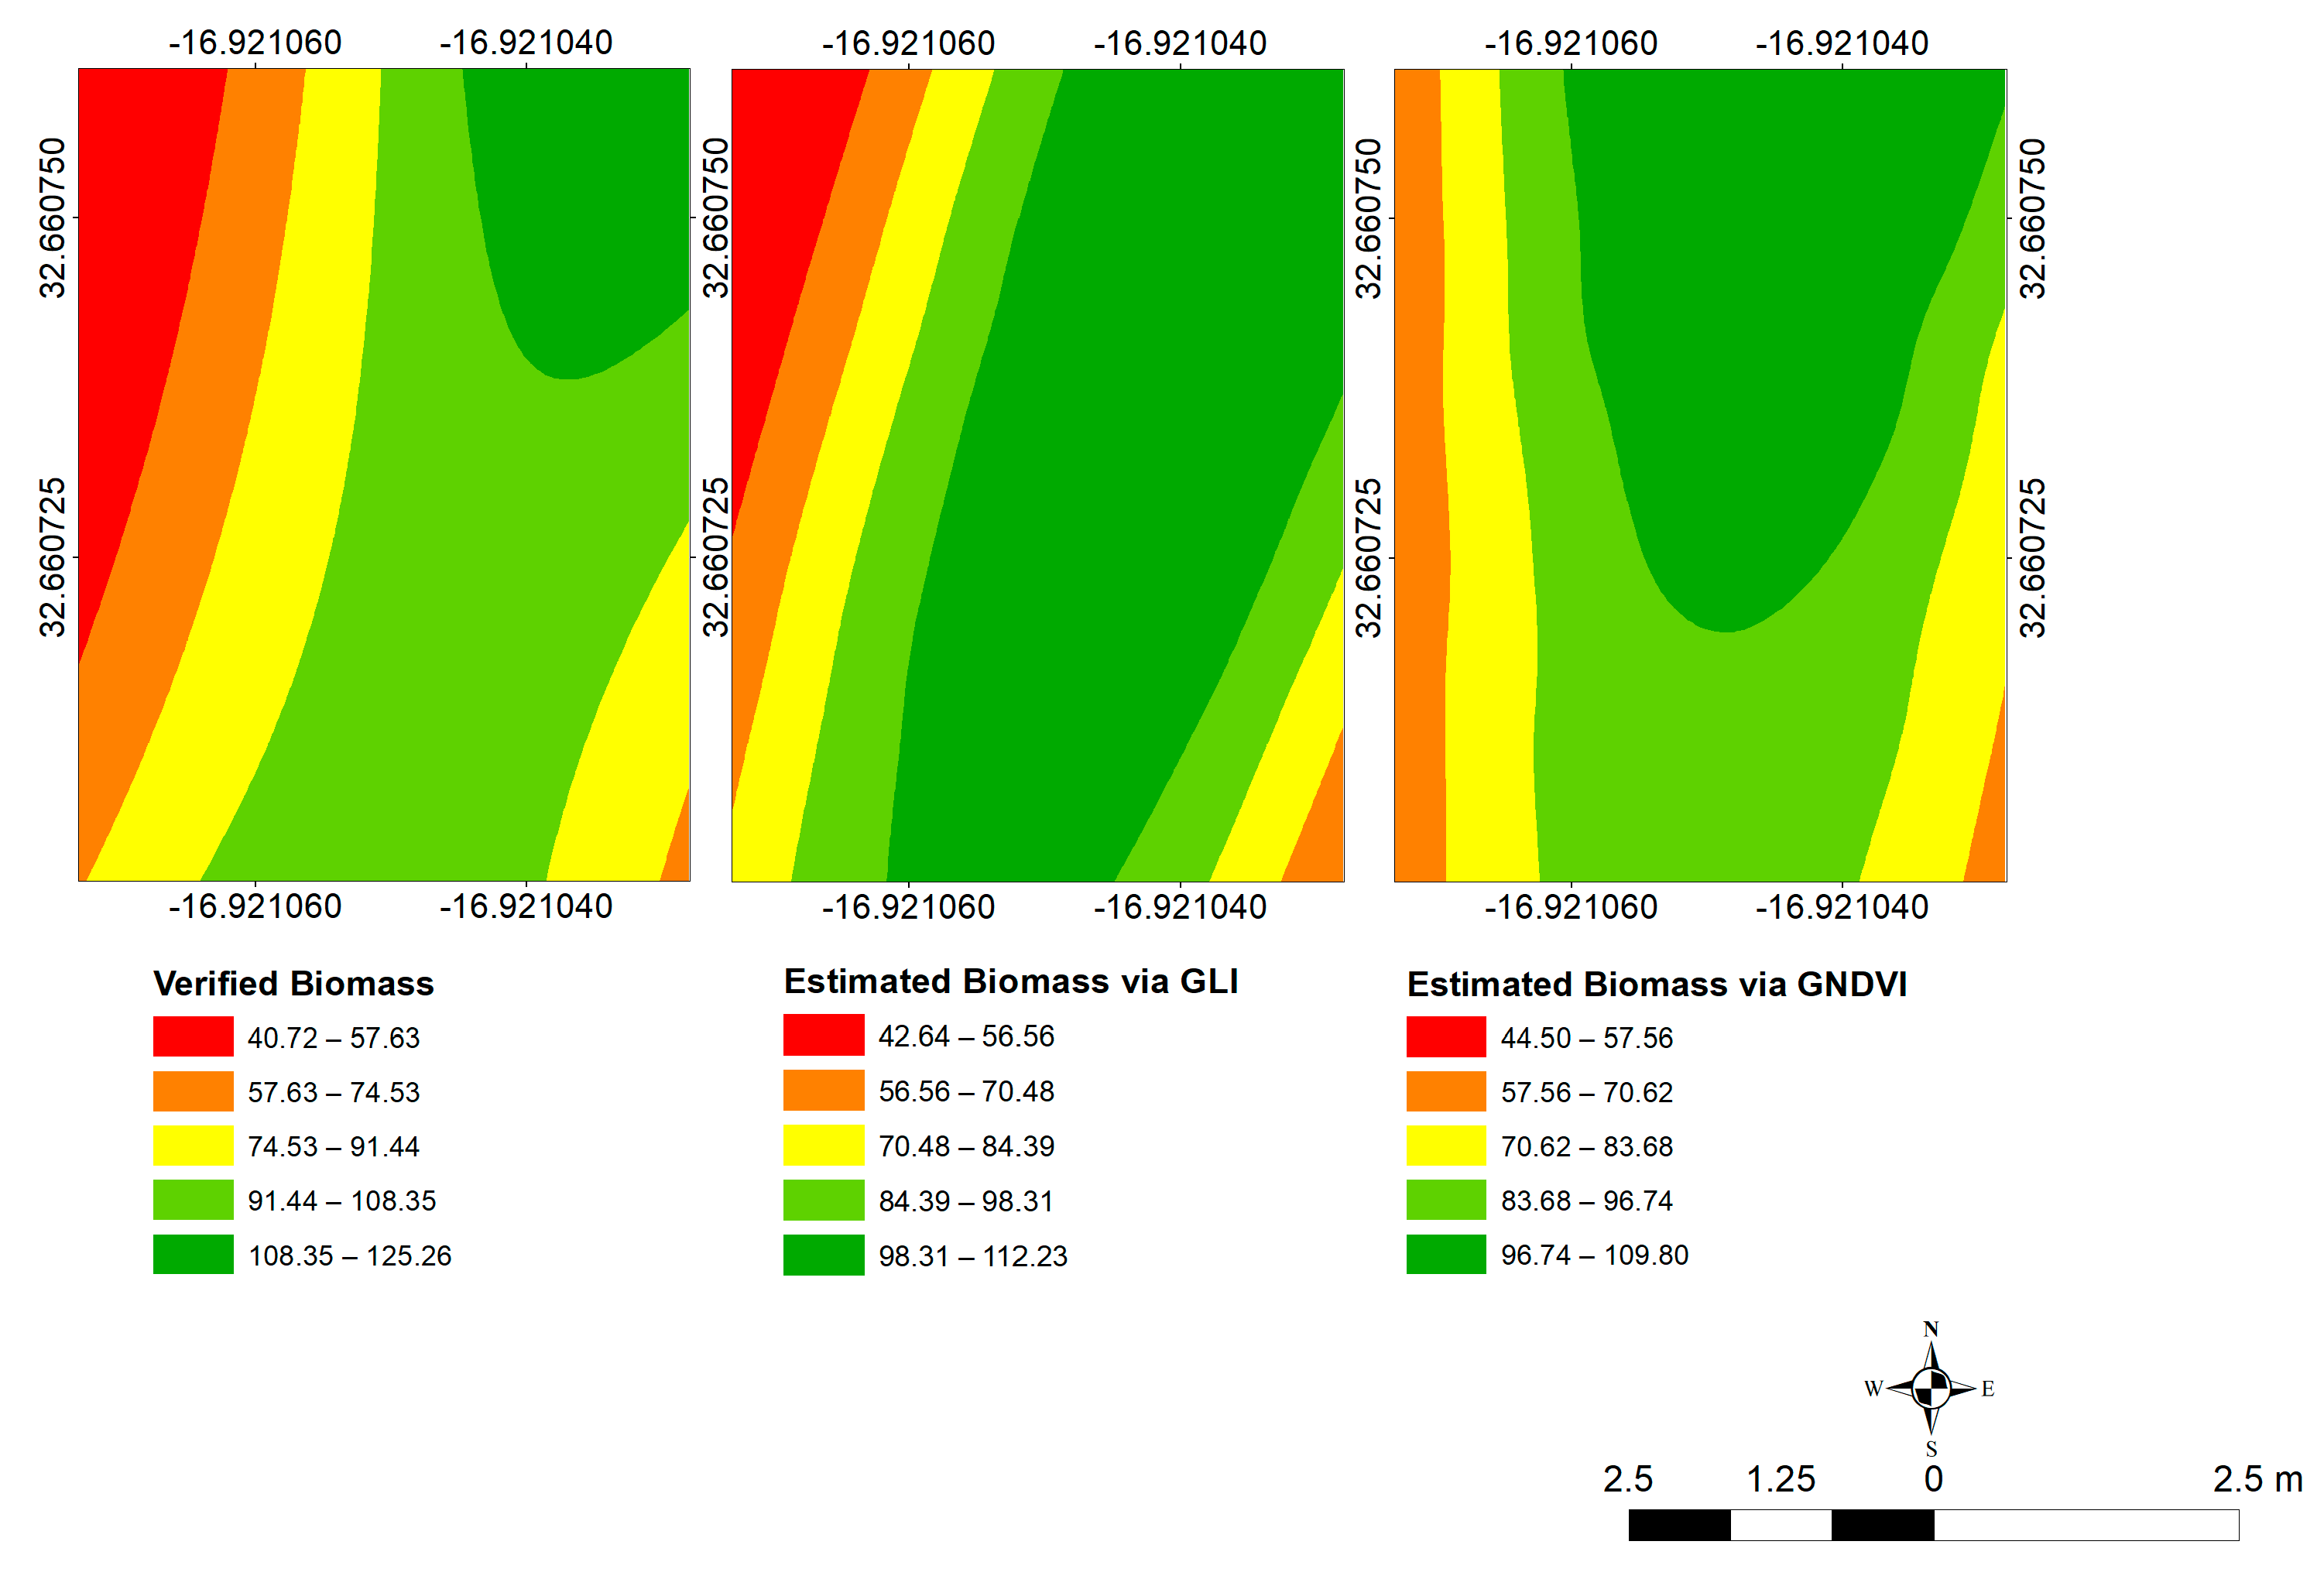
3.6. Spatialization of AGB

Spatialization of AGB was also performed, using the same type of analysis used for productivity (Figure 5). Results obtained were very similar to the productivity estimates. Analyzing the spatialization of the first analysis, it was verified that the GNDVI presents great proximity with the results of the verified biomass. In this case, the NDRE extrapolates the results and considers a central strip as the area with the highest productivity. As for the spatializations with the results from the equations of the second analysis (Figure 6), the results are different from the verified reality. As with productivity estimation, further studies should be carried out to refine the results. The comparative analysis of the indices with the observed biomass proves that the GNDVI and the NDRE show some similarity with the spatialization of observed in-the-field biomass values, although some plots obtain values that are underestimated and others overestimated.

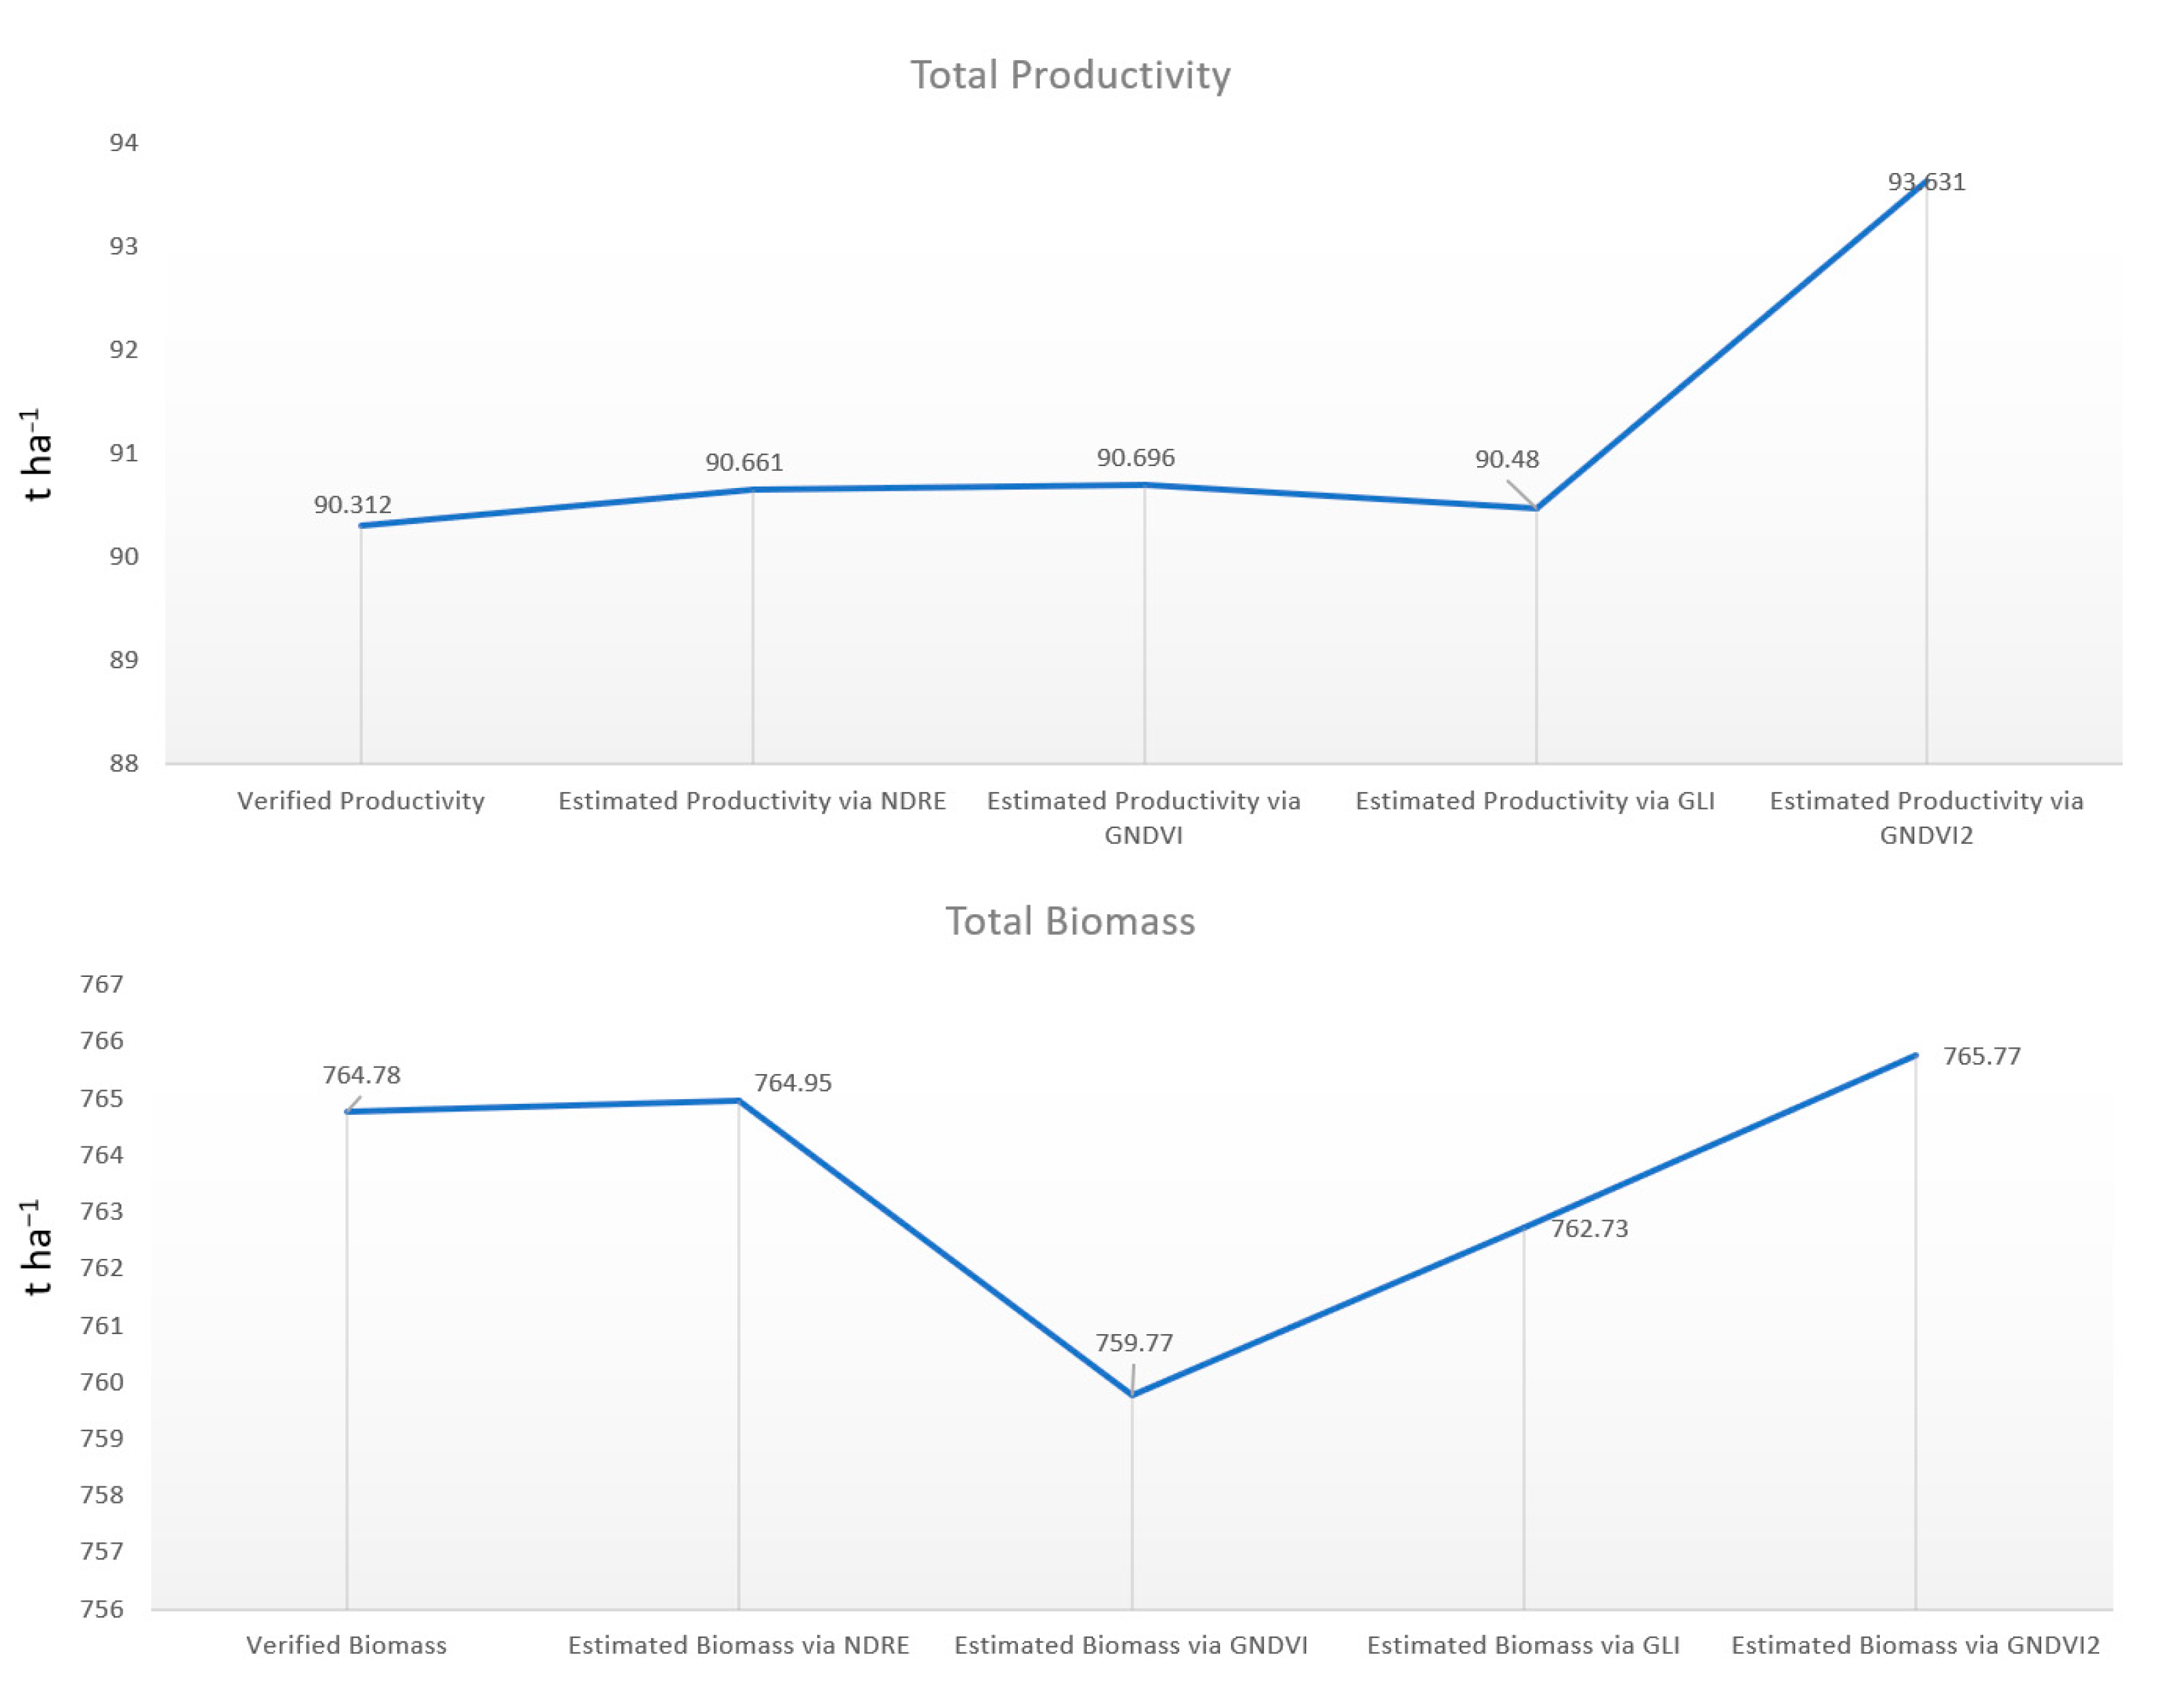
3.7. Analysis of Total Productivity and Total Biomass

To make a simple numerical comparison of the results obtained with the use of each of the formulated equations, the productivity and AGB of all the treatments of the trial were summed, resulting in a single value. This result was classified as total productivity and total biomass, respectively (Figure 7).
Analyzing initially the total yield, it was possible to note that the equation that makes use of the GLI index (second analysis) was the one that presented numerical results very close to the total verified yield; however, both the NDRE and the GNDVI were also very close to the quantified reality. The GNDVI2 extrapolated the results.
Regarding the analysis of total biomass, the index that came closest to the quantified reality was NDRE. The GNDVI and GLI obtained results well below the results obtained in the field, and again the GNDVI2 showed values above the reality quantified in the field. The results presented are promising for the use of the equation resulting from the use of NDRE.

4. Conclusions

The normalized difference vegetation index (NDVI), although being globally the most used in the present study showed much lower results than those obtained by the normalized difference red edge (NDRE) and the green difference normalized vegetation index (GNDVI). The rapid saturation of the index with areas with large amounts of biomass and the noise of water and oxygen uptake compromise the distinction between real productivity values and the above-ground biomass.
Considering that the methodology applied in the present study is relatively simple and presents results very close to reality, it can very well be applied by small rural landowners by periodically obtaining UAV images of their crop fields and processing them to estimate crop yields. It is worth mentioning again that new studies with the same theme, applied in areas with larger dimensions, can help refine the results obtained in the present study.
The use of the GNDVI and NDRE indices shows excellent results for estimating productivity as well as AGB for the corn crop, both at the spatial and numerical levels.
Obtaining a larger quantity of data (first analysis) demonstrated that spatially the results are considerably superior to a punctual data collection (second analysis). However, in terms of productivity, the equation using the GLI index provided almost identical results to the verified productivity. The possibility of predicting crop yields is an essential tool for producers, since it allows them to make timely decisions to correct any deficit present in their agricultural plots. Further, this paper contributes to the robustness of the database, and to the modeling, training, and integration of AI for drone digital optimization.

Author Contributions

Conceptualization: F.L.M. and M.A.A.P.d.C.; Investigation: F.L.M., J.G.R.d.F., H.N., L.P. and J.R.; Writing—original draft preparation: F.L.M.; Writing—review and editing; C.R., F.L.M. and M.A.A.P.d.C.; Supervision: M.A.A.P.d.C.; Funding acquisition: M.A.A.P.d.C. All authors have read and agreed to the published version of the manuscript.

Funding

This research was funded by Programa Operacional Madeira 14-20, Portugal 2020, and the European Union through the European Regional Development Fund, grant number M1420-01-0145-FEDER-000011 [CASBio]; Cooperation Program INTERREG-MAC 2014-2020, with European Funds for Regional Development-FEDER [MAC2/1.1.b/226—APOGEO and MAC2/3.5b/307—VERCOCHAR.

Institutional Review Board Statement

Not applicable.

Data Availability Statement

Not applicable.

Acknowledgments

The authors acknowledge the support of National Funds FCT-Portuguese Foundation for Science and Technology, under the projects UIDB/04033/2020 and UIDP/04033/2020.

Conflicts of Interest

The authors declare no conflict of interest.

References

  1. Jin, X.; Yang, G.; Li, Z.; Xu, X.; Wang, J.; Lan, Y. Estimation of Water Productivity in Winter Wheat Using the AquaCrop Model with Field Hyperspectral Data. Precis. Agric. 2018, 19, 1–17. [Google Scholar] [CrossRef]
  2. Donald, C.M.; Hamblin, J. The Biological Yield and Harvest Index of Cereals as Agronomic and Plant Breeding Criteria. Adv. Agron. 1976, 28, 361–405. [Google Scholar] [CrossRef]
  3. Yue, J.; Feng, H.; Li, Z.; Zhou, C.; Xu, K. Mapping Winter-Wheat Biomass and Grain Yield Based on a Crop Model and UAV Remote Sensing. Int. J. Remote Sens. 2021, 42, 1577–1601. [Google Scholar] [CrossRef]
  4. Battude, M.; Al Bitar, A.; Morin, D.; Cros, J.; Huc, M.; Marais Sicre, C.; Le Dantec, V.; Demarez, V. Estimating Maize Biomass and Yield over Large Areas Using High Spatial and Temporal Resolution Sentinel-2 like Remote Sensing Data. Remote Sens. Environ. 2016, 184, 668–681. [Google Scholar] [CrossRef]
  5. Jin, X.; Kumar, L.; Li, Z.; Feng, H.; Xu, X.; Yang, G.; Wang, J. A Review of Data Assimilation of Remote Sensing and Crop Models. Eur. J. Agron. 2018, 92, 141–152. [Google Scholar] [CrossRef]
  6. Yang, S.; Feng, Q.; Liang, T.; Liu, B.; Zhang, W.; Xie, H. Modeling Grassland Above-Ground Biomass Based on Artificial Neural Network and Remote Sensing in the Three-River Headwaters Region. Remote Sens. Environ. 2018, 204, 448–455. [Google Scholar] [CrossRef]
  7. Araus, J.L.; Cairns, J.E. Field High-Throughput Phenotyping: The New Crop Breeding Frontier. Trends Plant Sci. 2014, 19, 52–61. [Google Scholar] [CrossRef] [PubMed]
  8. Sankaran, S.; Khot, L.R.; Espinoza, C.Z.; Jarolmasjed, S.; Sathuvalli, V.R.; Vandemark, G.J.; Miklas, P.N.; Carter, A.H.; Pumphrey, M.O.; Knowles, N.R.; et al. Low-Altitude, High-Resolution Aerial Imaging Systems for Row and Field Crop Phenotyping: A Review. Eur. J. Agron. 2015, 70, 112–123. [Google Scholar] [CrossRef]
  9. Guerini Filho, M.; Kuplich, T.M.; Quadros, F.L.F.D. Estimating Natural Grassland Biomass by Vegetation Indices Using Sentinel 2 Remote Sensing Data. Int. J. Remote Sens. 2020, 41, 2861–2876. [Google Scholar] [CrossRef]
  10. Pan, Z.; Huang, J.; Zhou, Q.; Wang, L.; Cheng, Y.; Zhang, H.; Blackburn, G.A.; Yan, J.; Liu, J. Mapping Crop Phenology Using NDVI Time-Series Derived from HJ-1 A/B Data. Int. J. Appl. Earth Obs. Geoinf. 2015, 34, 188–197. [Google Scholar] [CrossRef]
  11. Moreira, M.A. Fundamentos do Sensoriamento Remoto e Metodologias de Aplicação, 4th ed.; UFV Press: Viçosa, Brazil, 2011; ISBN 978-85-7269-381-3. [Google Scholar]
  12. Macedo, F.L.; Sousa, A.M.O.; Gonçalves, A.C.; Marques da Silva, J.R.; Mesquita, P.A.; Rodrigues, R.A.F. Above-Ground Biomass Estimation for Quercus rotundifolia Using Vegetation Indices Derived from High Spatial Resolution Satellite Images. Eur. J. Remote Sens. 2018, 51, 932–944. [Google Scholar] [CrossRef]
  13. Henriques, H.J.R.; Schwambach, D.A.; Fernandes, V.J.M.; Cortez, J.W. Vegetation Indices and Their Correlation with Second-Crop Corn Grain Yield in Mato Grosso Do Sul, Brazil. RBMS 2021, 20, 13. [Google Scholar] [CrossRef]
  14. Bian, J.; Zhang, Z.; Chen, J.; Chen, H.; Cui, C.; Li, X.; Chen, S.; Fu, Q. Simplified Evaluation of Cotton Water Stress Using High Resolution Unmanned Aerial Vehicle Thermal Imagery. Remote Sens. 2019, 11, 267. [Google Scholar] [CrossRef]
  15. Macedo, F.L.; Pinheiro de Carvalho, M.A.A.; Nóbrega, H.G.M. Evaluation of the Water Status of the Vine Crop, Using the CWSIsi (Crop Water Stress Index Simplified). In Proceedings of the 7th International Congress of Mountain and Steep Slopes Viticulture, Vila Real, Portugal, 12–14 May 2022; pp. 322–325, ISBN 978-989-704-471-7. [Google Scholar]
  16. Caruso, G.; Tozzini, L.; Rallo, G.; Primicerio, J.; Moriondo, M.; Palai, G.; Gucci, R. Estimating Biophysical and Geometrical Parameters of Grapevine Canopies (‘Sangiovese’) by an Unmanned Aerial Vehicle (UAV) and VIS-NIR Cameras. VITIS—J. Grapevine Res. 2017, 56, 63–70. [Google Scholar] [CrossRef]
  17. Gil-Pérez, B.; Zarco-Tejada, P.J.; Correa-Guimaraes, A.; Relea-Gangas, E.; Navas-Gracia, L.M.; Hernández-Navarro, S.; Sanz-Requena, J.F.; Berjón, A.; Martín-Gil, J. Remote Sensing Detection of Nutrient Uptake in Vineyards Using Narrow-Band Hyperspectral Imagery. Vitis 2010, 49, 167–173. [Google Scholar]
  18. Pinheiro De Carvalho, M.A.A.; Ragonezi, C.; De Macedo, F.L.; Antunes, G.N.; Freitas, G.; Nóbrega, H. Contributo para o conhecimento da agrodiversidade no concelho de Santa Cruz, Madeira. Rev. Ciênc. Agrárias 2019, 42, 575–605. [Google Scholar] [CrossRef]
  19. Pinheiro de Carvalho, M.A.A.; Macedo, F.L.; Nóbrega, H.G.M.; Freitas, J.G.R.; Antunes, G.N.M.; Gouveia, C.S.S.; Ganança, J.F.T. Agrodiversidade, Variedades Regionais Madeira; Centro ISOPlexis e ACOESTE, Gesto, Artes Gráficas: Estreito de Câmara de Lobos, Portugal, 2022; ISBN 978-989-33-2868-2. [Google Scholar]
  20. Pinheiro de Carvalho, M.Â.A.; Ganança, J.F.T.; Abreu, I.; Sousa, N.F.; dos Santos, T.M.M.; Clemente Vieira, M.R.; Motto, M. Evaluation of the Maize (Zea mays L.) Diversity on the Archipelago of Madeira. Genet. Resour. Crop Evol. 2008, 55, 221–233. [Google Scholar] [CrossRef]
  21. Pinheiro de Carvalho, M.A.A.; Sardinha, C.; Gouveia, C.S.S.; Nóbrega, H.G.M.; Ganança, J.F.T.; Nóbrega, S.; dos Santos, T.M. Phenotyping the Ideotypes of Two Maize Landraces from Madeira Archipelago Using Morpho-Agronomic Traits and Zein Pattern. Maydica 2019, 63, 13. [Google Scholar]
  22. Magalhães, P.C.; Durães, F.O.M. Fisiologia Produção de Milho; EMBRAPA Milho e Sorgo: Sete Lagoas, Brazil, 2006. [Google Scholar]
  23. Rouse, J.W.; Haas, R.H.; Schell, J.A.; Deering, D.W. Monitoring Vegetation Systems in the Great Plains with ERTS. In Third Earth Resources Technology Satellite-1 Symposium: The Proceedings of a Symposium Held by Goddard Space Flight Center; NASA Special Publications: Washington, DC, USA, 1973; pp. 309–318. [Google Scholar]
  24. Louhaichi, M.; Borman, M.M.; Johnson, D.E. Spatially Located Platform and Aerial Photography for Documentation of Grazing Impacts on Wheat. Geocarto Int. 2001, 16, 65–70. [Google Scholar] [CrossRef]
  25. Gitelson, A.A.; Kaufman, Y.J.; Merzlyak, M.N. Use of a Green Channel in Remote Sensing of Global Vegetation from EOS-MODIS. Remote Sens. Environ. 1996, 58, 289–298. [Google Scholar] [CrossRef]
  26. Gitelson, A.; Merzlyak, M.N. Spectral Reflectance Changes Associated with Autumn Senescence of Aesculus Hippocastanum L. and Acer Platanoides L. Leaves. Spectral Features and Relation to Chlorophyll Estimation. J. Plant Physiol. 1994, 143, 286–292. [Google Scholar] [CrossRef]
  27. Tucker, C.J. Red and Photographic Infrared l, Lnear Combinations for Monitoring Vegetation. Remote Sens. Environ. 1979, 8, 127–150. [Google Scholar] [CrossRef]
  28. The Jamovi Project. Jamovi (Version 2.3.16) [Computer Software]. 2022. Available online: https://www.jamovi.org (accessed on 27 April 2023).
  29. Devore, J.L.; Cordeiro, M.T.A. Probabilidade e Estatística: Para Engenharia e Ciências; Cengage Learning: São Paulo, Brazil, 2006; ISBN 9788522104598. [Google Scholar]
  30. Magney, T.S.; Eitel, J.U.H.; Huggins, D.R.; Vierling, L.A. Proximal NDVI derived phenology improves in-season predictions of wheat quantity and quality. Agric. For. Meteorol. 2016, 217, 46–60. [Google Scholar] [CrossRef]
  31. Geipel, J.; Link, J.; Wirwahn, J.A.; Chaupein, W. A Programmable Aerial Multiespectral Camara System for In-Season Crop Biomass and Nitrogen Content Estimation. Agriculture 2016, 6, 4. [Google Scholar] [CrossRef]
  32. Gitelson, A.A.; Merzlyak, M.N. Signature Analysis of Leaf Reflectance Spectra: Algorithm Development for Remote Sensing of Chlorophyll. J. Plant Physiol. 1996, 148, 494–500. [Google Scholar] [CrossRef]
  33. Zhou, X.; Zheng, H.B.; Xu, X.Q.; He, J.Y.; Ge, X.K.; Yao, X.; Cheng, T.; Zhu, Y.; Cao, W.X.; Tian, Y.C. Predicting Grain Yield in Rice Using Multi-Temporal Vegetation Indices from UAV-Based Multispectral and Digital Imagery. ISPRS J. Photogramm. Remote Sens. 2017, 130, 246–255. [Google Scholar] [CrossRef]
  34. Khosravirad, M.; Omid, M.; Sarmadian, F.; Hosseinpour, S. Predicting Sugarcane Yields in Khuzestan Using a Large Time-Series of Remote Sensing Imagery Region. Int. Arch. Photogramm. Remote Sens. Spat. Inf. Sci. 2019, XLII-4/W18, 645–648. [Google Scholar] [CrossRef]
  35. Sankaran, S.; Zhou, J.; Khot, L.R.; Trapp, J.J.; Mndolwa, E.; Miklas, P.N. High-Throughput Field Phenotyping in Dry Bean Using Small Unmanned Aerial Vehicle Based Multispectral Imagery. Comput. Electron. Agric. 2018, 151, 84–92. [Google Scholar] [CrossRef]
  36. Marques Ramos, A.P.; Prado Osco, L.; Elis Garcia Furuya, D.; Nunes Gonçalves, W.; Cordeiro Santana, D.; Pereira Ribeiro Teodoro, L.; Antonio da Silva Junior, C.; Fernando Capristo-Silva, G.; Li, J.; Henrique Rojo Baio, F.; et al. A random forest ranking approach to predict yield in maize with uav-based vegetation spectral indices. Comput. Electron. Agric. 2020, 178, 105791. [Google Scholar] [CrossRef]
  37. Kayad, A.; Sozzi, M.; Gatto, S.; Marinello, F.; Pirotti, F. Monitoring Within-Field Variability of Corn Yield using Sentinel-2 and Machine Learning Techniques. Remote Sens. 2019, 11, 2873. [Google Scholar] [CrossRef]
  38. Schwalbert, R.A.; Amado, T.J.C.; Nieto, L.; Varela, S.; Corassa, G.M.; Horbe, T.A.N.; Rice, C.W.; Peralta, N.R.; Ciampitti, I.A. Forecasting maize yield at field scale based on high-resolution satellite imagery. Biosyst. Eng. 2018, 171, 179–192. [Google Scholar] [CrossRef]
  39. Peralta, N.R.; Assefa, Y.; Du, J.; Barden, C.J.; Ciampitti, I.A. Mid-season high-resolution satellite imagery for forecasting site specific corn yield. Remote Sens. 2016, 8, 848. [Google Scholar] [CrossRef]
  40. Zhang, X.; He, Y.; Wang, C.; Xu, F.; Li, X.; Tan, C.; Chen, D.; Wang, G.; Shi, L. Estimation of Corn Canopy Chlorophyll Content Using Derivative Spectra in the O2—A Absorption Band. Front. Plant Sci. 2019, 10, 1047. [Google Scholar] [CrossRef]
  41. Taskos, D.G.; Koundouras, S.; Stamatiadis, S.; Zioziou, E.; Nikolaou, N.; Karakioulakis, K.; Theodorou, N. Using Active Canopy Sensors and Chlorophyll Meters to Estimate Grapevine Nitrogen Status and Productivity. Precis. Agric. 2015, 16, 77–98. [Google Scholar] [CrossRef]
  42. Maresma, Á.; Ariza, M.; Martínez, E.; Lloveras, J.; Martínez-Casasnovas, J. Analysis of Vegetation Indices to Determine Nitrogen Application and Yield Prediction in Maize (Zea mays L.) from a Standard UAV Service. Remote Sens. 2016, 8, 973. [Google Scholar] [CrossRef]
  43. Vian, A.L.; Bredemeier, C.; Silva, P.R.F.D.; Santi, A.L.; Silva, C.P.G.D.; Santos, F.L.D. Limites críticos de NDVI para estimativa do potencial produtivo do milho. RBMS 2018, 17, 91. [Google Scholar] [CrossRef]
  44. Wahab, I.; Hall, O.; Jirström, M. Remote Sensing of Yields: Application of UAV Imagery-Derived NDVI for Estimating Maize Vigor and Yields in Complex Farming Systems in Sub-Saharan Africa. Drones 2018, 2, 28. [Google Scholar] [CrossRef]
  45. Rahman, M.M.; Robson, A.J. A Novel Approach for Sugarcane Yield Prediction Using Landsat Time Series Imagery: A Case Study on Bundaberg Region. ARS 2016, 05, 93–102. [Google Scholar] [CrossRef]
  46. Li, F.; Miao, Y.; Feng, G.; Yuan, F.; Yue, S.; Gao, X.; Liu, Y.; Liu, B.; Ustin, S.L.; Chen, X. Improving Estimation of Summer Maize Nitrogen Status with Red Edge-Based Spectral Vegetation Indices. Field Crops Res. 2014, 157, 111–123. [Google Scholar] [CrossRef]
  47. Duan, B.; Liu, Y.; Gong, Y.; Peng, Y.; Wu, X.; Zhu, R.; Fang, S. Remote Estimation of Rice LAI Based on Fourier Spectrum Texture from UAV Image. Plant Methods 2019, 15, 124. [Google Scholar] [CrossRef]
  48. Cordero, E.; Moretti, B.; Miniotti, E.F.; Tenni, D.; Beltarre, G.; Romani, M.; Sacco, D. Fertilisation Strategy and Ground Sensor Measurements to Optimise Rice Yield. Eur. J. Agron. 2018, 99, 177–185. [Google Scholar] [CrossRef]
  49. Saravia, D.; Salazar, W.; Valqui-Valqui, L.; Quille-Mamani, J.; Porras-Jorge, R.; Corredor, F.-A.; Barboza, E.; Vásquez, H.V.; Arbizu, C.I. Yield Predictions of Four Hybrids of Maize (Zea mays) Using Multispectral Images Obtained from RPAS in the Coast of Peru. Biology 2022, 2022050231. [Google Scholar]
  50. Peng, Y.; Gitelson, A.A. Remote Estimation of Gross Primary Productivity in Soybean and Maize Based on Total Crop Chlorophyll Content. Remote Sens. Environ. 2012, 117, 440–448. [Google Scholar] [CrossRef]
Figure 1. Experimental design of the study area with different doses of organic compost.
Agriculture 13 01115 g001
Figure 2. Evolution of their spectral behavior throughout the entire cycle of the crop.
Agriculture 13 01115 g002
Figure 3. Verified and estimated productivity via vegetation indices (t ha−1) (first analysis).
Agriculture 13 01115 g003
Figure 4. Verified and estimated productivity via vegetation indices (t ha−1) (second analysis).
Agriculture 13 01115 g004
Figure 5. Verified and estimated biomass via vegetation indices (t ha−1) (first analysis).
Agriculture 13 01115 g005
Figure 6. Verified and estimated biomass via vegetation indices (t ha−1) (second analysis).
Agriculture 13 01115 g006
Figure 7. Numerical comparison of the results obtained with the use of each of the formulated equations.
Agriculture 13 01115 g007
Table 1. Flight mission details.
FlightsDateGrowth Stage
(DAS)
Wind
Speed
(km/h)
Images
Collected
Point Density
(pt/cm2)
GSD
(cm·pix−1)
110 February 202206.216480.1761.06
218 April 2022604.317100.1211.44
318 May 2022907.413320.161.25
427 June 20221308.711760.1851.16
Note: DAS: days after sowing; GSD: ground sample distance.
Table 2. Vegetation indices were used.
IndexFormulaReference
Normalized Difference Vegetation
Index
NDVI = ( N i r     R e d ) ( N i r   +   R e d ) [23]
Green Leaf Index GLI = ( 2   X   G r e e n     R e d     B l u e ) ( 2   X   G r e e n   +   R e d   +   B l u e ) [24]
Green Normalized Vegetation
Index
GNDVI = ( N i r     G r e e n ) ( N i r   +   G r e e n ) [25]
Normalized Difference Red Edge NDRE = ( N i r     R e ) ( N i r   +   R e ) [26]
Normalized Green Red Difference Index NGRDI = ( G r e e n     R e d ) ( G r e e n   +   R e d ) [27]
Note: Blue—blue reflectance; Green—green reflectance; Red—red reflectance; Re—red edge reflectance; Nir—near-infrared reflectance.
Table 3. Effects of organic compost dosages on the corn crop.
TreatmentsProductivity (t ha−1)Biomass (t ha−1)
Control7.32 ± 3.74 a67.78 ± 19.92 a
T110.96 ± 6.57 a90.94 ± 25.36 a
T211.80 ± 6.12 a96.19 ± 32.15 a
Note: Means followed by the same letter do not differ by the Scott–Knott test at a 5% probability level of error. Average ± standard deviation.
Table 4. Pearson’s correlation matrix between the study variables.
ProductivityAGBNDVIGLIGNDVINDRENGRDI
1st analysisProductivity
AGB0.911 ***
NDVI0.719 *0.605
GLI0.153−0.0540.666
GNDVI0.859 **0.758 *0.944 ***0.544
NDRE0.809 **0.695 *0.936 ***0.4990.953 ***
NGRDI0.4010.1850.8620.8690.701 *0.724
2nd analysisProductivity
AGB0.911 ***
NDVI−0.399−0.537
GLI−0.820 **−0.841 **0.361
GNDVI0.834 **0.701 *−0.073−0.631
NDRE0.4000.3050.459−0.5220.484
NGRDI−0.555−0.6660.6360.650−0.5540.153
Note: correlation is significant when: * p < 0.05, ** p < 0.01, *** p < 0.001.
Table 5. Average corn productivity and biomass calculated via vegetation indices.
AnalysisEquationsR2RMSE (t ha−1)
1st analysis P r o d u c t i v i t y = 74.4 + 131.8 X   ( G N D V I ) 0.7383.04
P r o d u c t i v i t y = 27 + 105.7 X   ( N D R E ) 0.6543.50
Productivity = 66 + 100 X   ( NDVI ) 0.5174.13
Biomass = 279 + 567 X   ( GNDVI ) 0.70119
Productivity = 70.7 + 443.9 X   ( NDRE ) 0.63220.9
2nd analysis Productivity = 75.2 187.1 X   ( GLI ) 0.6733.40
Productivity = 159 + 261 X   ( GNDVI 2 ) 0.6953.29
Biomass = 411 937 X   ( GLI ) 0.70815.7
Biomasss = 612 + 1074 X GNDVI 2   * 0.49220.7
* GNDVI2 corresponds to the same equation as GNDVI, the number 2 was added just to differentiate the first from the second analysis.
Disclaimer/Publisher’s Note: The statements, opinions and data contained in all publications are solely those of the individual author(s) and contributor(s) and not of MDPI and/or the editor(s). MDPI and/or the editor(s) disclaim responsibility for any injury to people or property resulting from any ideas, methods, instructions or products referred to in the content.

