

The Quality of Winter Wheat Grain by Different Sowing Strategies and Nitrogen Fertilizer Rates: A Case Study in Northeastern Poland

Abstract
:1. Introduction
2. Materials and Methods
2.1. Field Experiment
2.2. Grain Analysis
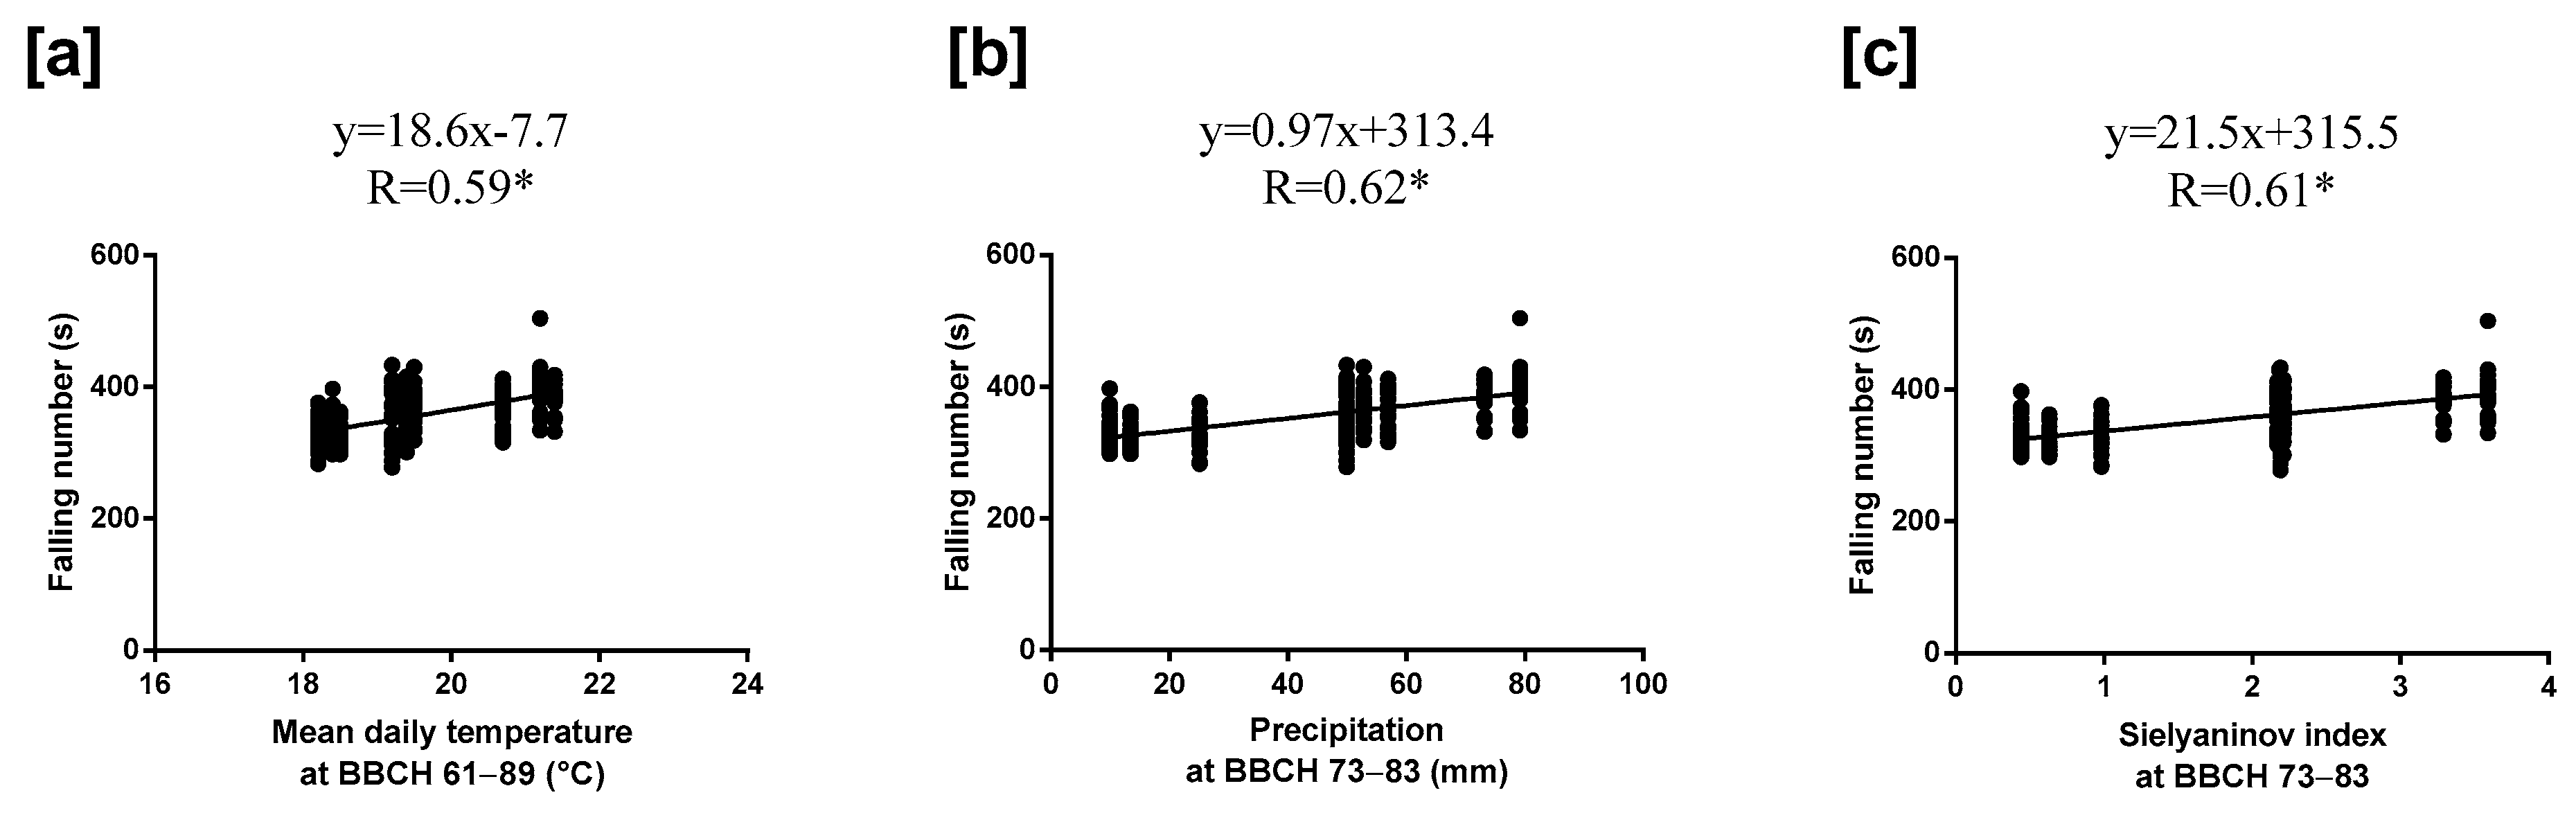
2.3. Weather Conditions
2.4. Statistical Analysis
3. Results
3.1. Weather Conditions
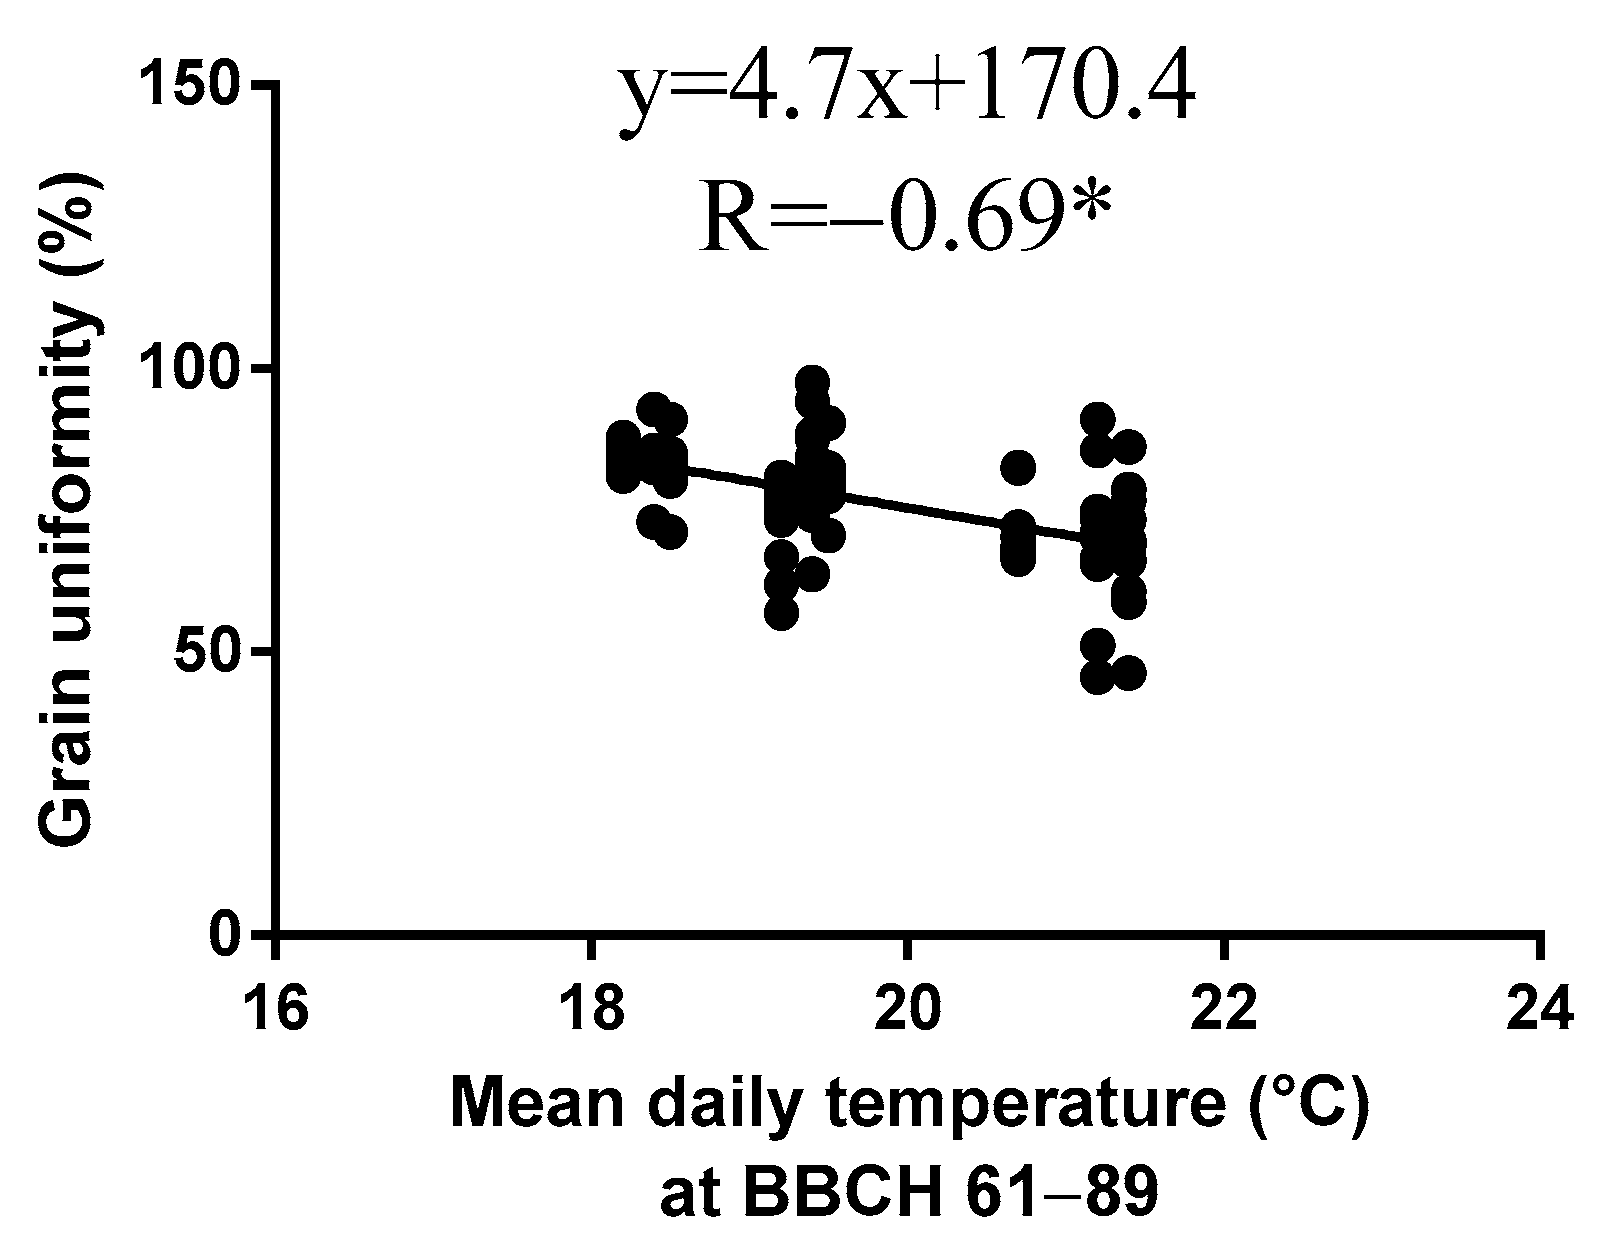
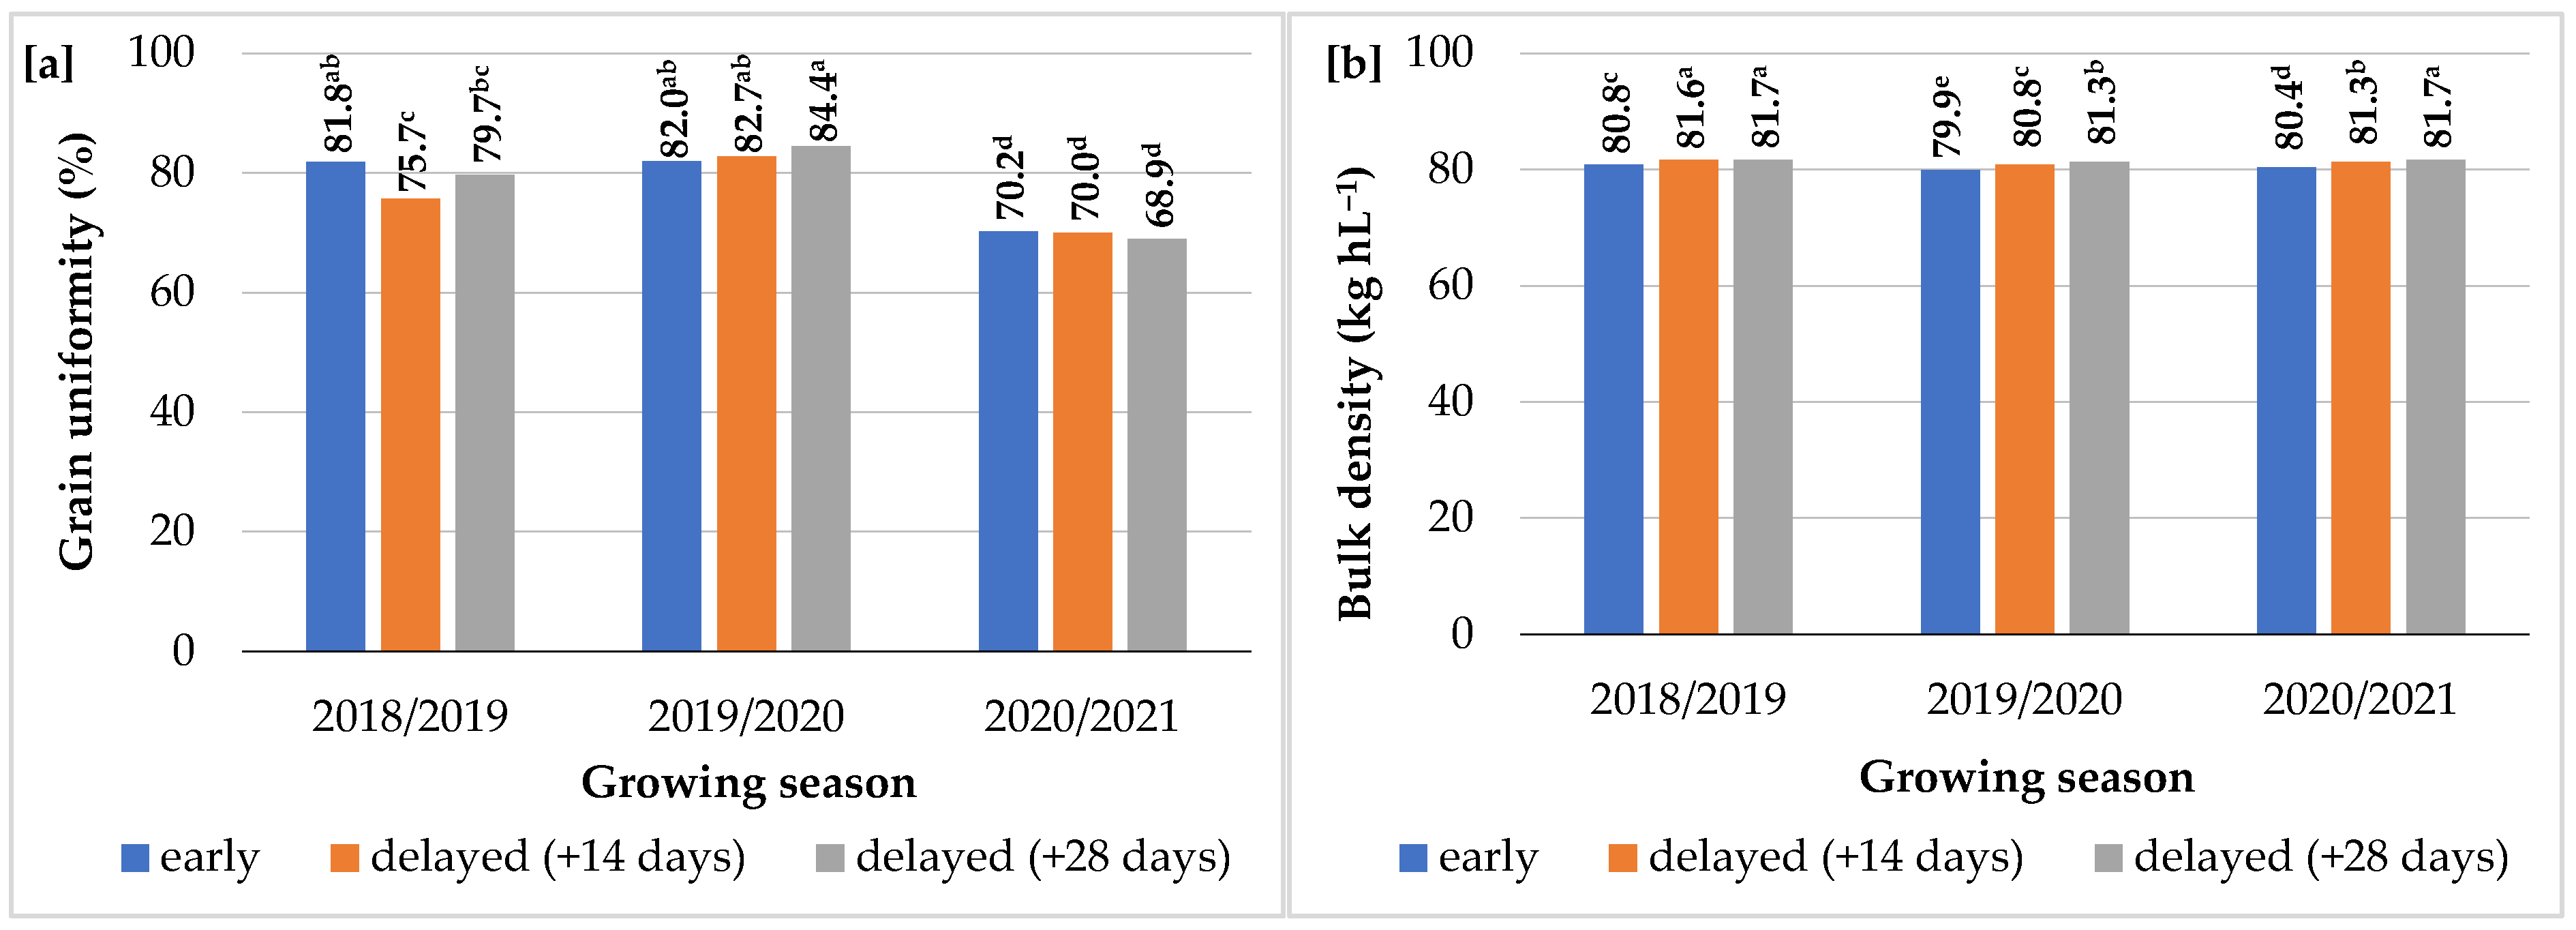
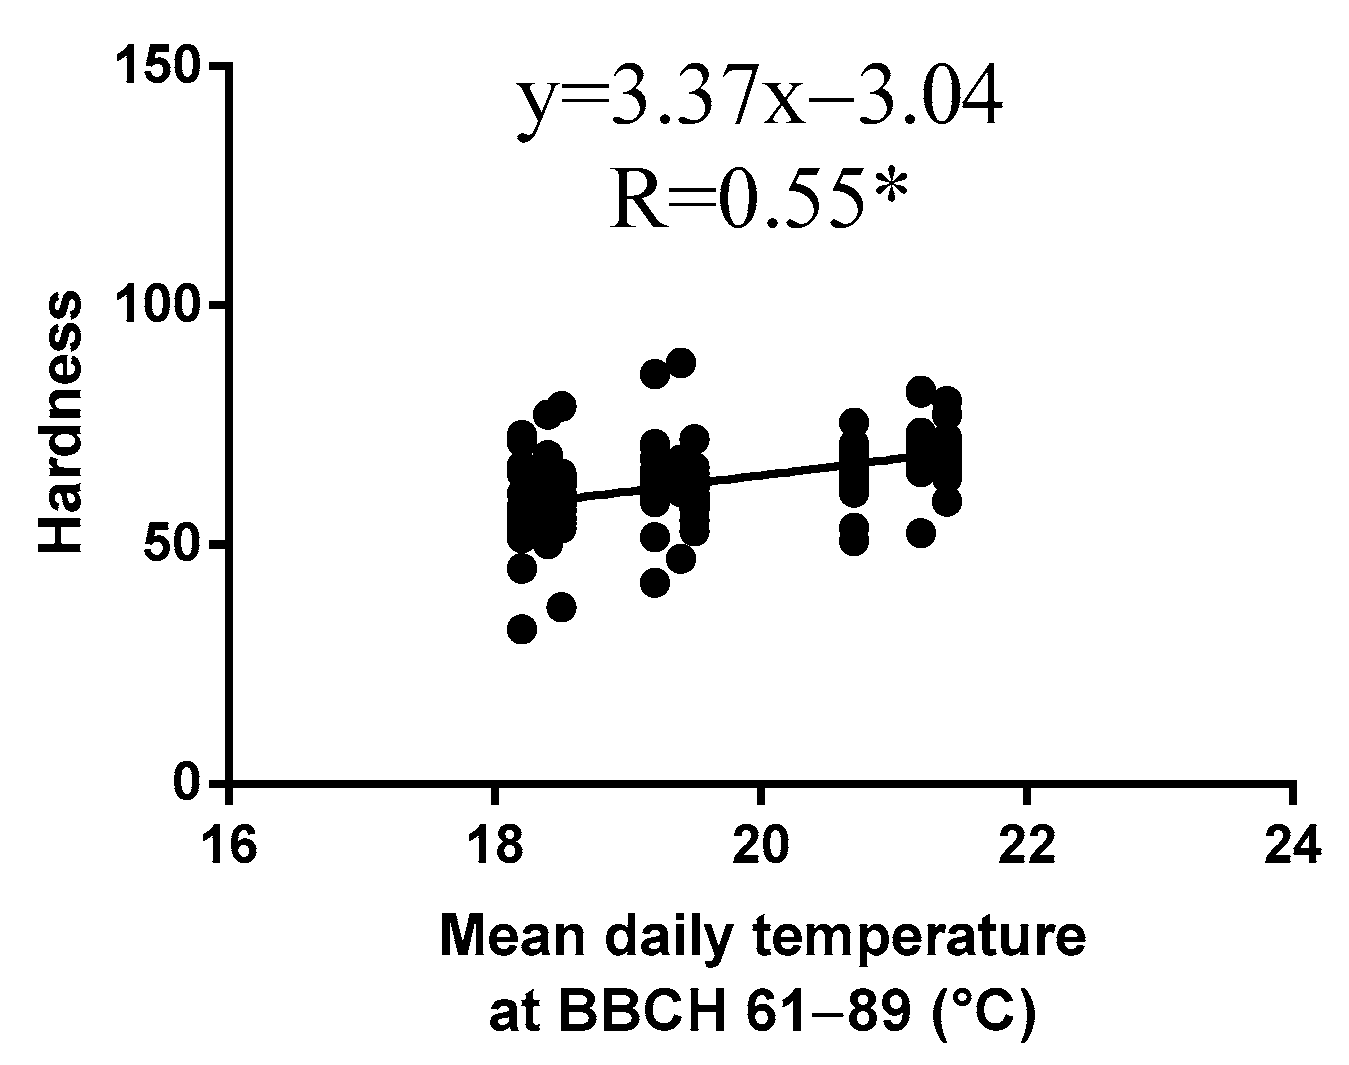
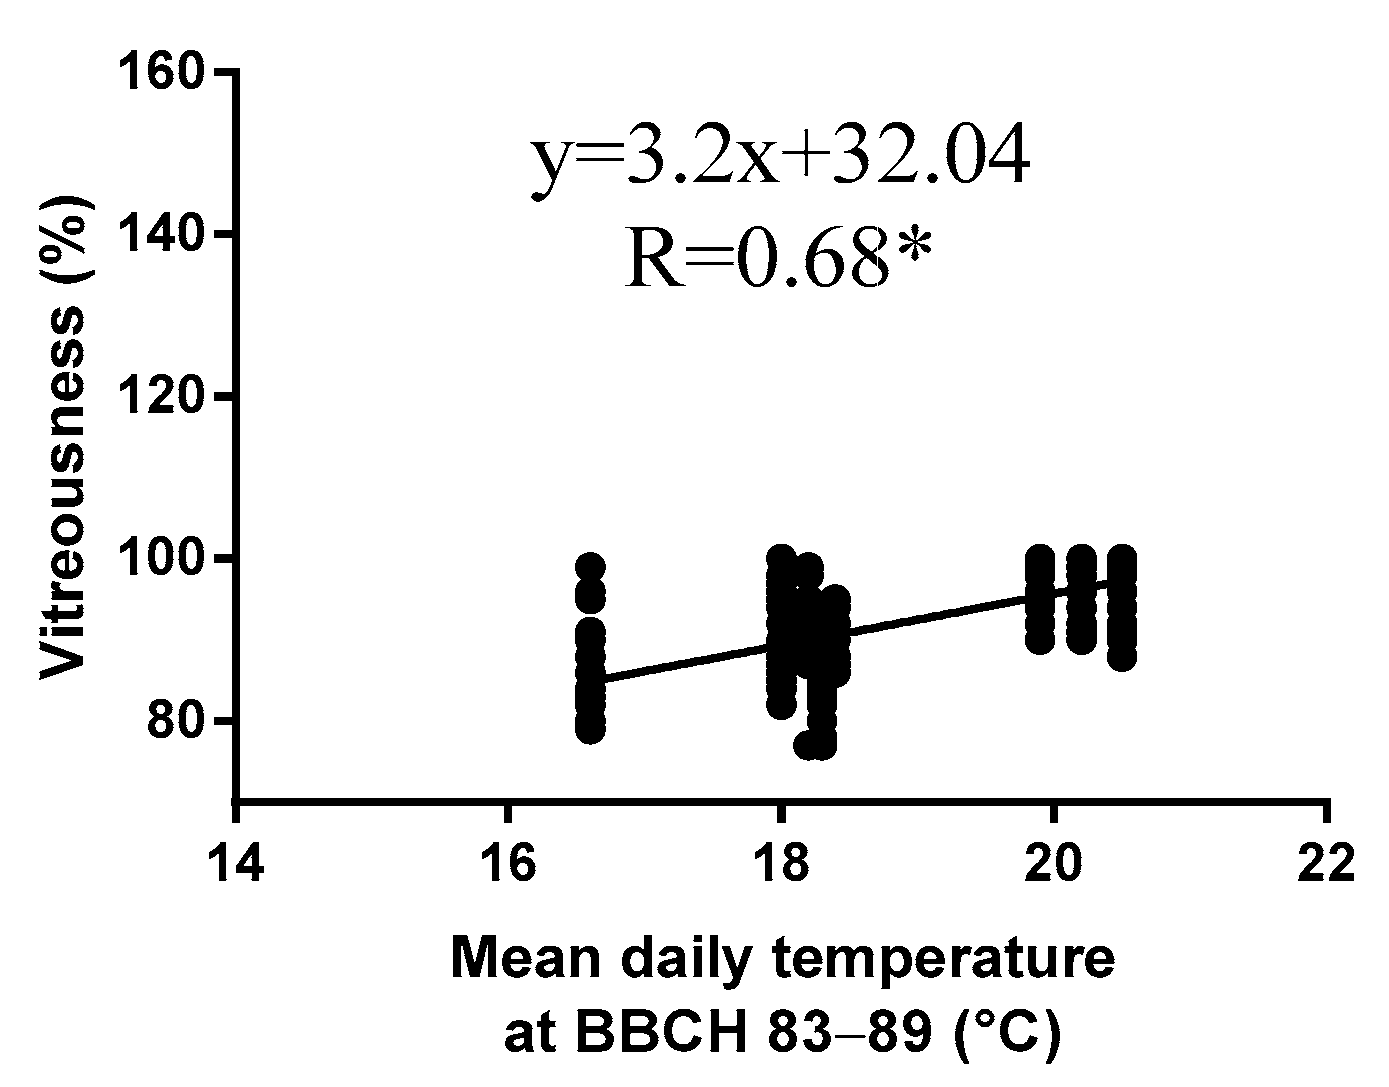
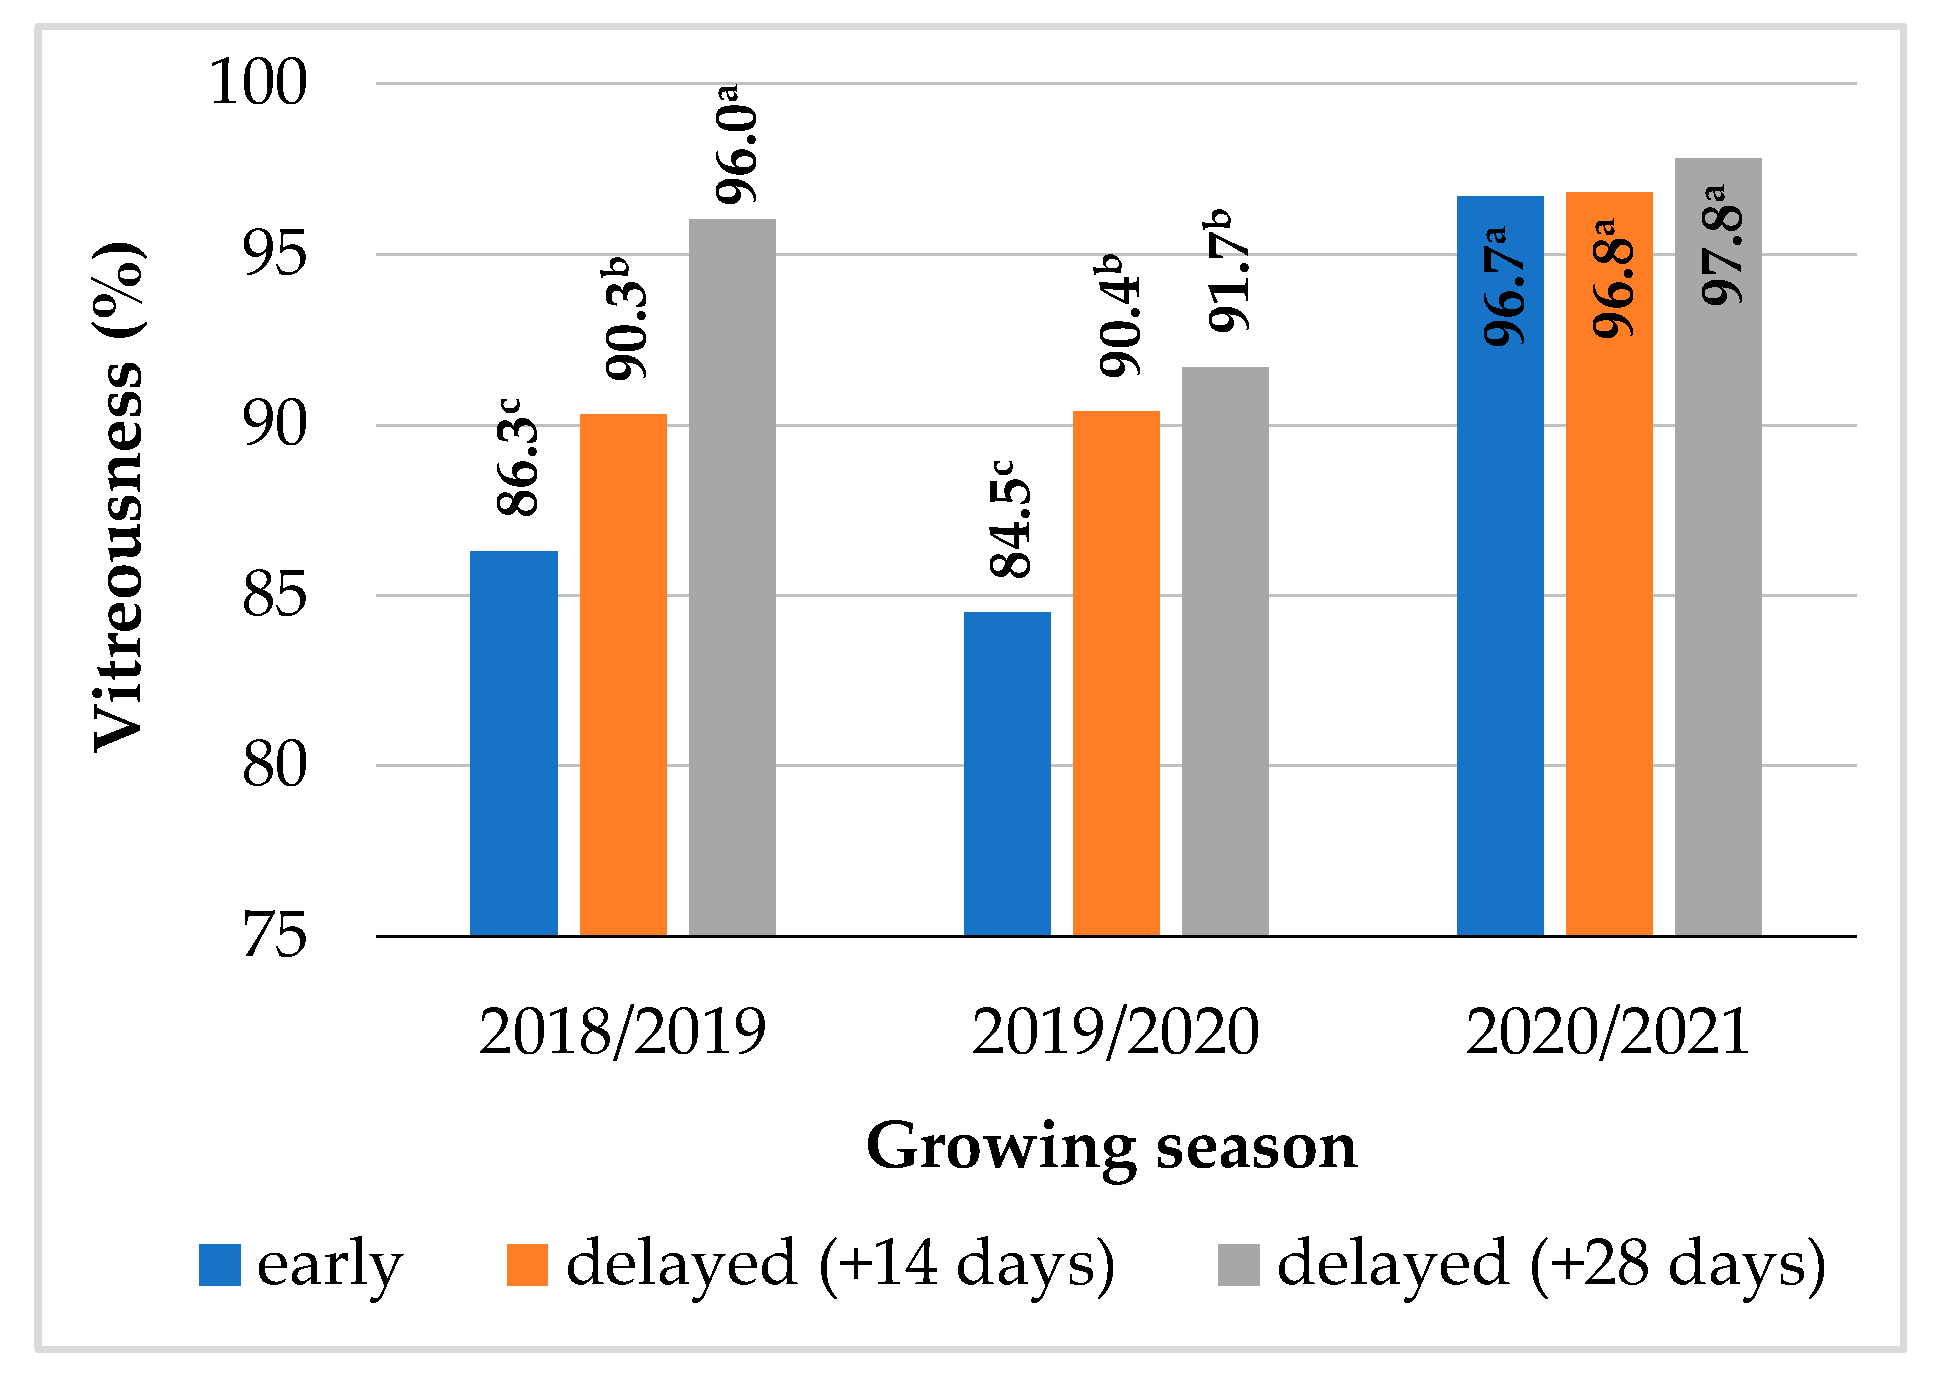
3.2. Milling Quality
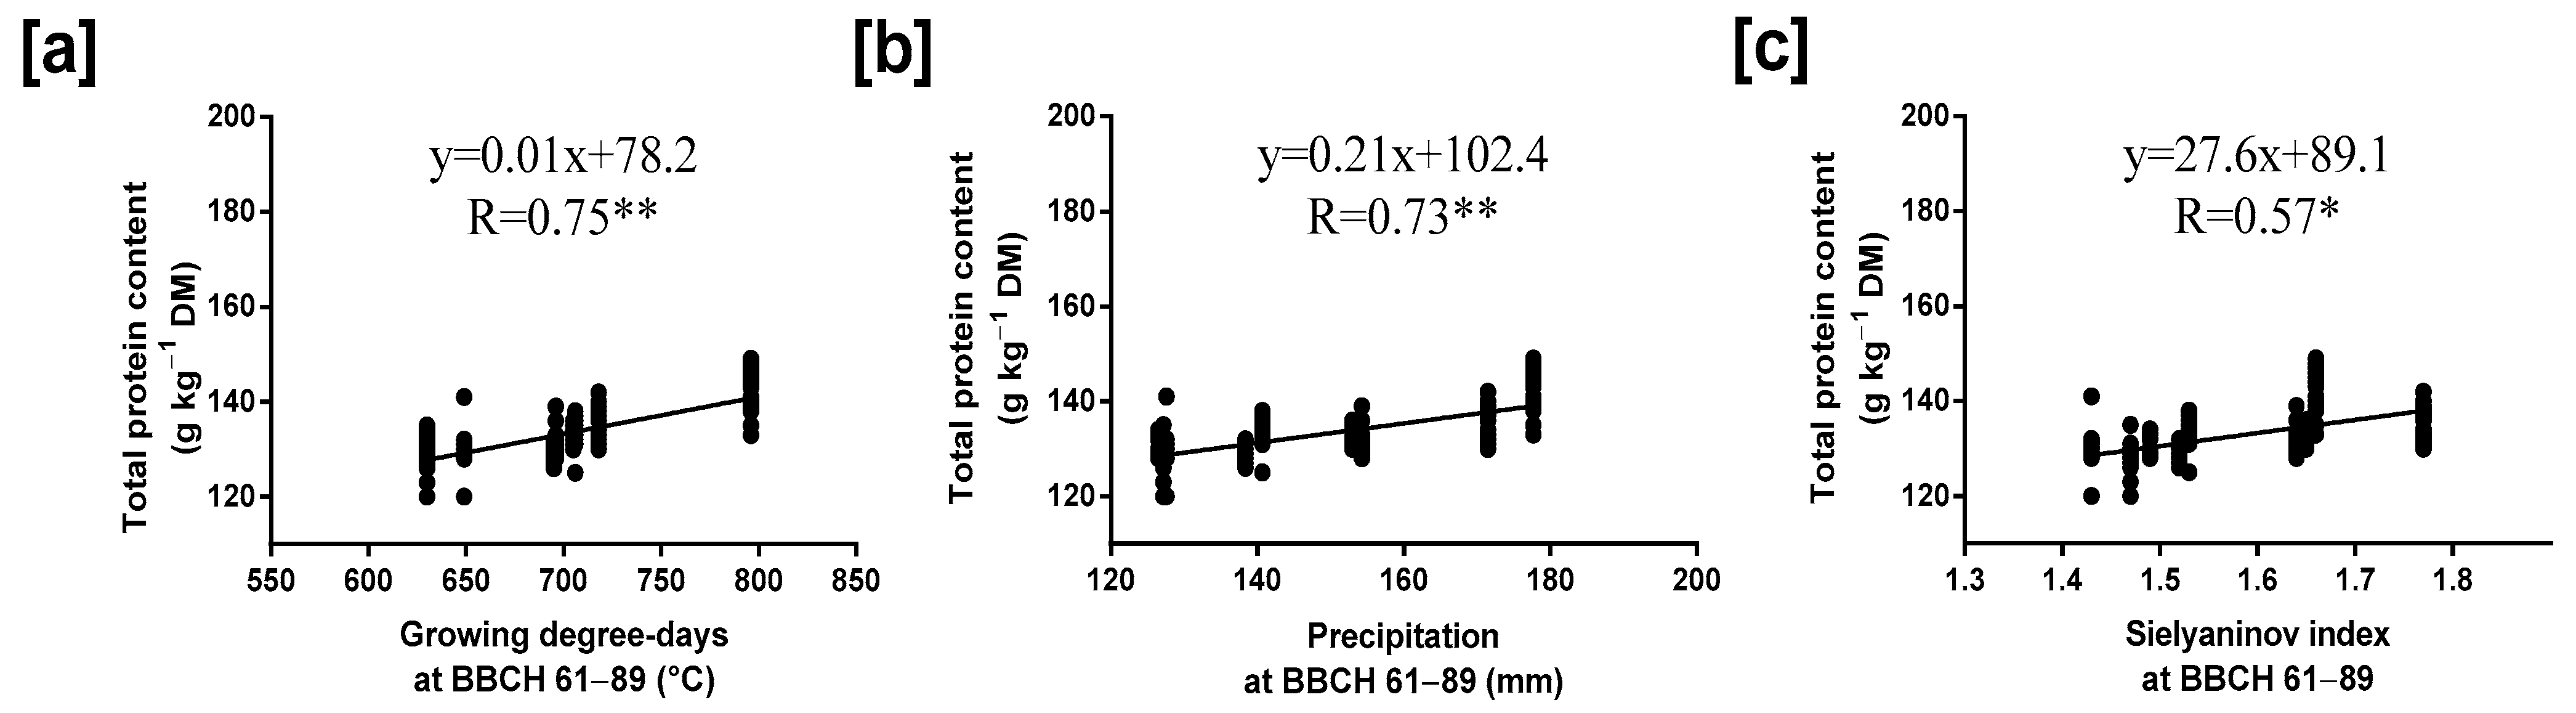
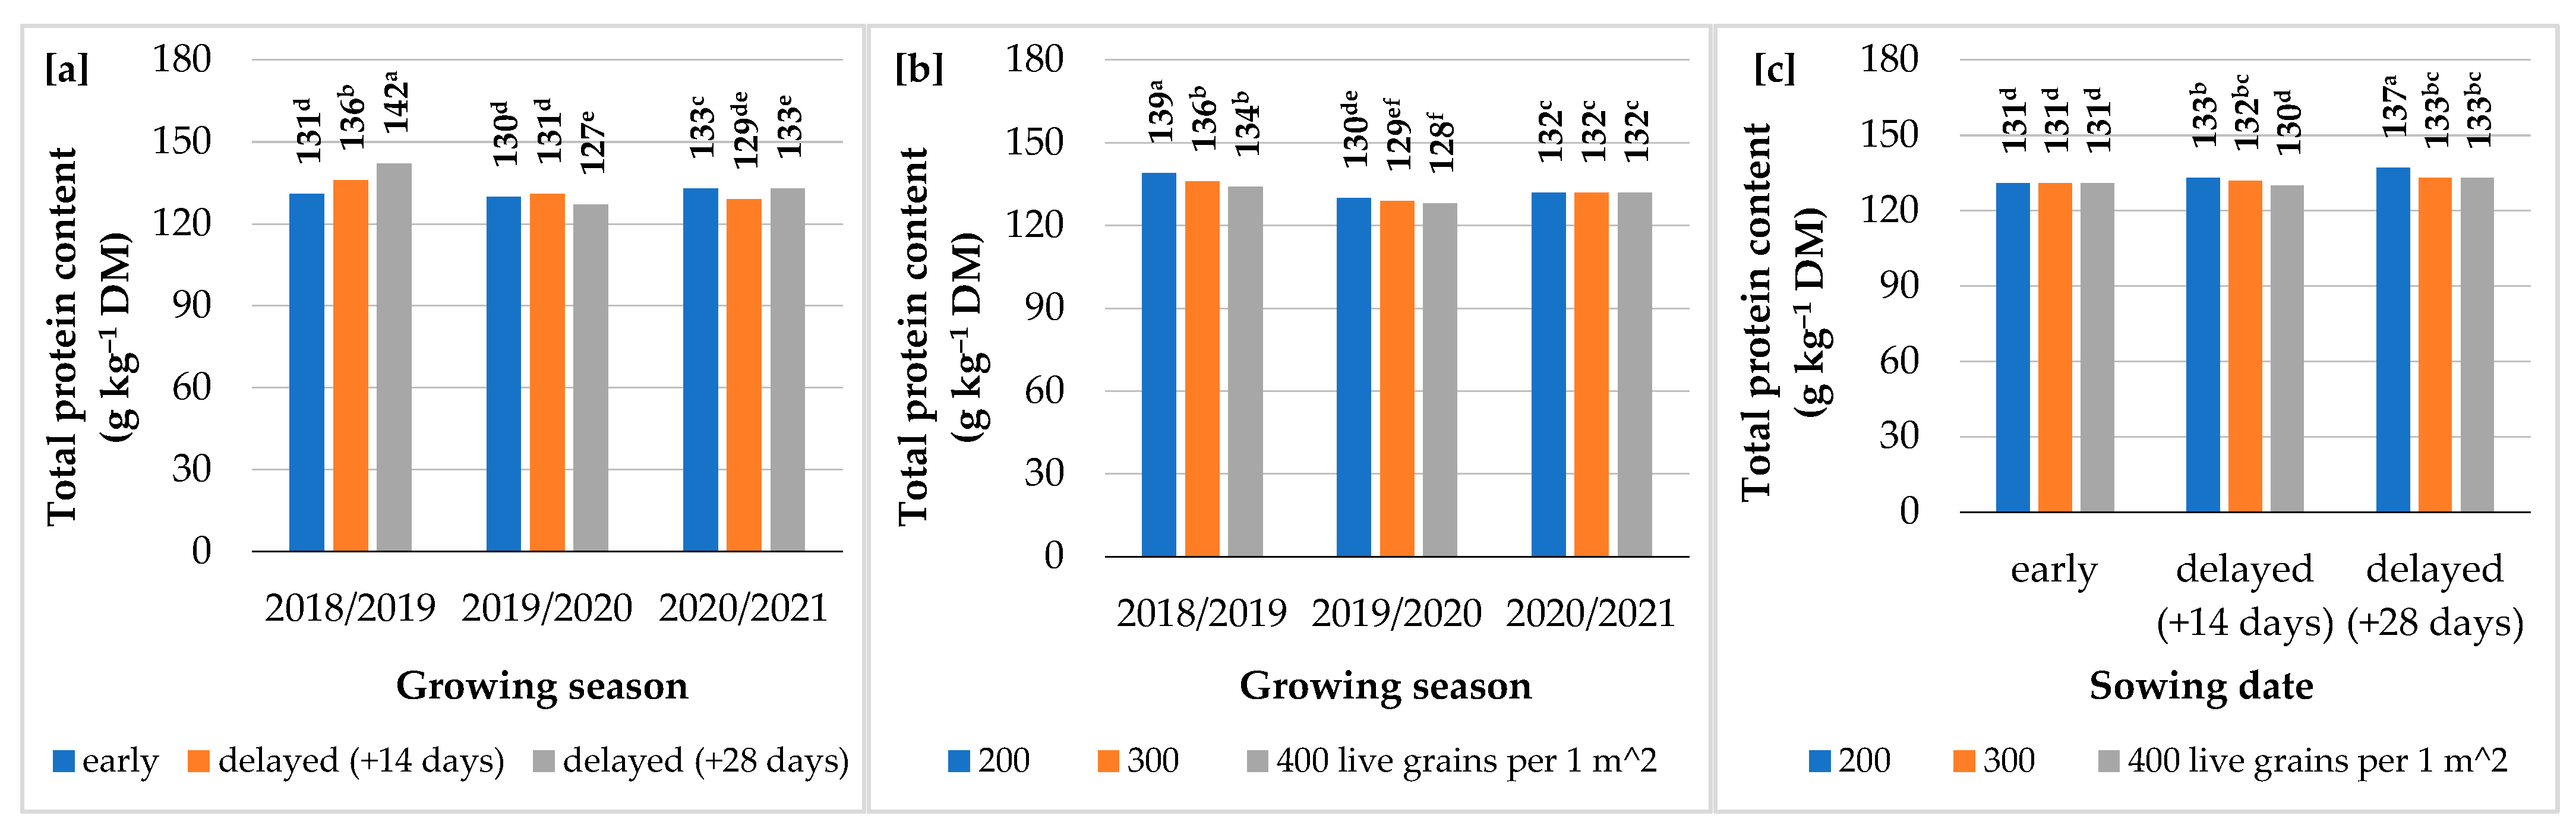
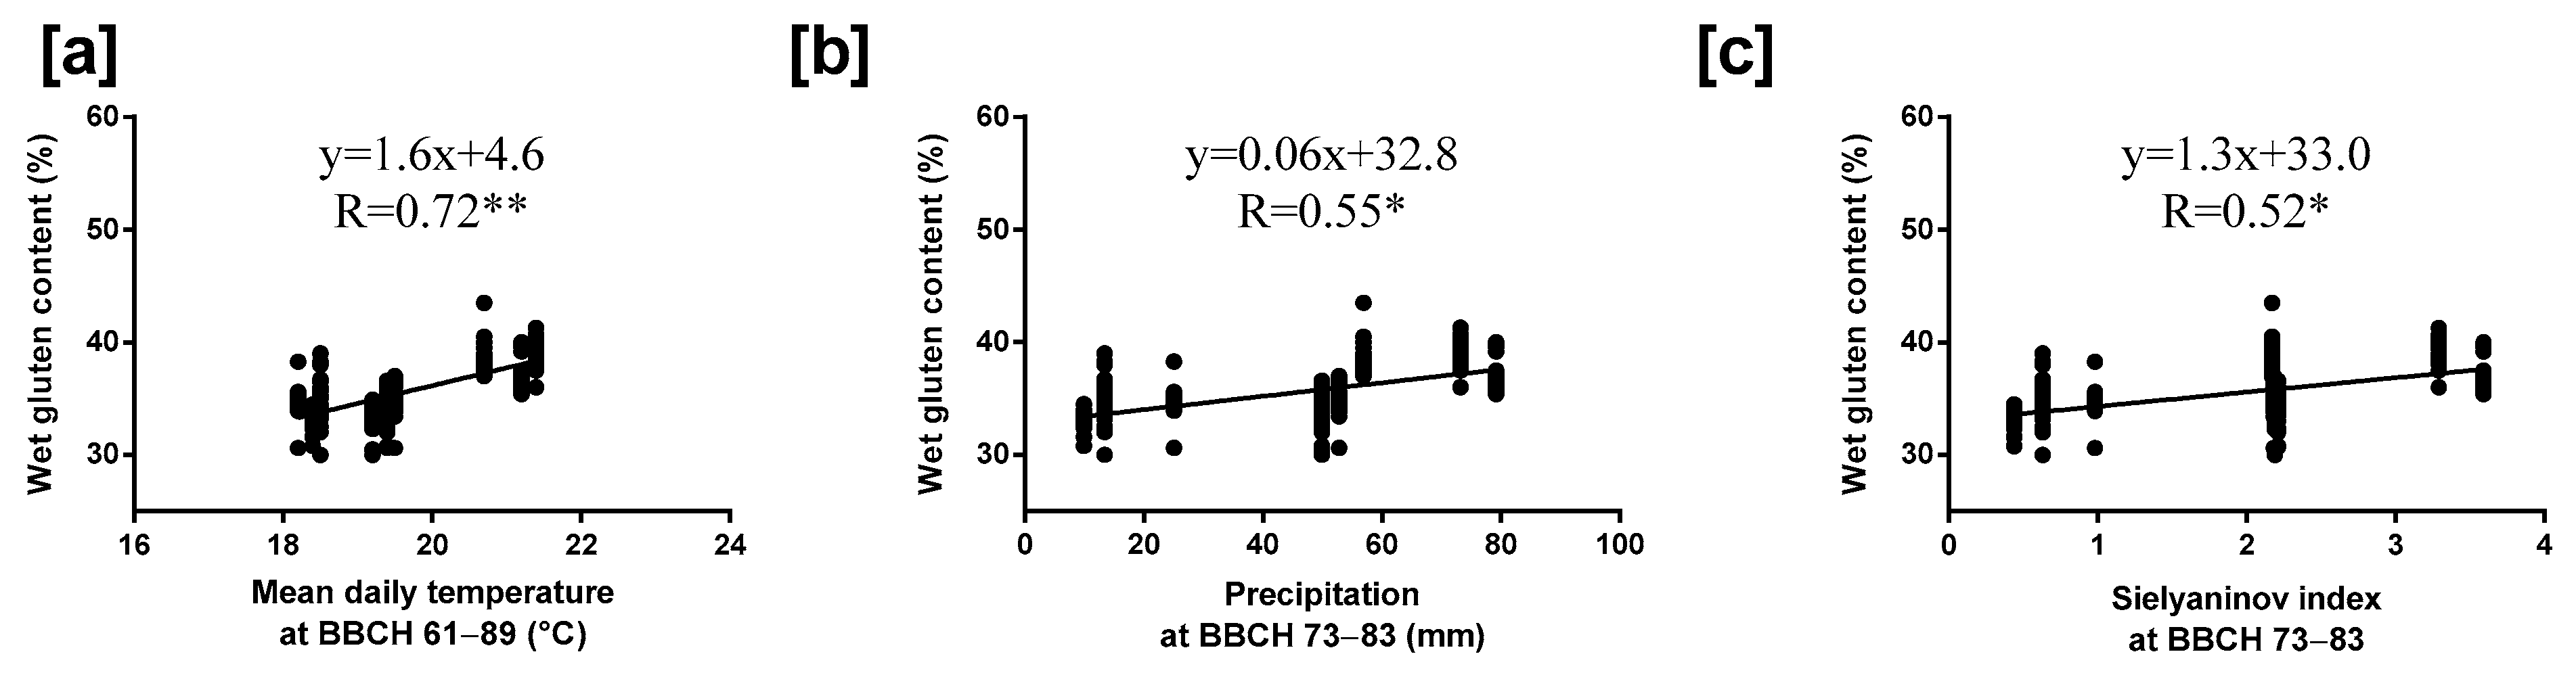
3.3. Protein Complex Quality and Enzyme Activity in Grain
4. Discussion
4.1. Milling Quality
4.2. Protein Complex Quality and Enzyme Activity in Grain
5. Conclusions
Supplementary Materials
Author Contributions
Funding
Institutional Review Board Statement
Data Availability Statement
Acknowledgments
Conflicts of Interest
References
- Breiman, A.; Graur, D. Wheat evolution. Isr. J. Plant Sci. 1995, 43, 85–98. [Google Scholar] [CrossRef]
- Braun, H.J.; Atlin, G.; Payne, T.; Reynolds, M.P. Multi-location testing as a tool to identify plant response to global climate change. In Climate Change and Crop Production; Reynolds, M.P., Ed.; CABI: Wallingford, UK, 2010; pp. 115–138. [Google Scholar]
- Riaz, M.W.; Yang, L.; Yousaf, M.I.; Sami, A.; Mei, X.D.; Shah, L.; Rehman, S.; Xue, L.; Si, H.; Ma, C. Effects of heat stress on growth, physiology of plants, yield and grain quality of different spring wheat (Triticum aestivum L.) genotypes. Sustainability 2021, 13, 2972. [Google Scholar] [CrossRef]
- Khalid, A.; Hameed, A.; Tahir, M.F. Wheat quality: A review on chemical composition, nutritional attributes, grain anatomy, types, classification, and function of seed storage proteins in bread making quality. Front. Nutr. 2023, 10, 1053196. [Google Scholar] [CrossRef]
- Budzyński, W.S.; Bepirszcz, K.; Jankowski, K.J.; Dubis, B.; Hłasko-Nasalska, A.; Sokólski, M.M.; Olszewski, J.; Załuski, D. The responses of winter cultivars of common wheat, durum wheat and spelt to agronomic factors. J. Agric. Sci. 2018, 156, 1163–1174. [Google Scholar] [CrossRef]
- Zubko, V.; Sirenko, V.; Kuzina, T.; Onychko, V.; Sokolik, S.; Roubik, H.; Koszel, M.; Shchur, T. Modelling wheat grain flow during sowing based on the model of grain with shifted center of gravity. Agric. Eng. 2022, 26, 25–37. [Google Scholar] [CrossRef]
- Faostat, Food and Agriculture Organization Corporate Statistical Database. 2023. Available online: http://www.apps.fao.org/faostat/en/#home (accessed on 19 February 2024).
- Mitura, K.; Cacak-Pietrzak, G.; Feledyn-Szewczyk, B.; Szablewski, T.; Studnicki, M. Yield and grain quality of common wheat (Triticum aestivum L.) depending on the different farming systems (organic vs. integrated vs. conventional). Plants 2023, 12, 1022. [Google Scholar] [CrossRef]
- Shewry, P.R. Wheat. J. Exp. Bot. 2009, 60, 1537–1553. [Google Scholar] [CrossRef] [PubMed]
- Budzyński, W. Common wheat. In Wheats—Common, Spelt, Durum. Cultivation and Uses; Budzyński, W., Ed.; PWRiL: Poznań, Poland, 2012; pp. 23–150. (In Polish) [Google Scholar]
- Guerrini, L.; Napoli, M.; Mancini, M.; Masella, P.; Cappelli, A.; Parenti, A.; Orlandini, S. Wheat grain composition, dough rheology and bread quality as affected by nitrogen and sulfur fertilization and seeding density. Agronomy 2020, 10, 233. [Google Scholar] [CrossRef]
- Dilmurodovich, D.S.; Bekmurodovich, B.N.; Shakirjonovich, K.N. Creation of new drought-resistant, high-yielding and high-quality varieties of bread wheat for rainfed areas. Br. J. Glob. Ecol. Sustain. Dev. 2022, 2, 61–73. [Google Scholar]
- Jankowski, K.J.; Kijewski, L.; Dubis, B. Milling quality and flour strength of the grain of winter wheat grown in monoculture. Rom. Agric. Res. 2015, 32, 191–200. [Google Scholar]
- Stępniewska, S. Milling value of grain of selected wheat cultivars from crop years 2012–2014. Acta Agrophysica 2016, 23, 105–117. (In Polish) [Google Scholar]
- Szafrańska, A.; Rothkaehl, J. The falling number and the maximum viscosity of wheat flour starch. Przegląd Zbożowo-Młynarski 2011, 10, 6–7. (In Polish) [Google Scholar]
- Jurga, R. Evaluation of the milling yield of wheat grain based on ash content and flour color. Przegląd Zbożowo-Młynarski 2006, 50, 19–21. (In Polish) [Google Scholar]
- Guzmán, C.; Ibba, M.I.; Álvarez, J.B.; Sissons, M.; Morris, C. Wheat quality. In Wheat Improvement: Food Security in a Changing Climate; Reynolds, M.P., Braun, H., Eds.; Springer International Publishing: Cham, Switzerland, 2022; pp. 177–193. [Google Scholar]
- Wang, K.; Taylor, D.; Ruan, Y.; Pozniak, C.J.; Izydorczyk, M.; Fu, B.X. Unveiling the factors affecting milling quality of durum wheat: Influence of kernel physical properties, grain morphology and intrinsic milling behaviours. J. Cereal Sci. 2023, 113, 103755. [Google Scholar] [CrossRef]
- Dziki, D. The latest innovations in wheat flour milling: A review. Agric. Eng. 2023, 27, 147–162. [Google Scholar] [CrossRef]
- Edwards, M.A. Morphological Features of Wheat Grain and Genotype Affecting Flour Yield. Ph.D. Thesis, Southern Cross University, East Lismore, NSW, Australia, 2010; pp. 1–203. [Google Scholar]
- Hrušková, M.; Švec, I. Wheat hardness in relation to other quality factors. Czech J. Food Sci. 2009, 27, 240–248. [Google Scholar] [CrossRef]
- Lafiandra, D.; Sestili, F.; Sissons, M.; Kiszonas, A.; Morris, C.F. Increasing the versatility of durum wheat through modifications of protein and starch composition and grain hardness. Foods 2022, 11, 1532. [Google Scholar] [CrossRef] [PubMed]
- Ma, Q.; Wang, M.; Zheng, G.; Yao, Y.; Tao, R.; Zhu, M.; Ding, J.; Li, C.; Guo, W.; Zhu, X. Twice-split application of controlled-release nitrogen fertilizer met the nitrogen demand of winter wheat. Field Crops Res. 2021, 267, 108163. [Google Scholar] [CrossRef]
- Mastanjević, K.; Habschied, K.; Dvojković, K.; Karakašić, M.; Glavaš, H. Vitreosity as a major grain quality indicator—Upgrading the grain-cutter method with a new blade. Appl. Sci. 2023, 13, 2655. [Google Scholar] [CrossRef]
- Rachoń, L.; Szumiło, G.; Czubacka, M. Evaluation of grain glassiness of selected varieties and species of wheat. Ann. Univ. Mariae Curie-Skłodowska. Sect. E. Agric. 2012, 67, 17–23. (In Polish) [Google Scholar]
- Sadkiewicz, J. Grain vitreousness—An important parameter in wheat quality evaluation. Przegląd Zbożowo-Młynarski 1998, 7, 18–19. (In Polish) [Google Scholar]
- Zhygunov, D.; Sots, S.; Barkovska, Y.; Liu, J.; Wang, F.; Liu, X.; Wang, Z.; Li, X. Influence of grain quality indicators on the flour quality indicators at the laboratory milling. Grain Prod. Mix. Fodder’s 2022, 22, 17–29. [Google Scholar] [CrossRef]
- Carson, G.R.; Edwards, N.M. Criteria of wheat and flour quality. In Book Wheat: Chemistry and Technology, 4th ed.; Khan, K., Shewry, P.R., Eds.; AACC International: St. Paul, MN, USA, 2009; pp. 97–118. [Google Scholar]
- Rozbicki, J.; Ceglińska, A.; Gozdowski, D.; Jakubczak, M.; Cacak-Pietrzak, G.; Mądry, W.; Golba, J.; Piechociński, M.; Sobczyński, G.; Studnicki, M.; et al. Influence of the cultivar, environment and management on the grain yield and bread-making quality in winter wheat. J. Cereal Sci. 2015, 61, 126–132. [Google Scholar] [CrossRef]
- Guzmán, C.; Peña, R.J.; Singh, R.; Autrique, E.; Dreisigacker, S.; Crossa, J.; Rutkoski, J.; Poland, J.; Battenfield, S. Wheat quality improvement at CIMMYT and the use of genomic selection on it. Appl. Transl. Genom. 2016, 11, 3–8. [Google Scholar] [CrossRef]
- Jarecki, W.; Bobrecka-Jamro, D.; Buczek, J.; Jańczak-Pieniążek, M. Effect of high nitrogen doses on yield, quality and chemical composition grain of winter wheat cultivars. J. Elem. 2020, 25, 1005–1017. [Google Scholar] [CrossRef]
- Petingco, M.C.; Casada, M.E.; Maghirang, R.G.; Thompson, S.A.; Turner, A.P.; McNeill, S.G.; Montross, M. Discrete element method simulation of wheat bulk density as affected by grain drop height and kernel size distribution. J. ASABE 2022, 65, 555–566. [Google Scholar] [CrossRef]
- Rothkaehl, J. Wheat grain for human consumption—Marketing and processing. In Wheats—Common, Spelt, Durum. Cultivation and Uses; Budzyński, W., Ed.; PWRiL: Poznań, Poland, 2012; pp. 235–264. (In Polish) [Google Scholar]
- Dunăreanu, I.C.; Bonea, D. Grain yield and hectolitre weight of some wheat cultivars in organic and conventional production systems. Rom. Agric. Res. 2022, 39, 229–237. [Google Scholar] [CrossRef]
- Mandea, V.; Marinciu, C.M.; Şerban, G.; Ciontu, C.; Săulescu, N.N. Genetic and environmental effects on grain size uniformity in winter wheat. Rom. Agric. Res. 2022, 39, 133–138. [Google Scholar] [CrossRef]
- Li, J.; Liu, X.; Yang, X.; Li, Y.; Wang, C.; He, D. Proteomic analysis of the impacts of powdery mildew on wheat grain. Food Chem. 2018, 261, 30–35. [Google Scholar] [CrossRef]
- Kumar, A.; Nayak, R.; Purohit, S.R.; Rao, P.S. Impact of UV-C irradiation on solubility of Osborne protein fractions in wheat flour. Food Hydrocoll. 2021, 110, 105845. [Google Scholar] [CrossRef]
- Wieser, H.; Kieffer, R. Correlations of the amount of gluten protein types to the technological properties of wheat flours determined on a micro-scale. J. Cereal Sci. 2001, 34, 19–27. [Google Scholar] [CrossRef]
- Zhang, P.; He, Z.; Chen, D.; Zhanga, Y.; Larroquee, O.R.; Xia, X. Contribution of common wheat protein fractions to dough properties and quality of northern-style Chinese steamed bread. J. Cereal Sci. 2007, 46, 1–10. [Google Scholar] [CrossRef]
- Li, Y.Q.; Zhu, R.J.; Tian, J.C. Influence of wheat protein contents and fractions on dough rheological properties as determined by using a reconstitution method. Agric. Sci. China 2008, 7, 395–404. [Google Scholar] [CrossRef]
- Li, M.; Yue, Q.; Liu, C.; Zheng, X.; Hong, J.; Wang, N.; Bian, K. Interaction between gliadin/glutenin and starch granules in dough during mixing. LWT 2021, 148, 111624. [Google Scholar] [CrossRef]
- Wieser, H. Chemistry of gluten proteins. Food Microbiol. 2007, 24, 115–119. [Google Scholar] [CrossRef] [PubMed]
- Dizlek, H.; Girard, A.L.; Awika, J.M. High protein and gliadin content improves tortilla quality of a weak gluten wheat. LWT 2022, 160, 113320. [Google Scholar] [CrossRef]
- Zhang, Y.; Xu, M.; Zhang, X.; Hu, Y.; Luan, G. Application of zein in gluten-free foods: A comprehensive review. Food Res. Int. 2022, 160, 111722. [Google Scholar] [CrossRef] [PubMed]
- Simón, M.R.; Fleitas, M.C.; Castro, A.C.; Schierenbeck, M. How foliar fungal diseases affect nitrogen dynamics, milling, and end-use quality of wheat. Front. Plant Sci. 2020, 11, 1568. [Google Scholar] [CrossRef]
- Lakić-Karalić, N.; Vasilišin, L.; Vučić, G. Relationship between the test weight and some physical and chemical properties of the wheat kernel. Agro-Know. J. 2021, 22, 137–148. [Google Scholar] [CrossRef]
- Tian, S.; Zhang, M.; Li, J.; Wen, S.; Bi, C.; Zhao, H.; Wei, C.; Chen, Z.; Yu, J.; Shi, X.; et al. Identification and validation of stable quantitative trait loci for sds-sedimentation volume in common wheat (Triticum aestivum L.). Front. Plant Sci. 2021, 12, 747775. [Google Scholar] [CrossRef]
- He, Z.H.; Liu, L.; Xia, X.C.; Liu, J.J.; Peña, R.J. Composition of HMW and LMW glutenin subunits and their effects on dough properties, pan bread, and noodle quality of Chinese bread wheats. Cereal Chem. 2005, 82, 345–350. [Google Scholar] [CrossRef]
- Kała, M.; Przyborowski, M.; Ługowska, B.; Gasparis, S.; Nadolska-Orczyk, A. Characteristics of gluten proteins in breeding lines of wheat. Biul. IHAR 2017, 282, 41–49. (In Polish) [Google Scholar]
- Buczek, J.; Jarecki, W.; Bobrecka-Jamro, D. The response of population and hybrid wheat to selected agro-environmental factors. Plant Soil Environ. 2016, 62, 67–73. [Google Scholar] [CrossRef]
- Wang, Y.; Shewry, P.R.; Hawkesford, M.J.; Qi, P.; Wan, Y. High molecular weight glutenin subunit (HMW-GS) 1Dx5 is concentrated in small protein bodies when overexpressed in wheat starchy endosperm. J. Cereal Sci. 2021, 101, 103291. [Google Scholar] [CrossRef]
- Bo, C.; Fan, Z.; Ma, X.; Li, A.; Wang, H.; Kong, L.; Wang, X. Identification and introgression of a novel HMW-GS gene from Aegilops tauschii. Agronomy 2022, 12, 2709. [Google Scholar] [CrossRef]
- Yan, W.; Guo, Z.; Chen, Q.; Li, Y.; Zhao, K.; Wan, Y.-F.; Hawkesford, M.J.; Jiang, Y.-F.; Kong, L.; Pu, Z.-E.; et al. Effect of high-molecular-weight glutenin subunit Dy10 on wheat dough properties and end-use quality. J. Integr. Agric. 2023, 22, 1609–1617. [Google Scholar]
- Veraverbeke, W.S.; Delcour, J.A. Wheat protein composition and properties of wheat glutenin in relation to breadmaking functionality. Crit. Rev. Food Sci. Nutr. 2002, 42, 179–208. [Google Scholar] [CrossRef] [PubMed]
- Konopka, I.; Fornal, Ł.; Dziuba, M.; Czaplicki, S.; Nałęcz, D. Composition of proteins in wheat grain streams obtained by sieve classification. J. Sci. Food Agric. 2007, 87, 2198–2206. [Google Scholar] [CrossRef]
- Feng, Y.; Zhang, H.; Wang, J.; Chen, H. Dynamic changes in glutenin macropolymer during different dough mixing and resting processes. Molecules 2021, 26, 541. [Google Scholar] [CrossRef]
- Sjoberg, S.M.; Carter, A.H.; Steber, C.M.; Garland, K.A. Application of the factor analytic model to assess wheat falling number performance and stability in multienvironment trials. Crops Sci. 2021, 61, 372–382. [Google Scholar] [CrossRef]
- Rothkaehl, J. The quality of wheat grain harvested in 2014 in Poland. Przegląd Piek. I Cukier. 2015, 5, 10–14. (In Polish) [Google Scholar]
- Hu, Y.; Sjoberg, S.M.; Chen, C.; Hauvermale, A.L.; Morris, C.F.; Delwiche, S.R.; Cannon, A.E.; Steber, C.; Zhang, Z. As the number falls, alternatives to the Hagberg–Perten falling number method: A review. Compr. Rev. Food Sci. Food Saf. 2022, 21, 2105–2117. [Google Scholar] [CrossRef]
- Buczek, J.; Jarecki, W.; Jańczak-Pieniążek, M.; Bobrecka-Jamro, D. Hybrid wheat yield and quality related to cultivation intensity and weather condition. J. Elem. 2020, 25, 71–83. [Google Scholar] [CrossRef]
- Fu, S.; Liu, X.M.; Ma, Y.; Li, H.; Zhen, Y.M.; Zhang, Z.X.; Wang, Y.Q.; Men, M.X.; Peng, Z.P. Effects of nitrogen supply forms on the quality and yield of strong and medium gluten wheat cultivars. J. Plant Nutri. Fertil. 2022, 28, 83–93. [Google Scholar]
- Lou, H.; Zhang, R.; Liu, Y.; Guo, D.; Zhai, S.; Chen, A.; Zhang, Y.; Xie, C.; You, M.; Peng, H.; et al. Genome-wide association study of six quality-related traits in common wheat (Triticum aestivum L.) under two sowing conditions. Theor. Appl. Genet. 2021, 134, 399–418. [Google Scholar] [CrossRef] [PubMed]
- Jańczak-Pieniążek, M.; Buczek, J.; Kwiatkowski, C.A.; Harasim, E. The course of physiological processes, yielding, and grain quality of hybrid and population wheat as affected by integrated and conventional cropping systems. Agronomy 2022, 12, 1345. [Google Scholar] [CrossRef]
- Dupont, F.M.; Hurkman, W.J.; Vensel, W.H.; Tanaka, C.; Kothari, K.M.; Chung, O.K.; Altenbach, S. Protein accumulation and composition in wheat grains: Effects of mineral nutrients and high temperature. Eur. J. Agron. 2006, 25, 96–107. [Google Scholar] [CrossRef]
- Erekul, O.; Köhn, W. Effect of weather and soil conditions on yield components and bread-making quality of winter wheat (Triticum aestivum L.) and winter triticale (Triticosecale Wittm.) varieties in North-East Germany. J. Agron. Crop Sci. 2006, 192, 452–464. [Google Scholar] [CrossRef]
- Jaskulska, I.; Jaskulski, D.; Gałęzewski, L.; Knapowski, T.; Kozera, W.; Wacławowicz, R. Mineral composition and baking value of the winter wheat grain under varied environmental and agronomic conditions. J. Chem. 2018, 2018, 5013825. [Google Scholar] [CrossRef]
- Woźniak, A.; Rachoń, L. Effect of tillage systems on the yield and quality of winter wheat grain and soil properties. Agriculture 2020, 10, 405. [Google Scholar] [CrossRef]
- Buczek, J.; Migut, D.; Jańczak-Pieniążek, M. Effect of soil tillage practice on photosynthesis, grain yield and quality of hybrid winter wheat. Agriculture 2021, 11, 479. [Google Scholar] [CrossRef]
- Djouadi, K.; Mekliche, A.; Dahmani, S.; Ladjiar, N.I.; Abid, Y.; Silarbi, Z.; Hamadache, A.; Pisante, M. Durum wheat yield and grain quality in early transition from conventional to conservation tillage in semi-arid mediterranean conditions. Agriculture 2021, 11, 711. [Google Scholar] [CrossRef]
- Budzyński, W.; Borysewicz, J.; Bielski, S. The effects of nitrogen level on yield and technological parameters of winter wheat grain. Pam. Puł. 2004, 135, 33–34. (In Polish) [Google Scholar]
- Stankowski, S.; Smagacz, J.; Hury, G.; Ułasik, S. Effect of nitrogen fertilization intensity on grain and flour quality of winter wheat cultivars. Acta Sci. Pol. Agric. 2008, 7, 105–114. (In Polish) [Google Scholar]
- Muste, S.; Modoran, C.; Man, S.; Muresan, V.; Birou, A. The influence of wheat genotype on its quality. J. Agroaliment. Proc. Technol. 2010, 16, 99–103. [Google Scholar]
- Caglar, O.; Bulut, S.; Karaoglu, M.M.; Kotancilar, H.G.; Ozturk, A. Quality response of facultative wheat to winter sowing, freezing sowing and spring sowing at different seeding rates. J. Anim. Vet. Adv. 2011, 10, 3368–3374. [Google Scholar] [CrossRef]
- Zecevic, V.; Boskovic, J.; Knezevic, D.; Micanovic, D. Effect of seeding rate on grain quality of winter wheat. Chil. J. Agric. Res. 2014, 74, 23–28. [Google Scholar] [CrossRef]
- Jankowski, K.J.; Budzyński, W.S.; Kijewski, Ł.; Dubis, D.; Lemański, M. Flour quality, the rheological properties of dough and the quality of bread made from the grain of winter wheat grown in a continuous cropping system. Acta Sci. Pol. Agric. 2014, 13, 3–18. [Google Scholar]
- Khan, M.A.; Basir, A.; Fahad, S.; Adnan, M.; Saleem, M.H.; Iqbal, A.; Amanullah; Al-Huqail, A.A.; Alosaimi, A.A.; Saud, S.; et al. Biochar optimizes wheat quality, yield, and nitrogen acquisition in low fertile calcareous soil treated with organic and mineral nitrogen fertilizers. Front. Plant Sci. 2022, 13, 879788. [Google Scholar] [CrossRef]
- Tomaz, A.; Palma, J.F.; Ramos, T.; Costa, M.N.; Rosa, E.; Santos, M.; Boteta, L.; Dores, J.; Patanita, M. Yield, technological quality and water footprints of wheat under Mediterranean climate conditions: A field experiment to evaluate the effects of irrigation and nitrogen fertilization strategies. Agric. Water Manag. 2021, 258, 107214. [Google Scholar] [CrossRef]
- Knapowski, T.; Ralcewicz, M. Estimation of the quality features of winter wheat corn and flour in the relation to diversification nitrogen fertilization. Ann. Univ. Mariae Curie-Skłodowska. Sect. E Agric. 2004, 59, 959–968. (In Polish) [Google Scholar]
- Podolsk, G.; Stankowski, S.; Dworakowski, T. The effect of nitrogen fertilization on yielding and technological value of winter wheat cultivars. Fragm. Agron. 2007, 24, 274–282. (In Polish) [Google Scholar]
- Budzyński, W.; Bielski, S. Influence of nitrogen fertilization on technological quality of winter wheat grain. Fragm. Agron. 2008, 25, 27–38. (In Polish) [Google Scholar]
- Reznick, J.P.K.; Barth, G.; Kaschuk, G.; Pauletti, V. Nitrogen and cultivars as field strategies to improve the nutritional status of wheat grain and flour. J. Cereal Sci. 2021, 102, 103290. [Google Scholar] [CrossRef]
- Narkiewicz-Jodko, M.; Gil, Z.; Wojciechowski, W.; Zmijewski, M. Health and quality of grain spring wheat in relations to stubble crops and nitrogen fertilization. Fragm. Agron. 2008, 25, 251–260. (In Polish) [Google Scholar]
- Ellmann, T. Effect of plant protection, nitrogen fertilization and date of harvest on yield of winter wheat. Fragm. Agron. 2011, 28, 15–25. (In Polish) [Google Scholar]
- Sissons, M.; Egan, N.; Simpfendorfer, S. Effect of nitrogen fertilization and inoculation of durum wheat with fusarium pseudograminearum on yield, technological quality and gluten protein composition. Agronomy 2023, 13, 1658. [Google Scholar] [CrossRef]
- Kindred, D.R.; Gooding, M.J.; Ellis, R.H. Nitrogen fertilizer and seed rate effects on Hagberg falling number of hybrid wheats and their parents are associated with α-amylase activity, grain cavity size and dormancy. J. Sci. Food Agric. 2005, 85, 727–742. [Google Scholar] [CrossRef]
- Dargie, S.; Wogi, L.; Kidanu, S. Nitrogen use efficiency, yield, and yield traits of wheat response to slow-releasing N fertilizer under balanced fertilization in Vertisols and Cambisols of Tigray, Ethiopia. Cogent Environ. Sci. 2020, 6, 1778996. [Google Scholar] [CrossRef]
- Shi, R.; Zhang, Y.; Chen, X.; Sun, Q.; Zhang, F.; Römheld, V.; Zou, C. Influence of long-term nitrogen fertilization on micronutrient density in grain of winter wheat (Triticum aestivum L.). J. Cereal Sci. 2010, 51, 165–170. [Google Scholar] [CrossRef]
- Dubis, B. Agricultural, energy and economic analysis of spring wheat production for human consumption. In Dissertations and Monographs; Publishing House of the University of Warmia and Mazury: Olsztyn, Poland, 2012; Volume 171, p. 130. (In Polish) [Google Scholar]
- Sułek, A.; Podolska, G. Grain yield and technological quality value of spring wheat cv. Nawra depending on nitrogen fertilization doses and time of its application. Acta Sci. Pol. Agric. 2008, 7, 103–110. (In Polish) [Google Scholar]
- Wieser, H.; Koehler, P.; Scherf, K.A. Chemistry of wheat gluten proteins: Quantitative composition. Cereal Chem. 2023, 100, 36–55. [Google Scholar] [CrossRef]
- Stępień, A.; Wojtkowiak, K. Composition of gluten proteins in spring and winter wheat grain cultivated under conditions of varied fertilization. Acta Agric. Scand. Sect. B—Soil Plant Sci. 2013, 63, 588–594. [Google Scholar] [CrossRef]
- Tóth, B.; Bilion, A.; Labuschagne, M. Influence of low soil nitrogen and phosphorus on gluten polymeric and monomeric protein distribution in two high quality spring wheat cultivars. J. Cereal Sci. 2020, 92, 102867. [Google Scholar] [CrossRef]
- Horvat, D.; Šimić, G.; Dvojković, K.; Ivić, M.; Plavšin, I.; Novoselović, D. Gluten protein compositional changes in response to nitrogen application rate. Agronomy 2021, 11, 325. [Google Scholar] [CrossRef]
- Keres, I.; Alaru, M.; Koppel, R.; Altosaar, I.; Tosens, T.; Loit, E. The combined effect of nitrogen treatment and weather conditions on wheat protein-starch interaction and dough quality. Agriculture 2021, 11, 1232. [Google Scholar] [CrossRef]
- Vetch, J.M.; Stougaard, R.N.; Martin, J.M.; Giroux, M.J. Revealing the genetic mechanisms of pre-harvest sprouting in hexaploid wheat (Triticum aestivum L.). Plant Sci. 2019, 281, 180–185. [Google Scholar] [CrossRef] [PubMed]
- Singh, C.; Kamble, U.; Gupta, V.; Singh, G.; Sheoran, S.; Gupta, A.; Tyagi, B.S.; Kumar, P.; Mishra, C.N.; Krishannapa, G.; et al. Pre-harvest sprouting in wheat: Current status and future prospects. J. Cereal Res. 2021, 13, 1–22. [Google Scholar] [CrossRef]
- Tai, L.; Wang, H.J.; Xu, X.J.; Sun, W.H.; Ju, L.; Liu, W.T.; Li, W.Q.; Sun, J.; Chen, K.M. Pre-harvest sprouting in cereals: Genetic and biochemical mechanisms. J. Exp. Bot. 2021, 72, 2857–2876. [Google Scholar] [CrossRef]
- Chang, C.; Zhang, H.; Lu, J.; Si, H.; Ma, C. Genetic improvement of wheat with pre-harvest sprouting resistance in China. Genes 2023, 14, 837. [Google Scholar] [CrossRef]
- Penning, B.W. Gene expression differences related to pre-harvest sprouting uncovered in related wheat varieties by RNAseq analysis. Plant Gene 2023, 33, 100404. [Google Scholar] [CrossRef]
- Geisslitz, S.; Longin, C.F.H.; Scherf, K.A.; Koehler, P. Comparative study on gluten protein composition of ancient (Einkorn, Emmer and Spelt) and modern wheat species (durum and common wheat). Foods 2019, 8, 409. [Google Scholar] [CrossRef]
- Kubar, M.; Feng, M.; Sayed, S.; Shar, A.; Rind, N.; Ullah, H.; Kalhoro, S.; Xie, Y.; Yang, C.; Yang, W.; et al. Agronomical traits associated with yield and yield components of winter wheat as affected by nitrogen managements. Saudi J. Biol. Sci. 2021, 28, 4852–4858. [Google Scholar] [CrossRef]
- Meier, U. Growth Stages of Mono- and Dicotyledonous Plants: BBCH Monograph; Julius Kühn-Institut: Quedlinburg, Germany, 2018; Available online: https://www.julius-kuehn.de/media/Veroeffentlichungen/bbch%20epaper%20en/page.pdf (accessed on 10 January 2024).
- Majewska, K. Basis of classification and synthesis of wheat grain gluten proteins. Żywn. Nauka Technol. Jakość 1999, 6, 15–25. (In Polish) [Google Scholar]
- Podolska, G. Effect of nitrogen fertilization doses and way of its application on yield and technological quality of winter wheat cultivars grain. Acta Sci. Pol. Agric. 2008, 7, 57–65. (In Polish) [Google Scholar]
- Ding, J.; Li, F.; Xu, D.; Wu, P.; Zhu, M.; Li, C.; Zhu, X.; Chen, Y.; Guo, W. Tillage and nitrogen managements increased wheat yield through promoting vigor growth and production of tillers. Agron. J. 2021, 113, 1640–1652. [Google Scholar] [CrossRef]
- Sieling, K.; Kage, H. Apparent fertilizer N recovery and the relationship between grain yield and grain protein concentration of different winter wheat varieties in a long-term field trial. Eur. J. Agron. 2021, 124, 126246. [Google Scholar] [CrossRef]
- Derebe, B.; Bitew, Y.; Asargew, F.; Chakelie, G. Optimizing time and split application of nitrogen fertilizer to harness grain yield and quality of bread wheat (Triticum aestivum L.) in northwestern Ethiopia. PLoS ONE 2022, 17, e0279193. [Google Scholar] [CrossRef]
- Zende, N.B.; Sethi, H.N.; Karunakar, A.P.; Jiotode, D.J. Effect of sowing time and fertility levels on yield and quality of durum wheat genotypes. Res. Crops 2005, 6, 194–196. [Google Scholar]
- Tyagi, P.K.; Pannu, R.K.; Sharma, K.D.; Chaudhary, B.D.; Singh, D.P. Response of different cultivars to terminal heat stress. T. Agrochem. Cult. 2003, 24, 20–21. [Google Scholar]
- Asseng, S.; Jameison, P.D.; Kimball, B.; Pinter, P.; Sayre, K.; Bowden, J.W.; Howden, S.M. Simulated wheat growth affected by rising temperature increased water deficit and elevated atmospheric CO2. Field Crops Res. 2004, 85, 85–102. [Google Scholar] [CrossRef]
- Kaur, A.; Pannu, R.K.; Buttar, G.S. Quality of wheat (T. aestivum) as influenced by sowing dates and nitrogen scheduling. Indian J. Agric. Sci. 2010, 80, 781–785. [Google Scholar]
- Meena, R.K.; Parihar, S.S.; Singh, M.; Khanna, M. Effects of sowing dates and irrigation regimes on grain quality of wheat grown under semi-arid condition of India. J. Appl. Nat. Sci. 2016, 8, 960–966. [Google Scholar] [CrossRef]
- Shalaby, N.E.; Abdelkhalik, S.A.; Gad, K.I.; Elsamahy, B.E. Effect of sowing date on grain yield and quality of some Egyptian bread wheat genotypes. Egyp. J. Agric. Res. 2023, 101, 643–652. [Google Scholar] [CrossRef]
- Singh, N.; Virdi, A.S.; Katyal, M.; Kaur, A.; Kaur, D.; Ahlawat, A.K.; Singh, A.M.; Sharma, R.K. Evaluation of heat stress through delayed sowing on physicochemical and functional characteristics of grains, whole meals and flours of India wheat. Food Chem. 2021, 344, 128725. [Google Scholar] [CrossRef] [PubMed]
- Gooding, M.J.; Elli, R.H.; Shewr, P.R.; Schofield, J.D. Effects of restricted water availability and increased temperature on the grain filling, drying and quality of winter wheat. J. Cereal Sci. 2003, 37, 295–309. [Google Scholar] [CrossRef]
- Motzo, R.; Fois, S.; Giunta, F. Protein content and gluten quality of durum wheat as affected sowing date. J. Sci. Food Agric. 2007, 87, 1480–1488. [Google Scholar] [CrossRef]
- Farooq, M.; Bramley, H.; Palta, J.A.; Siddique, K.H.M. Heat stress in wheat during reproductive and grain filling phases. Crit. Rev. Plant Sci. 2011, 30, 491–507. [Google Scholar] [CrossRef]
- Singh, S.; Gupta, A.K.; Kaur, N. Influence of drought and sowing time on protein composition, antinutrients, and mineral contents of wheat. Sci. World J. 2012, 2012, 485751. [Google Scholar] [CrossRef]
- Mahdavi, S.; Arzani, A.; Maibody, S.M.; Kadivar, M. Grain and flour quality of wheat genotypes grown under heat stress. Saudi J. Biol. Sci. 2022, 29, 103417. [Google Scholar] [CrossRef]
- Zahra, N.; Hafeez, M.B.; Wahid, A.; Al Masruri, M.H.; Ullah, A.; Siddique, K.H.; Farooq, M. Impact of climate change on wheat grain composition and quality. J. Sci. Food Agric. 2023, 103, 2745–2751. [Google Scholar] [CrossRef] [PubMed]
- Geleta, B.; Atak, M.; Baenziger, P.S.; Nelson, L.A.; Baltenesperger, D.D.; Eskridge, K.M.; Shipman, M.J.; Shelton, D.R. Seeding rate and genotype effect on agronomic performance and end use quality of winter wheat. Crop Sci. 2002, 42, 827–832. [Google Scholar]
- Soofizada, Q.; Pescatore, A.; Guerrini, L.; Fabbri, C.; Mancini, M.; Orlandini, S.; Napoli, M. Effects of nitrogen plus sulfur fertilization and seeding density on yield, rheological parameters, and asparagine content in old varieties of common wheat (Triticum aestivum L.). Agronomy 2022, 12, 351. [Google Scholar] [CrossRef]
- Sun, Y.; Yang, W.; Wu, Y.; Cui, Y.; Dong, Y.; Dong, Z.; Hai, J. The effects of different sowing density and nitrogen topdressing on wheat were investigated under the cultivation mode of hole sowing. Agronomy 2023, 13, 1733. [Google Scholar] [CrossRef]
- Lachutta, K.; Jankowski, K.J. An agronomic efficiency analysis of winter wheat at different sowing strategies and nitrogen fertilizer rates. A case study in north-eastern Poland. Agriculture 2024, 14, 442. [Google Scholar] [CrossRef]
- PN R–74110:1998; Barley—Test Methods. Polish Committee for Standardization: Warszawa, Poland, 1998. (In Polish)
- PN-EN ISO 7971–3:2019–03; Cereals. Determination of Bulk Density, Called Mass per Hectolitre. Part 3: Routine Method. Polish Committee for Standardization: Warszawa, Poland, 2019. (In Polish)
- PN R–74008:1970; Cereal Grain. Determination of Glassiness of Grains. Polish Committee for Standardization: Warszawa, Poland, 1970. (In Polish)
- PN-EN ISO 21415–2:2015–12E; Wheat and Wheat Flour. Gluten Content. Part 2: Determination of Wet Gluten and Gluten Index by Mechanical Means. Polish Committee for Standardization: Warszawa, Poland, 2015. (In Polish)
- PN-EN ISO 5529:2010; Wheat—Determination of the Sedimentation Index—Zeleny Test. Polish Committee for Standardization: Warszawa, Poland, 2010. (In Polish)
- Hagberg, S. A rapid method for determining alpha-amylase activity. Cereal Chem. 1961, 37, 218–222. [Google Scholar]
- Hagberg, S. Note on a simplified rapid method for determining alpha-amylase activity. Cereal Chem. 1960, 38, 202–203. [Google Scholar]
- PN-EN ISO 3093:2010; Wheat, Rye and Respective Flours, Durum Wheat and Durum Wheat Semolina—Determination of the Falling Number According to Hagberg-Perten. Polish Committee for Standardization: Warszawa, Poland, 2010. (In Polish)
- Molga, M. Agricultural Meteorology; PWRiL: Warszawa, Poland, 1958; pp. 550–556. (In Polish) [Google Scholar]
- Bojanowski, J.S.; Sikora, S.; Musiał, J.P.; Woźniak, E.; Dąbrowska-Zielińska, K.; Slesiński, P.; Milewski, T.; Łączyński, A. Integration of Sentinel-3 and MODIS vegetation indices with ERA-5 agro-meteorological indicators for operational crop yield forecasting. Remote Sens. 2022, 14, 1238. [Google Scholar] [CrossRef]
- Statistica (Data Analysis Software System), version 13; TIBCO Software Inc.: Palo Alto, CA, USA, 2017.
- Buczek, J.; Bobrecka-Jamro, D. Assessment of qualitative parameters of population and hybrid wheat grain depending on the production technology. Acta Agrophys. 2015, 22, 247–259. [Google Scholar]
- Hughes, N.; Askew, K.; Scotson, C.P.; Williams, K.; Sauze, C.; Corke, F.; Doonan, J.H.; Nibau, C. Non-destructive, high-content analysis of wheat grain traits using X-ray micro computed tomography. Plant Methods 2017, 13, 76. [Google Scholar] [CrossRef]
- Panazzo, J.F.; Eagles, H.A. Cultivar and environmental effects on quality characters in wheat. II. Protein. Aust. J. Agric. Res. 2000, 51, 629–636. [Google Scholar] [CrossRef]
- McKenzie, R.H.; Middleton, A.B.; Bremer, E. Fertilization, seeding date, and seeding rate for malting barley yield and quality in southern Alberta. Can. J. Plant Sci. 2005, 85, 603–614. [Google Scholar] [CrossRef]
- Waraich, E.A.; Ahmad, R.; Saifullah, S.A.; Ahmad, A. Impact of water and nutrient management on nutritional quality of wheat. Plant Nutr. 2010, 33, 640–653. [Google Scholar] [CrossRef]
- Coventry, D.R.; Yadav, A.; Poswal, R.S.; Sharma, R.K.; Gupta, R.K.; Chhokar, R.S.; Gill, S.C.; Kumar, V.; Kumar, A.; Mehta, A.; et al. Irrigation and nitrogen scheduling as a requirement for optimising wheat yield and quality in Haryana, India. Field Crops Res. 2011, 123, 80–88. [Google Scholar] [CrossRef]
- Forster, S.M.; Ransom, J.K.; Manthey, F.A.; Rickertsen, J.R.; Mehring, G.H. Planting date, seeding rate, and cultivar impact agronomic traits and semolina of durum wheat. Am. J. Plant Sci. 2017, 8, 2040. [Google Scholar] [CrossRef]
- Sadowska, J.; Blaszczak, W.; Jelinski, T.; Fornal, J.; Borkowska, H.; Styk, B. Fertilization and technological quality of wheat grain. Int. Agrophys. 2001, 15, 279–285. [Google Scholar]
- Varga, B.; Svečnjak, Z.; Jurković, Z.; Kovačević, J.; Jukić, Ž. Wheat grain and flour quality as affected by cropping intensity. Food Technol. Biotechnol. 2003, 41, 321–329. [Google Scholar]
- Kozlovsky, O.; Balij, J.; Cerny, J.; Kulhanek, M.; Prasilova, M.; Kos, M. Influence of nitrogen fertilizer injection (CULTAN) on yield, yield components formation and quality of winter wheat grain. Plant Soil Environ. 2009, 55, 536–543. [Google Scholar] [CrossRef]
- Carr, P.M.; Horsley, R.D.; Poland, W.W. Tillage and seeding rate effects on wheat cultivars: I. Grain production. Crop Sci. 2003, 43, 202–209. [Google Scholar] [CrossRef]
- Otteson, B.N.; Mergoum, M.; Ransom, J.K. Seeding rate and nitrogen management on milling and baking quality of hard red spring wheat genotypes. Crop Sci. 2008, 48, 749–755. [Google Scholar] [CrossRef]
- Harasim, E.; Wesołowski, M. The effect of retardant Moddus 250 EC and nitrogen fertilization on yielding and grain quality of winter wheat. Fragm. Agron. 2013, 30, 70–77. (In Polish) [Google Scholar]
- Jańczak-Pieniążek, M.; Buczek, J.; Kaszuba, J.; Szpunar-Krok, E.; Bobrecka-Jamro, D.; Jaworska, G. A comparative assessment of the baking quality of hybrid and population wheat cultivars. Appl. Sci. 2020, 10, 7104. [Google Scholar] [CrossRef]
- Pasha, I.; Anjum, F.M.; Morris, C.F. Grain hardness: A major determinant of wheat quality. Food Sci. Technol. Int. 2010, 16, 511–522. [Google Scholar] [CrossRef] [PubMed]
- Coventry, D.R.; Gupta, R.K.; Yadav, A.; Poswal, R.S.; Chhokar, R.S.; Sharma, R.K.; Yadav, V.K.; Gill, S.C.; Kumar, A.; Mehta, A.; et al. Wheat quality and productivity as affected by varieties and sowing time in Haryana, India. Field Crops Res. 2011, 123, 214–225. [Google Scholar] [CrossRef]
- McKenzie, R.H.; Middleton, A.B.; Dunn, R.; Sadasivaiah, R.S.; Beres, B.; Bremer, E. Response of irrigated soft white spring wheat to seeding date, seeding rate and fertilization. Can. J. Plant Sci. 2008, 88, 291–298. [Google Scholar] [CrossRef]
- Twizerimana, A.; Niyigaba, E.; Mugenzi, I.; Ngnadong, W.A.; Li, C.; Hao, T.Q.; Shio, B.J.; Hai, J.B. The combined effect of different sowing methods and seed rates on the quality features and yield of winter wheat. Agriculture 2020, 10, 153. [Google Scholar] [CrossRef]
- Souza, E.J.; Martin, J.M.; Guttieri, M.J.; O’Brien, K.M.; Habernicht, D.K.; Lanning, S.P.; McLean, R.; Carlson, G.R.; Talbert, L.E. Influence of genotype, environment, and nitrogen management on spring wheat quality. Crop Sci. 2004, 44, 425–432. [Google Scholar] [CrossRef]
- Zhong, Y.; Wang, W.; Huang, X.; Liu, M.; Hebelstrup, K.H.; Yang, D.; Cai, J.; Wang, X.; Zhou, Q.; Cao, W.; et al. Nitrogen topdressing timing modifies the gluten quality and grain hardness related protein levels as revealed by iTRAQ. Food Chem. 2019, 277, 135–144. [Google Scholar] [CrossRef] [PubMed]
- Hao, T.; Chen, R.; Jia, J.; Zhao, C.; Du, Y.; Li, W.; Zhao, L.; Duan, H. Enhancing wheat gluten content and processing quality: An analysis of drip irrigation nitrogen frequency. Plants 2023, 12, 3974. [Google Scholar] [CrossRef]
- Blandino, M.; Marinaccio, F.; Vaccino, P.; Reyneri, A. Nitrogen fertilization strategies suitable to achieve the quality requirements of wheat for biscuit production. Agron. J. 2015, 107, 1584–1594. [Google Scholar] [CrossRef]
- Valdés-Valdés, C.; Estrada-Campuzano, G.; Martinez Rueda, C.G.; Domínguez López, A.; Solis-Moya, E.; Villanueva Carvajal, A. Grain and flour wheat quality modified by genotype, availability of nitrogen, and growing season. Int. J. Agron. 2020, 2020, 1974083. [Google Scholar] [CrossRef]
- Mor, V.B.; Patel, A.M.; Chaudhary, A.N. Performance of bread wheat (Triticum aestivum) under different nitrogen levels and its split application under north Gujarat condition. Indian J. Agron. 2019, 64, 482–488. [Google Scholar]
- Dziki, D.; Cacak-Pietrzak, G.; Miś, A.; Jończyk, K.; Gawlik-Dziki, U. Influence of wheat kernel physical properties on the pulverizing process. J. Food Sci. Technol. 2014, 54, 2648–2655. [Google Scholar] [CrossRef] [PubMed]
- Bożek, K.S.; Żuk-Gołaszewska, K.; Bojarczuk, J.; Gołaszewski, J. The Effect of different nitrogen fertilizer rates, sowing density, and plant growth regulator application on the quality and milling value of Triticum durum Desf. grain. Agronomy 2022, 12, 1622. [Google Scholar] [CrossRef]
- Karabínová, M.; Mečiar, L.; Procházková, M. The influence of fertilization and sowing rate winter wheat baking quality. Acta Fytotech. Zootech. 2001, 4, 77–80. [Google Scholar]
- Gaire, R.; Huang, M.; Sneller, C.; Griffey, C.; Brown–Guedira, G.; Mohammadi, M. Association analysis of baking and milling quality traits in an elite soft red winter wheat population. Crop Sci. 2019, 59, 1085–1094. [Google Scholar] [CrossRef]
- Zheng, J.C.; Zhang, H.; Yu, J.; Liu, T.; Li, W.; Xu, F.; Wang, G.; Liu, T.; Li, J. Late sowing and nitrogen application to optimize canopy structure and grain yield of bread wheat in a fluctuating climate. Turk. J. Field Crops 2021, 26, 170–179. [Google Scholar] [CrossRef]
- Seleiman, M.; Ibrahim, M.; Abdel-Aal, S.; Zahran, G. Effect of sowing dates on productivity, technological and rheological characteristics of bread wheat. J. Agro Crop Sci. 2011, 2, 1–6. [Google Scholar]
- Wu, H.; Wang, Z.; Zhang, X.; Wang, J.; Hu, W.; Wang, H.; Derong, G.; Souza, E.; Cheng, S. Effects of different fertilizer treatments, environment and varieties on the yield-, grain-, flour-, and dough-related traits and cookie quality of weak-gluten wheat. Plants 2022, 11, 3370. [Google Scholar] [CrossRef]
- Grote, U.; Fasse, A.; Nguyen, T.T.; Erenstein, O. Food security and the dynamics of wheat and maize value chains in Africa and Asia. Front. Sustain. Food Syst. 2021, 4, 617009. [Google Scholar] [CrossRef]
- Wieser, H.; Koehler, P.; Scherf, K.A. The two faces of wheat. Front. Nutri. 2020, 7, 517313. [Google Scholar] [CrossRef] [PubMed]
- Hellemans, T.; Landschoot, S.; Dewitte, K.; Van Bockstaele, F.; Vermeir, P.; Eeckhout, M.; Haesaert, G. Impact of crop husbandry practices and environmental conditions on wheat composition and quality: A review. J. Agric. Food Chem. 2018, 66, 2491–2509. [Google Scholar] [CrossRef] [PubMed]
- El-Hawary, M.N.A.; Darwish, M.A.H.; Mohamed, M.M. Evaluation of some bread wheat genotypes under different abiotic stresses. Plant Cell Biotechnol. Mol. Biol. 2022, 23, 20–32. [Google Scholar] [CrossRef]
- Li, Y.F.; Wu, Y.; Hernandez-Espinosa, N.; Peña, R.J. Heat and drought stress on durum wheat: Responses of genotypes, yield, and quality parameters. J. Cereal Sci. 2013, 57, 398–404. [Google Scholar] [CrossRef]
- Ahmed, M.; Fayyaz-ul-Hassan. Response of spring wheat (Triticum aestivum L.) quality traits and yield to sowing date. PLoS ONE 2015, 10, e0126097. [Google Scholar] [CrossRef] [PubMed]
- Thapa, S.; Ghimire, A.; Adhikari, J.; Thapa, A.; Thapa, B. Impacts of sowing and climatic conditions on wheat yield in Nepal. Malays. J. Halal Res. 2020, 3, 38–40. [Google Scholar] [CrossRef]
- Ozturk, A.; Caglar, O.; Bulut, S. Growth and yield response of facultative wheat to winter sowing, freezing sowing and spring sowing at different seeding rates. J. Agron. Crop Sci. 2006, 192, 10–16. [Google Scholar] [CrossRef]
- Altenbach, S.B.; Dupont, F.M.; Kothari, K.M.; Chan, R.; Johnson, E.; Lieu, D. Temperature, water, and fertilizer influence the timing of key events during grain development in a US spring wheat. J. Cereal Sci. 2003, 37, 9–20. [Google Scholar] [CrossRef]
- Sattar, A.; Cheema, M.A.; Farooq, M.; Wahid, W.; Babar, H.B. Evaluating the performance of wheat cultivars under late sown conditions. Int. J. Agric. Biol. 2010, 12, 561–565. [Google Scholar]
- Shah, F.; Coulter, J.A.; Ye, C.; Wu, W. Yield penalty due to delayed sowing of winter wheat and the mitigatory role of increased seeding rate. Eur. J. Agron. 2020, 119, 126120. [Google Scholar] [CrossRef]
- Gooding, M.J.; Pinyosinwat, A.; Ellis, R.H. Responses of wheat grain yield and quality to seed rate. J. Agric. Sci. 2002, 138, 317–331. [Google Scholar] [CrossRef]
- Han, H.; Yang, W. Influence of uniconazole and plant density on nitrogen content and grain quality in winter wheat in South China. Plant Soil Environ. 2009, 55, 159–166. [Google Scholar] [CrossRef]
- Nakano, H.; Morita, S. Effects of seeding rate and nitrogen application rate on grain yield and protein content of the bread wheat cultivar ‘Minaminokaori’ in Southwestern Japan. Plant Prod. Sci. 2009, 12, 109–115. [Google Scholar] [CrossRef]
- Dragoş, M.; Pîrşan, P. Research concerning the influence of sowing period and sowing density on the protein, gluten and starch content of autumn wheat in western Romania. Res. J. Agric. Sci. 2010, 42, 57–62. [Google Scholar]
- Jemal, A.; Tamado, T.; Firdissa, E. Response of bread wheat (Triticum aestivum L.) varieties to seeding rates at Kulumsa, south eastern Ethiopia. Asian J. Plant Sci. 2015, 14, 50–58. [Google Scholar]
- Zhang, J.; Khan, S.; Sun, M.; Gao, Z.Q.; Liang, Y.F.; Yang, Q.S.; Zhang, H.Y.; Li, N. Coordinated improvement of grain yield and protein content in dryland wheat by subsoiling and optimum planting density. Appl. Ecol. Environ. Res. 2018, 16, 7847–7866. [Google Scholar] [CrossRef]
- Hao, R.; Noor, H.; Wang, P.; Sun, M.; Noor, F.; Ullah, S.; Gao, Z. Combined effects of starch sucrose content and planting density on grain protein content of winter wheat (Triticum aestivum L.). J. Food Nutr. Res. 2022, 10, 321–331. [Google Scholar] [CrossRef]
- Landolfi, V.; D’Auria, G.; Nicolai, M.A.; Nitride, C.; Blandino, M.; Ferranti, P. The effect of nitrogen fertilization on the expression of protein in wheat and tritordeum varieties using a proteomic approach. Food Res. Int. 2021, 148, 110617. [Google Scholar] [CrossRef]
- Bogard, M.; Allard, V.; Brancourt-Hulmel, M.; Heumez, E.; Machet, J.M.; Jeuffroy, M.H.; Gate, P.; Martre, P.; Le Gouis, J. Deviation from the grain protein concentration-grain yield negative relationship is highly correlated to post-anthesis N uptake in winter wheat. J. Exp. Bot. 2010, 61, 4303–4312. [Google Scholar] [CrossRef]
- Zörb, C.; Ludewig, U.; Hawkesford, M.J. Perspective on wheat yield and quality with reduced nitrogen supply. Trends Plant Sci. 2018, 23, 1029–1037. [Google Scholar] [CrossRef]
- Landolfi, V.; Visioli, G.; Blandino, M. Effect of nitrogen fertilization and fungicide application at heading on the gluten protein composition and rheological quality of wheat. Agronomy 2021, 11, 1687. [Google Scholar] [CrossRef]
- Xue, C.; Schulte auf’m Erley, G.; Rossmann, A.; Schuster, R.; Koehler, P.; Muehling, K.H. Split nitrogen application improves wheat baking quality by influencing protein composition rather than concentration. Front. Plant Sci. 2016, 7, 738. [Google Scholar] [CrossRef] [PubMed]
- Hu, C.L.; Sadras, V.O.; Lu, G.Y.; Zhang, P.X.; Han, Y.; Liu, L.; Xie, J.Y.; Yang, X.Y.; Zhang, S.L. A global meta-analysis of split nitrogen application for improved wheat yield and grain protein content. Soil Tillage Res. 2021, 213, 105111. [Google Scholar] [CrossRef]
- Schulz, R.; Makary, T.; Hubert, S.; Hartung, K.; Gruber, S.; Donath, S.; Döhler, J.; Weiss, K.; Ehrhart, E.; Claupein, W.; et al. Is it necessary to split nitrogen fertilization for winter wheat? On-farm research on Luvisols in South-West Germany. J. Agric. Sci. 2015, 153, 575–587. [Google Scholar] [CrossRef] [PubMed]
- Ma, W.; Yu, Z.; She, M.; Zhao, Y.; Islam, S. Wheat gluten protein and its impacts on wheat processing quality. Front. Agric. Sci. Eng. 2019, 6, 279–287. [Google Scholar] [CrossRef]
- Šip, V.; Vavera, R.; Chrpova, J.; Kusa, P. Winter wheat yield and quality related to tillage practice, input level, and environmental condition. Soil Tillage Res. 2013, 132, 77–85. [Google Scholar] [CrossRef]
- Wojtkowiak, K.; Stępień, A.; Orzech, K. Effect of nitrogen fertilisation on the yield components, macronutrient content and technological quality parameters of four winter wheat (Triticum aestivum ssp. vulgare) varieties. Fragm. Agron. 2018, 35, 146–155. [Google Scholar]
- Al-Khayri, J.; Alshegaihi, R.; Mahgoub, E.I.; Mansour, E.; Atallah, O.; Sattar, M.; Al-Mssallem, M.; Alessa, F.; Aldaej, M.; Hassanin, A. Association of high and low molecular weight glutenin subunits with gluten strength in tetraploid durum wheat (Triticum turgidum spp. durum L.). Plants 2023, 12, 1416. [Google Scholar] [CrossRef] [PubMed]
- Sharma, N.; Kumar, A.; Sharma, B.; Chand, L.; Sharma, V.; Kumar, M. Effects of sowing dates and weed management on productivity of irrigated wheat (Triticum aestivum). Indian J. Agric. Sci. 2020, 90, 556–559. [Google Scholar] [CrossRef]
- Piekarczyk, M. Effect of fertilisation dose, plant protection input, and seeding density on the yield and grain technological quality of winter wheat grown in short-time monoculture on light soil. Acta Sci. Pol. Agric. 2010, 9, 15–23. [Google Scholar]
- Mikos-Szymańska, M.; Podolska, G. The effects of sowing date and seeding rate on spelt and common wheat protein composition and characteristics. Qual. Assur. Saf. Crops Foods 2016, 8, 289–300. [Google Scholar] [CrossRef]
- Litke, L.; Gaile, Z.; Ruža, A. Effect of nitrogen fertilization on winter wheat yield and yield quality. Agron. Res. 2018, 16, 500–509. [Google Scholar]
- Rossini, F.; Provenzano, M.E.; Sestili, F.; Ruggeri, R. Synergistic effect of sulfur and nitrogen in the organic and mineral fertilization of durum wheat: Grain yield and quality traits in the Mediterranean environment. Agronomy 2018, 8, 189. [Google Scholar] [CrossRef]
- Kizilgeci, F.; Yildirim, M.; Islam, M.S.; Ratnasekera, D.; Iqbal, M.A.; Sabagh, A.E. Normalized difference vegetation index and chlorophyll content for precision nitrogen management in durum wheat cultivars under semi-arid conditions. Sustainability 2021, 13, 3725. [Google Scholar] [CrossRef]
- Ma, D.; Guo, T.; Wang, Z.; Wang, C.; Zhu, Y.; Wang, Y. Influence of nitrogen fertilizer application rate on winter wheat (Triticum aestivum L.) flour quality and Chinese noodle quality. J. Sci. Food Agric. 2009, 89, 1213–1220. [Google Scholar] [CrossRef]
- Bueno, M.M.; Thys, R.C.S.; Rodrigues, R.C. Microbial enzymes as substitutes for chemical additives in baking wheat flour. Part I: Individual effects of nine enzymes on flour dough rheology. Food Bioproc. Tech. 2016, 9, 2012–2023. [Google Scholar] [CrossRef]
- Grausgruber, H.; Oberforster, M.; Werteker, M.; Ruckenbauer, P.; Vollmann, J. Stability of quality traits in Austrian-grown winter wheats. Field Crop Res. 2000, 66, 257–267. [Google Scholar] [CrossRef]
- Korres, N.E.; Froud-Williams, R.J. The effects of varietal selection, seed rate and weed competition on quantitative and qualitative traits of grain yield in winter wheat. Asp. Appl. Biol. 2001, 64, 147–156. [Google Scholar]
- Liniņa, A.; Ruza, A. Impact of agroecological conditions on the Hagberg falling number of winter wheat grain. Res. Rural. Dev. 2015, 1, 19–26. [Google Scholar]
- Szentpétery, Z.; Jolánkai, M.; Kleinheincs, C.; Szöllősi, G. Effect of nitrogen top-dressing on winter wheat. Cereal Res. Commun. 2005, 33, 619–626. [Google Scholar] [CrossRef]
- Erekul, O.; Götz, K.-P.; Koca, Y.O. Effect of sulphur and nitrogen fertilization on breadmaking quality of wheat (Triticum aestivum L.) varieties under Mediterranean climate conditions. J. Appl. Bot. Food Qual. 2012, 85, 17–22. [Google Scholar]
- Corassa, G.M.; Hansel, F.D.; Lollato, R.; Pires, J.L.; Schwalbert, R.; Amado, T.J.; Guarienti, E.M.; Gaviraghi, R.; Bisognin, M.B.; Reimche, G.B.; et al. Nitrogen management strategies to improve yield and dough properties in hard red spring wheat. Agron. J. 2018, 110, 2417–2429. [Google Scholar] [CrossRef]
- Eser, A.; Kassai, K.M.; Kato, H.; Kunos, V.; Tarnava, A.; Jolánkai, M. Impact of nitrogen topdressing on the quality parameters of winter wheat (Triticum aestivum L.) yield. Acta Aliment. 2020, 49, 244–253. [Google Scholar] [CrossRef]


| Parameter | Growing Season | Sowing Date | Growth Stage | |||
|---|---|---|---|---|---|---|
| BBCH 61–73 | BBCH 73–83 | BBCH 83–89 | BBCH 61–89 | |||
| Growing Degree Days (°C) | 2018/2019 | 6 September | 445 | 158 | 93 | 696 |
| 20 September | 450 | 156 | 118 | 718 | ||
| 4 October | 447 | 166 | 187 | 796 | ||
| 2019/2020 | 05 September | 349 | 180 | 120 | 649 | |
| 19 September | 359 | 153 | 107 | 630 | ||
| 3 October | 338 | 160 | 132 | 630 | ||
| 2020/2021 | 3 September | 351 | 202 | 152 | 705 | |
| 17 September | 390 | 171 | 134 | 695 | ||
| 1 October | 381 | 172 | 152 | 706 | ||
| Mean daily temperature (°C) | 2018/2019 | 6 September | 21.5 | 16.3 | 16.6 | 19.2 |
| 20 September | 21.5 | 16.1 | 18.0 | 19.4 | ||
| 4 October | 21.5 | 15.2 | 20.5 | 19.5 | ||
| 2019/2020 | 5 September | 19.0 | 17.0 | 18.3 | 18.2 | |
| 19 September | 18.8 | 17.7 | 18.4 | 18.5 | ||
| 3 October | 19.1 | 17.3 | 18.2 | 18.4 | ||
| 2020/2021 | 3 September | 20.3 | 21.8 | 20.2 | 20.7 | |
| 17 September | 21.3 | 22.1 | 19.9 | 21.2 | ||
| 1 October | 21.6 | 22.2 | 20.2 | 21.4 | ||
| Total precipitation (mm) | 2018/2019 | 6 September | 92.0 | 49.9 | 12.4 | 154.3 |
| 20 September | 91.9 | 49.9 | 29.7 | 171.5 | ||
| 4 October | 101.4 | 52.8 | 23.5 | 177.7 | ||
| 2019/2020 | 5 September | 94.6 | 25.1 | 7.9 | 127.6 | |
| 19 September | 107.4 | 13.4 | 5.7 | 126.5 | ||
| 3 October | 111.0 | 9.9 | 6.3 | 127.2 | ||
| 2020/2021 | 3 September | 55.1 | 56.9 | 41.0 | 153.0 | |
| 17 September | 59.2 | 79.2 | 0.0 | 138.4 | ||
| 1 October | 65.2 | 73.2 | 2.3 | 140.7 | ||
| Sielyaninov index (K) | 2018/2019 | 6 September | 1.59 | 2.19 | 0.93 | 1.64 |
| 20 September | 1.58 | 2.21 | 1.83 | 1.77 | ||
| 4 October | 1.74 | 2.18 | 0.95 | 1.66 | ||
| 2019/2020 | 5 September | 1.99 | 0.98 | 0.48 | 1.43 | |
| 19 September | 2.20 | 0.63 | 0.39 | 1.49 | ||
| 3 October | 2.42 | 0.44 | 0.35 | 1.47 | ||
| 2020/2021 | 3 September | 1.18 | 2.17 | 2.03 | 1.65 | |
| 17 September | 1.16 | 3.59 | 0.00 | 1.52 | ||
| 1 October | 1.31 | 3.29 | 0.11 | 1.53 | ||
| Parameter | Uniformity (%) | Bulk Density (kg hL−1) | Hardness | Vitreousness (%) | Flour Extraction Rate (%) |
|---|---|---|---|---|---|
| Growing season | |||||
| 2018/2019 | 79.1 b | 81.3 a | 62.7 b | 90.9 b | 73.2 b |
| 2019/2020 | 83.0 a | 80.7 c | 58.8 c | 88.9 c | 71.2 c |
| 2020/2021 | 69.7 c | 81.1 b | 68.0 a | 97.1 a | 74.7 a |
| Sowing date, mean for 2018–2021 | |||||
| Early | 78.0 a | 80.4 c | 61.4 b | 89.2 c | 71.8 b |
| Delayed (+14 days) | 76.1 b | 81.2 b | 64.3 a | 92.5 b | 73.2 a |
| Delayed (+28 days) | 77.7 ab | 81.6 a | 63.8 a | 95.2 a | 74.0 a |
| Sowing density (live grains m−2), mean for 2018–2021 | |||||
| 200 | 78.8 a | 81.0 | 63.4 | 93.1 a | 73.2 |
| 300 | 76.2 b | 81.1 | 63.2 | 92.0 ab | 72.9 |
| 400 | 76.9 b | 81.1 | 63.0 | 91.7 b | 73.0 |
| Split spring N rate (kg ha−1), mean for 2018–2021 † | |||||
| 40 + 100 | 76.7 | 81.1 | 64.7 a | 93.2 a | 73.9 a |
| 70 + 70 | 77.8 | 81.1 | 62.0 b | 91.9 b | 73.0 ab |
| 100 + 40 | 77.3 | 81.1 | 62.9 b | 91.8 b | 72.1 b |
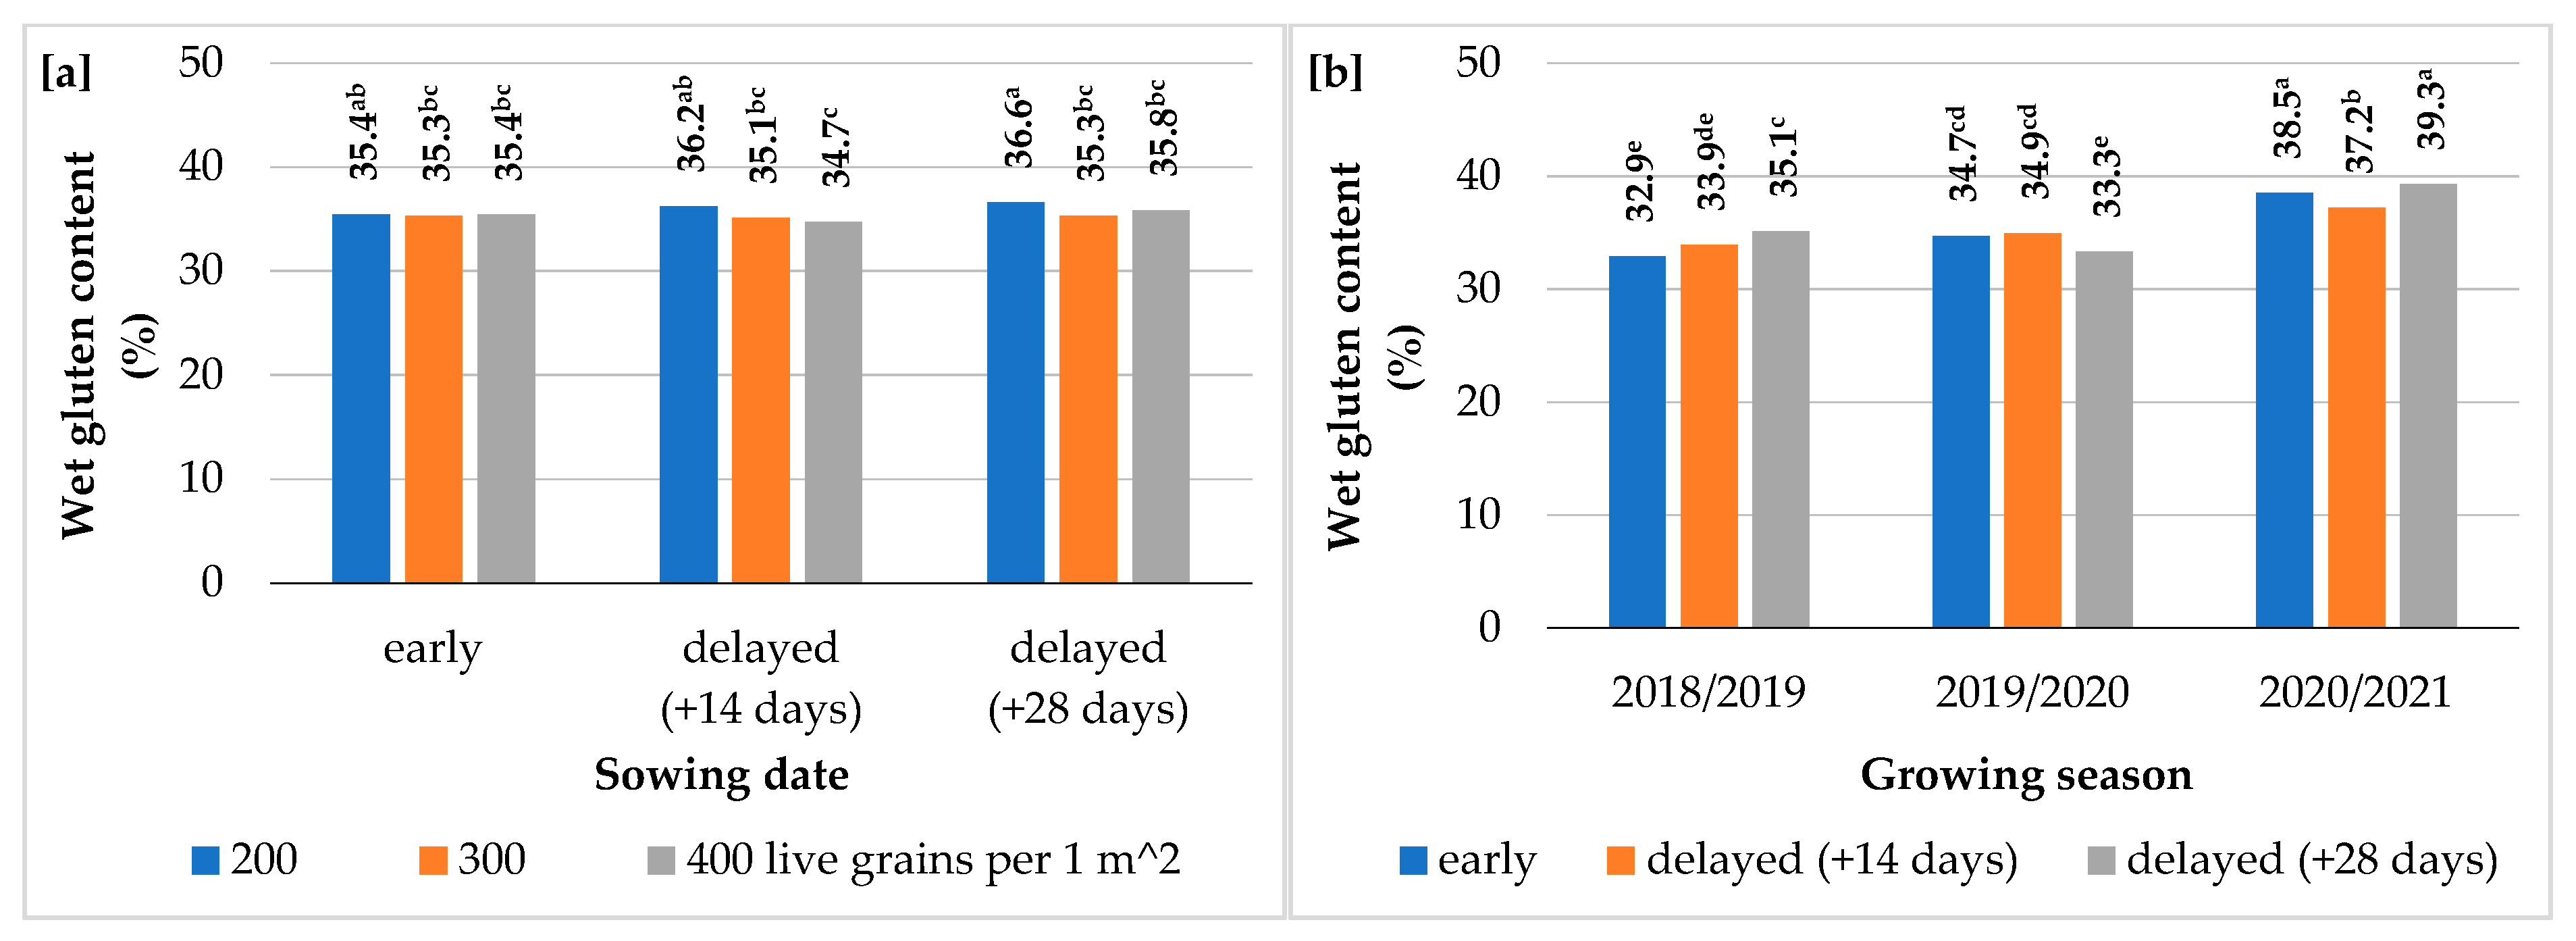
| Parameter | Total Protein Content (g kg−1 DM) | Wet Gluten Content (%) | Zeleny Sedimentation Index (mL) | Falling Number (s) |
|---|---|---|---|---|
| Growing season | ||||
| 2018/2019 | 137 a | 34.0 b | 68.1 b | 364 b |
| 2019/2020 | 129 c | 34.3 b | 68.2 b | 328 c |
| 2020/2021 | 132 b | 38.3 a | 69.0 a | 381 a |
| Sowing date, mean for 2018–2021 | ||||
| Early | 131 c | 35.4 b | 68.0 b | 352 b |
| Delayed (+14 days) | 132 b | 35.3 b | 68.3 ab | 364 a |
| Delayed (+28 days) | 134 a | 35.9 a | 69.0 a | 358 ab |
| Sowing density (live grains m−2), mean for 2018–2021 | ||||
| 200 | 134 a | 36.0 a | 68.8 | 360 |
| 300 | 132 b | 35.3 b | 68.1 | 359 |
| 400 | 132 b | 35.3 b | 68.3 | 354 |
| Split spring N rate (kg ha−1), mean for 2018–2021 † | ||||
| 40 + 100 | 134 a | 36.0 a | 68.9 a | 356 |
| 70 + 70 | 133 b | 35.5 b | 68.4 ab | 359 |
| 100 + 40 | 131 c | 35.2 b | 68.0 b | 357 |
Disclaimer/Publisher’s Note: The statements, opinions and data contained in all publications are solely those of the individual author(s) and contributor(s) and not of MDPI and/or the editor(s). MDPI and/or the editor(s) disclaim responsibility for any injury to people or property resulting from any ideas, methods, instructions or products referred to in the content. |
© 2024 by the authors. Licensee MDPI, Basel, Switzerland. This article is an open access article distributed under the terms and conditions of the Creative Commons Attribution (CC BY) license (https://creativecommons.org/licenses/by/4.0/).
Share and Cite
Lachutta, K.; Jankowski, K.J. The Quality of Winter Wheat Grain by Different Sowing Strategies and Nitrogen Fertilizer Rates: A Case Study in Northeastern Poland. Agriculture 2024, 14, 552. https://0-doi-org.brum.beds.ac.uk/10.3390/agriculture14040552
Lachutta K, Jankowski KJ. The Quality of Winter Wheat Grain by Different Sowing Strategies and Nitrogen Fertilizer Rates: A Case Study in Northeastern Poland. Agriculture. 2024; 14(4):552. https://0-doi-org.brum.beds.ac.uk/10.3390/agriculture14040552
Chicago/Turabian StyleLachutta, Krzysztof, and Krzysztof Józef Jankowski. 2024. "The Quality of Winter Wheat Grain by Different Sowing Strategies and Nitrogen Fertilizer Rates: A Case Study in Northeastern Poland" Agriculture 14, no. 4: 552. https://0-doi-org.brum.beds.ac.uk/10.3390/agriculture14040552