Article

Assessment of the Impact of Small-Scale Irrigation on Household Livelihood Improvement at Gubalafto District, North Wollo, Ethiopia

1
Department of Natural Resource Management, Samara University, P.O. Box 132, Samara, Ethiopia
2
Department of Geography and Environmental studies, Samara University, P.O. Box 132, Samara, Ethiopia
*
Author to whom correspondence should be addressed.
Submission received: 3 March 2016 / Revised: 3 June 2016 / Accepted: 3 June 2016 / Published: 24 June 2016
(This article belongs to the Special Issue Agriculture and Rural Development)

Abstract

:
Ethiopia has been highly affected by drought and climate-related hazards, and millions of people have been left without sustenance every year. To increase productivity and diversify the livelihood scenarios as an option, small-scale irrigation (SSI) schemes have been introduced.This study assessed the impact of SSI in achieving household livelihood improvement and the major challenges of SSI practices in the Gubalafto district. Questionnaires, interviews, focus group discussions, and participant observation data collection tools were used. Proportionally, a total of 374 respondents were included.The collected data was analyzed by descriptive statistics. The application of SSI improved the annual income of irrigator households from 1978.12 to 10,099 Ethiopian Birr (ETB) (1 USD ≈ 20 ETB) before and after using irrigation with a standard deviation of 1534.32 compared to non-irrigators who have an annual average income of 3146.75 ETB with a standard deviation of 1838, respectively. It proved that 32.1% of irrigators increased their frequency of production due to irrigation. Shortage of water, access to improved seeds, marketing, and increment of farm input costs have been hindering SSI practices. Awareness campaigns for non-irrigators and adequate supervision for the irrigators by development agents (DAs) and district officials are important to improve the livelihood of farmers.

Graphical Abstract

1. Introduction

In Africa, agriculture forms the backbone of most of the continent’s economies, providing about 60% of all employment [1,2]. During the last decade, per capita agricultural production has not kept pace with population growth [3,4]. Irrigation is a very old practice, dating back to the earliest civilizations of humankind. It served as one of the key drivers behind growth in agricultural productivity, increasing household income and alleviation of rural poverty, thereby highlighting the various ways that irrigation can impact poverty [5,6,7].To meet food requirements by 2020, the Food and Agriculture Organization for United Nations (FAO) [8] estimated that food production from irrigated areas will need to increase from 35% in 1995 to 45% in 2020. This indicates that access to water for irrigation will become an issue of global concern and competition in the future, especially in the arid and semi-arid regions of the world.
Irrigation use in Ethiopia dates back several centuries, and continues to be an integral part of Ethiopian agriculture. In Ethiopia, modern irrigation began in the 1950s through private and government-owned schemes in the middle Awash Valley where big sugar, fruit and cotton state farms are found [1,2,9,10]. In Ethiopia, irrigation development is a priority for agricultural transformation, but poor practices of irrigation management discourage efforts to improve livelihoods, and expose people and the environment to risks [2,11]. Irrigation projects have been failing mainly because of insufficient participation by beneficiaries and insecurity of land tenure. Socioeconomic, cultural, religious and gender-related issues pose a problem to full and equal participation by beneficiaries [2,10]. Moreover, the poor performance of irrigation in the country, systematic and holistic evaluation of irrigation management in general and of small-scale irrigation in particular is lacking [12,13,14,15]. The main purpose of irrigation development in the 1960s was to provide industrial crops for agro-industries in the country. The agro-industries were established by foreign investors and had the objective of increasing export earnings.
In most parts of Ethiopia, production from rain-fed agriculture has been highly fluctuating, corresponding to the amount and distribution of rainfall [16,17]. When there is too little rainfall with uneven distribution, crop failure is unavoidable. In spite of all this, agricultural growth still contributes to the improvement of food security conditions and household empowerment in the country. However, as it now stands, droughts occur far too often and food security in all its extent could not be sustained. Irrigation would have to be introduced in a significant way for a sustainable attainment of food security and rural transformation at the national level [14,16].
Agriculture is comprises the principal land use and remains the major source of livelihood for the rural poor people in Ethiopia [1,2,10,18]. Irrigation is one of the possible means of feeding the rapidly growing population. Consequently, numerous modern and large-scale irrigation schemes have been established in the country. As a result, there is a growing interest in small-scale irrigation (SSI) development for food as well as for rural development. The development of SSI schemes managed and controlled by farmers is seen as a viable and practical alternative to large-scale conventional schemes. SSI in the Ethiopian context refers to smallholder farms with the size of scheme amounting to less than 200 ha. SSI schemes can be adapted easily to suit local socioeconomic and environmental conditions [18].
The adoption of sustainable water management and irrigation development programs, as well as strong linkages with private sectors and markets with institutional support are essential; these could provide plenty of opportunities in terms of a coping strategy for climatic change, poverty reduction, wealth creation, growth of economy and reducing the environmental impact of agricultural expansion to marginal land under rapid population growth [14,19].
SSI development is one of the components of water resource development. Ethiopia has large water potentials that could be used for a wide range of irrigation development programs. It has 12 major river basins with an annual water runoff volume of more than 122 billion cubic meters [11]. In addition, the groundwater potential is estimated to be more than 2.6 billion cubic meters [12,14].
Currently, about 3% to 5% of the irrigable land is irrigated while the irrigation potential has been estimated to be about 4.3 million hectares of arable land [13,14] Irrigated agriculture is becoming increasingly important in meeting the demands of food security, employment, rural transformation and poverty reduction. For Ethiopia, increasing agricultural productivity, enabling households to generate more income, increasing their resilience as well as transforming their livelihoods stands out as the most pressing agenda now and for the coming decades. SSI is a policy priority in Ethiopia for rural poverty alleviation, climate change adaptation and growth [20,21].
Like the national scenarios, in large parts of Gubalafto district, agriculture is also increasingly susceptible to climatic hazards. The principal feature of rainfall in most parts of the district is seasonal character, poor distribution and variability from year to year (1030 to 990 mm) [22]. Yasin [22] also noted that erratic distribution of rainfall has been the major climatic factor affecting crop yields in the study areas. Thus, designing SSI schemes is necessary and could bring social, cultural and economic importance to the beneficiaries. This depicts the fact that if we maximize our efforts to utilize the untapped water resources for irrigation development, we will be able to improve the household livelihood and overcome the challenges of food insecurity within the shortest time possible [13,14].
Since the 1970s, recurrent drought, unreliable and poor distribution characters of rainfall has resulted in crop and pasture failure. These have in turn brought about food shortage and famine, particularly in the northern part of the country including the study district. In response to these, irrigation practices have been introduced since the 1970s.Currently, there are four modern and 231 traditional irrigation schemes with a total of 534 and 191 hectares of the land irrigated by modern and traditional irrigation systems, respectively. However, there are very limited studies focusing on the performance of SSI schemes. To date, there are no recent studies on the impact of SSI on household’s livelihood development in northern Ethiopia, particular in the studied district. Moreover, previous detailed field investigations about the role of the SSIs have focused mainly on the livelihood improvements of irrigators, and the main problems faced by irrigators during SSI operations are thus required. After detailed investigations of the impact of the practices, recommendations for improving the system, especially regarding how SSI practices are likely to be successful and sustainable, will be drawn. Therefore, the objectives of the study were: (i) to assess the contribution of SSI implementation for household livelihood improvement; (ii) to identify the major challenges faced during the application of SSI practices in the selected SSI schemes.

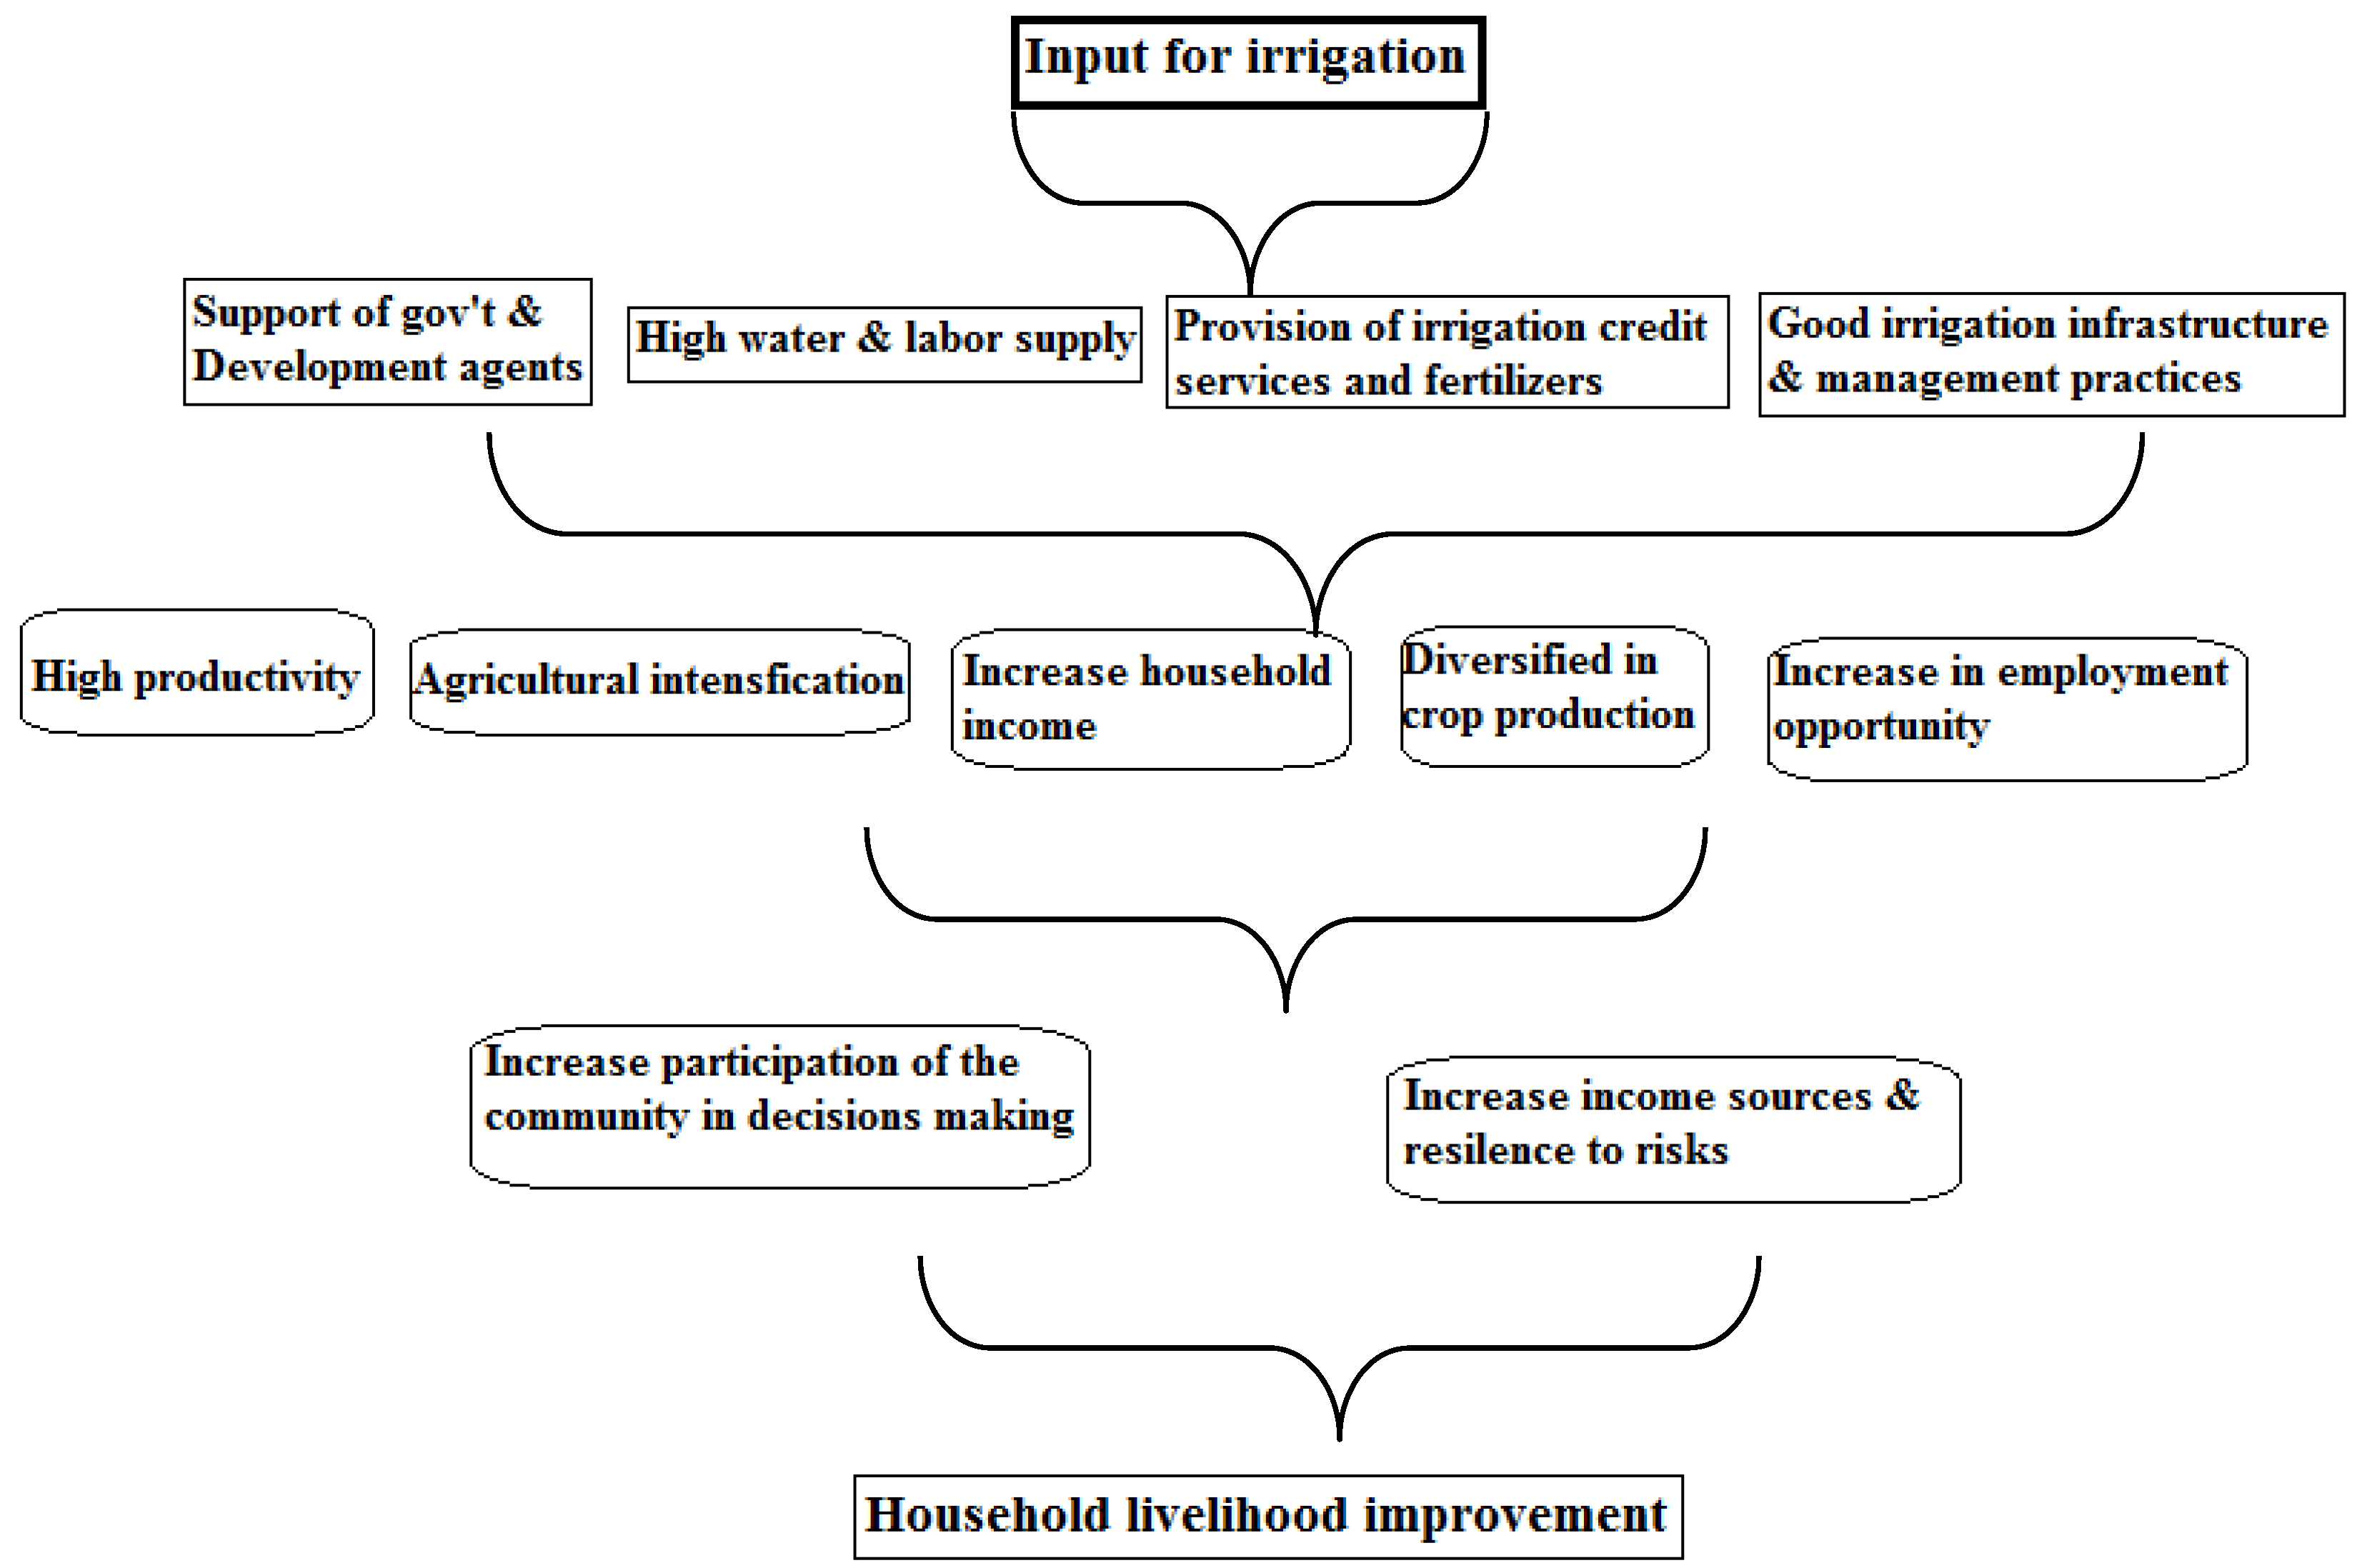
Conceptual Framework of the Study

In order to enhance small-scale irrigation schemes to improve households’ livelihood, many factors must be considered: high water and labour supply, provision of credit services and agricultural chemicals, good irrigation infrastructure and management practices, support of government and development agents (DAs) are all very essential. Therefore, by using these inputs, we can increase rural people’s household incomes, livelihood diversification, agricultural intensification, productivity, employment opportunities, income variance and resilience to risk, and participation in community decisions. Therefore, keeping other variables constant, all these and other outputs of SSI developments combined have the capacity to achieve livelihood development in rural areas, thereby reducing the present chronic food insecurity problem in particular and poverty in general (Figure 1). Smith [23] supports this concept as illustrated in Figure 1:

2. Materials and Method

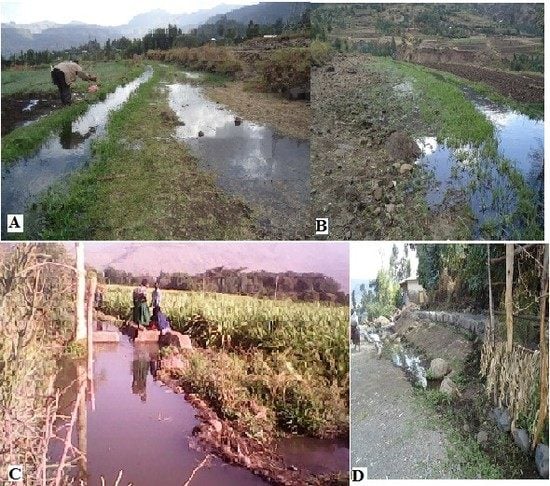
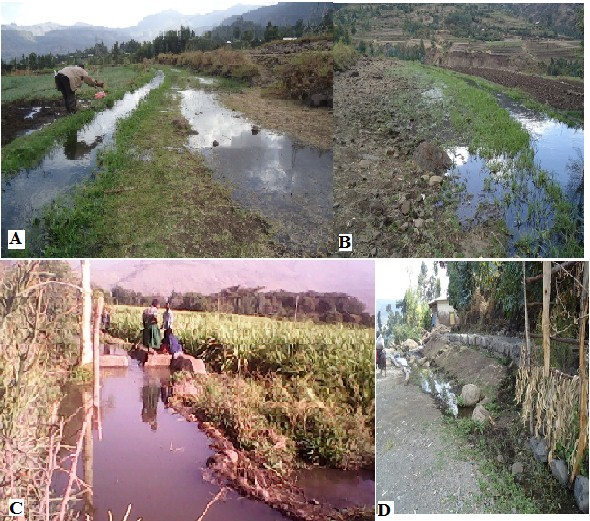
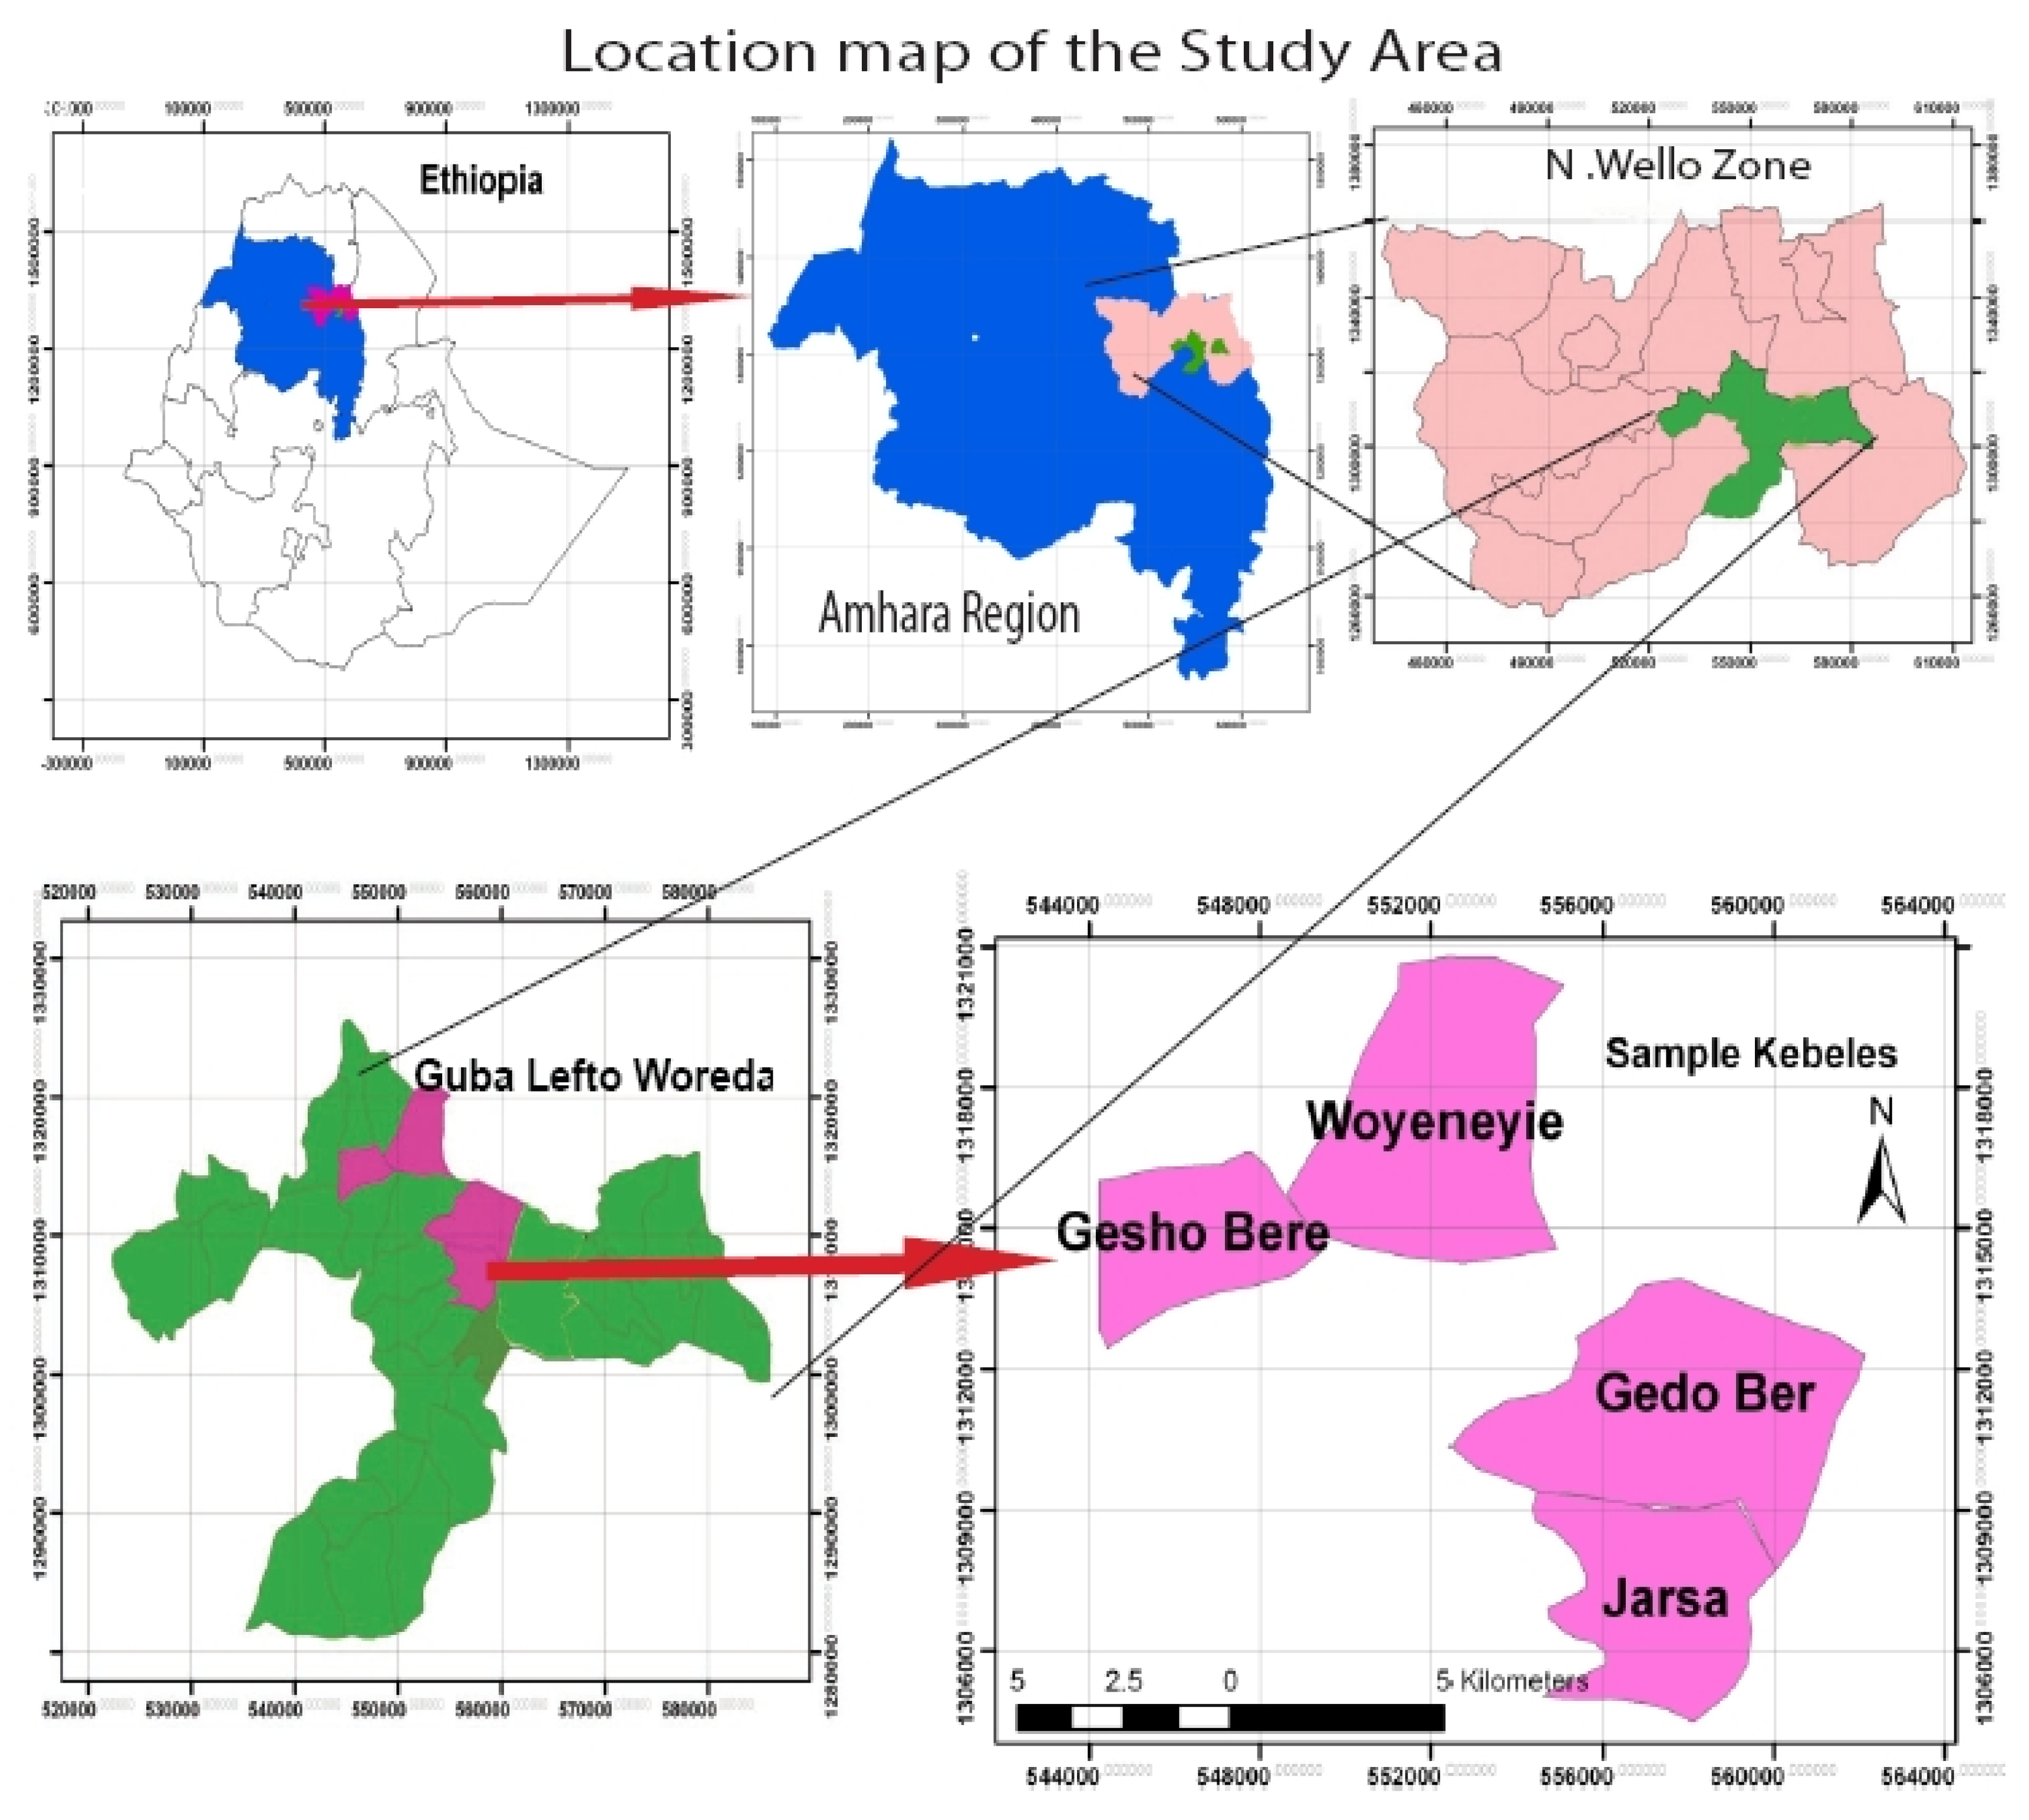
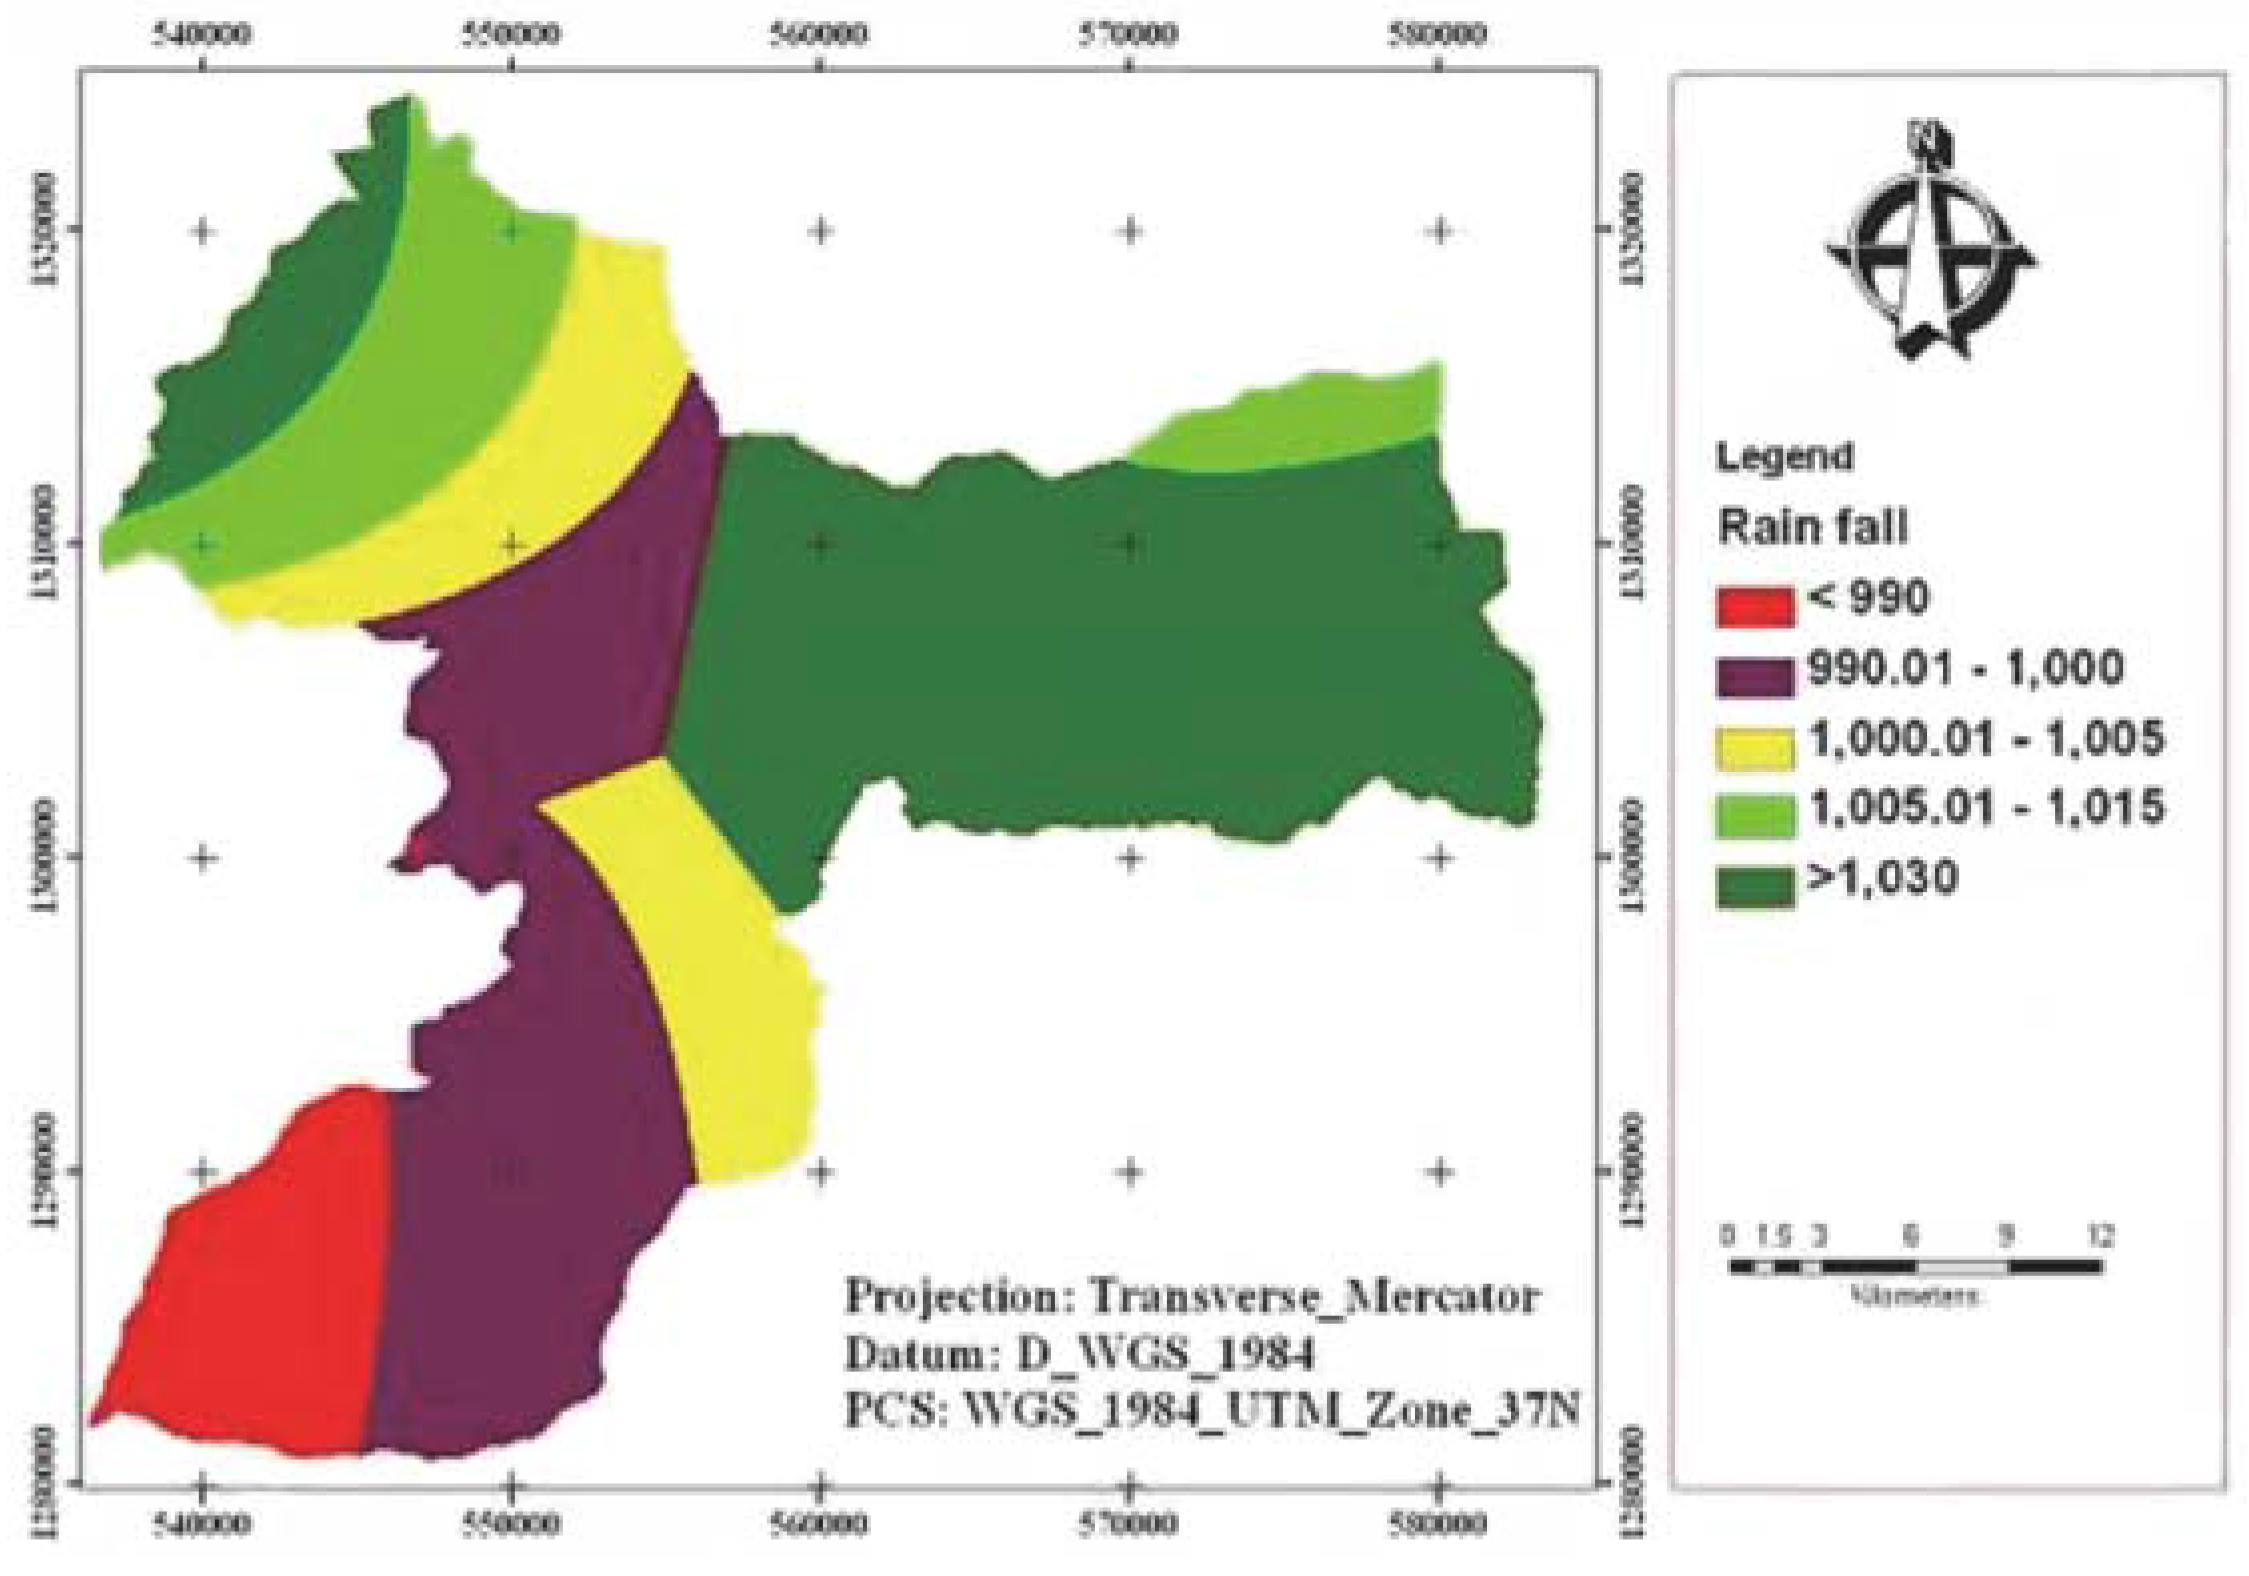
2.1. Description of the Study Area

2.1.1. General Characteristics of the Study Sites

The study was conducted in Gubalafto district, which is found in the Amhara National Regional State, North Wollo, Ethiopia (Figure 2).Geographically, the study site is located at 11°34′54′′ Nand 11°58′59′′ N, 39°12′09′′ E and 39°45′58′′ E. It is situated 521 km from Addis Ababa and 380 km from the regional capital, Bahir Dar. The altitude of the district ranges from 1379 to 3200 meter above sea level. The annual rainfall is erratic in nature, and varies widely. There exist a number of mountains that affect the distribution of rainfall in the district. Accordingly, the mean annual rainfall ranges from 1030 to 990 mm [24]. According to the daily air temperature data collected from Sirinka Agriculture Research Centre located 20km south of the study sites, the mean monthly temperature ranges between 21 °C and 25 °C, respectively. The rainfall is seasonal in nature, has poor distribution across areas and is variable from year to year (Figure 3).It is bimodal in nature; there is a short rainy season, locally known as “belg”, which occurs between February and April, and a long rainy season, the “kiremit”, which occurs between June and September. In most cases, the highland areas/the Dega zone are mainly dependent on belg rain, whereas the Woinadega and Kolla areas are meher rain dependent for crop production.

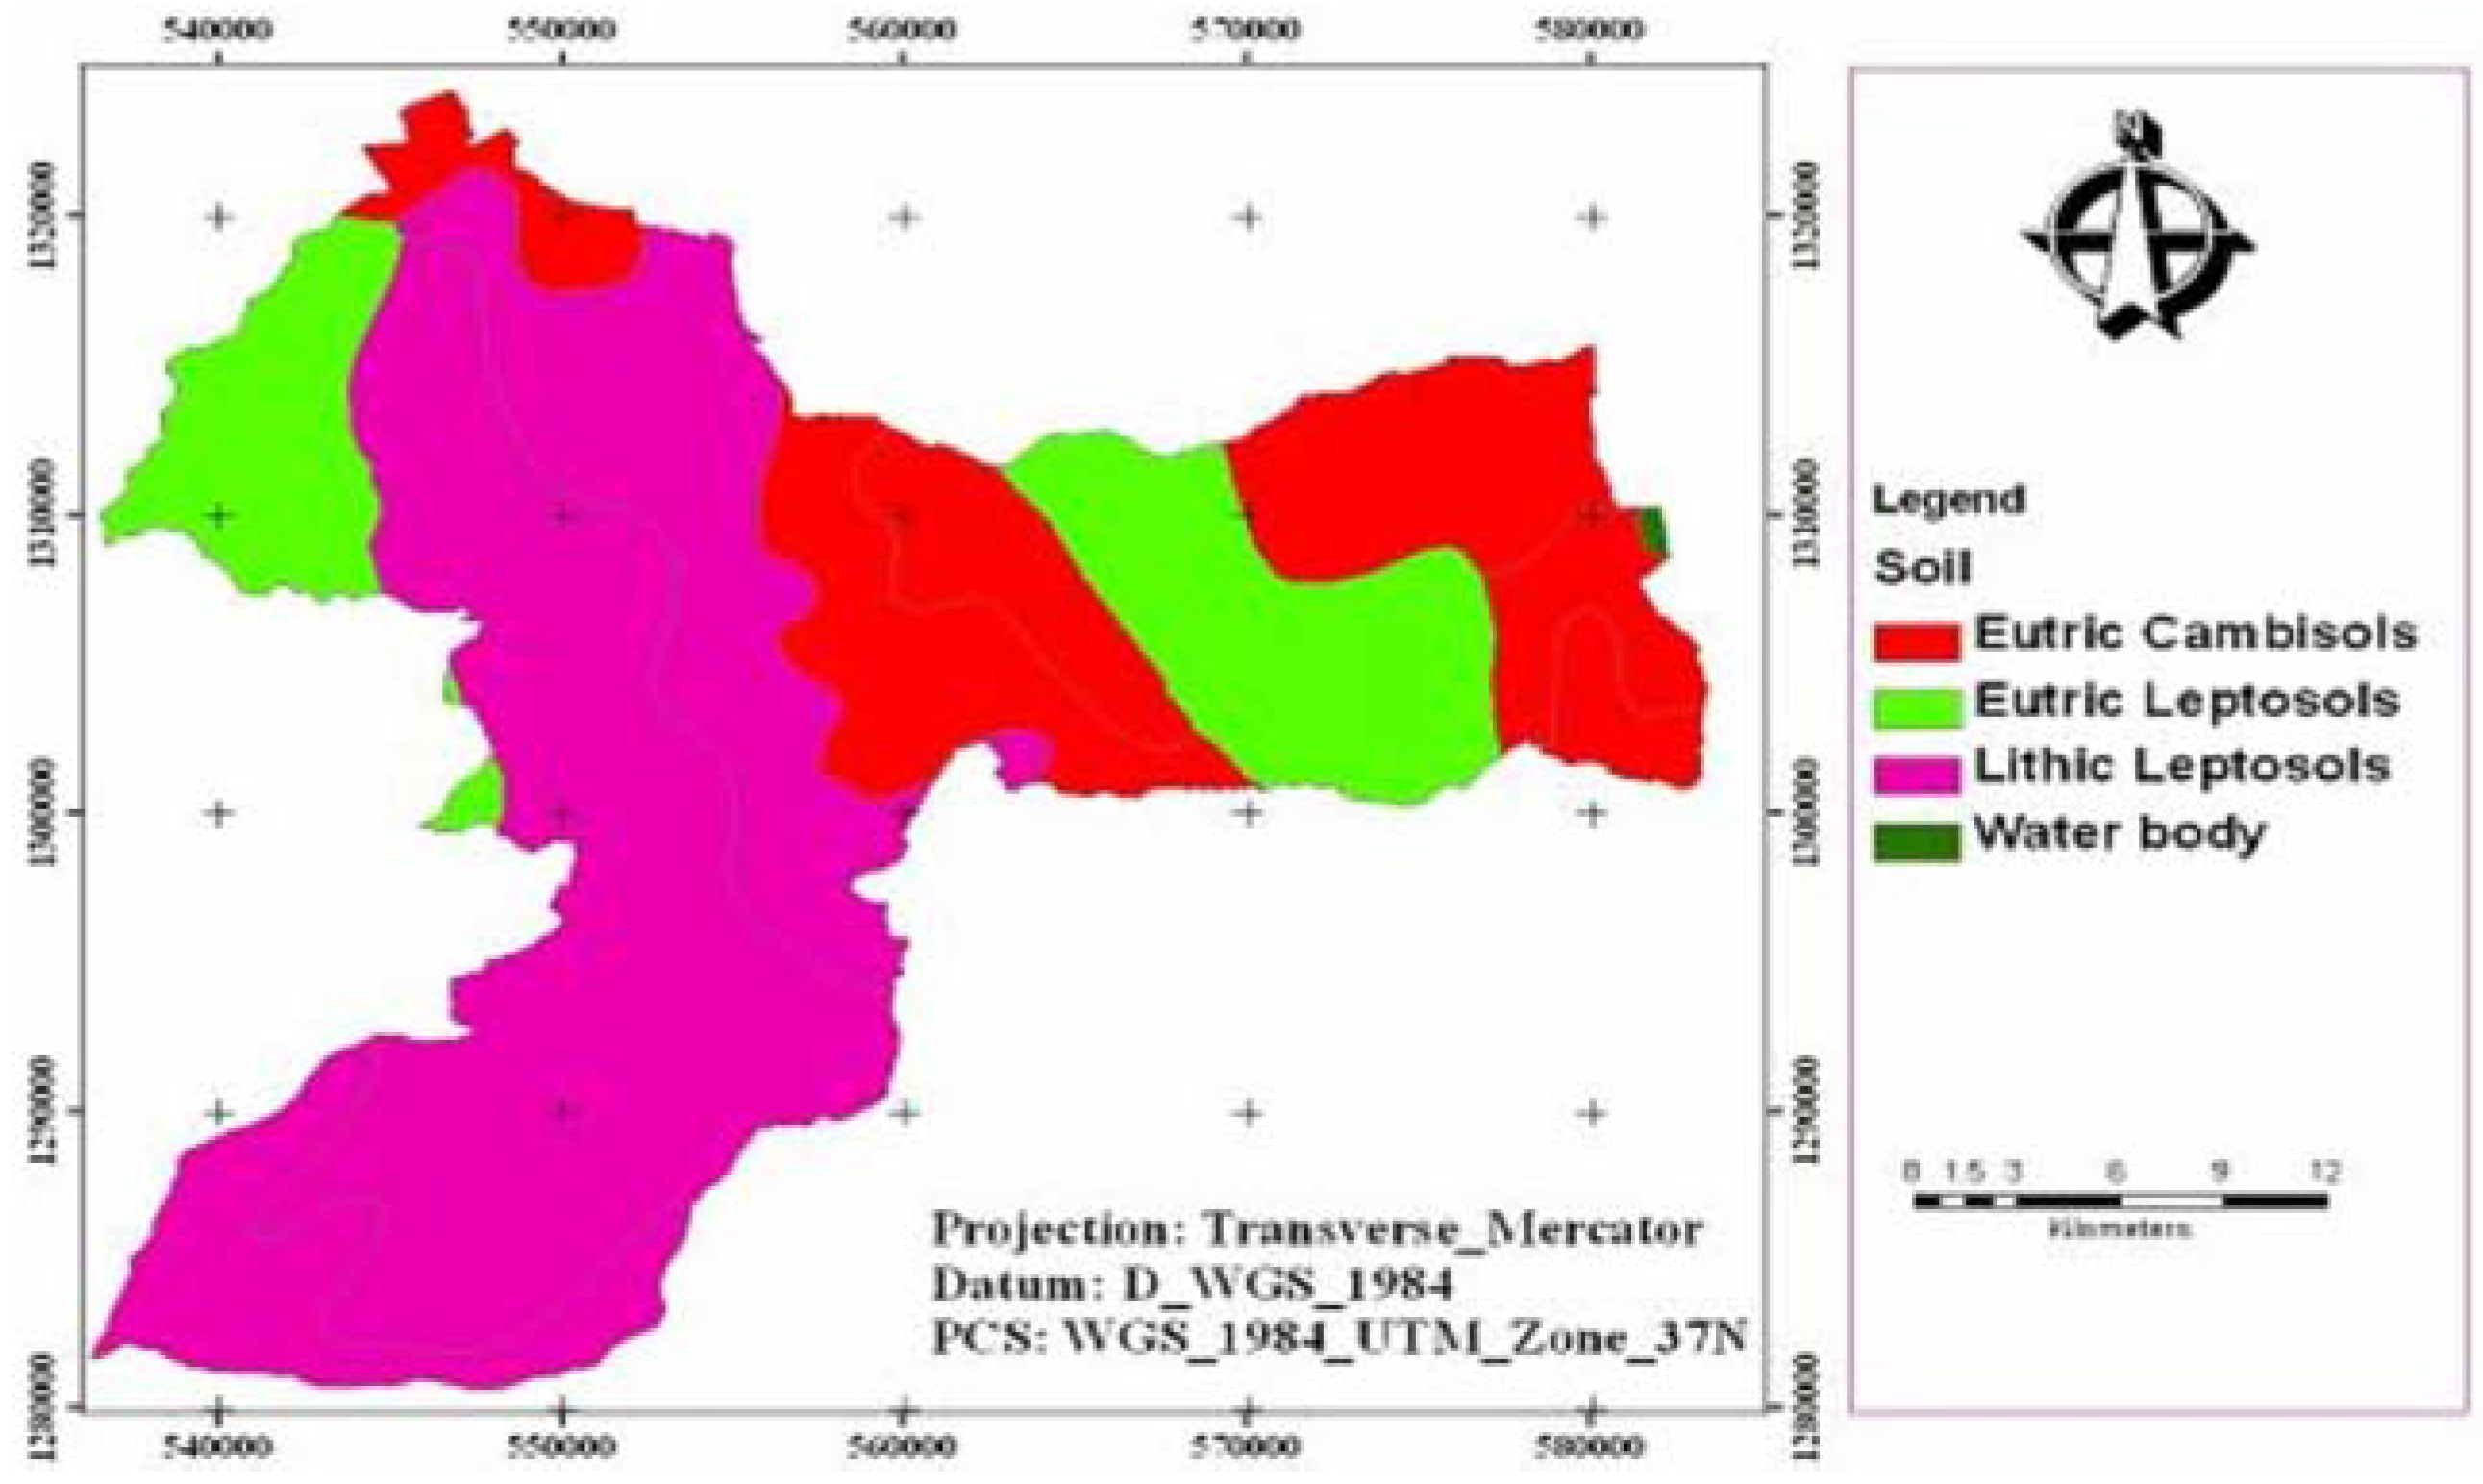
2.1.2. Land Use and Soil Types

The land use pattern of the district includes arable land (34.1%), grazing land (17.9%), forest (27.1%), and water bodies (6%), rocky land (5%) and others (9.9%), respectively. At the district level, the average land-holding size for a farmer has been estimated to be 0.78 hectares ranging from 0.4 hectares in the highland areas to 1.93 hectares in the lowland areas of the district. In the district, there are about four modern and 231 traditional irrigation schemes. Currently, about 534 and 191 hectares of the land are irrigated by modern and traditional irrigation systems, respectively. In this study, modern irrigation is viewed as an irrigation system which applies a motorized pump for ground water extraction; has lined canals; and uses drip, furrow, and sprinkler irrigation systems on their command areas. Modern irrigation employs other technologies enabling available water to be used more efficiently. The water application efficiency is more than 80%.Traditional irrigation, however, means simply diverting water from rivers and irrigating the command area using floods’ irrigation systems without technological application. The water application efficiency, conveyance efficiency and other metrics are very poor. The soil types of the district include sandy clay (46%), clay-loam-brown (39%), sandy soil (8%) and silt soil (7%), respectively (Figure 4).
The district is dominated with Lithic Leptosols (92.2%), Eutric Cambisols (3.9%) and Eutric Leptosols (3.5%). Sugarcane, potato, tomato, cabbage, banana, orange, lemon, onion, green pepper, chat and coffee are the major crops cultivated using irrigation.

2.2. Research Methods

2.2.1. Research Design

The study employed cross-sectional data collection tools because it is better and more effective for obtaining information about the current status or the immediate past of the case under study. It is also appropriate and suitable to use data collection tools such as questionnaires, interviews, focus group discussions (FGD), field observations, and document analyses. Many researchers have used cross-sectional research design (e.g., [25,26]). The data collection work was undertaken in 2014.Both quantitative (questionnaire, secondary documents) and qualitative data collection instruments (FGD, key informant interviews (KI), and field observations) have been used.

2.2.2. Sampling Techniques and Sample Size Determination

Based on population concentration in the schemes, the type of SSI they used, and the recommendation of the Agricultural and Rural Development Experts of the district, three SSI schemes namely, Sanka (Woyeneyie and Geshober), Gedober (Al-Meda), and Jarsa (Aba-kolsha), were purposively selected. The household heads from both irrigator and non-irrigator groups were selected from the respective schemes. From each irrigation scheme and peasant association, sample households were proportionally selected. In this regard, the sample populations were categorized into irrigators and non-irrigators and they were sorted alphabetically to use random tables and then the appropriate sample size was determined.
For every selected sample size of irrigation scheme beneficiaries (irrigators), proportional sample sizes of non-irrigators were selected. The total irrigator households found in the three schemes (Sanka, Gedober and Jarsa) were 1856, 1065 and 576, respectively. Additionally, the total non-irrigator households found in three schemes include 1335, 800 and 228, respectively. Therefore, in order to select the sample household, the researchers used the Formula (1) of Taro [27];
n = N 1 + N ( e ) 2
where: n = the number of required sample of each irrigation scheme (sample size); N = total households of each irrigation scheme (population size); e = confidence level (0.05 (95%) level of precision); and ΣN = total households of the three irrigation schemes.
The required sample households of each irrigation scheme (n) were, calculated using the Formula (2):
n 1 = N 1 ( n ) N
Proportional sampling technique was used to develop the overall sample size. Accordingly, 223 irrigators and 151 non-irrigators with a total of 374 sample households were taken, respectively (Table 1).

2.2.3. Data Collection Instruments

A conventional household survey was used to collect quantitative information. In this regard, carefully designed open and close-ended questionnaires consisting of interrelated issues were administered by trained college student enumerators under the supervision of the researchers and the development agents of the respective schemes. Sample household heads were the unit of analysis from whom quantitative information was collected. To convey the questions effectively to the rural interviewees, the questionnaires were translated into the local language (Amharic). For the sake of checking the reliability, a pre-test was administered for a few randomly selected households in the studied district. Based on the feedback obtained, some possible adjustments and modifications were made. Then, the questionnaires were administered to the sample irrigator and non-irrigator households.
In order to cull the most pertinent information, transect walks with the researchers, DAs (development agents), model irrigator farmers, water use committees and peasant association leaders across each village of irrigation schemes for personal observations were conducted. During the transect walks, informal discussions with households and elderly people have been conducted to gather useful and detailed information which would have been difficult to collect through the questionnaire.
Focus group discussions (FGD) with development agents, district agricultural and rural development office irrigation experts and irrigating and non-irrigating farmers to gather qualitative data were conducted. Initially, FGD were held with irrigator model farmers who directly engaged in small-scale irrigation activities. The second FGD was made with development agents. After thorough discussions with farmers and development agents, another focus group discussion with district agricultural and rural development office irrigation experts were undertaken.
Individuals who were considered as knowledgeable and rich in experiences about irrigation activities and the socioeconomic conditions of the community were identified and data was collected using a semi-structured questionnaire. Key informant interviews (KI) with elderly people, model farmers, water use committee members, development agents, and zonal irrigation experts were also conducted.

2.2.4. Methods of Data Analysis

The data generated through questionnaires, key informant interviews, transect walks and formal and informal discussions were analyzed and interpreted qualitatively and quantitatively. The data analysis was carried out using the Statistical Package for Social Science (SPSS, Version-19, SPSS Inc., New York, NY, USA) software. The quantitative data were first recorded and organized in a Microsoft Excel spreadsheet. Simple descriptive statistical methods such as average, percentage, standard deviation, and frequency distribution were used. The qualitative data analysis was used to see the relationships between the variables and they were then analyzed through systematically organizing the information and giving attention to local situations, opinions, perceptions and preferences of households and institutions operating in the district. In order to see the socioeconomic impact of SSI between irrigator and non-irrigator households of the study area, comparative analyses were made. In order to characterize the selected SSI systems, the major challenges faced in relation to irrigation systems and the reason why non-irrigating households do not irrigate were extracted using structured checklists. To show to what extent or degree these major challenges affect households not involved in irrigation activities were done using Microsoft Excel spreadsheet.

3. Results and Discussion

3.1. Socioeconomic and Demographic Characteristics of the Respondents

As can be seen in Table 2, males predominate in the activity (68.7%). The fact that there are more men than women in irrigation activities corroborates similar findings of other studies, such as [4,15,22], where subsistence rural food production is found to be an activity usually practiced by males. From the interviewed household heads, the minimum and maximum ages of the respondents are 19 and 79 with the average and standard deviation of 44.45 and ±13.87 years, respectively.Education plays a key role in the household’s decision to adopt technology. It creates awareness and encourages innovation and invention. The study revealed that 33.2% of the users and 22.5% of the non-users of SSI are illiterate (Table 2).
About 56.4% of the respondents had not attended school and are illiterate, whereas only24.6% can read and write. Those who had completed an elementary level of education made up only 16.8%. An interesting point one may obtain from a careful observation of Table 2 is that there is a remarkable difference in level of education within irrigating and non-irrigating households. About 33.1% of the irrigators are illiterate compared with only 23.2% of the non-irrigators. Hence, it can be concluded that a low level of education is correlated with the non-irrigator category. It is believed that educated farmers are more aware of irrigation’s technological inputs, utilizations, and risks. Our findings confirmed that education has an impact on the involvement of farmers on irrigation practices. However, it is also important to note that SSI is practiced by people with different educational levels ranging from analphabets to those who attended university.
More than 66.1% of the respondents are married. The proportion of divorced household heads takes the second position (20.2%) followed by widowed (11.2%) and single households (1.9%), respectively. It is also crucial to note that 41.2% of the users and 24.9% of the non-users of SSI are married.

3.1.1. Household Size and Types of Housing

The number of persons in a household influences the amount of labor the household can expend on irrigation agriculture and the amount of food consumed. As illustrated in Table 2, 40.2% of the households have 5–6 persons per household. In addition, 24.9% and 15.3% irrigator and non-irrigator households have the same family size, respectively.
About 4.6% of the total sampled households have a family size of 1–2 persons per household and 2.4% of the total sampled households have a family size of more than eight persons per household. There was statistically significant difference of 0.043 at a 95% degree of freedom between irrigator and non-irrigator sampled households with respect to family size.
As can be seen in Table 2, 45.8% of irrigator households have corrugated iron-roofed houses and the remaining 13.9% of irrigator households have grass-roofed houses. While 25.1% non-irrigator households have grass-roofed houses, the remaining 15.3% of households have corrugated iron-roofed houses. The types of housing are an indicator of improving the well-being of rural households. In rural Ethiopia, most of the houses are grass-roofed, but wealthier households have a corrugated iron roof [15,22,28,29]. Therefore, we can say that using irrigation is potentially correlated to having a corrugated iron-roofed house.

3.1.2. Livestock Income of the Respondents

Next to crop production, livestock is the most important productive asset. It plays a role in religious and cultural ceremonies, is a source of power for ploughing, and serves as source of prestige [15]. In line with this particular reference, livestock is also considered a saved asset used during the periods of food shortage.
According to the data collected from KI and FGD, because water is accessible from the irrigation canals, irrigator farmers have high animal feed potential both from irrigated and rain-based cropping and animals do not need to be sold to get food (Table 3). Therefore, each irrigator household has high livestock numbers with relatively good quality and they have the potential for a higher income from the sector. There are also households who practice intensive farming (dairy and fattening), especially in the Woinyie scheme with the special support of the professionals of Sirinka Agricultural and Research Center. However, unlike irrigators, non-irrigators have insufficient animal feed resources. The FGD further indicated that due to absence of enough food, and because what is there is only from rain-fed cropping, the livestock of the non-irrigators’ are necessarily sold to get food. Therefore, each non-irrigator household had a small livestock population with poor quality.

3.1.3. Off-Farm Income of the Respondents

Off-farm incomes are also important for improving the purchasing power of rural households and addressing food security in Ethiopia. It has also described as “petty trading” and has become an important off-farm occupation for many poor farmers who have less access to land and water for irrigation [18]. Similarly, petty/local trading is one of the sources of off-farm income in the study areas (Figure 5).
For instance, there is sugarcane, potato and tomato trading in Sanka and Woldiya/Adagomarket centers, and sugarcane and tomatoes are often transported to Dessie, Kobo and Dilb towns and used as another income source (Figure 6C,D). Other sources of off-farm income include: renting out of the idle or extra oxen; getting involved in daily labor works and self-employment activities, such as handicrafts, selling wood and wood products, or selling local drinks (Tela, Areki, etc.); transporting people and goods by using carts/garies; salary from temporary or permanent employment; remittance; and/or income from mills and shops. The data for off-farm income of respondents were collected on a daily and monthly basis and converted to estimate annual average income.
The result revealed that the annual average off-farm incomes for sampled male and female irrigator households of the Geshober SSI scheme were found to be 1887.26 (1 USD ≈ 20 ETB) and 1500 ETB, respectively, whereas the annual average off-farm incomes of non-irrigator male and female household were 938.89 and 490 ETB, respectively. When we see the annual average off-farm incomes from the SSI scheme perspective, male and female irrigator households of the Woyeneyie SSI scheme were found to be 995 and zero ETB, respectively. The non-irrigator male and female households of this SSI scheme were also 56.86 and 87.50 ETB, respectively. The annual average off-farm incomes of male and female irrigator households of Gedober/Al-meda scheme were 1138.75 and 26.78 ETB, respectively. Moreover, the average off-farm incomes of the non-irrigator male and female households of this scheme were found to be 87.37 and 134.62 ETB, respectively (Figure 5).
In addition to this, the average off-farm income of male and female irrigator households of Jarsa were 1300 and zero ETB, respectively, whereas the annual off-farm incomes of male and female non-irrigators of this scheme were 150 and 290 ETB, respectively. From these figures, it is safe to conclude that in the Gedober and Jarsa schemes, the involvement of female-headed households in off-farm activities were found to be lower than male-headed households. The reason behind this could be cultural factors, though this requires further investigation.

3.2. The Impact of Small-Scale Irrigation

3.2.1. Annual Average Income and Costs of the Respondents

The current income of the non-irrigator households of the study area ranges from 400 to 9500 ETB with an average income of 3146.76 ETB with a standard deviation of ±1838, respectively (Table 4). Hence, in order to anticipate further analysis, the variability of distribution of the income was also assessed by examining the values of the standard deviation.
The irrigator households started using irrigation at different times, but the average starting year was found to be 9.3 years ago. The minimum and maximum years of the households while starting irrigation were 3 and 22 years, respectively with a standard deviation of ±4.13 years. The findings also revealed that the irrigator households’ income before using irrigation ranged from 70 to 8000 ETB. The annual average income of irrigator HHs was 1978.12ETB with a standard deviation of ±1534.32, respectively, whereas the households’ annual average incomes after using irrigation ranges from 1500 to 60,000 ETB with a standard deviation of ±7865.59, and the annual average income of the irrigator households was found to be 10,099.05 ETB. Therefore, there is a greater variability between households’ income before and after using irrigation in the study areas. This confirms that using irrigation has a great role in improving the income of the irrigators than the households that abstained rain-fed farming. However, these figures are without considering the inflation rates of the country.
The value for inflation, annual average consumer prices (%) in Ethiopia was 8.14 as of 2010 (Table 5).
Over the past 44 years, this indicator reached a maximum value of 44.39 in 2008 and a minimum value of −9.81 in 1986 [31]. By using this concept as a benchmark, the current annual average income of the irrigator households was calculated. Based on the computation, the average annual income before and after using irrigation were calculated as 1978.12 and 10,099.05 ETB with a standard deviation of ±9.3, respectively. However, to know whether irrigation has impacted increasing average annual income levels of the irrigator households or not, it is better to consider the inflation rate of the country. As a result of this, the nine-year (2004 to 2012) average consumer price inflation rate of Ethiopia was found to be 13.5% (Formula (3)).Therefore:
10 , 099.05 E T B x 13.5 % 100 = 1 , 363.37 E T B 10 , 099.05 1363.37 = 8 , 735.68 E T B
We can now compare the income of irrigators before and after using irrigation. The income of households before using irrigation was 1978.12 ETB and is much less than that of the net income of the households after using irrigation, 8735.68. Therefore, it is safe to conclude that using irrigation has improved the income levels of the irrigator households of the study area.
Results revealed that the cost of the households before using irrigation ranges from 30 to 6000 ETB with average annual cost of 1657 ETB, whereas the costs after using irrigation ranges from 400 to 25,000 ETB with average annual cost of 4265.7 ETB. Hence, the standard deviations of the cost of the households’ before and after using irrigation are 1051 and 3193.16 ETB, respectively (Table 6). From this, one can understand that there is a great variation of costs of irrigator households’ before and after using irrigation. However, this figure is shown without considering the current inflation rate of the country. We thus compare the costs of households before and after irrigation use by considering the inflation rate shown below (Formula (4)):
Net   cost = 4265.7 ( E T B ) × 13.5 % 100 = 575.9 E T B
Therefore, we can compare the costs before and after irrigation by adding the net cost from the cost of before irrigation. Thus, 1657 ETB + 575.87 ETB = 2232.86 ETB. This implies that even though using irrigation has a major role in improving the livelihood scenarios of the user households, it also has potential to increase the expenses/costs of the households.
Unlike rain-based farming, SSI is a capital and labor-intensive type of farming because the success of irrigation is highly dependent on the different inputs such as fertilizers, pesticides, insecticides and laborers. Similar findings have been reported by many authors [31,32,33,34,35,36,37].

3.2.2. Employment Opportunity

Based on various findings [38,39,40,41,42], irrigation and rain-fed agriculture requires a diverse labor force both in quantity and technical quality. As can be seen in Table 7, for various purposes such as land preparation, weeding, adding of chemicals, watering, harvesting and transporting and storing of the product somewhere in different seasons, most of the irrigating farmers in the study sites employed different laborers at different levels of wages.
As the result shows, only from January 2013 to March 2014, male and female irrigator households of Geshober SSI employed on average three to five daily local laborers for 2.3 and 2.3 days by 158.7 and 156.5 ETB, respectively, for different agricultural activities in different seasons. Similarly, sampled irrigator households of Woyeneyie SSI have employed on average 3 and 2 daily laborers for 4.2 and 3.6 total days by 136.8 and 92.08 ETB, respectively. Similar results have been observed in all the SSI schemes. Therefore, it is safe to say SSI is not only used for enhancing household livelihood diversification but it also creates job opportunities for a large segment of poor households in the study areas.

3.2.3. Livelihood Development

SSI has multi-dimensional impacts on the livelihood development of the rural people [43,44]. In this regard, an attempt was made to assess whether the irrigating farmers had been aware of the changes in their mode of life or not. Directly or indirectly, SSI has positive impact on food security, asset ownership and well-being of rural farm households; there are clear increases in agricultural production through diversification and intensification of crops grown, household income, sources of animal feed, human health improvements, and asset ownership.
As seen in Table 8, 66% of the total irrigator respondents responded that using SSI contributes significantly to the rise in household income. Similarly, 41% of the total irrigator respondents responded that irrigation is a key to increasing agricultural production. Moreover, 33% of the irrigator respondents stated that use of irrigation is also important for the diversification of crops grown in their plot of land. Use of SSI is essential to the growth of different kinds of crops, vegetables, fruits and woodlots in their plots of intensively irrigated land and, they can therefore easily increase product quality as well as quantity.
Agricultural intensification through the practice of irrigation could be considered the best strategy for poverty reduction and promotion of sustainable rural livelihoods [45,46,47,48]. Therefore, in connection with this particular reference, the irrigation user households in the study area have the opportunity to diversify their livelihood scenario. Furthermore, as explained by Kidane et al. [2], crop intensification, diversification, and market-oriented production make food available and affordable for the poor and rich alike. Percentages of 47 and 72 of the irrigator households also responded that irrigation has the potential to increase employment opportunities to the nearby poor people and increase participation in different community decisions of the irrigator societies of the study area, respectively. Similar findings have been reported by [1,3,10,49,50,51] in studies conducted in the large-scale Tendaho irrigation project.

3.3. Major Problems Encountered

Although it is never free from problems, SSI has immense potential to improve the incomes of poor rural households in developing countries like Ethiopia [10,15,19,52,53]. Unfortunately, the FGD with model farmers (Figure 7) and the KI of households indicated that SSI’s benefits are often accompanied by multi-dimensional problems with different degrees of severity (Figure 6). The problems of SSI development of the study area range from individual households’ biased perception to institutional arrangements of the concerned bodies. The major problems that respondents faced in the study area are those related to water shortages, lack of improved seeds, crop disease, weeding problems, increment of input costs, water logging, and absence/low support from DAs.
About 48% of the irrigator households responded that their major problem is increment of input costs such as pesticides, insecticides and fertilizes. The use of inputs influences household income from crop production. In this study area, input cost increments and unavailability of the inputs when required by the farmers are the main problems. Secondly, 51% of the respondent’s responded that there was a water shortage problem due to the continuous drought and dry spells has declined the volume of the Gimbora River (Figure 8 and Figure 9).
Thirdly, 50.22% of the respondents responded as there was also a problem of shortage of better quality seeds. The availability of better quality and sufficient seed supply when required by farmers determines the quality and quantity of the products produced. As concluded by different researchers [3,4,6,7,54,55,56,57,58], seed multiplication and the distribution of improved genetics is a critical element of the drive for improved productivity. In the selected schemes, there was a problem of supply of better quality seeds at the right time.
Based on the respondents’ comments (30.5%), seepage was another problem in the study sites. Even though water shortages affected irrigation, in the main irrigation cannels of the diverted river, there was also a seepage problem. There was no standardized program and no plans to irrigate each cultivated crop. Irrigation water use depends only on spatial location of the farm plot; it does not consider the amount of water required for the type of cultivated crop, time interval of water application and the size of each plot for irrigation. As can be seen in Figure 6, one of the main causes of water shortage in the study areas was the absence of a lined canal. Through all the courses of the diverted river, the water becomes loose because of unlined canal construction.

Problems Related to Marketing of Products

Poor market access is the major factor that limits trade interaction between the livelihood and external markets. Poor roads most of them with only dry weather surfaces and the remote location of much of the North Wollo zone severely restrict the flow of goods in and out. As local inhabitants consume almost all local agricultural products, the major markets for local grain are the district centres within the zone (Figure 9C,D). The farmers of the study sites suffered from different challenges including: transportation, distance from the market, low bargaining power, and low prices of agricultural inputs.
About 31% and 27.3% of irrigator and non-irrigator households, respectively, responded that, in marketing their products, there are transportation problems (Table 9). Moreover, 8.9% and 6.5% of irrigators and non-irrigators responded that their place of residence is too far from the market center. Few respondents (irrigators (10.2%) and non-irrigators (2.4%)) relayed that there has been low bargaining power of demanders of the products. About 6.7% and 3.2% of irrigators and non-irrigators who responded explained that there is a problem of low prices of agricultural products.

4. Conclusions and Recommendations

Small-scale irrigation (SSI), both directly and in-directly, has a great impact on enhancing farmers’ livelihoods through different dimensions, such as diversification of crops grown, as well as increased agricultural production, household income, employment opportunity and participation in community decisions. It was proved that the sampled irrigator households’ annual average income has improved. Therefore, using irrigation has an impact on improving the income levels of the irrigator households of the study area, ultimately affecting the irrigator community. The increment of input cost, shortage of irrigation water, and absence of transportation were found to be the major challenges of SSI. It was found that non-irrigator farmers are not in a position to utilize the advantages of SSI as they are not aware of it. The district Agricultural Development Office should develop a campaign to propagate the advantages of the SSI system to the farmers through development agents; by setting up farmer training centers on improved agronomic practices, crop protection aspects, irrigation practices, and product marketing; and by offering a credit service to allow rapid progress in the introduction of technologies and farming practices, price bargaining power and profitability of SSI schemes.

Acknowledgments

The authors would like to thank farmers, DAs, district agriculture office workers, and all those who contributed during data collection in the field.

Author Contributions

Dereje Mengiste performed the research design, data collection, and data analysis part and Desale Kidane performed the whole write up, data analysis and interpretation and manuscript preparation parts of this paper.

Conflicts of Interest

The authors declare no conflict of interest.

References

  1. Kidane, D.; Mekonnen, A.; Teketay, D. An assessment of land tenure system and conflict resolution. Tendaho irrigation project case study lower Awash basin, Ethiopia. In Proceedings of the High Level Policy Forum, Semera, Ethiopia, 6–7 March 2014; Afar National Regional State, United Nations Development Programme Ethiopia Country Office: Addis Ababa, Ethiopia, 2015. [Google Scholar]
  2. Kidane, D.; Mekonnen, A.; Teketay, D. Contributions of Tendaho Irrigation Project to the improvement of livelihood of Agro pastoralists in the Lower Awash Basin, Northeastern Ethiopia. Ethiop. J. Res. Innov. Foresight 2014, 6, 1–19. [Google Scholar]
  3. Belay, S.; Beyene, F. Small-scale irrigation and household income linkage: Evidence from Deder district, Ethiopia. Afr. J. Agric. Res. 2013, 8, 4441–4451. [Google Scholar]
  4. Tafesse, M. Small-Scale Irrigation for Food Security in Sub-Saharan Africa; The ACP-EU Technical Centre for Agricultural and Rural Cooperation (CTA): Addis Ababa, Ethiopia, 2003. [Google Scholar]
  5. Dananto, M.U.; Alemu, E. Irrigation water management in small scale irrigation schemes: The case of the Ethiopian rift valley lake basin. Environ. Res. Eng. Manag. 2014, 1, 5–15. [Google Scholar]
  6. Taffesse, N. The Role of Irrigation Development in Enhancing Household Food Security: A Case Study of Three Small-scale Irrigation Schemes in Southern Nations, Nationalities and Peoples’ Region. Master’s Thesis, Addis Ababa University, Addis Ababa, Ethiopia, July 2002. [Google Scholar]
  7. Teshome, W. Irrigation Practices, State Intervention and Farmers Life-worlds in Drought Prone Tigray, Ethiopia. Ph.D. Thesis, Addis Ababa University, Ethiopia, July 2003. [Google Scholar]
  8. Food and Agriculture Organization. Socio-Economic Impact of Smallholder Irrigation Development in Zimbabwe: Case Studies of Ten Irrigation Scheme. FAO: Harare, Zimbabwe, 2000. [Google Scholar]
  9. Food and Agriculture Organization. Smallholder Irrigation Technology: Prospects for Sub-Saharan Africa; IPTRID Secretariat, Food and Agriculture Organization of the United Nations: Rome, Italy, 2001. [Google Scholar]
  10. Mekonnen, A.; Kidane, D.; Teketay, D. Analysis of pastoralist’s adaptation to climate change and variability in the dry land areas of Ethiopia Afar national regional state lower Awash basin. In Proceedings of the High Level Policy Forum, Semera, Ethiopia, 6–7 March 2014; Afar National Regional State, United Nations Development Programme Ethiopia Country Office: Addis Ababa, Ethiopia, 2015. [Google Scholar]
  11. Kidane, D. A critical review of integrated river basin management in the upper Blue Nile river basin: The case of Ethiopia. Int. J. River Basin Manag. 2015. [Google Scholar] [CrossRef]
  12. Awulachew, S.B.; Merrey, D.; van Koopen, B.; Kamara, A. Roles, constraints and opportunities of small-scale irrigation and water harvesting in Ethiopian agricultural development: Assessment of existing situation. In Proceedings of the ILRI Workshop, Colombo, Srilanka, 14–16 March 2010; International Water Management Institute (IWMI): Addis Ababa, Ethiopia, 2010. [Google Scholar]
  13. Awulachew, S.B.; Yilma, A.D.; Loulseged, M.; Loiskandl, W.; Ayana, M.; Alamirew, T. Water Resources and Irrigation Development in Ethiopia; International Water Management Institute (IWMI): Colombo, Sri Lanka, 2007; p. 66. [Google Scholar]
  14. Awulachew, S.B.; Merrey, D.J.; Kamara, A.B.; van Koppen, B.; de Vries, F.P.; Boelee, E.; Makombe, G. Experiences and Opportunities for Promoting Small-Scale/Micro Irrigation and Rainwater Harvesting for Food Security in Ethiopia; International Water Management Institute: Addis Ababa, Ethiopia, 2005. [Google Scholar]
  15. Kebede, G. The Impact of Selected Small-Scale Irrigation Schemes on Household Income and the Likelihood of Poverty in the Lake Tana Basin of Ethiopia. Cornell University: Ithaca, NY, USA, 2011. [Google Scholar]
  16. Kidane, D.; Temesgen, M.; Abdelkadir, A. Effect of winged sub-soiler and traditional tillage integrated with Fanya Juu on selected soil physico-chemical and soil water properties in the north western highlands of Ethiopia. East Afr. J. Sci. 2012, 6, 21–32. [Google Scholar]
  17. Kidane, D. Conservation tillage implementation under rain-fed agriculture: Implication for soil fertility, green water management, soil loss and grain yield in the Ethiopian Highlands. Int. J. Agric. Sci. 2014, 4, 268–280. [Google Scholar]
  18. Cosmas, H.S. Changes in the Upland Irrigation System and Implications for Rural Poverty Alleviation: A Case of the Ndiwa Irrigation System, West Usambara Mountains, Tanzania. Research on Poverty Alleviation (REPOA): Tanzania, Tanzania, 2005. [Google Scholar]
  19. Awulachew, S.B.; Merrey, D.J. Assessment of Small Scale Irrigation and Water Harvesting in Ethiopian Agricultural Development; International Water Management Institute (IWMI): Addis Ababa, Ethiopia, 2008. [Google Scholar]
  20. Ministry of Water Resources. Climate Change National Adaptation Programme of Action (NAPA) of Ethiopia; Ministry of Water Resources and National Meteorological Agency: Addis Ababa, Ethiopia, 2007. [Google Scholar]
  21. Ministry of Finance and Economic Developmen (MoFED). Ethiopia: Building on Progress. A Plan for Accelerated and Sustained Development to End Poverty (2005/6–2009/10); Ministry of Finance and Economic Development: Addis Ababa, Ethiopia, 2006.
  22. Yasin, S.A. Small-scale Irrigation and Household Food Security: A Case Study of Three Irrigation Schemes in Gubalafto Woreda of North Wollo Zone, Amhararegion. Master’s Thesis, Addis Ababa University, Addis Ababa, Ethiopia, June 2002. [Google Scholar]
  23. Smith, L. Assessment of the contribution of irrigation to poverty reduction and sustainable livelihoods. Water Resour. Dev. 2004, 20, 243–257. [Google Scholar] [CrossRef]
  24. Lemma, E. Land Use Land Cover Dynamics in Post-resettlement Areas Using Cellular Automata Model: The Case of Gubalafto Woreda. Master’s Thesis, Addis Ababa University, Addis Ababa, Ethiopia, June 2010. [Google Scholar]
  25. Kahn, R.S.; Wise, H.P.; Kennedy, P.B.; Kawachi, I. The state income inequality, household income, and maternal mental and physical health. BMJ 2000. [Google Scholar] [CrossRef]
  26. Rani, M.; Bonu, S.; Jha, P.; Nguyen, S.N.; Jamioum, L. Tobacco use in India: Prevalence and predictors of smoking and chewing in a national cross-sectional household survey. Tob. Control 2003. [Google Scholar] [CrossRef]
  27. Taro, Y. Statistics, an Introductory Analysis, 2nd ed.; New York University: New York, NY, USA, 1967. [Google Scholar]
  28. Abraham, B.G.; Nata, T.; Bheemalingeswara, K.; Mokennen, H. Suitability of groundwater quality for irrigation: A case study on hand dug wells in Hantebet Catchment, Tigray, Northern Ethiopia. J. Am. Sci. 2011, 7, 191–199. [Google Scholar]
  29. Gebremeskel, G.H.; Kebede, A.K. Irrigation in Ethiopia: A review. Acad. J. Agric. Res. 2015, 3, 264–269. [Google Scholar]
  30. CIA. World Factbook Download 2011. Available online: https://www.cia.gov/library/publications/download/download-2011/ (accessed on 21 June 2016).
  31. Rockström, J.; Karlberg, L.; Wani, S.P.; Barron, J.; Hatibu, N.; Oweis, T.; Bruggeman, A.; Farahani, J.; Qiang, Z. Managing water in rainfed agriculture: The need for a paradigm shift. Agric. Water Manag. 2010, 97, 543–550. [Google Scholar] [CrossRef]
  32. Oni, S.A.; Maliwichi, L.L.; Obadire, O.S. Assessing the contribution of smallholder irrigation to household food security, in comparison to dry land farming in Vhembe district of Limpopo province, South Africa. Afr. J. Agric. Res. 2011, 18, 2188–2197. [Google Scholar]
  33. Mohammed, S. Development and challenges of bakolori irrigation Project in Sokoto State, Nigeria. Nord. J. Afr. Stud. 2002, 11, 411–430. [Google Scholar]
  34. Lipton, M.; Litchfield, J. Preliminary Review of the Impact of Irrigation on Poverty, with Special Emphasis on Asia; Food and Agriculture Organization (FAO): Rome, Italy, 2003. [Google Scholar]
  35. Kassahun, D. Impacts of climate change on Ethiopia. In Proceedings of the 2nd Green Forum Conference, Addis Ababa, Ethiopia, 31 October–2 November 2007.
  36. Kaur, N.; Getnet, M.; Shimelis, B.; Tesfaye, Z.; Syoum, G.; Atnafu, E. Adapting to Climate Change in the Water Sector. Assessing the Effectiveness of Planned Adaptation Interventions in Reducing Local Level Vulnerability. RiPPLE: Addis Ababa, Ethiopia, 2010. [Google Scholar]
  37. Kamara, A.B.; van Koppen, B.; Magingxa, L. Economic viability of small-scal irrigation systems in the context of state withdrawal: The Arabie Scheme in the Northern Province of South Africa. Phys. Chem. Earth 2002, 27, 815–823. [Google Scholar] [CrossRef]
  38. Aseyehegn, K.; Yirga, C.; Rajan, S. Effect of small-scale irrigation on the income of rural farm households: The case of Laelay Maichew district, central Tigray, Ethiopia. J. Agric. Sci. 2012, 7, 43–57. [Google Scholar]
  39. Jana, S.K. Sustainable small scale irrigation experiment in the dry zones: A case study on Happa (small tank) model in the state of West Bengal, India. In Proceedings of the APN Conference on “Innovation and Sustainability Transitions in Asia”, Kuala Lumpur, Malaysia, 11 January 2011; MPRA: Kuala Lumpur, Malaysia, 2011. [Google Scholar]
  40. Haile, T. Impact of Irrigation Development on Poverty Reduction in Northern Ethiopia. Ph.D. Thesis, National University of Ireland, Cork, Ireland, June 2008. [Google Scholar]
  41. Gebremedhin, B.; Peden, D. Policies and Institutions to Enhance the Impact of Irrigation Development in Mixed Crop-Livestock. MoWR/EARO/IWMI/ILRI Workshop: Addis Ababa, Ethiopia, 2002. [Google Scholar]
  42. Fanadzo, M.; Chiduza, C.; Mnkeni, P.N.S. An overview of small holder irrigation schemes in South Africa: Relationship between farmer crop management practices and performance. Afr. J. Agric. Res. 2010, 5, 3514–3523. [Google Scholar]
  43. Tilahun, H.; Paulos, D. Results to date and future plan of research on irrigation and its impact. In Impact of Irrigation on Poverty and Environment; International Water Management Institute (IWMI): Colombo, Sri Lanka, 2004. [Google Scholar]
  44. Tucker, J.; Yirgu, L. Small-Scale Irrigation in the Ethiopian Highlands: What Potential for Poverty Reduction and Climate Adaptation. RiPPLE: Addis Ababa, Ethiopia, 2010. [Google Scholar]
  45. Crosby, C.T.; de Lange, M.; Stimie, C.M.; van der Stoep, I. A Review of Planning and Design Procedures Applicable to Small-Scale Farmer Irrigation Projects; Water Research Commission: Pretoria, South Africa, 2000; p. 241. [Google Scholar]
  46. Dahal, B.D.; Sitaula, B.K.; Bajracharya, R.M. Sustainable agricultural intensification for livelihood and food security in Nepal. Asian J. Water Environ. Pollut. 2007, 5, 1–12. [Google Scholar]
  47. Eneyew, A.; Alemu, E.; Ayana, M.; Dananto, M. The role of small scale irrigation in poverty reduction. J. Dev. Agric. Econ. 2014, 6, 12–21. [Google Scholar]
  48. Food and Agriculture Organization. Irrigation in Africa in Figures. Aqustat Survey—2005; FAO: Rome, Italy, 2005. [Google Scholar]
  49. Adam, F. Small-Scale Irrigation and Household Food Security: A Case Study from Central Ethiopia; Forum for Social Studies: Addis Ababa, Ethiopia, 2001. [Google Scholar]
  50. Bastiaanssen, W.G.M.; Bos, M.G. Irrigation performance indicators based on remotely sensed data: A review of literature. Irrig. Drain. Syst. 1999, 13, 291–311. [Google Scholar] [CrossRef]
  51. James, B.; Maryam, M.O. Small-scale irrigation and household wages relationship: Proof from Deder district, Ethiopia. Int. J. Irrig. Water Manag. 2014, 8, 4441–4451. [Google Scholar]
  52. Demeku, S.D.; Descheemaeker, K.; Haileslassie, A.; Amede, T. Irrigation water productivity as affected by water management in a small-scale irrigation scheme in the Blue Nile basin, Ethiopia. Exp. Agric. 2011, 47, 39–55. [Google Scholar]
  53. Wichelns, D. Achieving water and food security in 2050: Outlook, policies, and investments. Agriculture 2015, 5, 188–220. [Google Scholar] [CrossRef]
  54. Ayele, G.K.; Nicholson, C.F.; Collick, A.S.; Tilahun, S.A.; Steenhuis, T.S. Impact of small-scale irrigation schemes on household income and the likelihood of poverty in the Lake Tana basin of Ethiopia. In Proceedings of the Nile Basin Development Challenge Science Meeting, Addis Ababa, Ethiopia, 9–10 July 2013; Mekuria, W., Ed.; ILRI: Nairobi, Kenya, 2013. [Google Scholar]
  55. Kidane, D.; Alemu, B. The effect of upstream land use practices on soil erosion and sedimentation in the Upper Blue Nile Basin, Ethiopia. Res. J. Agric. Environ. Manag. 2014, 4, 55–68. [Google Scholar]
  56. Ernest, B.; Wuleka, C.K. Assessment of a small scale irrigation scheme on household food security and leisure in Kokoligu; Ghana. Res. Hum. Soc. Sci. 2013, 3, 17–26. [Google Scholar]
  57. World Bank. Ethiopia: Managing Water Resources to Maximise Sustainable Growth. A World Bank Water Resources Assistance Strategy for Ethiopia. World Bank: Washington, DC, USA, 2006. [Google Scholar]
  58. Canadian Standards Association (CSA). Summery and Statistical Report of 2007 Population and Housing Census of Ethiopia: Population Size by Age and Sex. CSA: Toronto, ON, Canada, 2007. [Google Scholar]
Figure 1. Conceptual framework modified from [23].
Agriculture 06 00027 g001
Figure 2. Location map of the study sites.
Agriculture 06 00027 g002
Figure 3. Rainfall map of Gubalafto district.
Agriculture 06 00027 g003
Figure 4. Soil map of the study district.
Agriculture 06 00027 g004
Figure 5. HHs off-farm income.
Agriculture 06 00027 g005
Figure 6. Water seepage in the Woyeneyie (A) and Gedober scheme (B); Seepage loss in the traditionally built irrigation canal constructed by beneficiary farmers themselves in Sanka (C); and overtopping on the main canal in Sanka’s traditional irrigation system (D), respectively.
Agriculture 06 00027 g006
Figure 7. Photo graphs showing group discussion with the beneficiary households of Gedober irrigation scheme (A and B) March 2014.
Agriculture 06 00027 g007
Figure 8. Photos showing wilted sugarcane crop due to water shortage (A), and farmers looking for water to irrigate their field (B).
Agriculture 06 00027 g008
Figure 9. Photos showing different irrigated crops (A and B), and farmers selling sugarcane and potato at a local market (C and D), respectively.
Agriculture 06 00027 g009
Table 1. Sample household heads taken from irrigators and non-irrigators.
Sample SSI SchemesSample IrrigatorsSample Non-IrrigatorsTotal Sample HHs
Male (M)Female(F)Total (T)Male (M)Female (F)Total (T)
Sanka8137118602585203
Jarsa289371051552
Gedober402868381351119
Total1497422310843151374
HHs: household heads.
Table 2. Respondents’ sex, education, house types, household size and marital status.
Characteristics of HHsIrrigating HHsNon-Irrigating HHsTotal Sample HHs
SexNoPercentNoPercentNoPercent
Male14939.810828.925768.7
Female7419.84311.511731.3
Total22359.615140374100
Education
Illiterate12433.28923.220856.4
Read and write6216.63089224.6
High school and above379.9329.16919
Total22359.615140.4374100
Marital status
Married15441.2%9324.924766.1
Unmarried20.551.471.9
Divorced3910.4379.87620.2
Widowed287.5164.34411.8
Total22359.415139.3374100
Household Size
1–2 persons61.6113174.6
3–45715.24913.110628.3
5–69324.95715.315040.2
7–86016328.69224.6
>871.820.692.4
Total22359.615140.4374100
House types of HHsIrrigation Status
ResponseIrrigatorsNon-IrrigatorsTotal
MaleMaleMaleMale
Grass roofedFrequency31216727146
%8.35.617.97.239
Corrugated iron roofedFrequency118534116228
%31.614.2114.361
TotalFrequency1497410843374
%39.819.828.911.5100
Table 3. Total livestock population and current cost of SSI schemes in ETB.
NoKind of AnimalGeshoberWoyeneyieGedoberJarsaTotal NumberTotal Cost × (1000)
NumberCost in × (1000)NumberCost in × (1000)NumberCost in × (1000)NumberCost in × (1000)
**I*NIINIINIINI**I*NIINI**I*NIINI
1Cattle
Ox617278.12941348753117.913510688.543063525220433109.1
Cow7210331.24.8913928555.8109.2518198.929.5348134.332.2350698
Bull2345257.51084194.8739377.55.933267.33.95216208.2
Heifer38857012.711229224.256.529543.57.622635.29.324920.35
Calf52739054.6992174.714.73272454.926520.23.624993.6
2Pack animal
Horse7-24.7-11153.94.27-32.2-2-7.55-28612.7
Mule3-19.5-5-29-4-26-1-6.4-134
Donkey461211528.811914356.539.9712222.765.4394117.811.732748.1
3Others
Sheep1093410432.338887349.284.84038840.287871588.416.212115819
Got782476.521.624762246.862.52332223.422.537337.53.3706352.3
***TLU489106109.7142.713622642838496.810041651915265 34448767101.73811.4
Average1182494101.918438.47015328.15.2 9320.76.68
NB: *NI = Non-irrigator; **I = Irrigators; ***TLU = Total Livestock Unit; (NB: 1 USD ≈ 20 ETB).
Table 4. Annual average income and cost of the non-irrigator HHs and annual average income of HHs before and after using irrigation in ETB (1 USD ≈ 20 ETB).
Current Cost-Income RelationNMinimumMaximumMeanStandard Deviation
Current income of the non-irrigator households15140095003146.751838
Current cost of the non-irrigator households15120010,0002905.131481.09
Length of irrigation practice (in years)2233229.25114.13
Household income before irrigation2237080001978.121534.32
Current income (after irrigation)223150060,00010,0997865.59
Source: Field Survey, March 2014.
Table 5. The trend of Ethiopia’s annual inflation rate consumer prices (%).
Years200420052006200720082009201020112012TotalMean
Inflation Rate (%)3.2611.6112.3117.2444.398.478.14**121.713.5
Source: CIA World Fact Book (2011) [30], * indicate no data, unless otherwise noted, this information is accurate as of 9 January 2014.
Table 6. Annual average costs of HHs before and after irrigation in ETB.
NMinimumMaximumMeanStandard Deviation
Cost of the HHs before using irrigation22330600016571051
Cost of the household after using irrigation22340025,0004265.73193
Source: Field Survey, March 2014, hint: N stands for number of irrigator respondents.
Table 7. Labor demand in the SSI schemes (NB: 1 USD ≈ 20 ETB), Sanka (Geshober and Woyeneyie).
Types WorkIrrigation Schemes
GeshoberWoyeneyieGedoberJarsa
Total Days of EmploymentTotal Wage (ETB)Total Days of EmploymentTotal Wage (ETB)Total Days of EmploymentTotal Wage (ETB)Total Days of EmploymentTotal Wage (ETB)
MFMFMFMFMFMFMFMF
Land preparation31152580990111333925120026272560136019141525695
Planting23100310000012368031524350160
Weeding1629801802858701257465042595300200
Adding of chemicals124470155723010097900270902300
Watering70310058341635615261010701004010500300
Harvest36330400201600881315100503200
Transporting and storing10150048220170981460116538630480
Total7230492020352108268402210976786353735874138551835
Average2.32.3158.7156.54.23.6136.892.12.42.4215.9133.43.14.6137.7203.9
Source: own survey 2016. M: male; F: female.
Table 8. Response of HHs on livelihood development (NB: 1 USD ≈ 20 ETB).
Sampled Irrigator Households of the Study Area
Choices
RankDiversification of Crops GrownIncreased Agricultural ProductionIncreased Household IncomeIncrease Employment OpportunityIncome Variance and Resilience to RiskIncrease Participation in the Community Decisions
%% %%%
1st812660.5110.4
2nd9412112211
3rd332498.5242
4th3318319205
5th1540.5471619.6
6th210.513872
Total100100100100100100
Source: Field Survey March 2014. The higher the number is, the more important it is.
Table 9. Households’ response to market-related problems.
ProblemsResponseIrrigation StatusTotal
IrrigatorNon-Irrigator
MFMF
TransportationFrequency80367230218
Percent21.49.619.3858.3
Distance from marketFrequency25817858
Percent6.72.14.52.115.5
Low bargaining powerFrequency28106347
Percent7.52.71.60.812.6
Low price of agricultural productsFrequency101510237
Percent2.74.02.70.59.9
OthersFrequency653014
Percent1.61.30.803.7
TotalFrequency1497410843374
Percent39.819.828.911.5100
Source: Field Survey, March 2014. M: male; F: female.

