Article

Delineation of Agricultural Drainage Pipe Patterns Using Ground Penetrating Radar Integrated with a Real-Time Kinematic Global Navigation Satellite System

1
U.S. Dept. of Agriculture, Agricultural Res. Serv., Soil Drainage Res. Unit, Columbus, OH 43210, USA
2
C.J. International Center for Water Resources Management, Central State University, Wilberforce, OH 45384, USA
3
U.S. Dept. of Agriculture, Agricultural Res. Serv., Beltsville Agric. Res. Cntr., Beltsville, MD 20705, USA
4
Veselka Farms, Pataskala, OH 43062, USA
*
Author to whom correspondence should be addressed.
Submission received: 18 September 2018 / Revised: 18 October 2018 / Accepted: 19 October 2018 / Published: 24 October 2018
(This article belongs to the Special Issue Sensors Application in Agriculture)

Abstract

:
Better methods are needed for mapping agricultural drainage pipe systems. Prior research on small test plots indicates that ground penetrating radar (GPR) is oftentimes capable of detecting buried drainage pipes; however, the feasibility of employing this geophysical technique in larger field areas has not been adequately evaluated. Ground penetrating radar integrated with a Real-Time Kinematic (RTK) Global Navigation Satellite System (GNSS) may be an effective and efficient means of mapping drain lines within agricultural fields. Therefore, GPR-RTK/GNSS was tested in three agricultural settings; with Site 1 and Site 2 located in Beltsville, MD, USA and Site 3 near Columbus, OH, USA. Soils at the three sites ranged from silty clay loam to loamy sand. A GPR unit with 250 MHz antennas was used to detect drainage pipes, and at Sites 1 and 2, a physical GNSS base station was utilized, while a virtual base station was employed at Site 3. The GPR-RTK/GNSS configurations used in this study delineated a complex rectangular drainage pipe system at Site 1, with one set of drainage pipes oriented southwest-northeast and a second oriented southeast-northwest. At Site 2, a herringbone drain line pattern was outlined, and at Site 3, random drain lines were found. When integrated with RTK/GNSS, spiral or serpentine GPR transects (or spiral/serpentine segments of a GPR transects) were utilized to provide insight on drain line directional trends. Consequently, given suitable field conditions, GPR integrated with RTK/GNSS can be a valuable tool for farmers and drainage contractors needing to map subsurface drainage systems.

Graphical Abstract

1. Introduction

A 1985 economic survey showed that the states comprising the Midwest U.S. (Illinois, Indiana, Iowa, Ohio, Minnesota, Michigan, Missouri, and Wisconsin) by that year had approximately 12.5 million ha that contained subsurface drainage systems, with cropland accounting for the large majority of areas possessing these buried drainage pipe networks [1]. In the more than 30 years that have elapsed since the 1985 survey, a very sizeable amount of additional agricultural drainage pipe has been installed throughout the Midwest U.S. In order to improve crop yields, farmers within this region often need to repair drain lines that are not functioning properly or install new drain lines between the old ones to improve soil water removal efficiency. Whether for system repairs or efficiency improvements, locations of the preexisting drain lines are required; however, in most cases, a map of the original subsurface drainage system installation is no longer available.
Present methods of locating drain lines involve the use of hand-held tile probes or heavy trenching equipment. Finding drainage pipes with a tile probe (Figure 1a) is both time consuming and extremely tedious. With a tile probe, it is sometimes difficult at a particular spot beneath the ground surface to distinguish a clay tile drainage pipe from the large stones that are commonly present in glacially derived soils of the Midwest U.S. A tile probe also easily penetrates through a corrugated plastic tubing (CPT) drainage pipe, thereby making the presence of the CPT drainage pipes difficult to ascertain, while at the same time potentially causing pipe collapse problems. Locating drainage pipes with heavy trenching equipment (Figure 1b) is effective, but causes costly pipe damage that has to be repaired before the trench is backfilled. Consequently, an effective, efficient, and noninvasive (i.e., nondestructive) method is needed for mapping subsurface drainage systems in agricultural fields.
In a preliminary study [2], an unmanned aircraft system (UAS) with a thermal infrared camera exhibited promise in regard to drainage pipe mapping at an agricultural field in central Ohio, USA; however, the technology is now only just beginning to be rigorously evaluated for this particular application. Prior research has demonstrated the feasibility of using ground penetrating radar (GPR) in agricultural settings to locate buried clay tile and CPT drainage pipe over a range of soil types and shallow hydrologic conditions [3,4,5]. Additional research has shown that GPR, under certain circumstances, can isolate the location of drainage pipe obstructions [6]. The strength of the GPR drainage pipe response for specific soil moisture conditions was found to depend on the orientation of the GPR antennas relative to the drain line directional trend [7].
All prior GPR drainage pipe detection research focused on testing the feasibility of this geophysical technology on small agricultural experiment plots. The practicality of employing GPR for determining drain line patterns in larger farm fields has not been adequately assessed. Ground penetrating radar integrated with a Real-Time Kinematic (RTK) Global Navigation Satellite System (GNSS) may be an effective, efficient, and noninvasive (i.e., nondestructive) means of mapping drain lines within agricultural fields. Consequently, GPR-RTK/GNSS was evaluated at three agricultural fields. The overall process involved mapping the latitude and longitude coordinates of points in the field beneath which drainage pipes were potentially detected and then using this map to provide insight on drain line patterns. The guiding hypothesis for this research can be stated; “GPR integrated with RTK/GNSS is an effective, efficient, and noninvasive tool for delineating drain line patterns in agricultural fields.” The results of this study confirmed this hypothesis by successfully demonstrating GPR-RTK/GNSS mapping of complex subsurface drainage systems at three agricultural field sites.

2. Materials and Methods

2.1. Site Descriptions

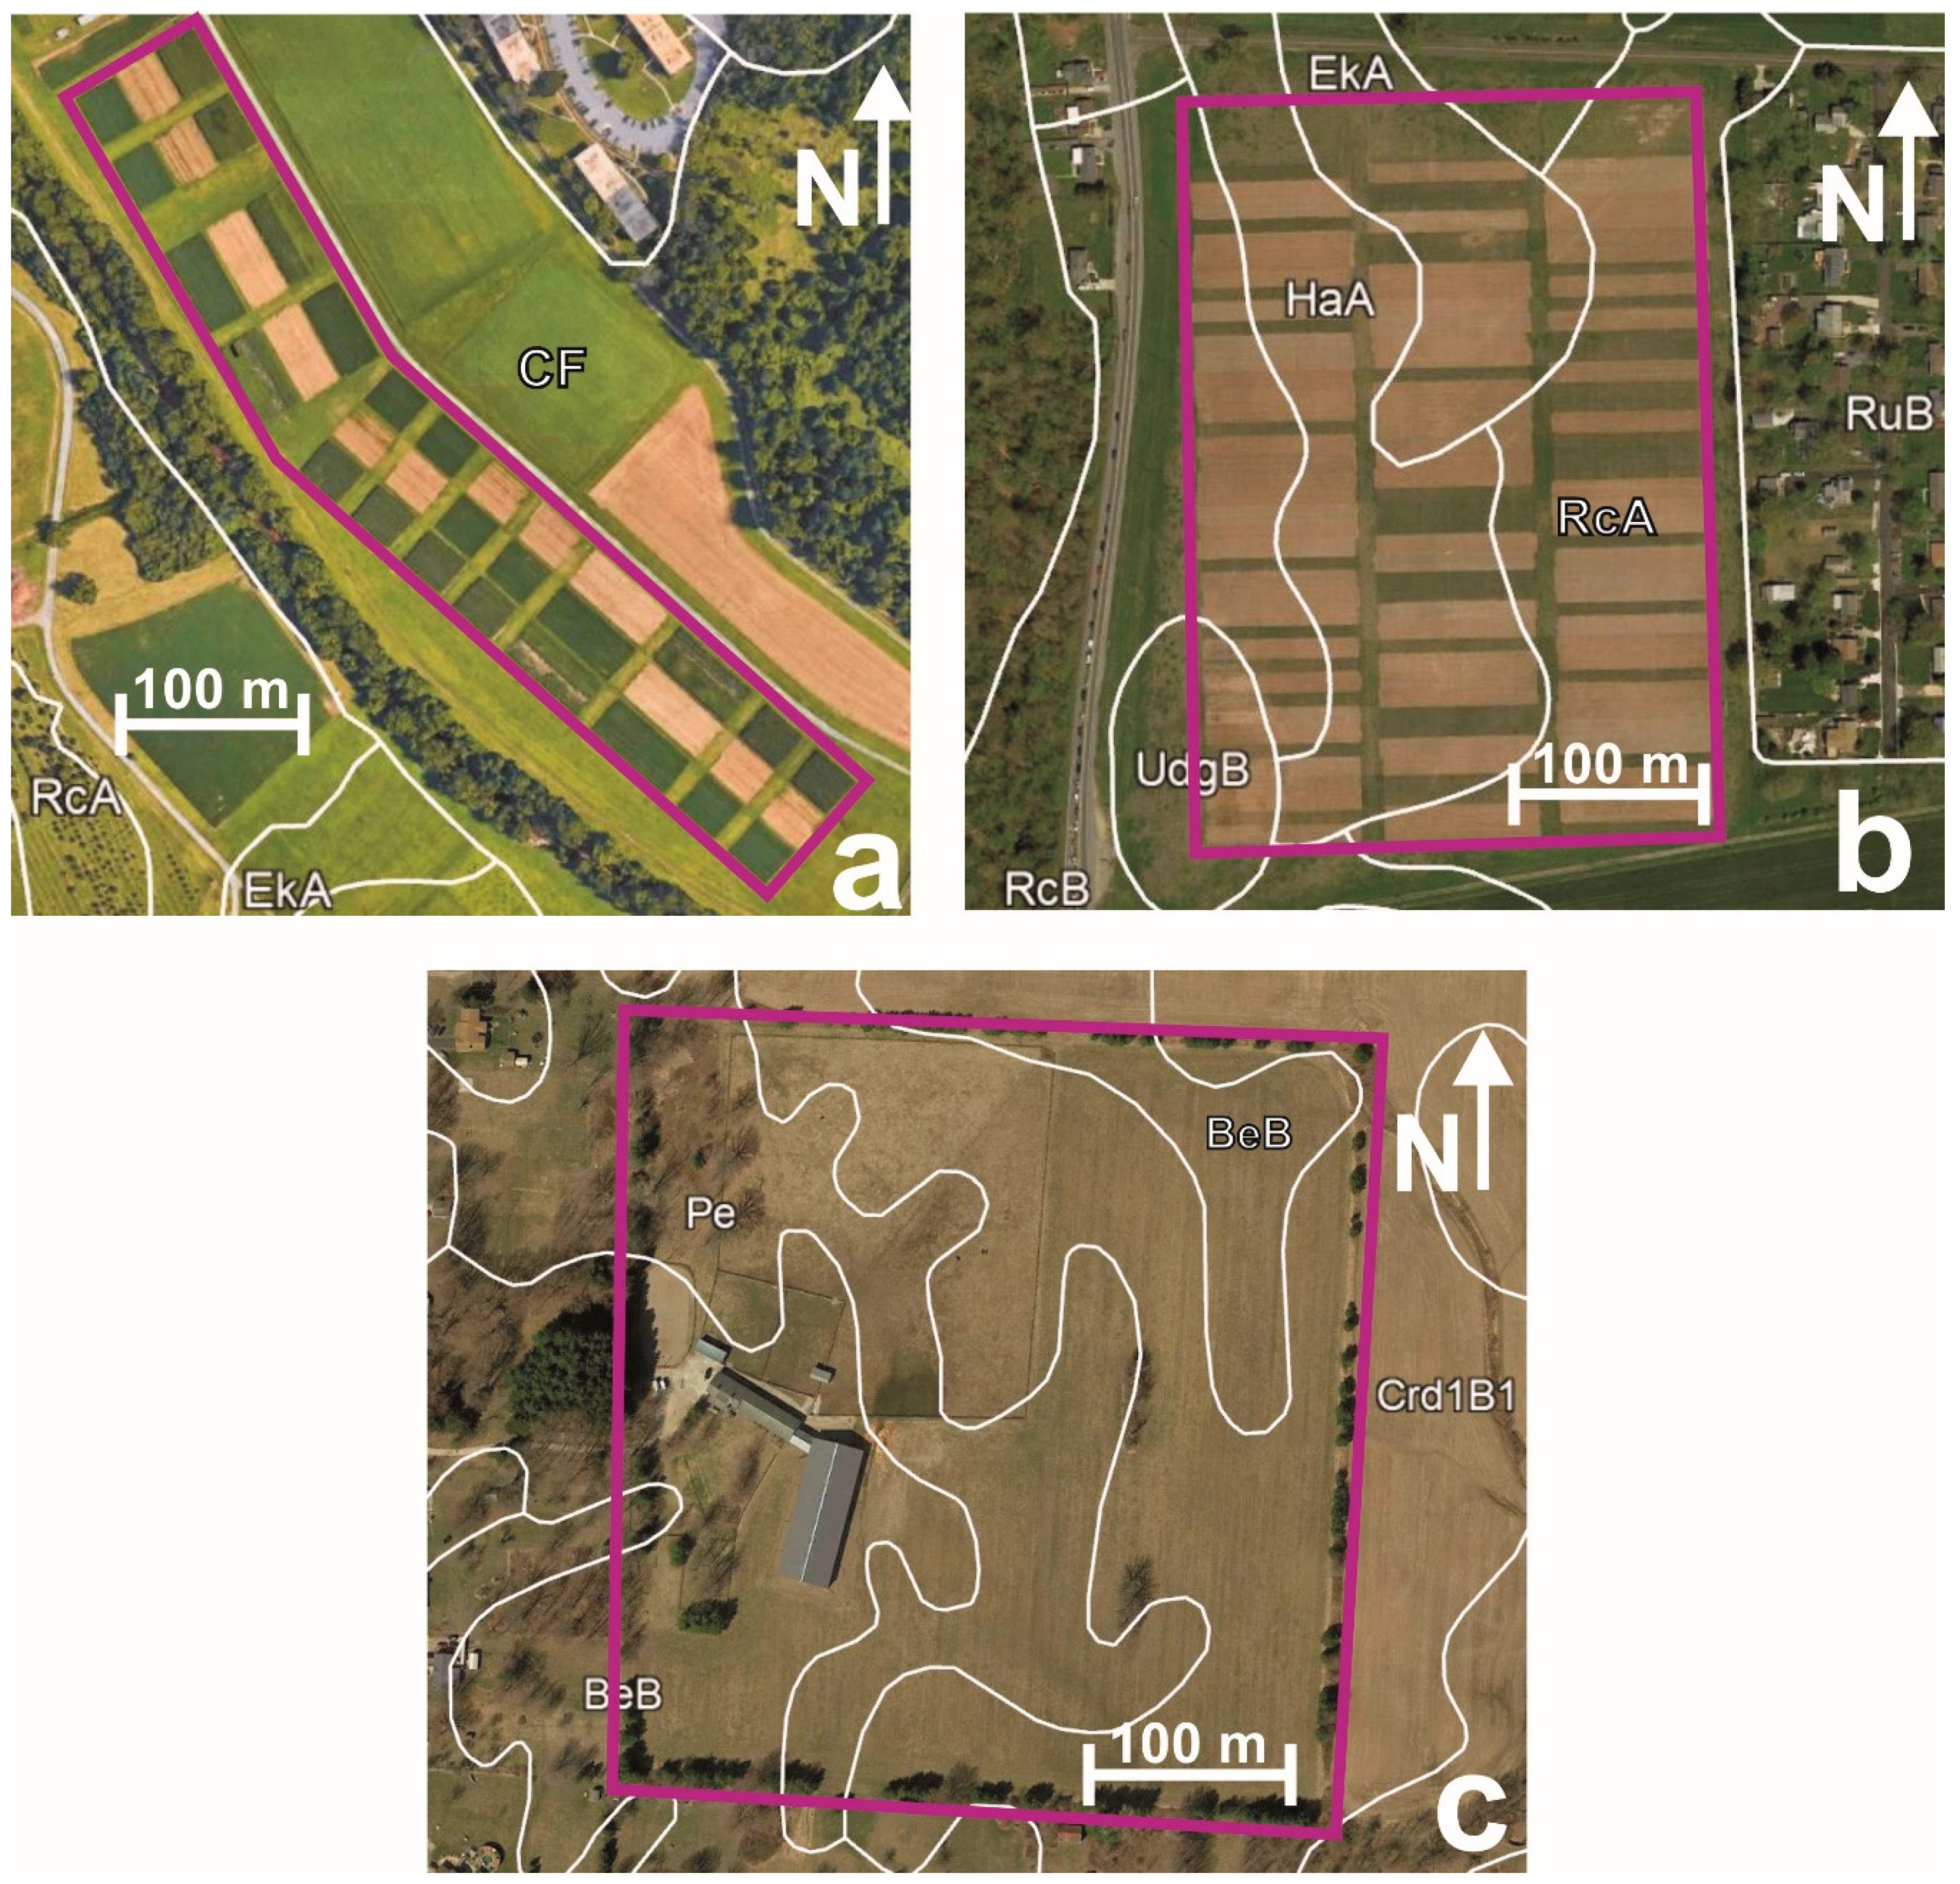
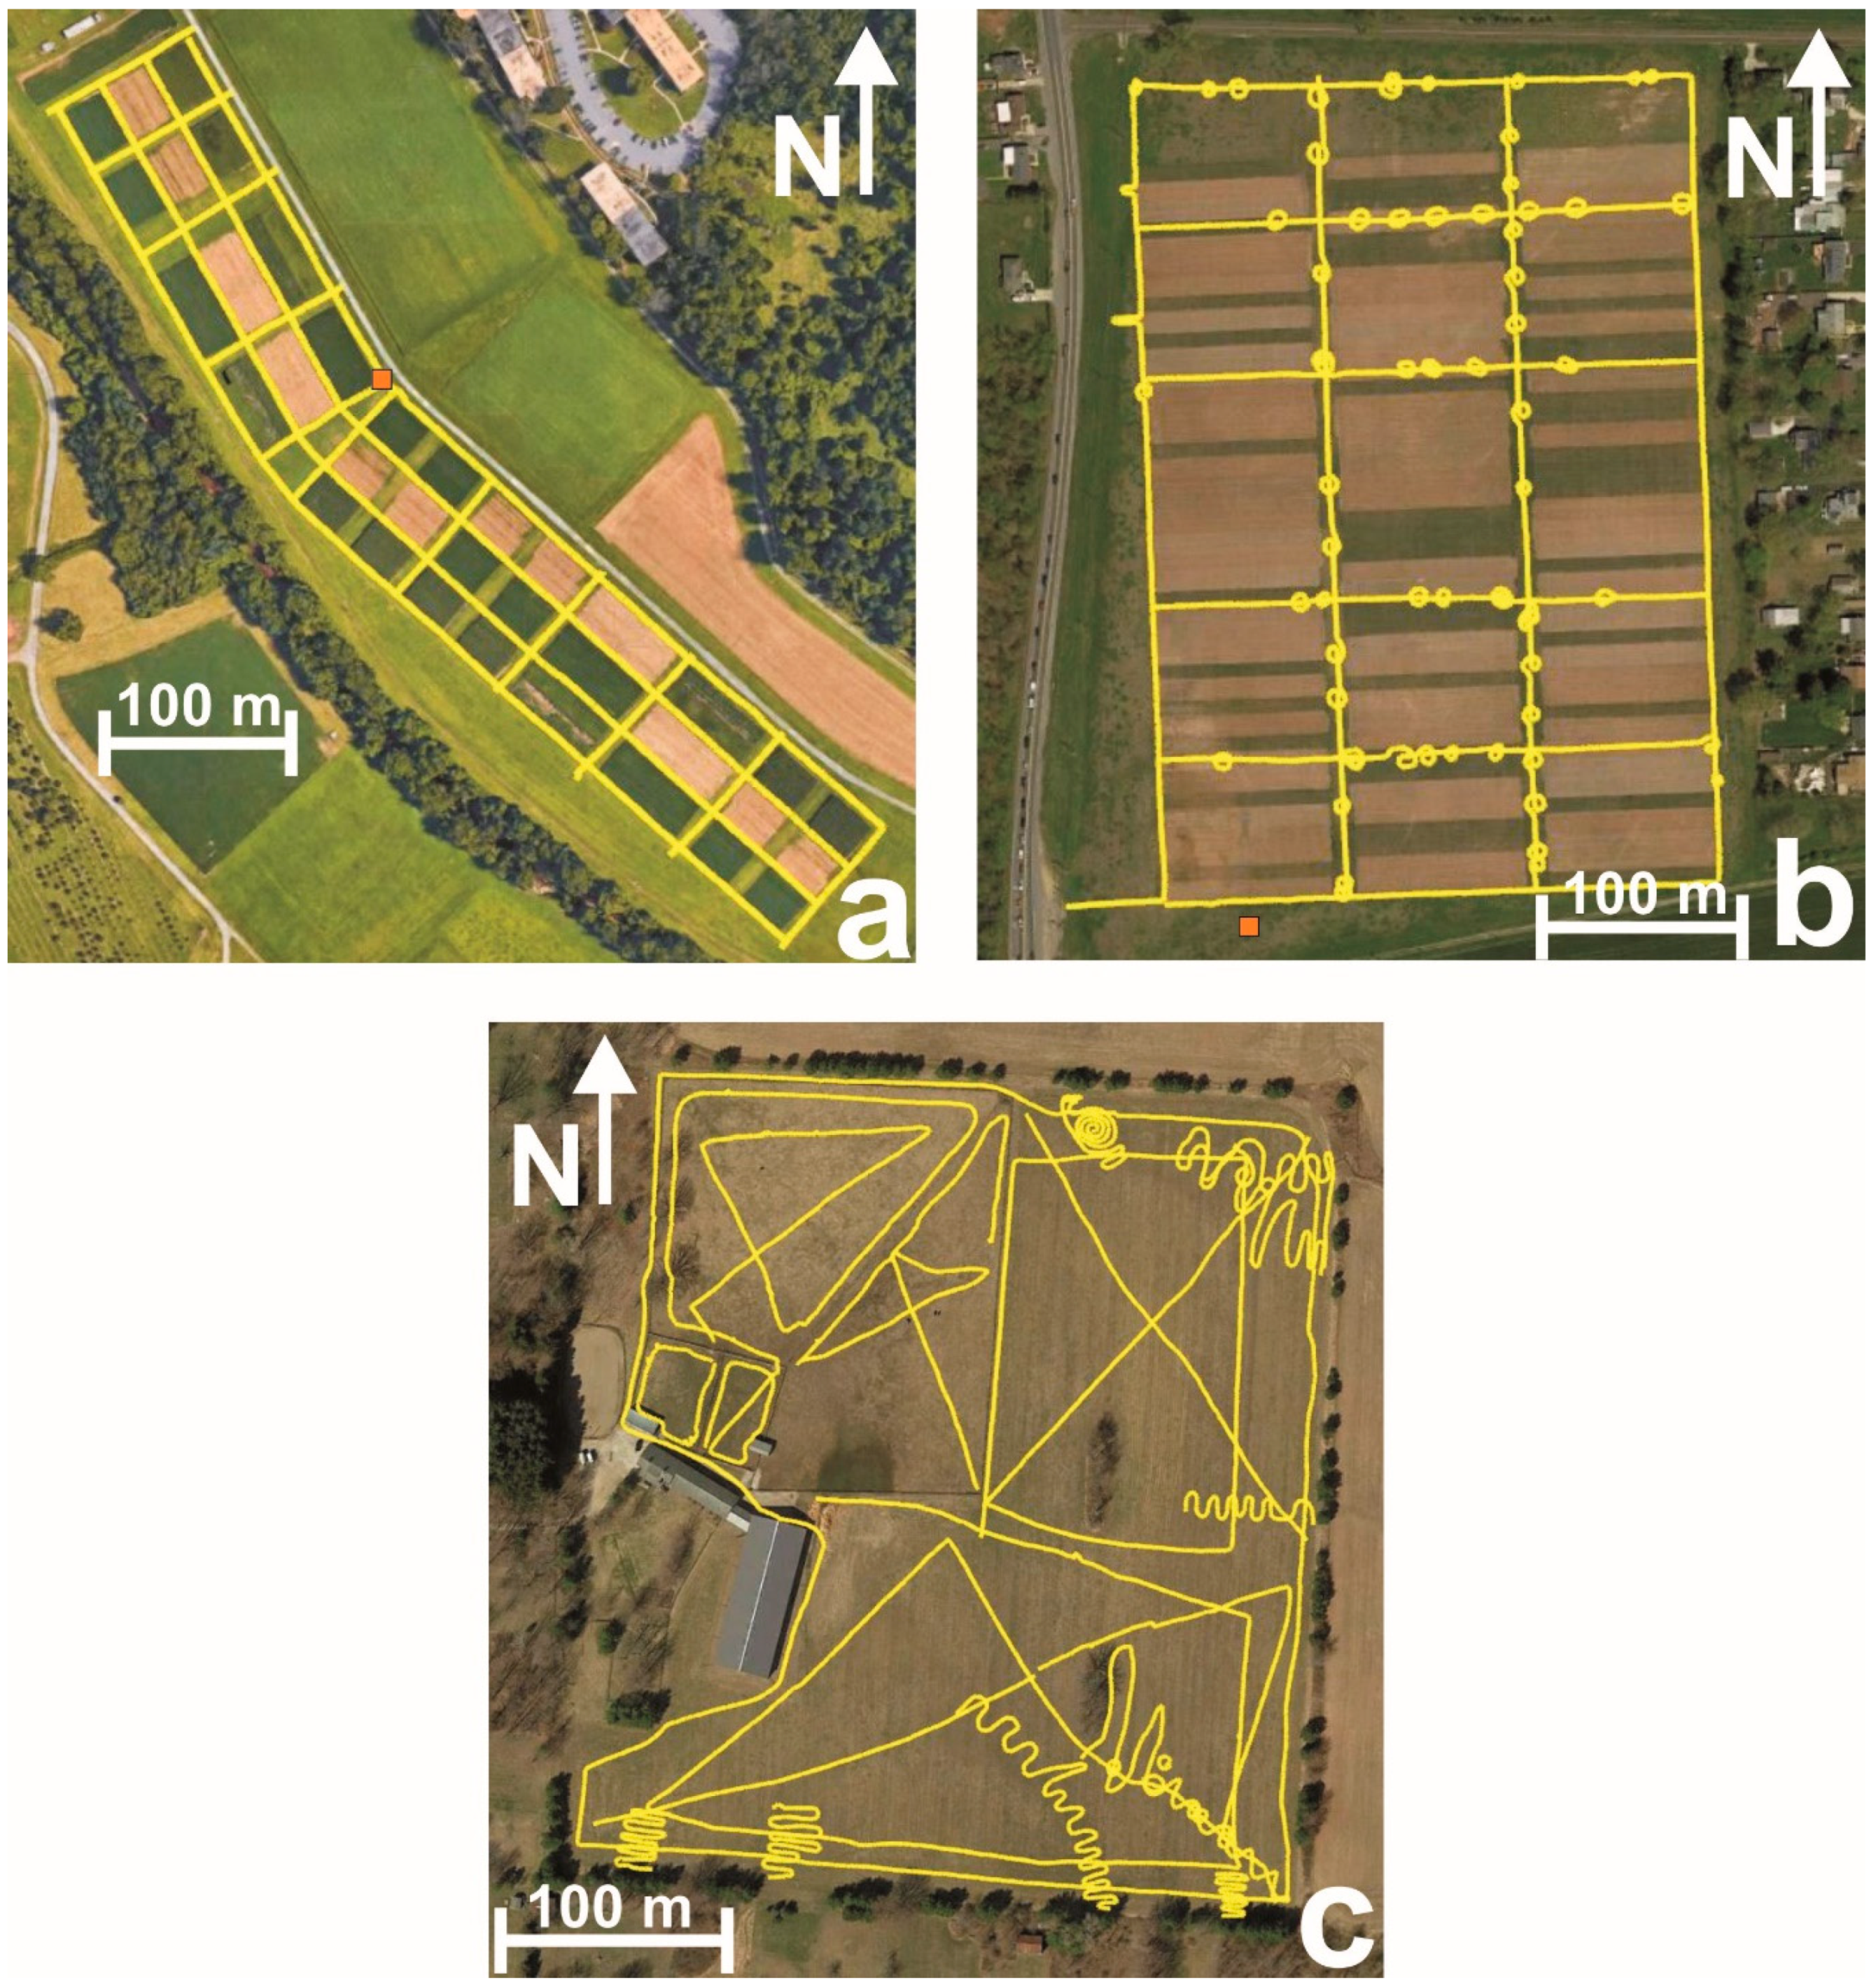
Testing of GPR integrated with an RTK/GNSS for drainage pipe mapping was carried out at three agricultural field sites. Two of the sites are located in Beltsville, MD, USA, and the third site is near Columbus, OH, USA. Aerial images of the three sites, with soil map overlays, are shown in Figure 2. Note: Throughout this article, aerial images obtained via Google Earth (Google LLC., Mountain View, CA, USA). were used as a base map to overlay soils and GPR information. Soil map overlays were obtained via the SoilWeb Earth App (UC Davis, California Soil Resource Lab, Davis, CA, USA). Descriptions for each test site are provided as follows.

2.1.1. Site 1 (Latitude: 39.012555, Longitude: −76.940204)

Site 1 is located at the U.S. Department of Agriculture (USDA)—Agricultural Research Service (ARS)—Beltsville Agricultural Research Center (BARC). Site 1 is comprised of numerous small experiment plots (Figure 2a). The total area of this agricultural field is 5.6 ha. Cordorus and Hatboro soils, CF, cover Site 1. Both the Cordorus (mesic Fluvaquentic Dystrudept) and Hatboro (mesic Fluvaquentic Endoaquept) are classified as loams.

2.1.2. Site 2 (Latitude: 39.025426, Longitude: −76.899118)

Site 2 is also located at BARC and is approximately 4 km northeast of Site 1. Site 2, as with site 1, is comprised of numerous small experiment plots (Figure 2b). The total area of the Site 2 agricultural field is 11.3 ha. The soils that cover Site 2 include Elkton silt loam, EkA, (mesic Typic Endoaquults), Hammonton loamy sand, HaA, (mesic Aquic Hapludults), Russett—Christiana complex, RcA or RcB, (Russett loam—mesic Aquic Hapludults, Christiana—mesic Aquic Hapludults), and Udorthents, UdgB, (reclaimed gravel pits). Udorthents cover only a very small part of Site 2, just in the southwest corner.

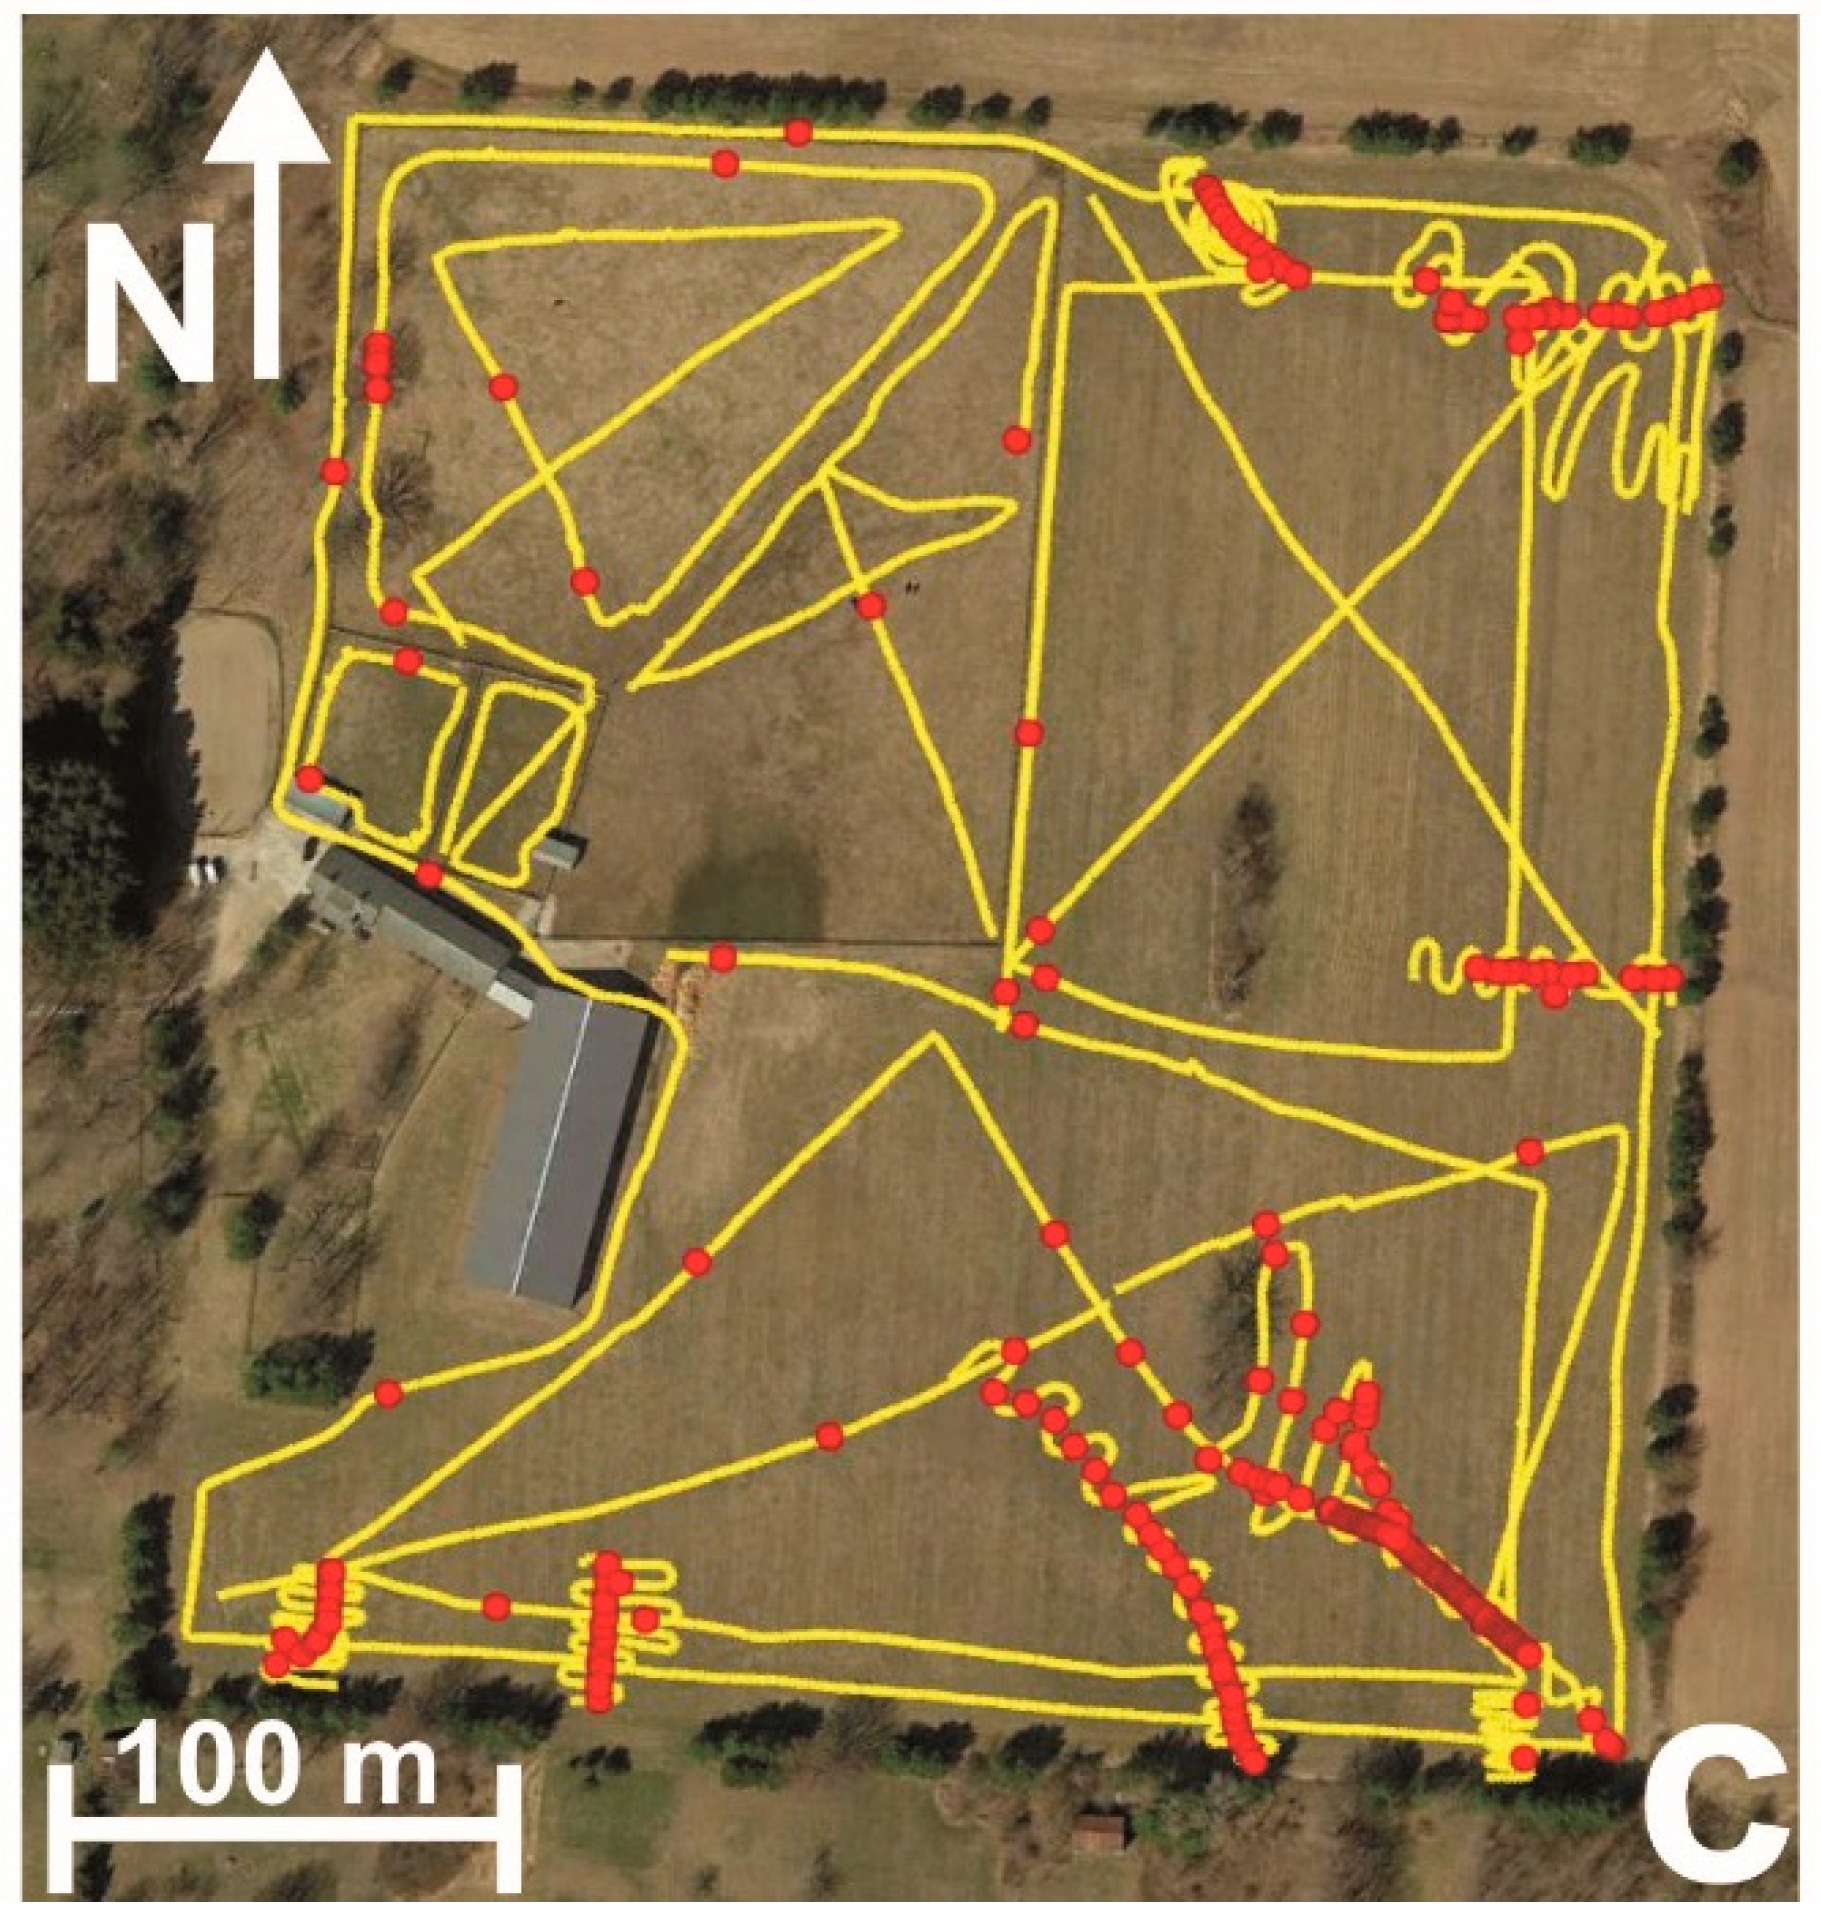
2.1.3. Site 3 (Latitude: 40.029482, Longitude: −82.727897)

Site 3 is a horse boarding, riding, and training facility located near Columbus, Ohio. The northeastern portion of the site has fenced-in areas for horses to exercise and graze (Figure 2c). The building structures contain offices, boarding stalls, and an indoor riding area. A large hay field is present within southern and western portions of the site. The total area of Site 3 is 13.0 ha. The soils in this agricultural setting include Bennington silt loam, BeB, (mesic Aeric Epiaqualfs), Cardington silt loam, Crd1B1, (mesic Aquic Hapludalfs), and Pewamo silty clay loam, Pe, (mesic Typic Argiaquolls).
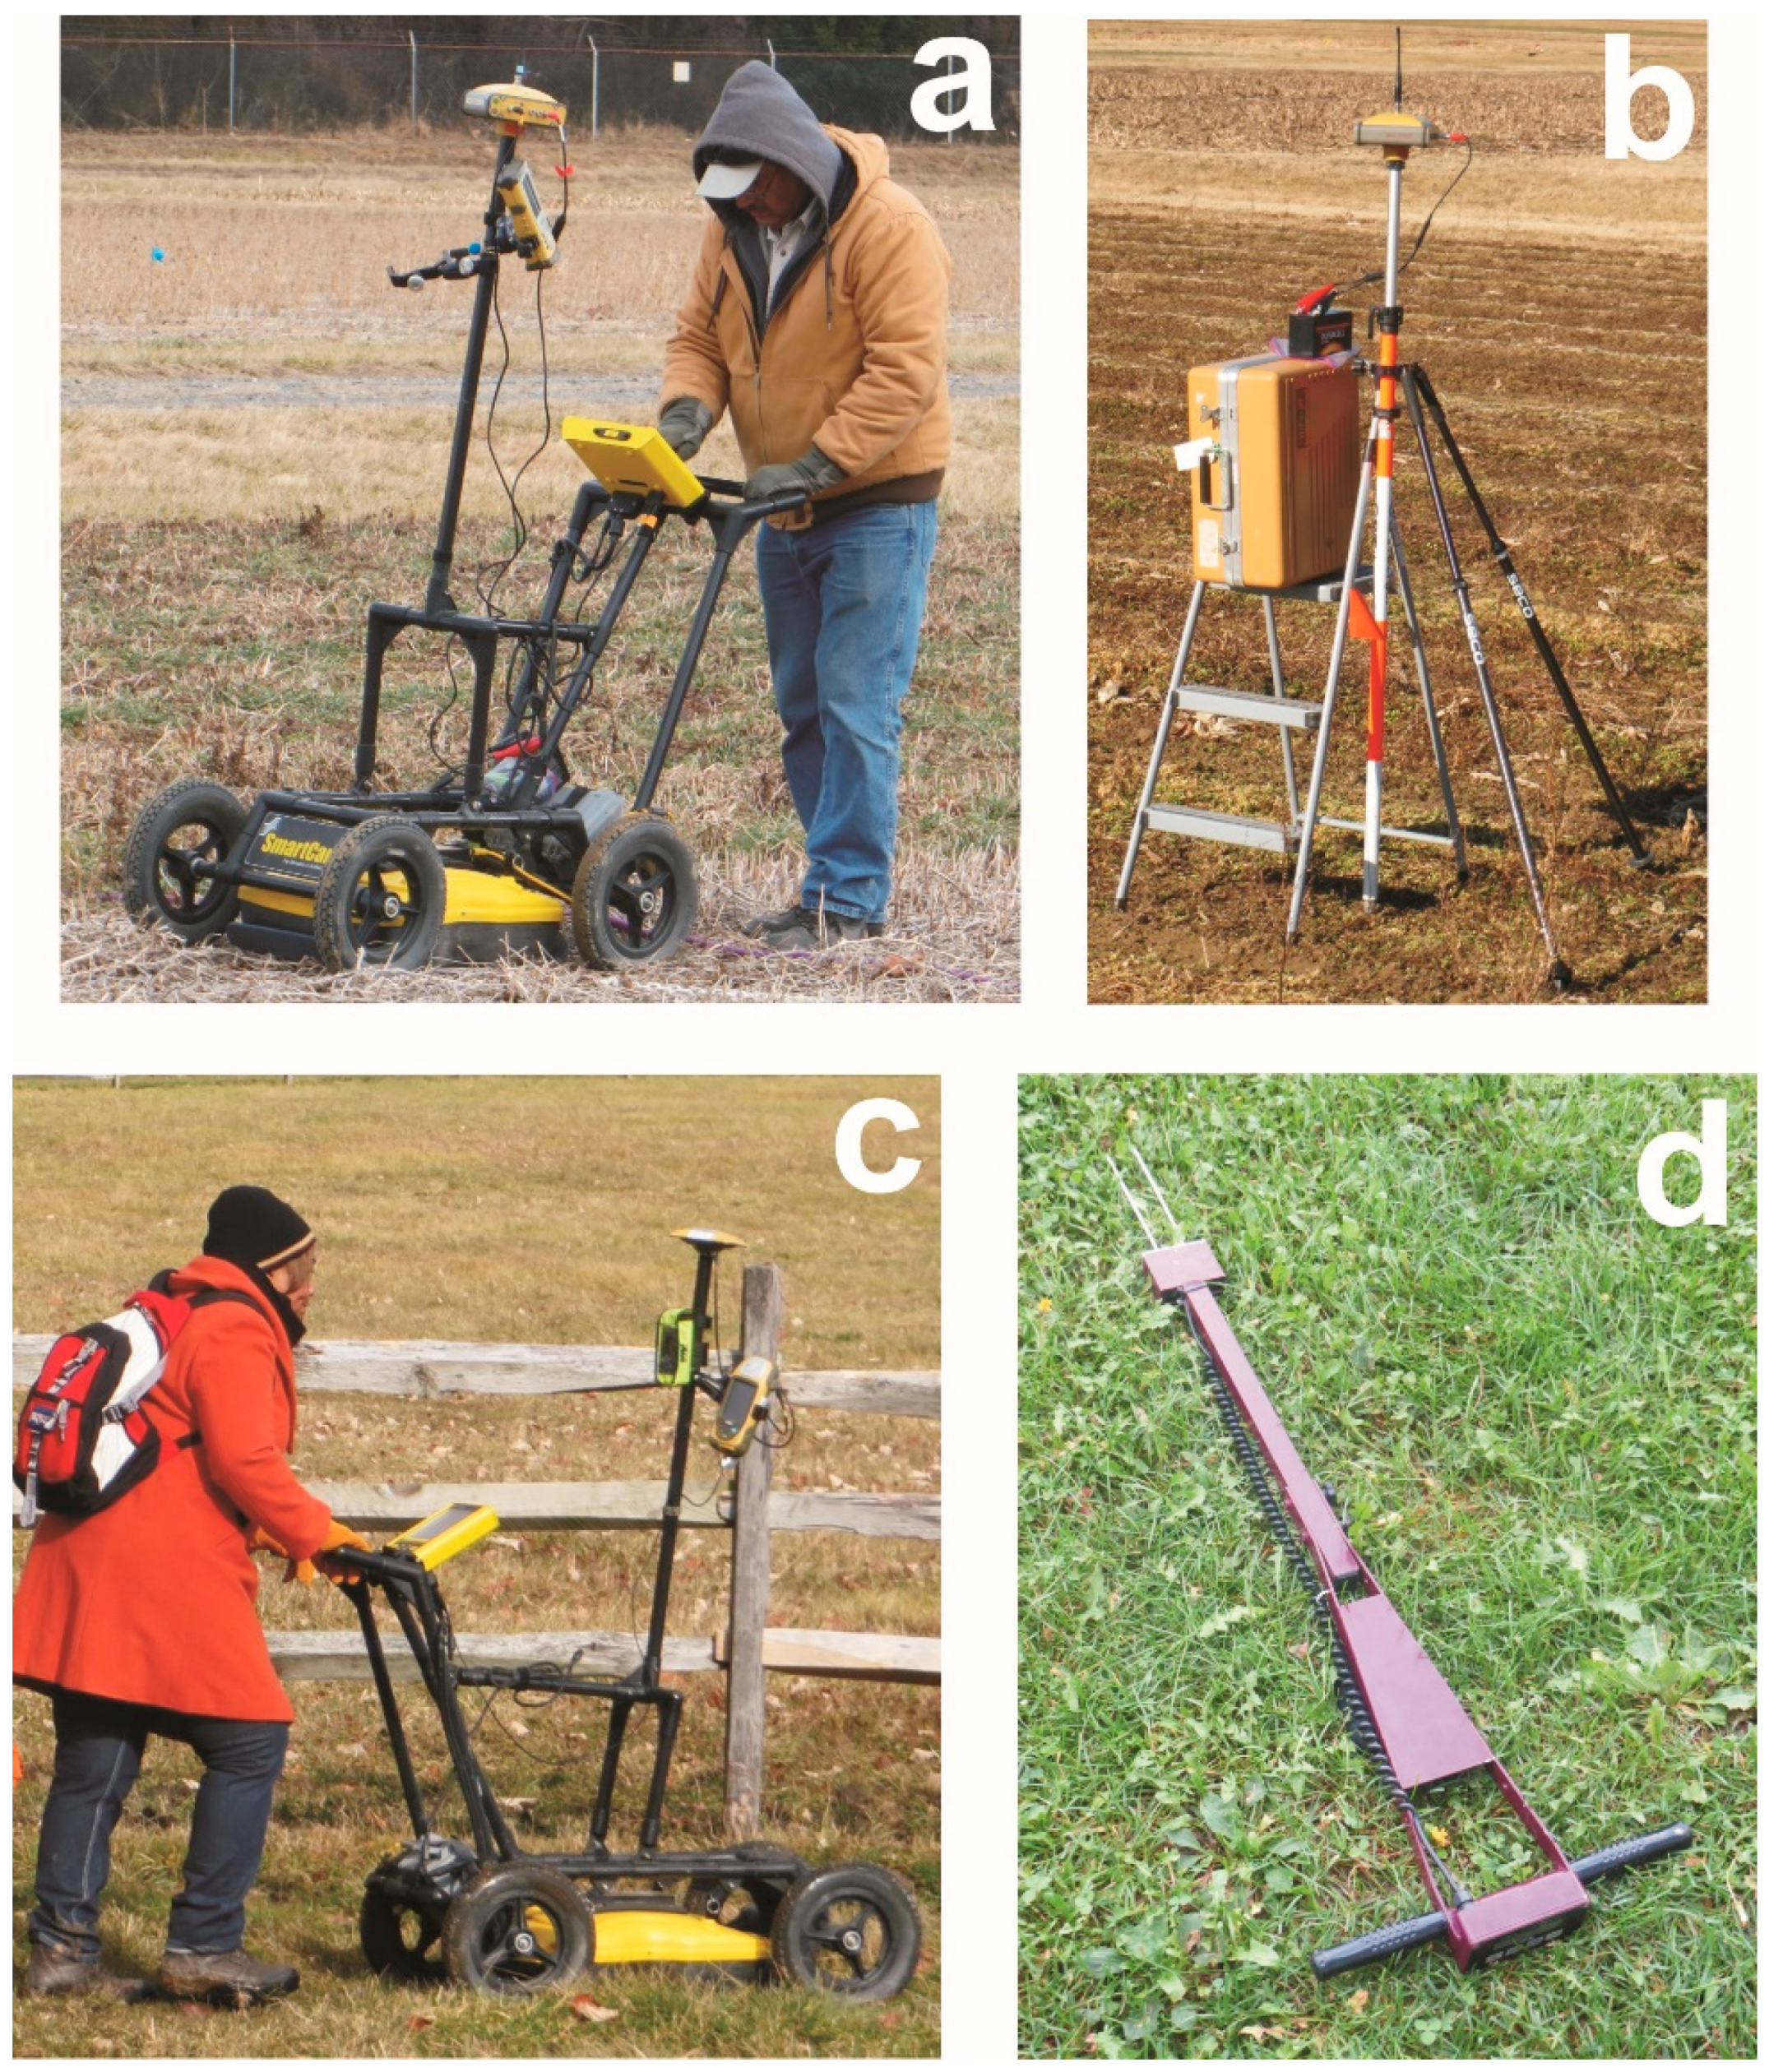
2.2. Equipment

A Sensors & Software Inc. (Mississagua, ON, Canada) Noggin® GPR system having 250 MHz antennas (Figure 3a,c) was employed to detect buried drainage pipes. The antennas used were shielded and had a frequency range from 125 to 375 MHz, with a center frequency of 250 MHz. Previous research [3,4,5,6,7] indicated that 250 MHz center frequency antennas worked best for finding clay tile and CPT drainage pipes in agricultural settings. Integration of RTK/GNSS with the GPR system allowed accurate latitude and longitude coordinates to be obtained at field locations where potential drainage pipes were detected. In order to obtain RTK/GNSS coordinates at Sites 1 and 2, a Topcon Corporation (Itabashi, Japan) GNSS (Global Positioning System—GPS and Globalnaya Navigazionnaya Sputnikovaya Sistema—GLONASS) FC-200 rover receiver (Figure 3a) and Topcon Corporation GNSS (GPS and GLONASS) HiPer XT base station receiver (Figure 3b) were utilized. At Site 3, a Topcon Corporation GRS-1 dual-frequency, GNSS (GPS and GLONASS) rover receiver and Topcon Corporation PG-S1 hand-held controller were employed together (Figure 3c) with a virtual base station set-up through the Ohio Department of Transportation’s (ODOT) network of Continuously Operating Reference Stations (CORS) [8]. Time domain reflectometry (TDR) soil water content values were collected using a Spectrum Technologies, Inc. (East Plainfield, Illinois) Field Scout TDR-300 with 20 cm waveguides (Figure 3d). The TDR water content measurements were utilized to determine soil dielectric constant values [9], that in turn were used to calculate preliminary soil radar velocities [10,11], which were then employed to convert GPR two-way travel times to depth values.

2.3. Field Data Collection

Almost all of the GPR-RTK/GNSS data for Site 1 was collected on 5 April 2017, with just a few additional short GPR transects carried out on 24 January 2018. All GPR-RTK/GNSS data for Site 2 was obtained on 25 January 2018. For Site 3, linear GPR transects were completed on 6 November 2017, followed by the spiral/serpentine GPR transects on 5 February 2018. At each site, between four to six hours total was needed to complete the GPR-RTK/GNSS surveys. The GPR equipment settings included a 5 cm distance between signal trace measurement points along a transect (i.e., station interval = 5 cm). At each measurement point on the GPR transect, 16 signal traces were collected and averaged (i.e., stacking = 16). The GPR two-way travel time for each signal trace was set to provide a depth of investigation of 1.5 m (Site 3) or 2.0 m (Sites 1 and 2). The GPR signal trace two-way travel time needed to achieve 1.5 m or 2.0 m investigations depths were calculated from soil radar velocity values based on TDR measurements.
One main component of the Noggin® GPR unit is the Digital Video Logger (DVL), which is used to input equipment settings (station interval, stacking, radar velocity, depth of investigation, etc.) and store GPR-RTK/GPS data. The DVL also has a display screen that provides a real-time GPR cross-section view of the subsurface as data is being collected along a measurement transect (Figure 3a,c). Consequently, the DVL can provide an almost instant indication of a buried drainage pipe. Suspected locations of the buried drainage pipes can then be flagged in the field, with flagged locations that line-up, pointing to the presence and trend of a drain line. Additionally, spiral/serpentine GPR transects or segments of transects can be carried out, on the spot, based on DVL indications of a buried drainage pipe, directly for the purpose of confirming drain line presence and determining its directional trend.
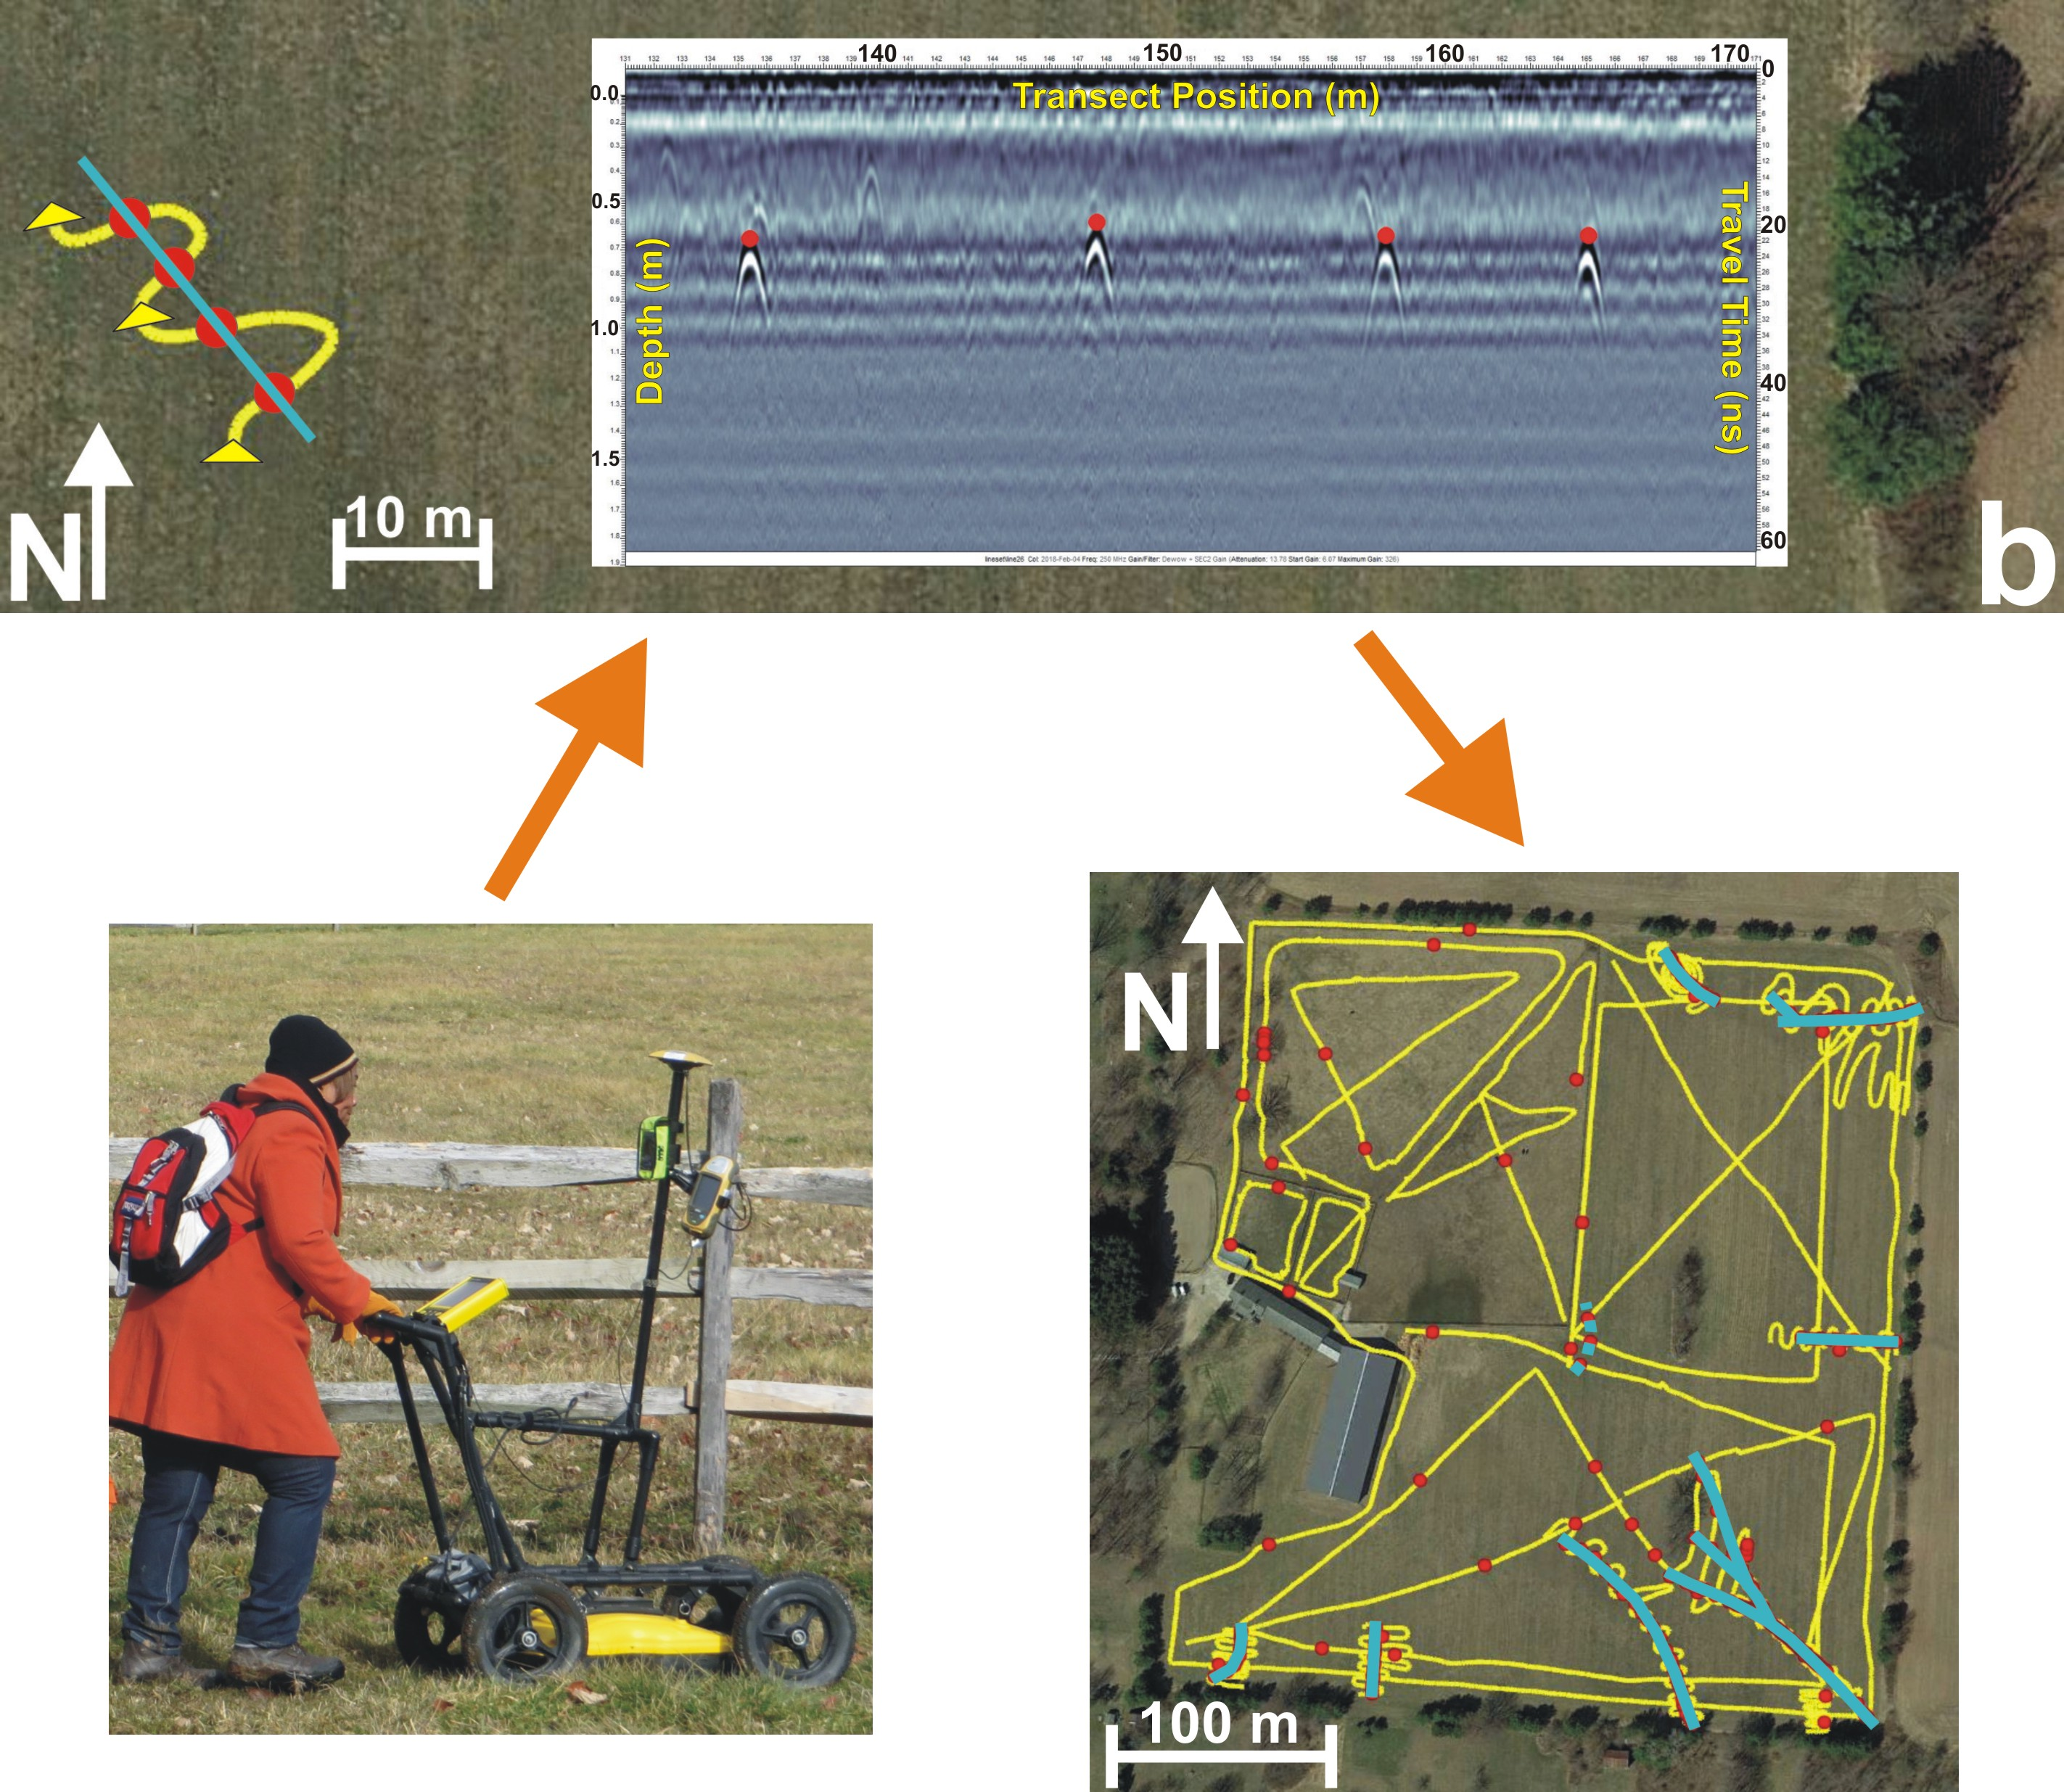
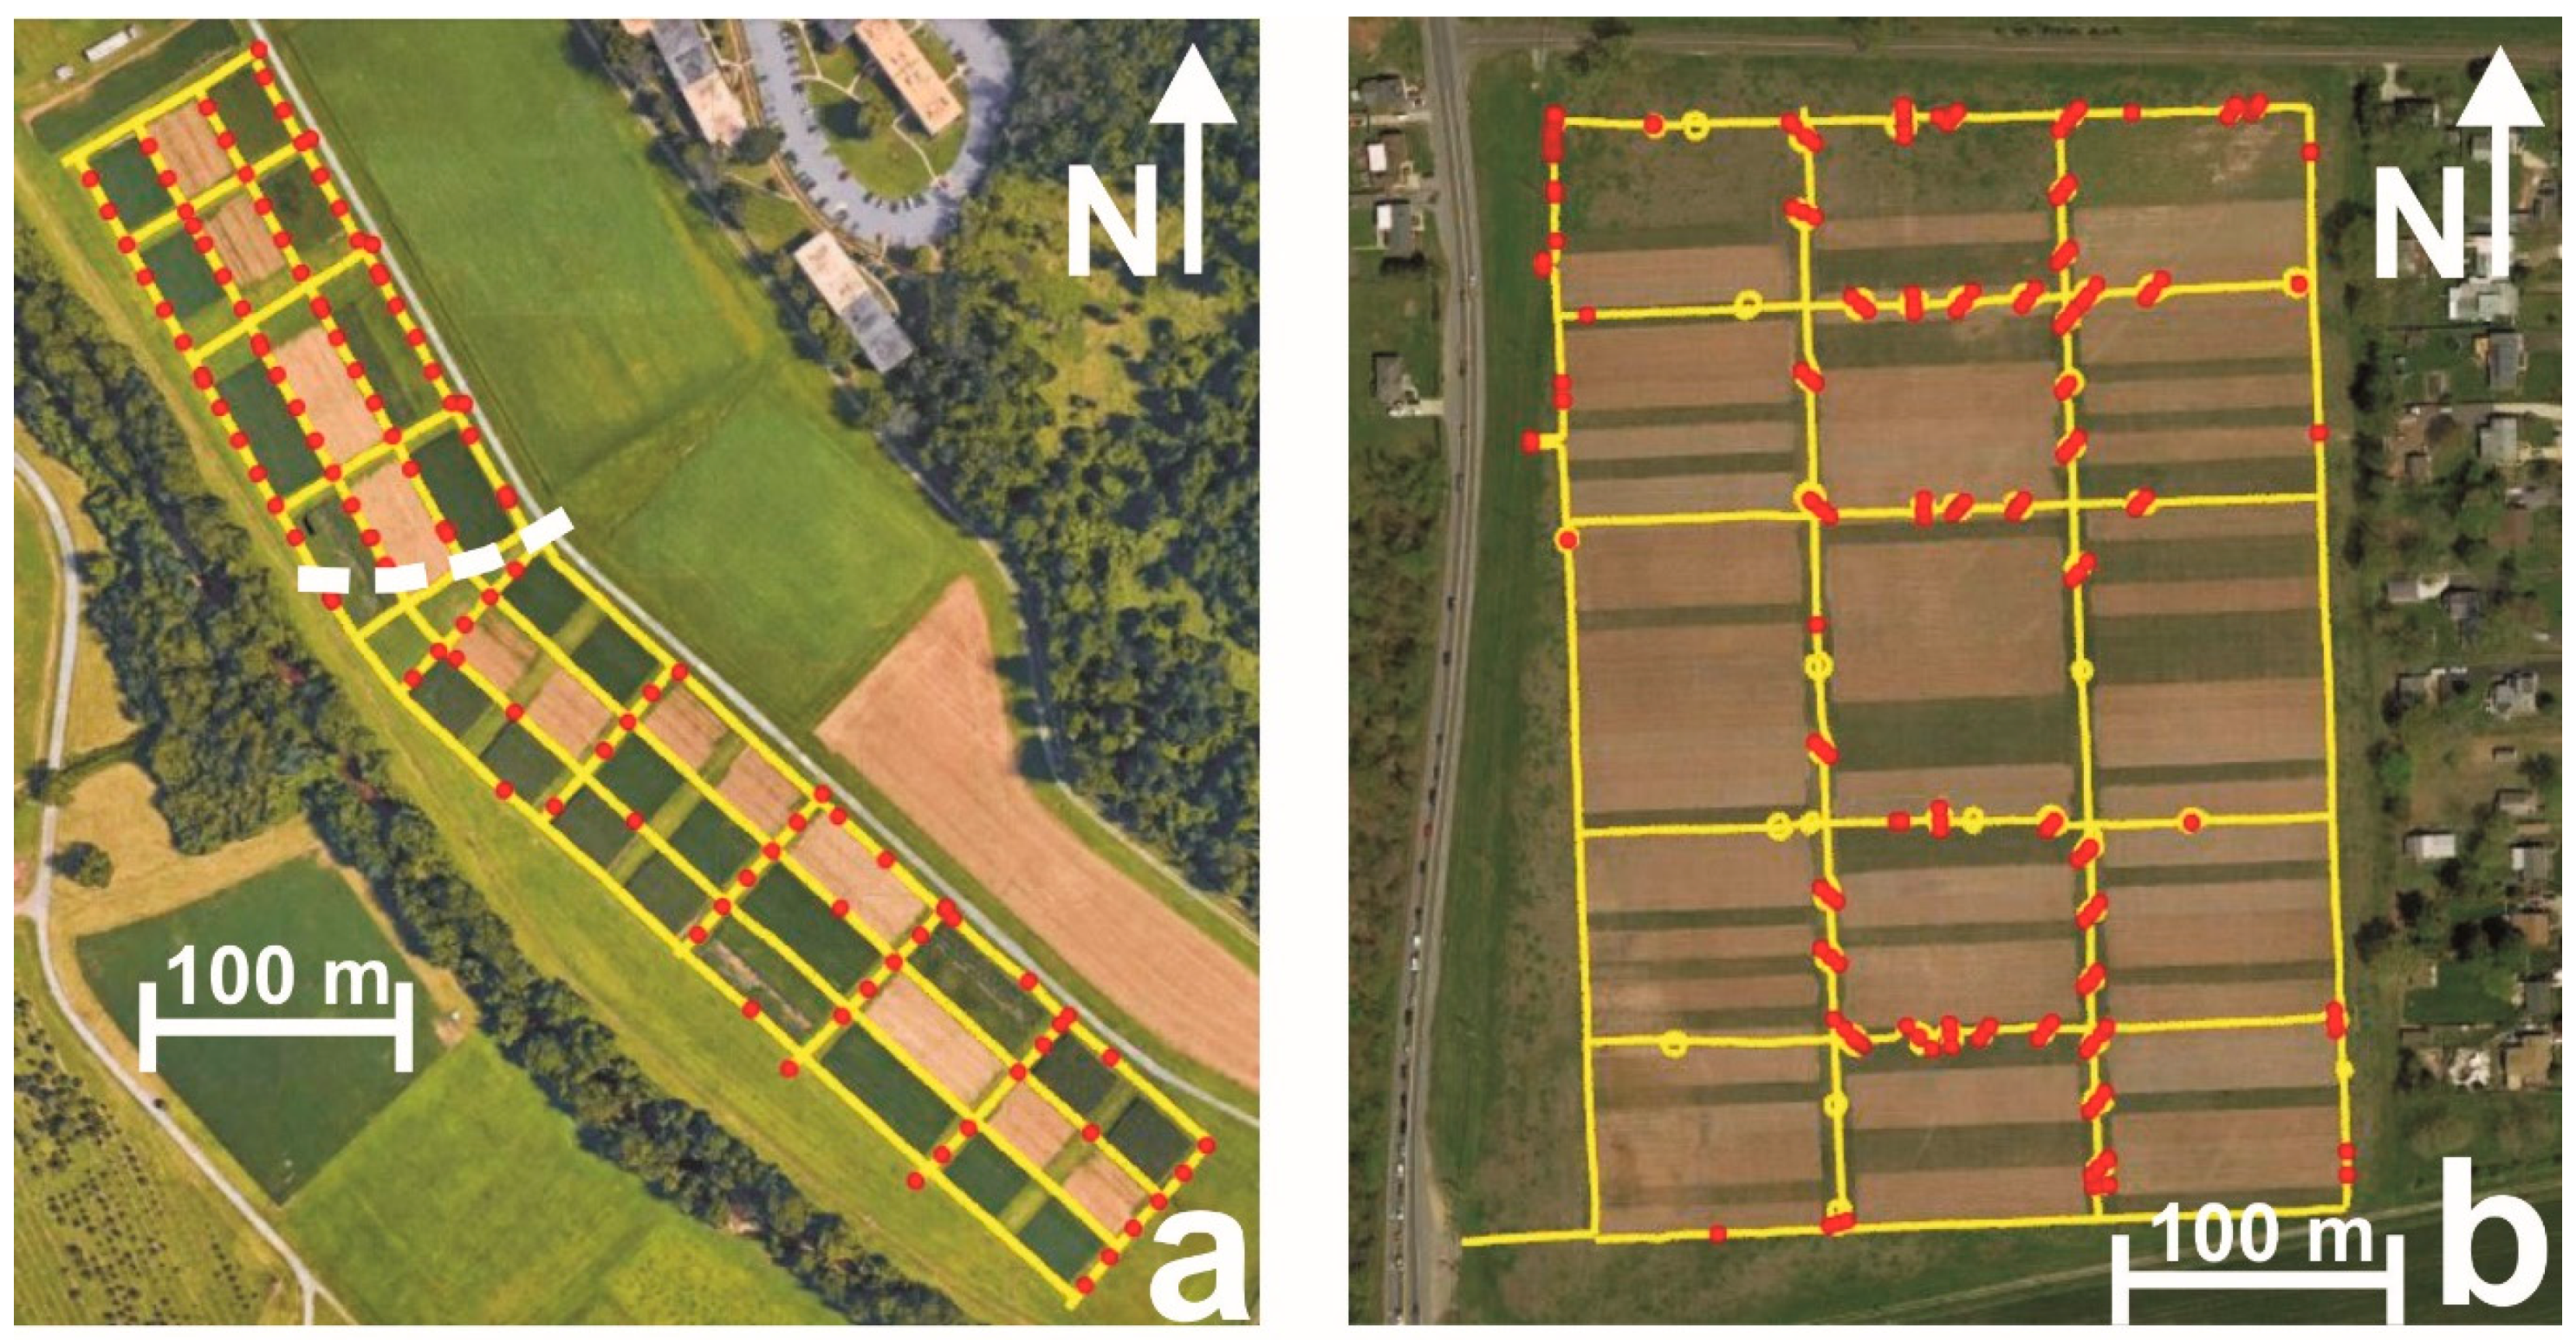
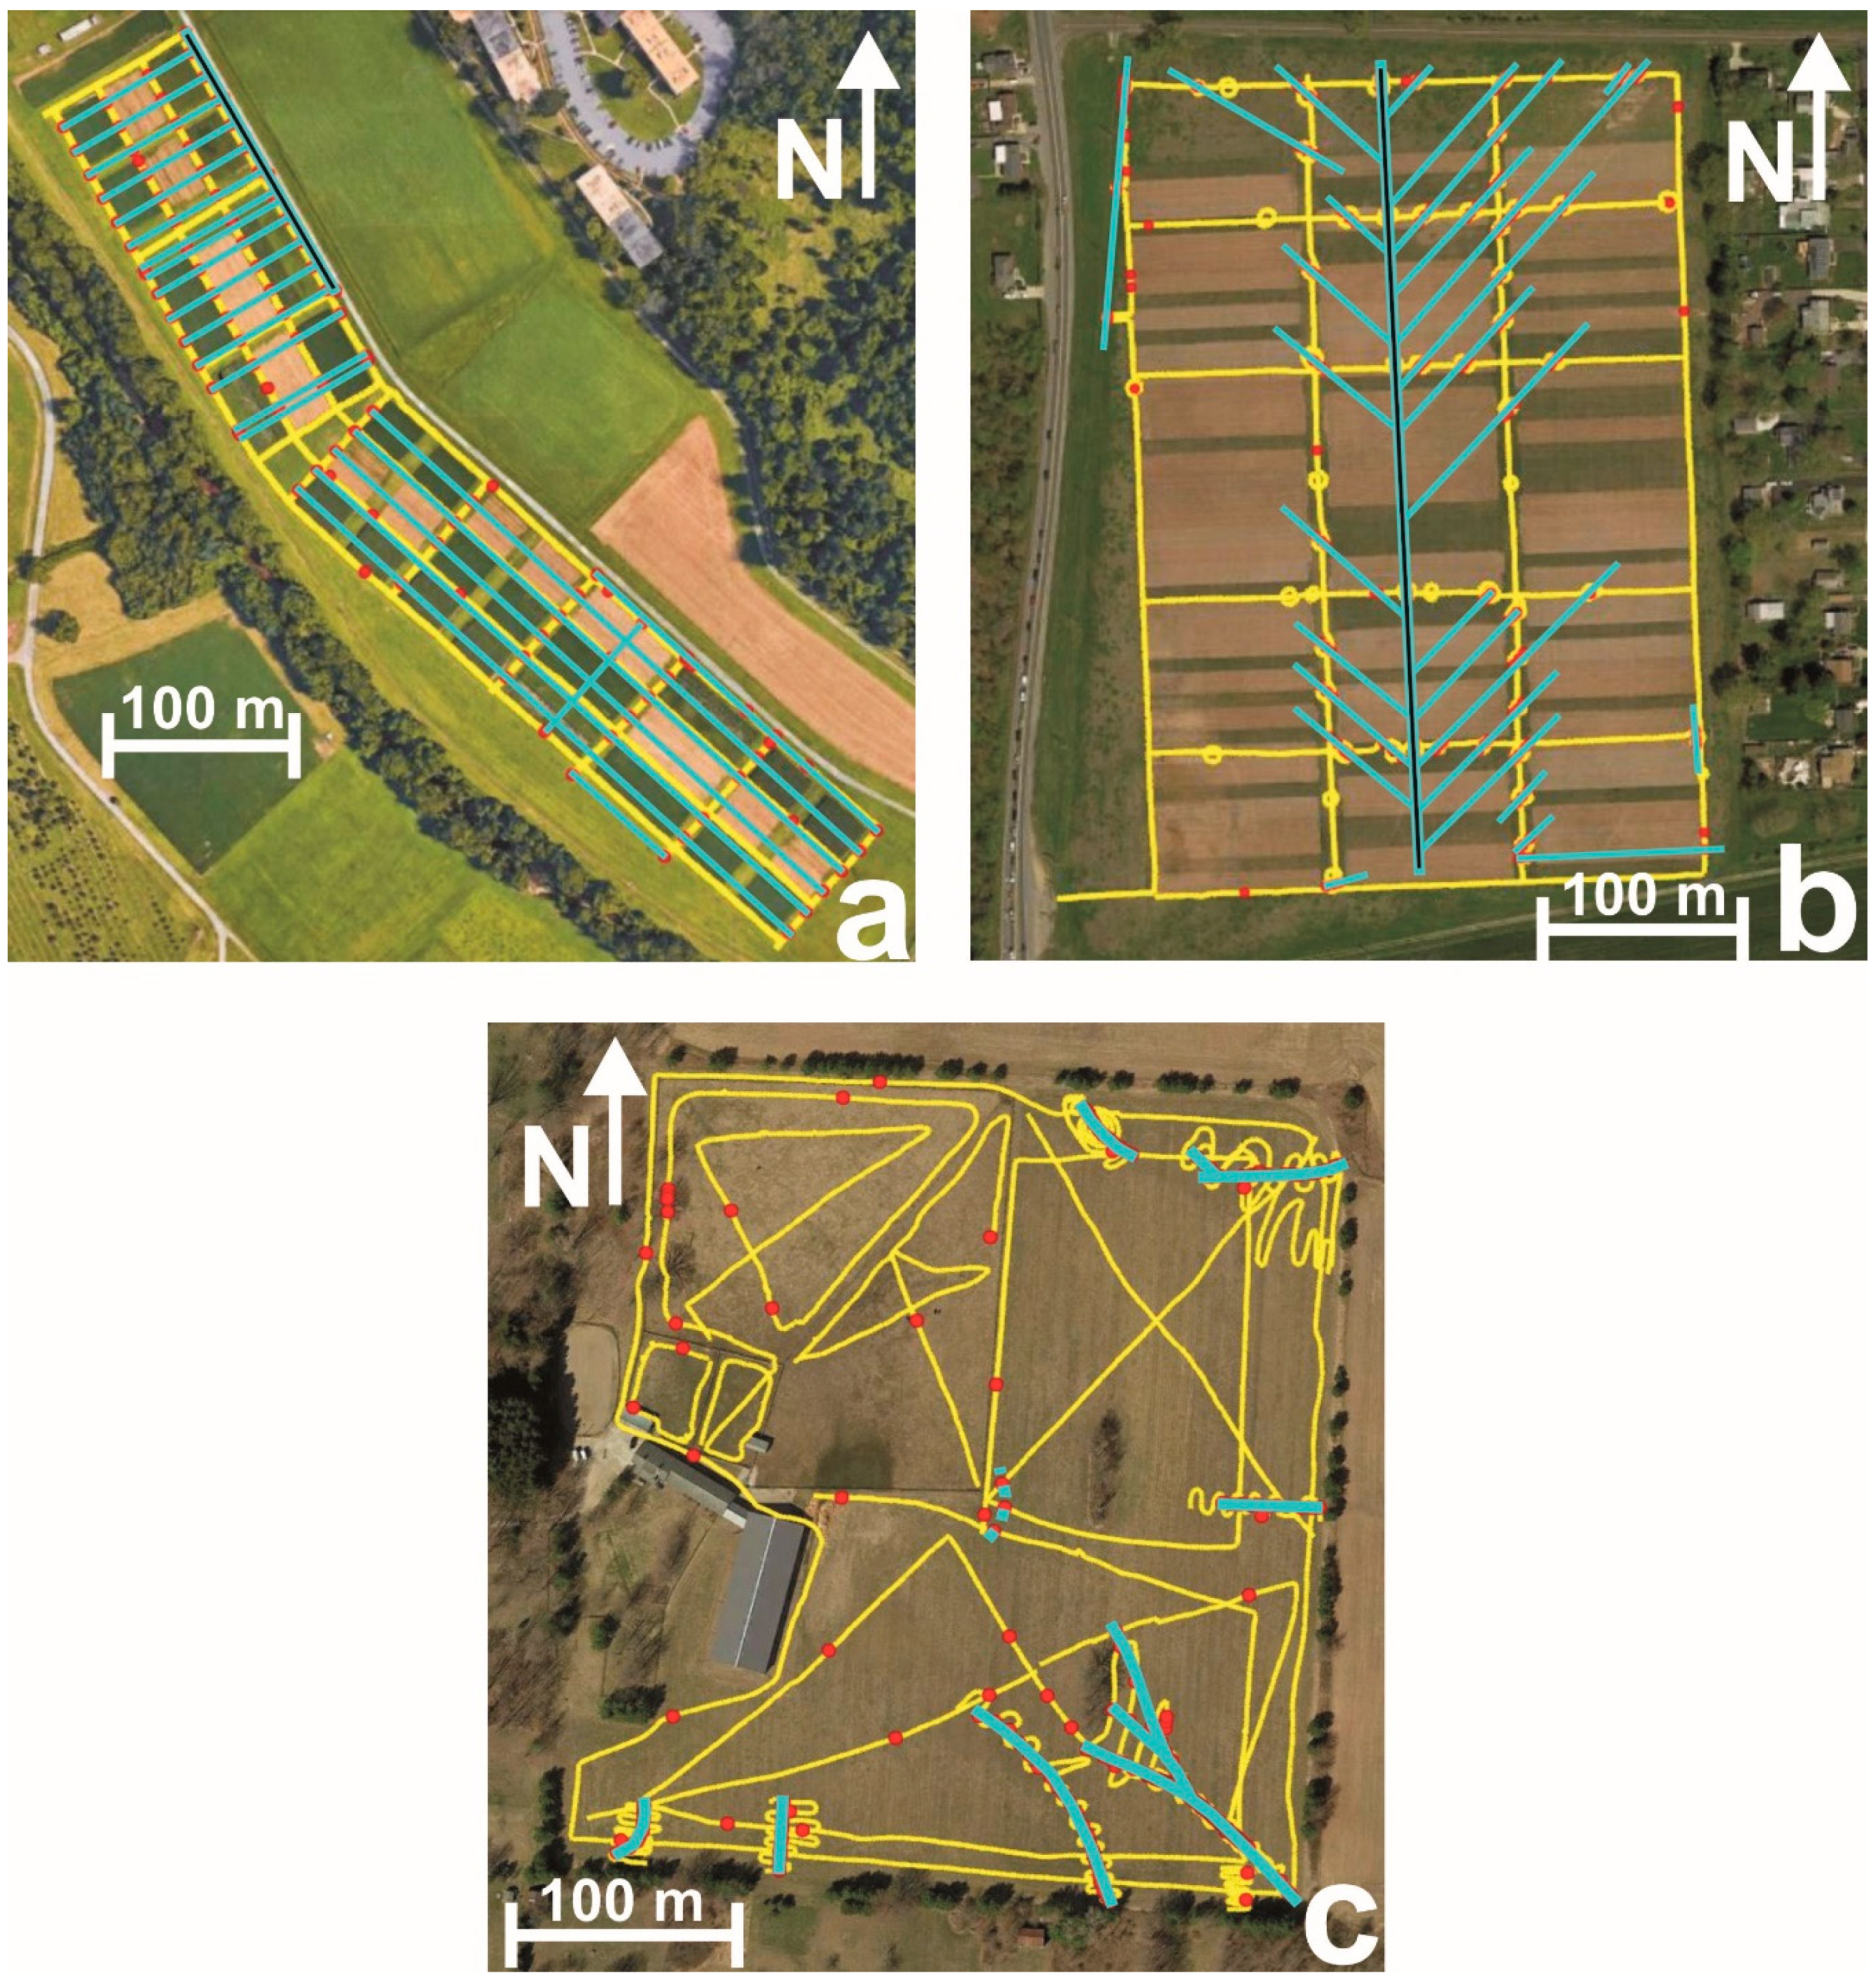
Site maps showing GPR measurement transects (yellow lines—obtained through RTK/GNSS data) are provided in Figure 4. The physical GNSS base station locations at Sites 1 and 2 are marked with orange square symbols (Figure 4a,b). (Again, a virtual base station was employed at Site 3, so there is no orange square symbol depicted in Figure 4c) At Sites 1 and 2, there were essentially two sets of GPR transects, one that coincided or paralleled the longest side boundaries at the sites and then a second set that was oriented perpendicular to the first set. At Site 2, most of the GPR transects contained spiral path segments that provided insight on drain line directional trends (Figure 4b). At Site 3, linear GPR transects around the perimeter of the property and within the fenced-in grazing/exercise areas or hay field were used for initial indications of where drainage pipes might exist. These linear GPR transects at Site 3 were then followed-up with spiral or serpentine GPR transects that were again used to determine the trend and extent of individual drain lines.

2.4. Data Processing and Interpretation

The principle of GPR operation is conceptually simple and involves directing an electromagnetic radio energy (radar) pulse into the subsurface, followed by measurement of the elapsed time taken by the signal as it is travels downwards from the transmitting antenna, partially reflects off a buried feature, and is eventually returned to the surface, where it is recorded by a receiving antenna. For each point of measurement along a GPR transect, reflections from different depths produce a signal trace, which is a function of the radar wave amplitude (and energy) versus two-way travel time. (Note: As previously indicated, soil water content measurements can be used to convert two-way travel times to depth values.) Antenna frequency, soil moisture conditions, clay content, salinity, and the amount of iron oxide present all have a substantial influence on the distance beneath the surface to which the radar signal penetrates. Differences in the dielectric constant across a buried feature discontinuity govern the amount of radar energy that reflects off the buried feature and then returns to surface to be recorded by the receiving antenna. Previous research [5] shows that the GPR drainage pipe response (i.e., amount of radar energy reflected from a buried pipe) does not depend on the type of pipe (clay tile or CPT) but rather the difference between the dielectric constant of the soil surrounding the pipe versus the dielectric constant of the air and/or water inside the pipe.
A GPR profile (i.e., cross-section) of the subsurface beneath a GPR transect is generated by sequentially combining, side-by-side, one after another, the signal traces obtained at each measurement point along the transect. The horizontal axis on a GPR profile represents distance along the transect (in meters), while the vertical axis represents two-way radar signal travel time (in nanoseconds) and/or depth (in meters). With depths of investigation of 1.5 or 2.0 m, the GPR profiles generated for this study essentially depict GPR responses only within the soil profile.
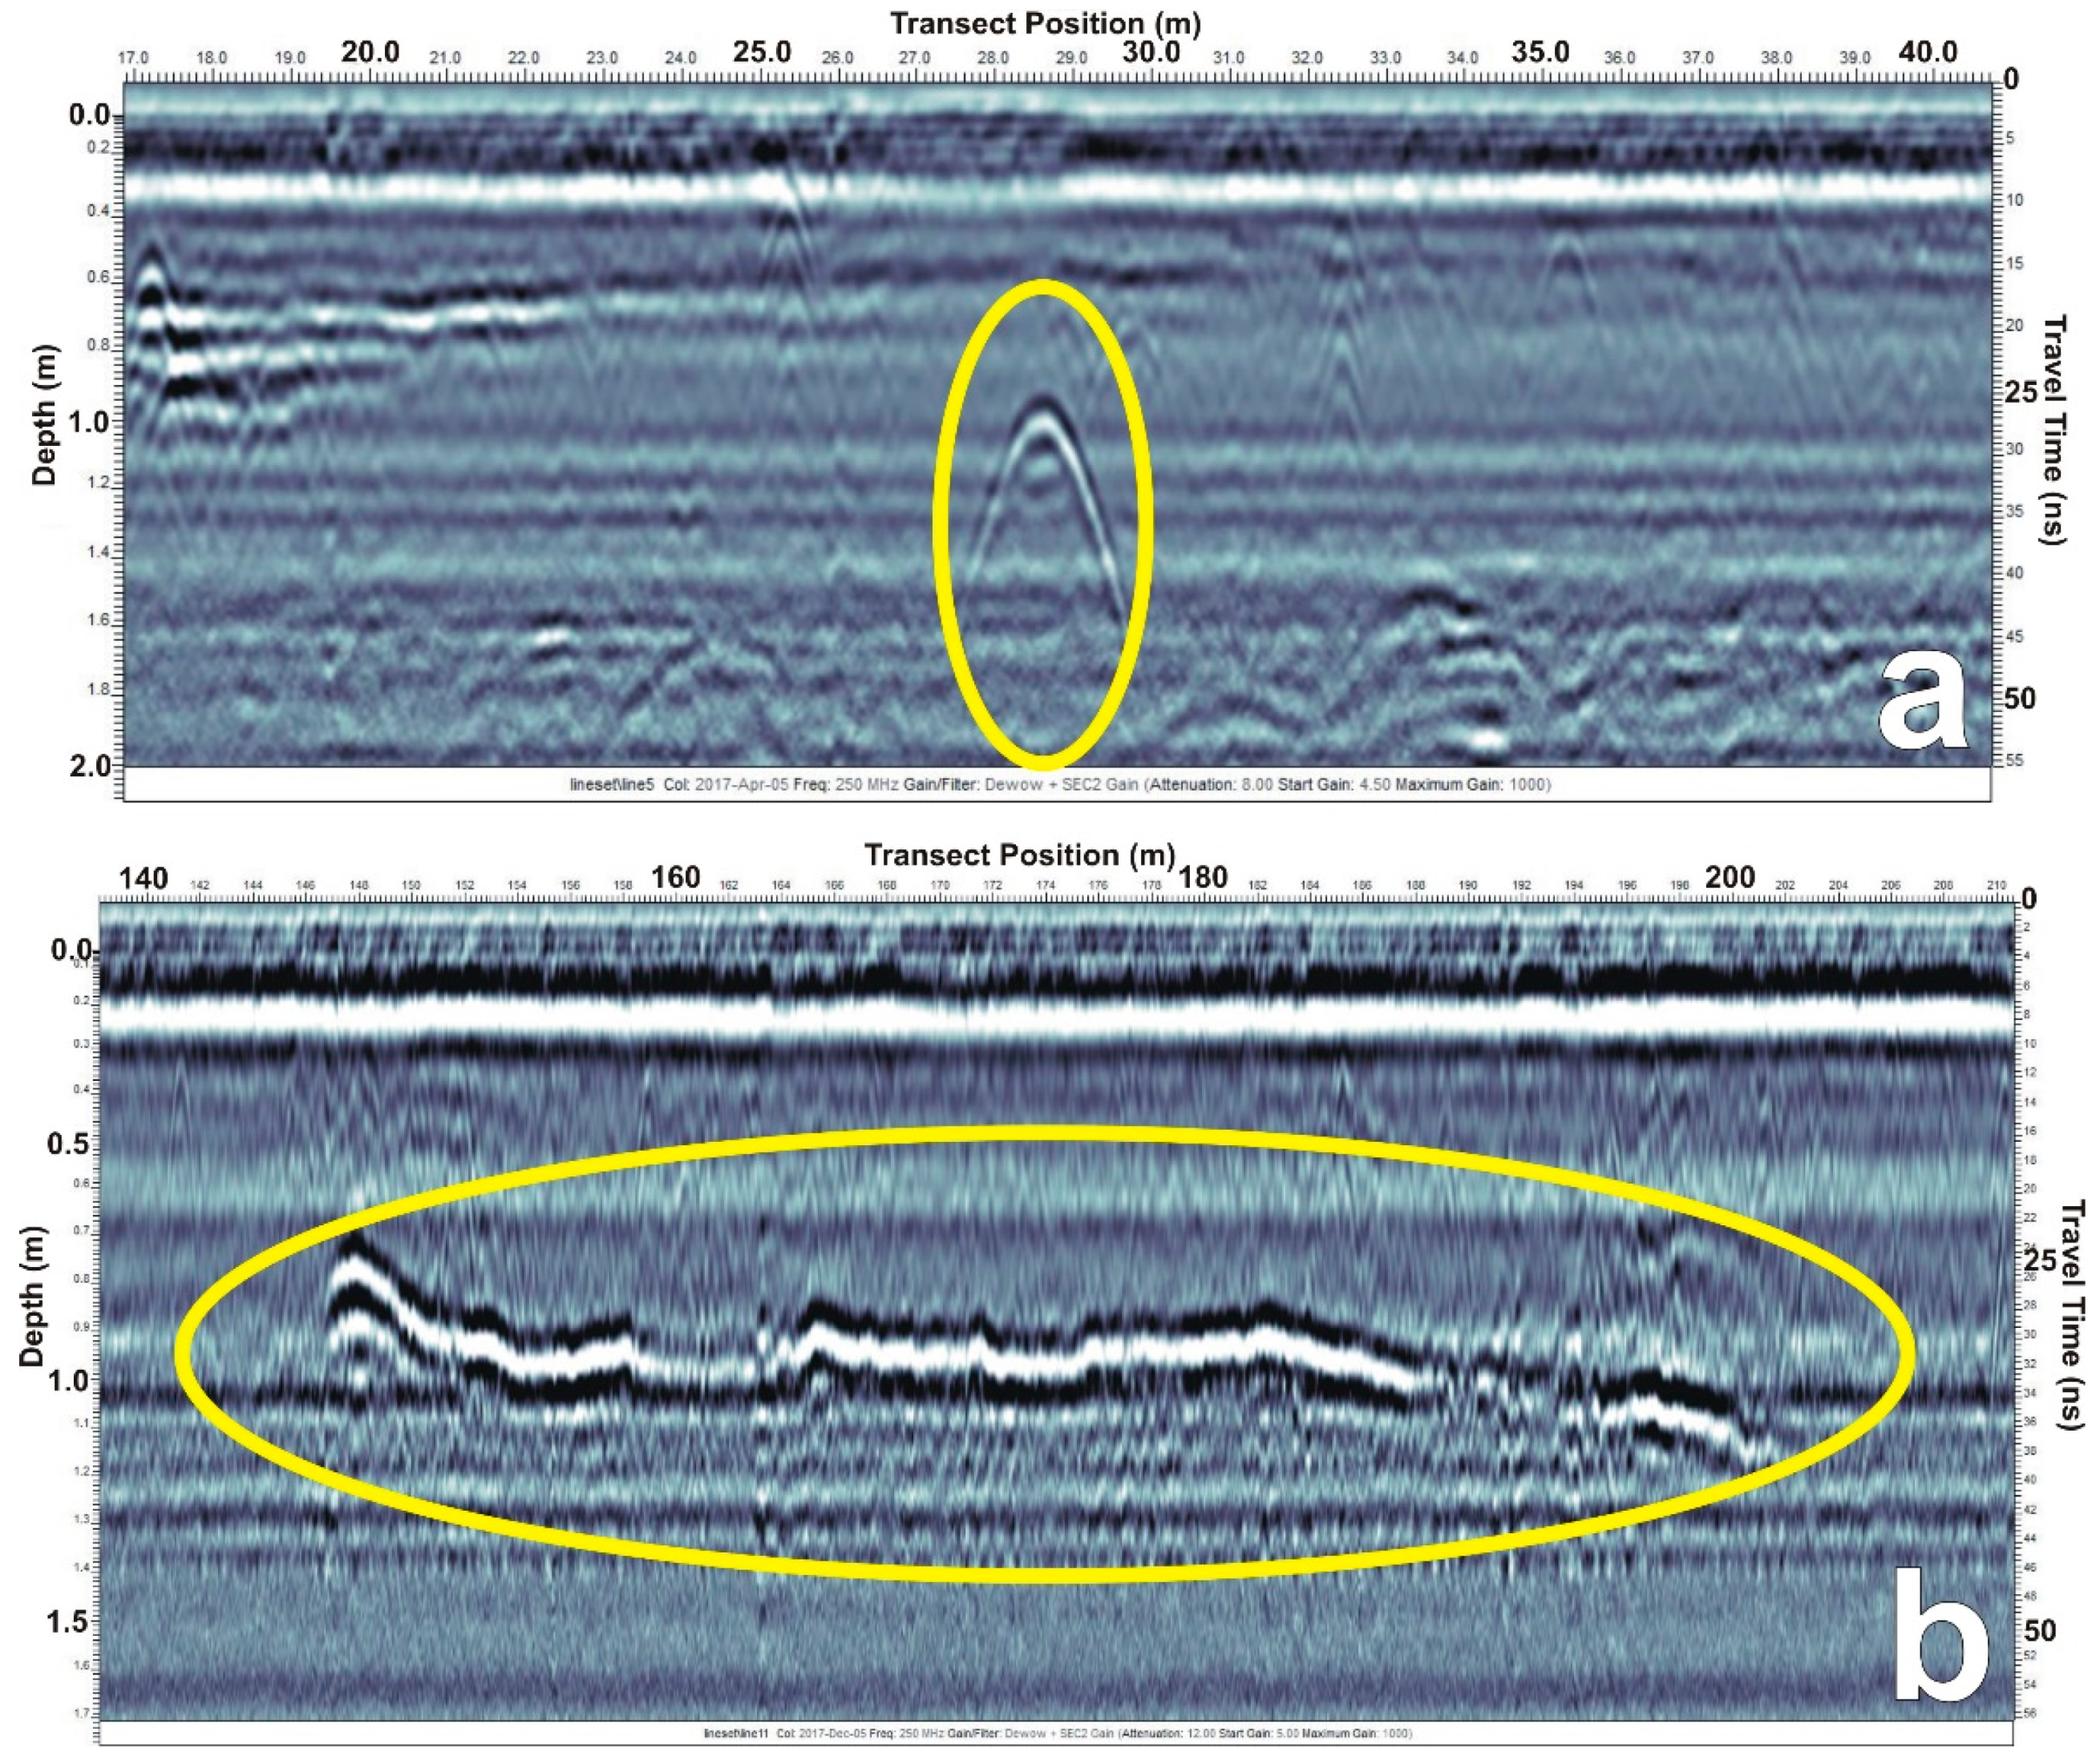
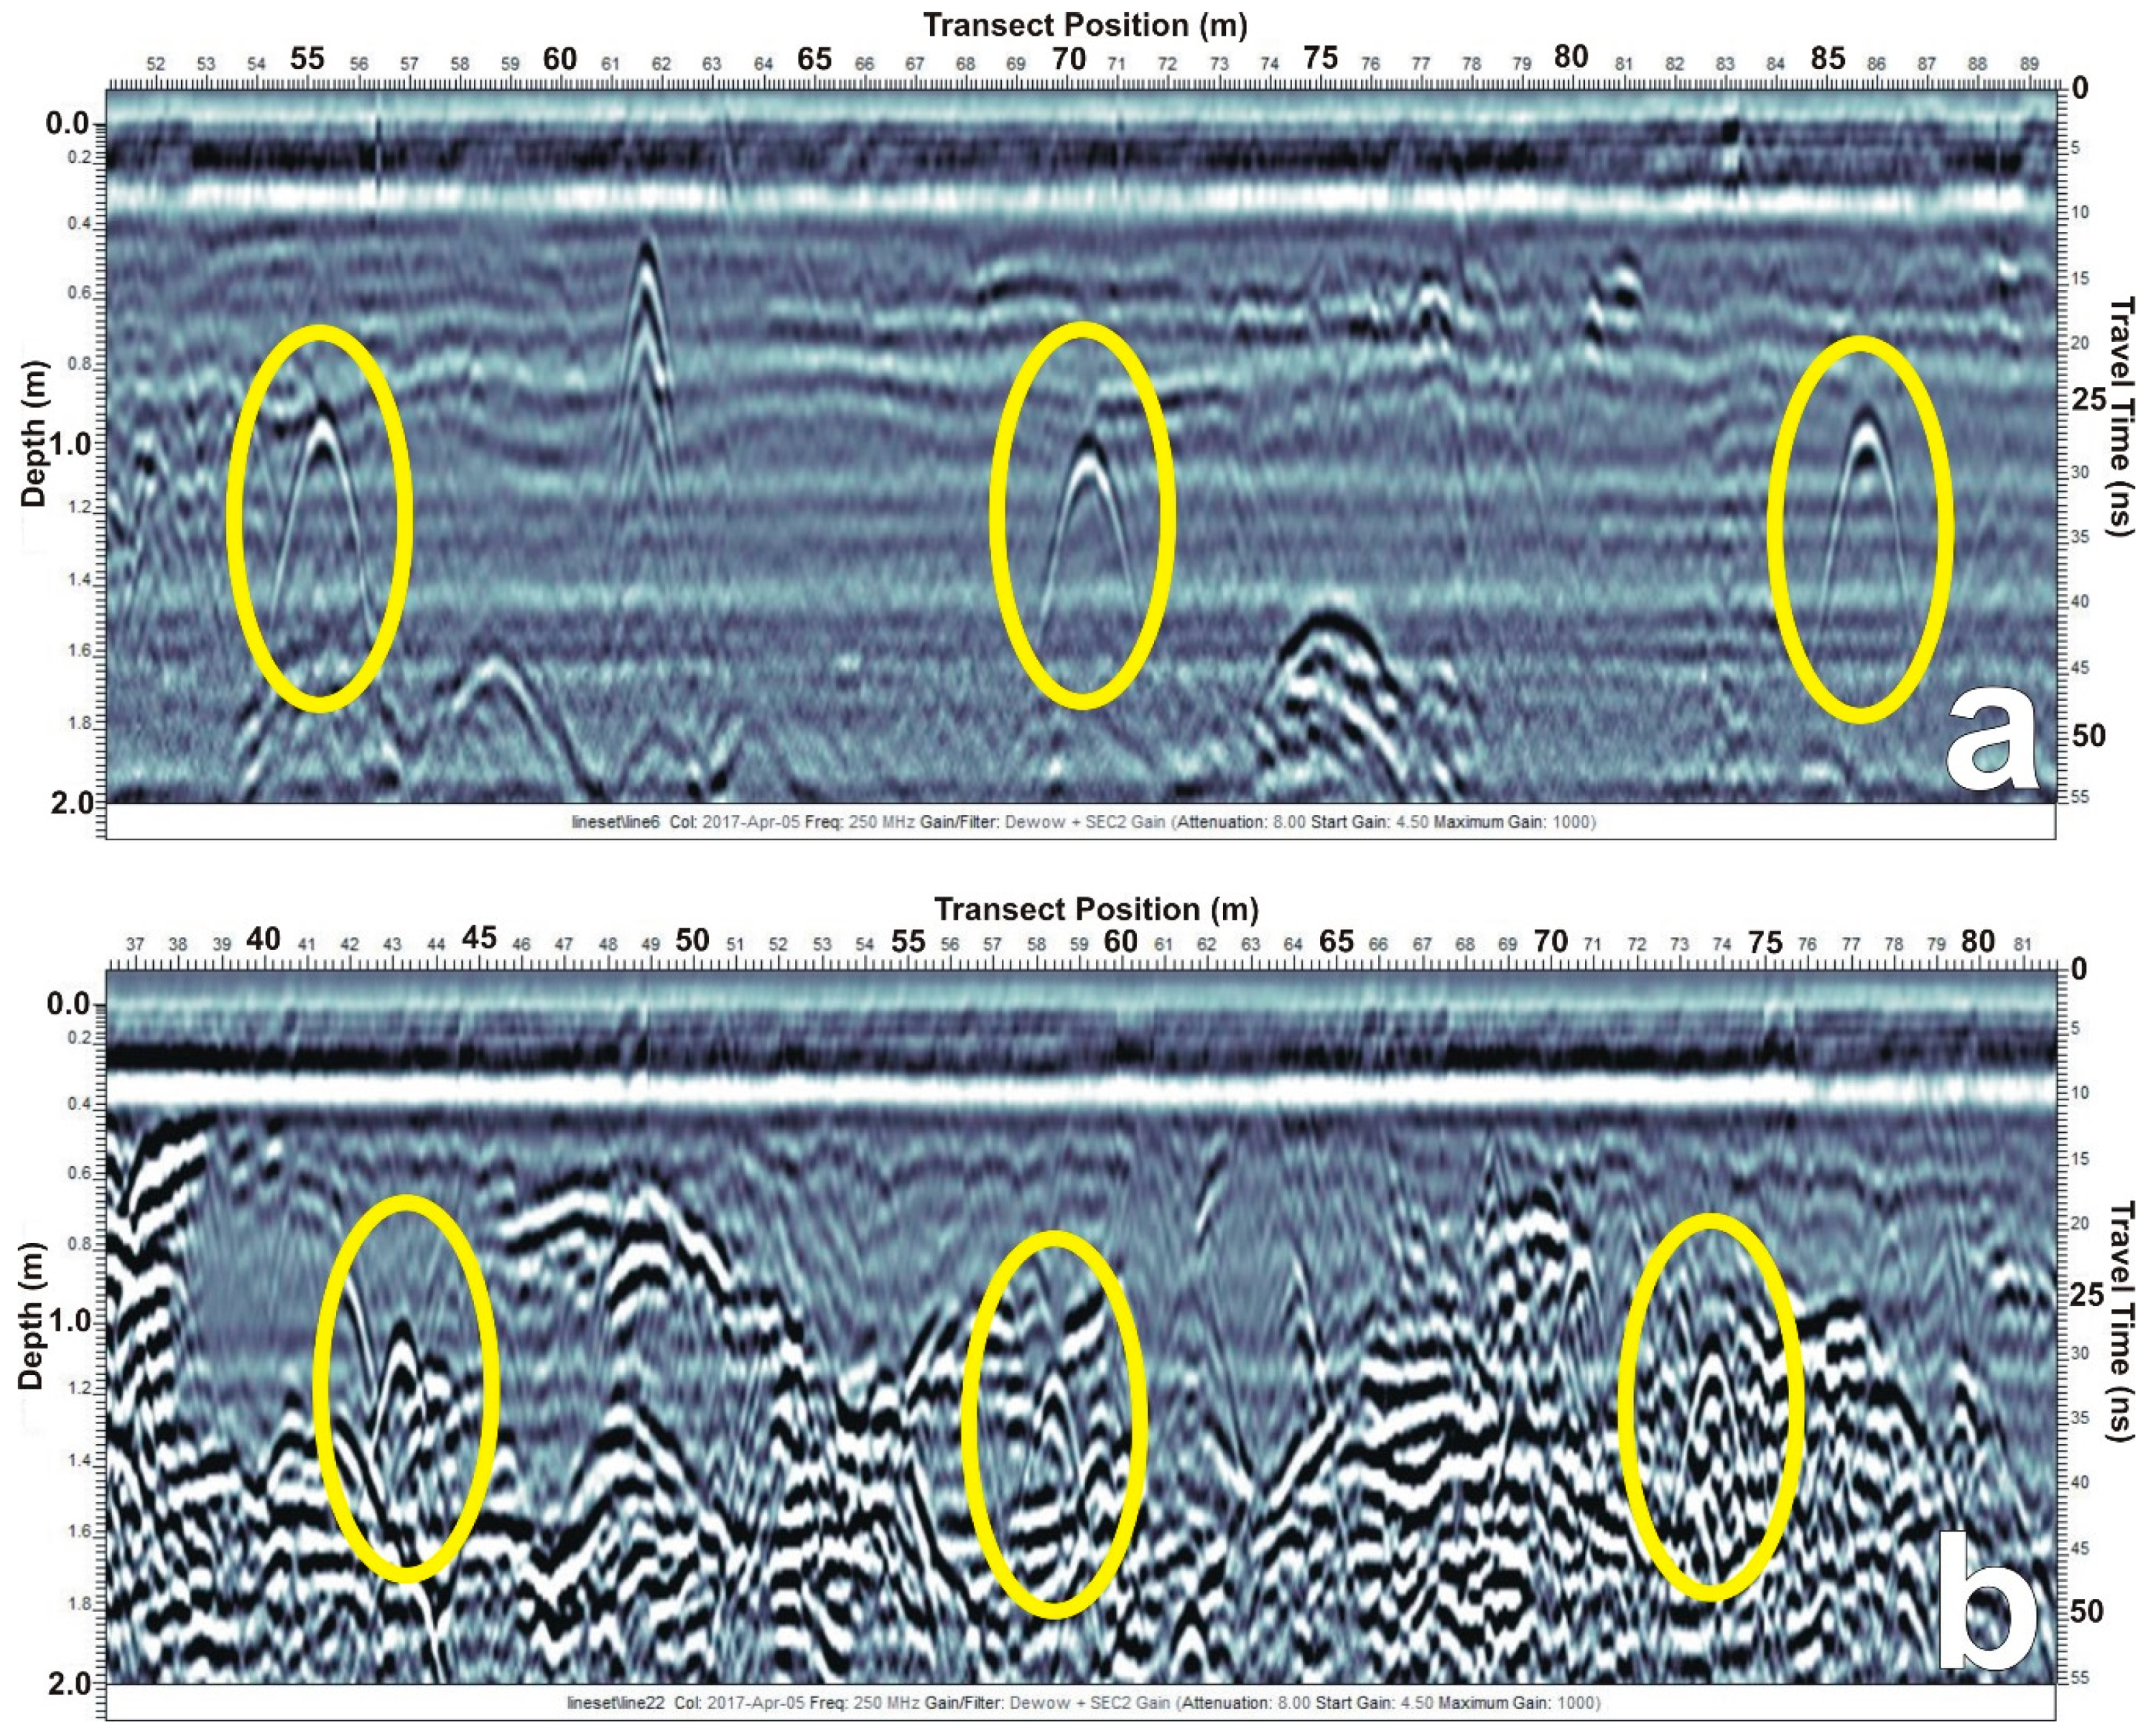
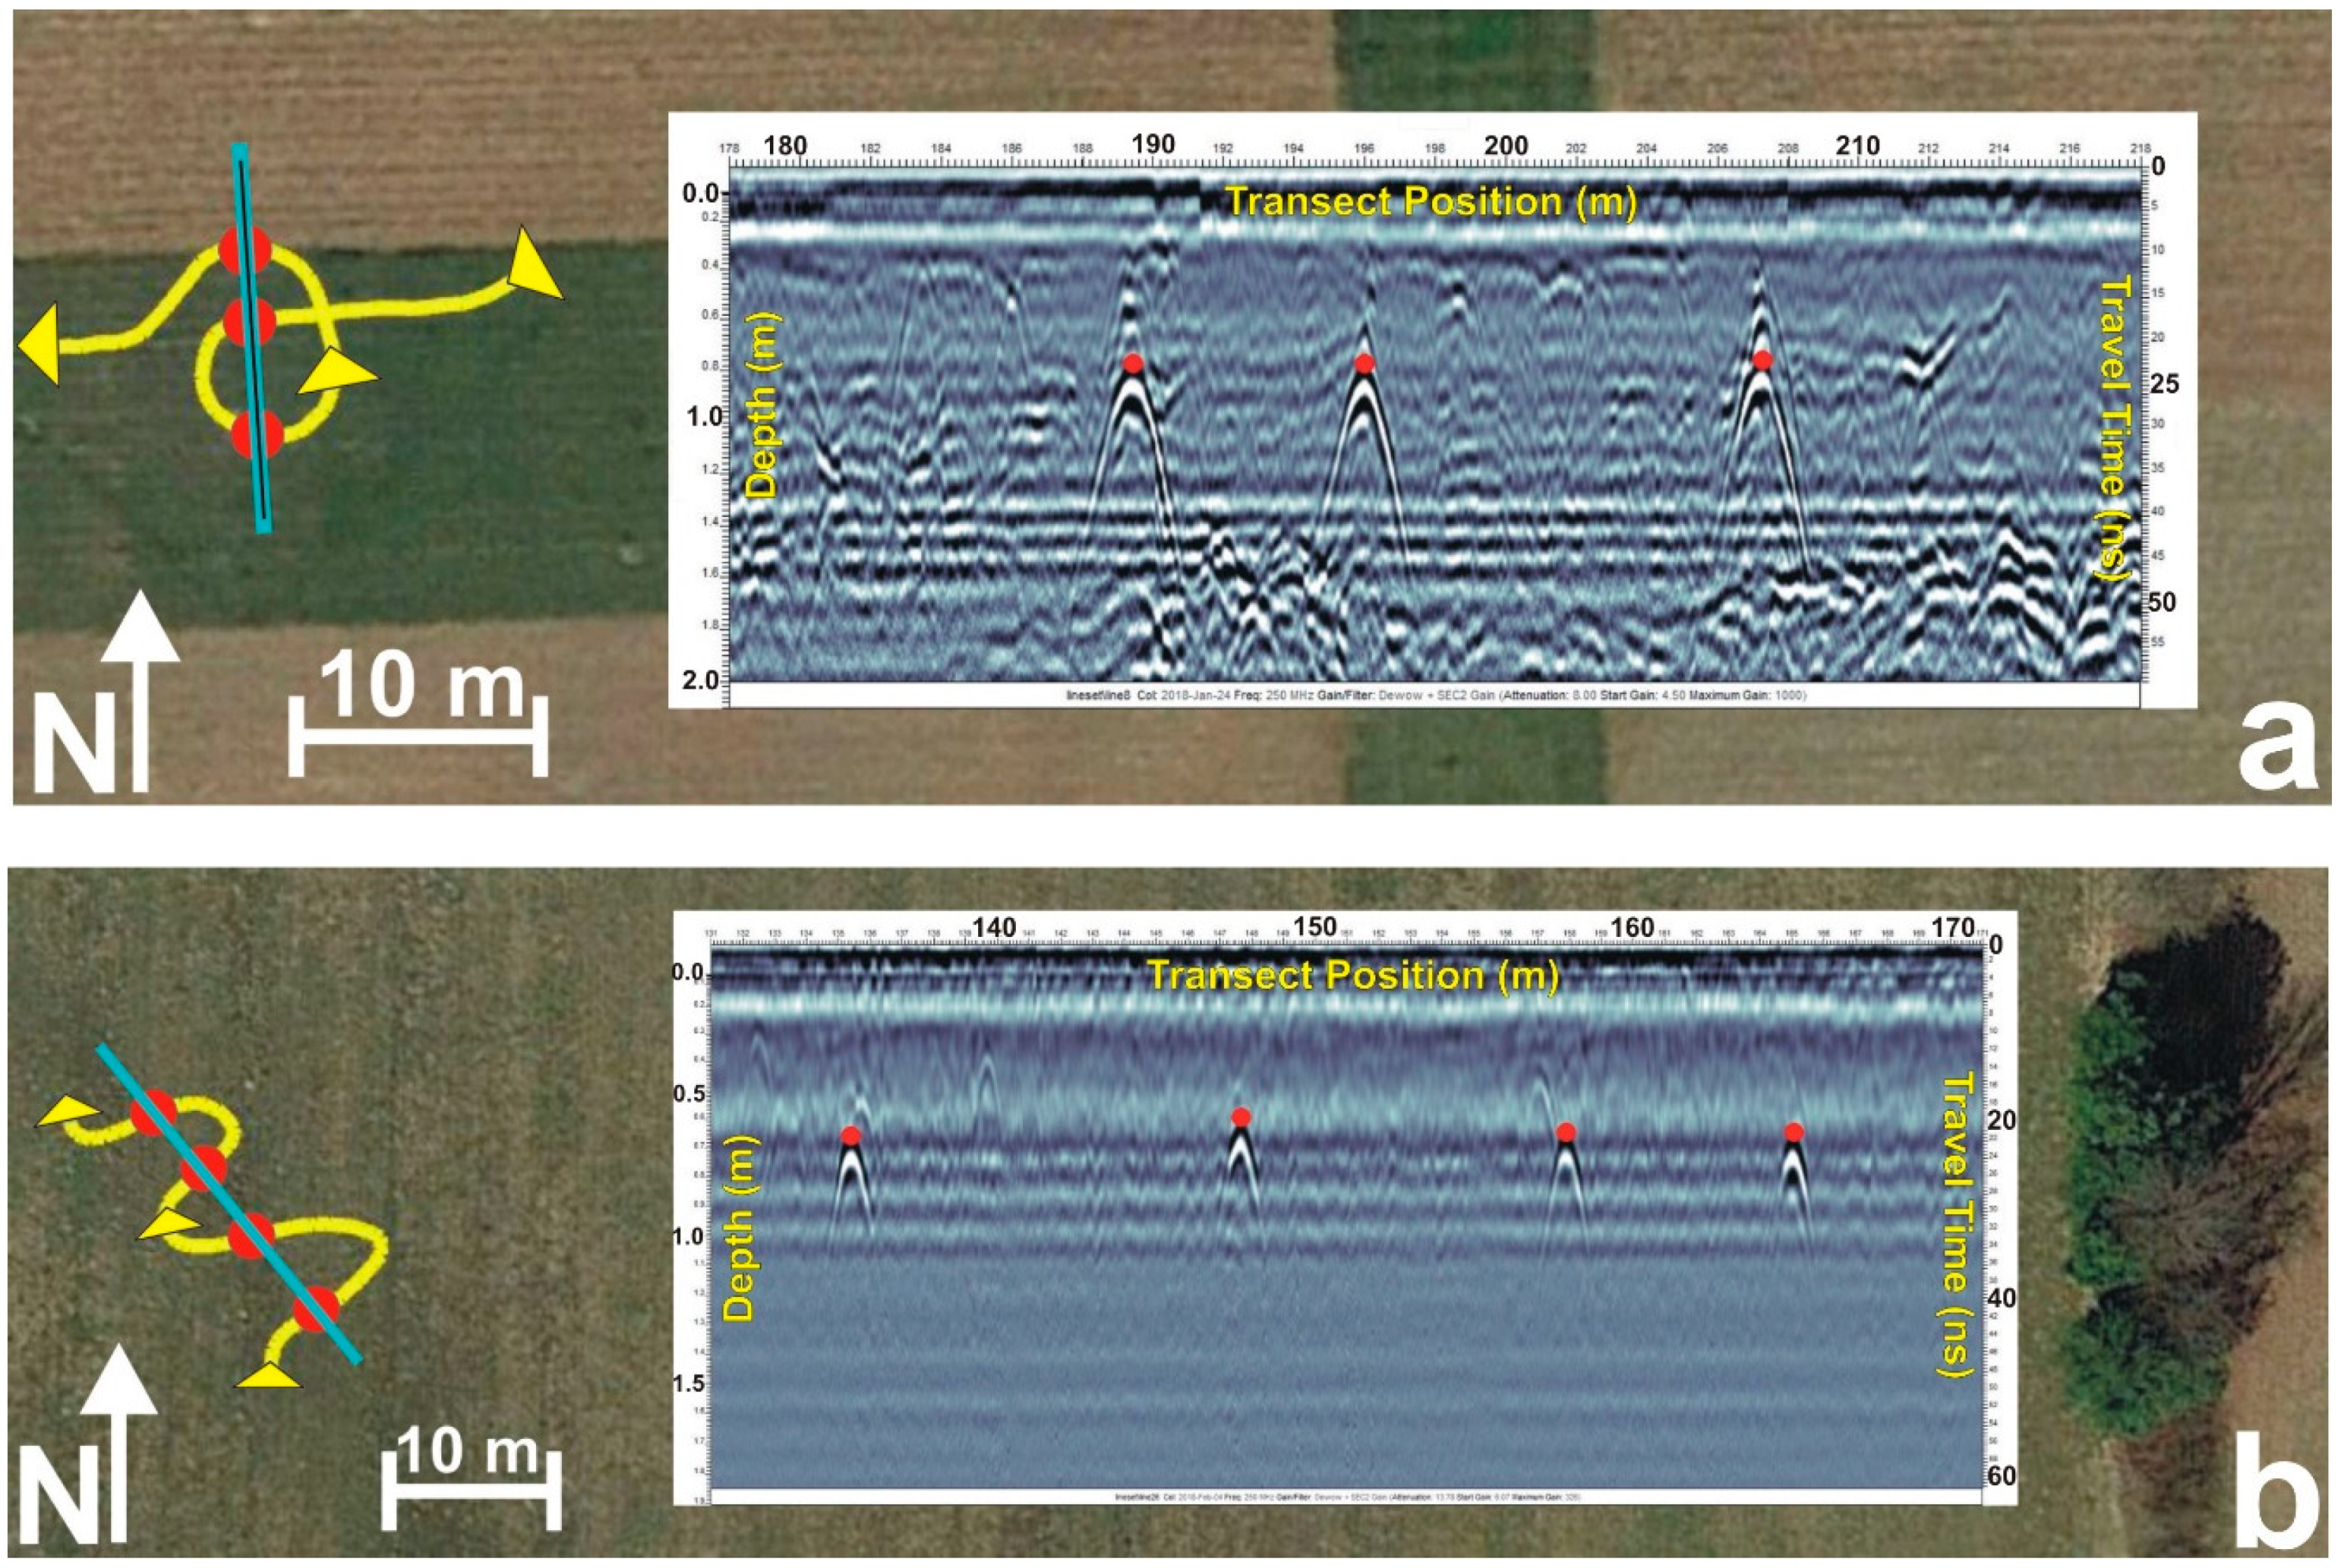
Figure 5 depicts the two types of GPR profile drainage pipe responses. Where there is a somewhat modest to large angle (i.e., 15° < x° < 90°) between the GPR transect orientation and drain line directional trend, the GPR response is that of an upside-down U-shaped feature (i.e., reflection hyperbola), and the position for the top of the drainage pipe corresponds with the apex of the reflection hyperbola (Figure 5a). The drainage pipe reflection hyperbola is horizontally compressed if the angle is closer to 90°, while alternatively, if the angle is closer to 15°, then the reflection hyperbola becomes spread out horizontally. It is important to note other buried features, such as large stones can produce a reflection hyperbola, but in map view, the location of these features are isolated, while mapped locations of actual drainage pipe reflection hyperbolas form a line. Where the GPR transect is essentially over top and along trend (x° < 15°) of a drain line, the GPR response formed is that a banded linear feature, with the position for the top of the drainage pipe corresponding to the top of the banded linear feature (Figure 5b). Obtaining the banded linear GPR drainage pipe response is fairly uncommon because this response requires, without any prior knowledge of drain line locations and directional trends, that a GPR transect just happens to be oriented over the top and along the trend of a drain line.
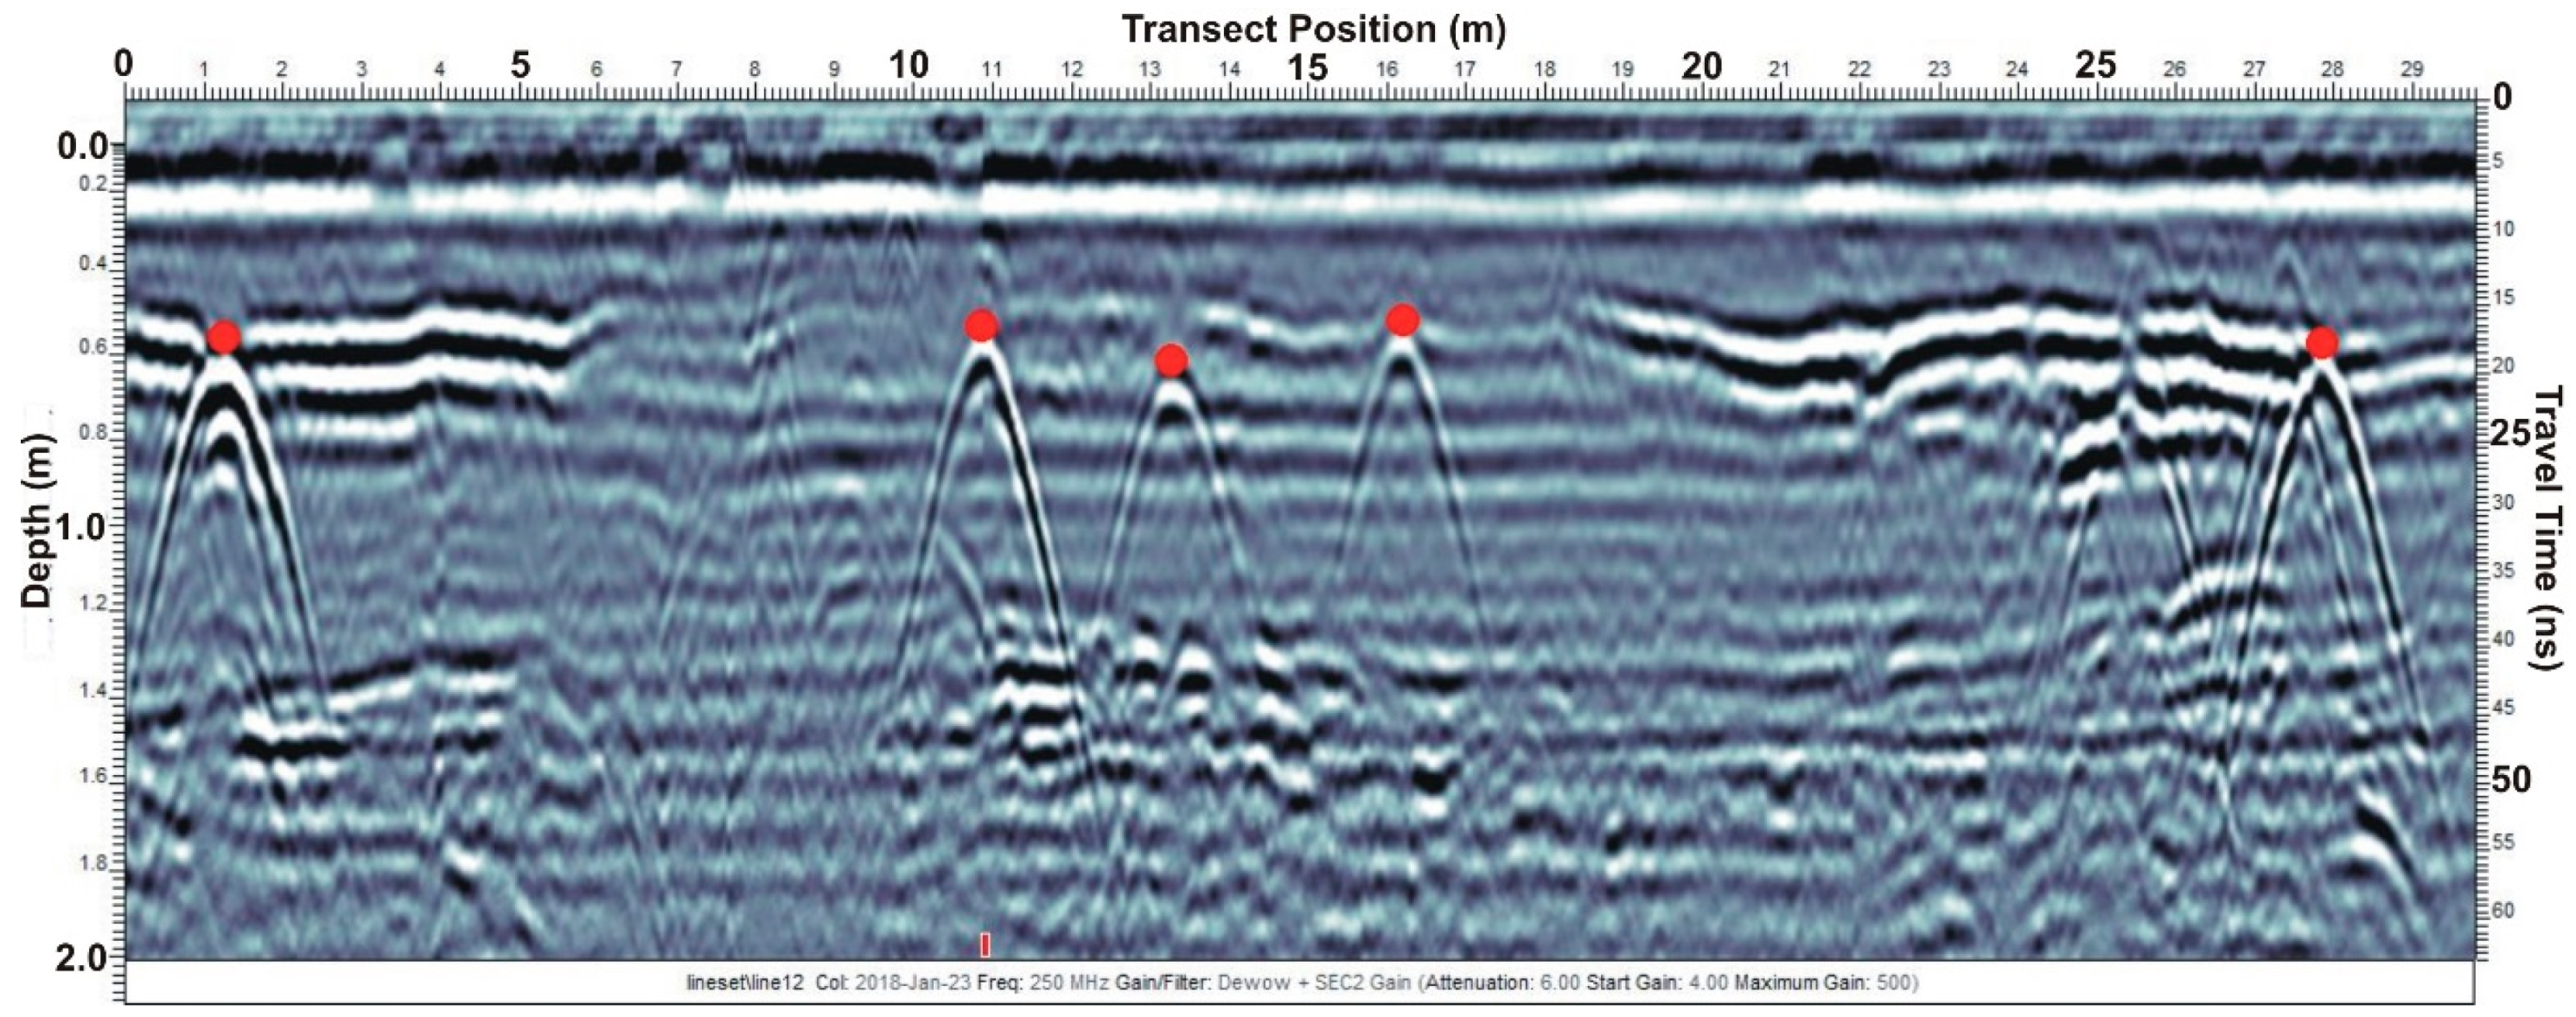
EKKO Project 5 software (Sensors & Software Inc., Mississagua, ON, Canada) was used to process and interpret the GPR-RTK/GNSS data acquired at Sites 1, 2, and 3, starting with the generation of GPR profiles from the GPR measurement transects. EKKO Project 5 reflection hyperbola curve fitting procedures, employed only in cases where the GPR transect was perpendicular to the drain line directional trend, allowed soil radar velocities to be refined at each site (from the original TDR measurements), and in turn, improve the accuracy of GPR profile depth scales. Soil radar velocities, refined via EKKO Project 5, were 0.072 m/ns on 5 April 2017 and 0.063 m/ns on 24 January 2018 at Site 1, 0.067 m/ns on 25 January 2018 at Site 2, and 0.060 m/ns on both 6 November 2017 and 5 February 2018 at Site 3. The only processing steps used to produce GPR profiles via EKKO Project 5 were (1) application of a signal saturation correction filter (i.e., Dewow) to remove slowly decaying low frequency noise and (2) utilization of a spreading and exponential calibrated compensation gain function to amplify potential GPR drainage pipe responses. An interpretation module in EKKO Project 5 allowed potential drainage pipe responses in a GPR profile to be marked (Figure 6). With GPR and RTK/GNSS data collected together, EKKO Project 5 was then employed to save a spreadsheet file of the latitudes, longitudes, and depths corresponding to the marked potential drainage pipe responses. Furthermore, because GPR and RTK/GNSS data were collected concurrently, EKKO Project 5 was then able to generate a KMZ file that stored a site map of the GPR transects along with the marked potential drainage pipe locations. Opening this KMZ file in Google Earth allowed GPR measurement transects and the possible pipe locations to be overlaid on an aerial image.

3. Results

Locations on GPR transects where potential buried drainage pipes were detected are shown (with red dots) in Figure 7. At Site 1, to the west of the white dashed line in Figure 7a, the overall soil profile had a relatively homogeneous appearance regarding GPR response (as exhibited in GPR profiles). Conversely, to the east of the dashed line, the overall soil profile had a far more heterogeneous appearance regarding GPR response. The overall GPR appearance of the soil profile (i.e., homogeneous vs. heterogeneous) definitely impacted Site 1 drainage pipe detection. In the more homogeneous soils on the west side of Site 1, reflection hyperbola potential drainage pipe responses were fairly easy to isolate within GPR profiles (Figure 8a), while in the more heterogeneous soils on the east side of Site 1, isolating the reflection hyperbola potential drainage pipe responses from the surrounding clutter was much more difficult (Figure 8b).
Drain lines were interpreted to exist in places where mapped locations of potential drainage pipe responses clearly followed a line. Again, a potential drainage pipe location that is isolated likely implies that the corresponding GPR profile reflection hyperbola response is not due to a drainage pipe, but rather some solitary buried object, such as a large stone. The interpreted drain line patterns (blue lines) are depicted in Figure 9 for all three sites. The GPR-RTK/GNSS data collected in this study delineated a complex rectangular drainage pipe system at Site 1 (Figure 9a), with a set of southwest-northeast drain lines present on the west side of the site and a southeast-northwest drain line set present on the east side of the site. Figure 9b indicates that although not all the drainage pipe present at Site 2 was detected, GPR integrated with RTK/GNSS did find a sufficient number of drain lines to unambiguously determine that a herringbone subsurface drainage system had been installed within this agricultural field. Random drain lines were found at Site 3 (Figure 9c), which are likely to be very old and installed for the purpose of draining wet areas in the hay field.

4. Discussion

At Site 1, GPR profiles (Figure 8) showed soils to the west of the white dashed line in Figure 7a to have a relatively homogeneous GPR response, while soils to the east of the white dashed line exhibited a far more homogeneous GPR response. Prior research [5] has shown that fine-textured silty/clayey soils tend to have a homogeneous appearance in GPR profiles, while coarse-textured sandy soils tend to have a more heterogeneous, or cluttered, appearance in GPR profiles. This finding could indicate for Site 1 that there were generally fine-textured silty/clayey soils west of the white dashed line in Figure 7a and generally coarse-textured sandy soils east of the white dashed line. Textural analysis of soil cores obtained across Site 1 will be required in order to confirm this supposition.
When GPR is integrated with RTK/GNSS, spiral or serpentine GPR transects, or spiral/serpentine segments of GPR transects, can be employed where needed to determine drain line directional trends. Initial linear GPR transects at Site 1 clearly indicated, just by themselves, based on DVL potential pipe locations flagged in the field, the drain line directional trends; therefore, spiral/serpentine GPR transects or spiral/serpentine segments of GPR transects were not needed to establish drain line patterns at this site. While not required at Site 1 to determine drain line patterns, spiral or serpentine GPR transects (or spiral/serpentine segments of a GPR transects) did provide valuable insight on drain line directional trends at Sites 2 and 3. Figure 10 provides clear examples from Sites 2 and 3 as to how spiral/serpentine GPR transect segments were employed to determine the direction of an agricultural field drain line. It is readily apparent that the drain line patterns at Sites 2 and 3 would have been almost impossible to discern without the integration of GPR with RTK/GNSS and the use of spiral/serpentine GPR transects or spiral/serpentine segments of GPR transects.
Field data collection using GPR integrated with RTK/GNSS to map subsurface drainage was quite efficient, requiring only four to six hours at each of the three sites. This study shows that a dense grid of GPR transects is not needed to determine drainage pipe patterns. Actually, all that is required in a particular agricultural field to find drain lines and determine their directional trends are a few select GPR transects (usually with incorporated spiral/serpentine segments). The efficiency of GPR-RTK/GNSS for subsurface drainage mapping could be improved further over what was obtained in this investigation by using an all-terrain vehicle (ATV) pulling a sled to mount all the GPR and RTK/GNSS equipment instead of mounting the equipment on the push cart shown in Figure 3a,c.
The GPR-RTK/GNSS drainage pipe mapping approach described is applicable for mapping subsurface drainage systems in agricultural fields up to tens of hectares in size. With suitable soil/hydrologic conditions and widespread adoption of this approach over large areas, it might be possible to gain insight on drainage practice intensity at small watershed scales. As indicated, the types of soils present can be important. Soils having very high clay contents oftentimes, but not always, severely limit radar signal penetration into the subsurface, thereby making GPR drainage pipe detection difficult [4,5]. Transient shallow hydrologic conditions also have a substantial impact. Soils that are not too dry or too wet are best for GPR drainage pipe detection, especially good are moist soils surrounding air-filled drainage pipes, which is a common situation occurring a day or more after a large rainfall event [5].
The integration of GPR with RTK/GNSS can therefore be a valuable tool for determining drainage pipe patterns in agricultural fields. The subsurface drainage system information obtained by GPR-RTK/GNSS could be very useful for retrofitting a subsurface drainage system for subirrigation or to improve soil water removal efficiency, with both scenarios requiring installation of new drain lines in between pre-existing drain lines [12,13,14], which in turn cannot be accomplished without knowing where the preexisting drain lines are located. Knowledge of drain line patterns obtained via GPR-RTK/GNSS could also be used for repairing part of a subsurface drainage system that is not functioning properly. Finding drainage pipes with GPR-RTK/GNSS is certainly an improvement over tile probe and trench excavation methods, because GPR-RTK/GNSS field data collection, compared to these other two methods, is much faster, is better at determining drain line directional trends, and causes no pipe damage. Consequently, in areas where GPR is capable of detecting buried drainage pipes, GPR-RTK/GNSS can supplant tile probe and trench excavation methods for mapping drain line patterns.

5. Summary and Conclusions

Ground penetrating radar integrated with a Real-Time Kinematic (RTK) Global Navigation Satellite System (GPR-RTK/GNSS) successfully determined drainage pipe patterns at three agricultural field sites. At one site, a rectangular pattern of drain lines was mapped, at the second site, a herringbone pattern was delineated, and at the third site, random drain lines were found. A novel field data collection approach was developed, taking advantage of GPR-RTK/GNSS, by which spiral or serpentine GPR measurement transects (or spiral/serpentine segments of GPR measurement transects) were employed to establish the presence and direction of drain lines. Using GPR-RTK/GNSS to map drain lines can therefore provide useful information needed for retrofitting or repair of agricultural subsurface drainage systems. Furthermore, in areas where GPR can detect drainage pipes, GPR-RTK/GNSS is a substantial improvement (faster, better able to resolve drain line trends, and causes no pipe damage) over the traditional tile probe and trench excavation methods for finding drainage pipes.

Author Contributions

Conceptualization, B.A., D.W., H.S., S.M., J.E.; Methodology, B.A., D.W., L.M.; Validation, B.A.; Formal Analysis, B.A.; Investigation, B.A., D.W., L.M., G.M.; Resources, H.S., S.M., J.E., C.C.; Writing-Original Draft Preparation, B.A.; Writing-Review & Editing, B.A., D.W., L.M., H.S., S.M., G.M., J.E., C.C.; Supervision, B.A.; Project Administration, B.A.

Funding

This research received no external funding.

Conflicts of Interest

The authors declare no conflict of interest.

Authors Note

The use of equipment manufacturer and software developer names in this article are provided solely for informational purposes and does not imply endorsement by the authors or the organizations they represent.

References

  1. Pavelis, G.A. Economic survey of farm drainage. In Farm Drainage in the United States: History, Status, and Prospects, Miscellaneous Publication Number 1455; Pavelis, G.A., Ed.; U.S. Dept. of Agriculture, Economic Research Service: Washington, DC, USA, 2007; pp. 110–136. [Google Scholar]
  2. Allred, B.; Eash, N.; Freeland, R.; Martinez, L.; Wishart, D. Effective and efficient agricultural drainage pipe mapping with UAS thermal infrared imagery: A case study. Agric. Water Manag. 2018, 197, 132–137. [Google Scholar] [CrossRef]
  3. Chow, T.L.; Rees, H.W. Identification of subsurface drain locations with ground-penetrating radar. Can. J. Soil Sci. 1989, 69, 223–234. [Google Scholar] [CrossRef]
  4. Allred, B.J.; Fausey, N.R.; Peters, L., Jr.; Chen, C.; Daniels, J.J.; Youn, H. Detection of buried agricultural drainage pipe with geophysical methods. Appl. Eng. Agric. 2004, 20, 307–318. [Google Scholar] [CrossRef]
  5. Allred, B.J.; Daniels, J.J.; Fausey, N.R.; Chen, C.; Peters, L., Jr.; Youn, H. Important considerations for locating buried agricultural drainage pipe using ground penetrating radar. Appl. Eng. Agric. 2005, 21, 71–87. [Google Scholar] [CrossRef]
  6. Allred, B.J.; Redman, D. Agricultural drainage pipe assessment using ground penetrating radar: Impact of pipe condition, shallow hydrology, and antenna characteristics. J. Environ. Eng. Geophys. 2010, 15, 119–134. [Google Scholar] [CrossRef]
  7. Allred, B.J. A GPR agricultural drainage pipe detection case study: Effects of antenna orientation relative to drainage pipe directional trend. J. Environ. Eng. Geophys. 2013, 18, 55–69. [Google Scholar] [CrossRef]
  8. ODOT’s VRS RTK Network. Available online: http://www.dot.state.oh.us/Divisions/Engineering/CaddMapping/Survey/Pages/VRSRTK-.aspx (accessed on 9 September 2018).
  9. Topp, G.C.; Davis, J.L.; Annan, A.P. Electromagnetic determination of soil water content—Measurements in coaxial transmission lines. Water Resour. Res. 1980, 16, 574–582. [Google Scholar] [CrossRef]
  10. Conyers, L.B. Ground-Penetrating Radar for Archaeology; AltaMira Press: Walnut Creek, CA, USA, 2004; pp. 23–80. [Google Scholar]
  11. Sharma, P.V. Environmental and Engineering Geophysics; Cambridge University Press: Cambridge, UK, 1997; pp. 309–328. [Google Scholar]
  12. Brown, L.A.; Zucker, L.A. Agricultural Drainage: Water Quality Impacts and Subsurface Drainage Studies in the Midwest; Extension Bulletin 871; The Ohio State University: Columbus, OH, USA, 1998; pp. 8–9. [Google Scholar]
  13. Allred, B.J.; Brown, L.C.; Fausey, N.R.; Cooper, R.L.; Clevenger, W.B.; Prill, G.L.; La Barge, G.A.; Thornton, C.; Riethman, D.T.; Chester, P.W.; et al. A water table management approach to enhance crop yields in a wetland reservoir subirrigation system. Appl. Eng. Agric. 2003, 19, 407–421. [Google Scholar] [CrossRef]
  14. Allred, B.J.; Gamble, D.L.; Clevenger, W.B.; LaBarge, G.A.; Prill, G.L.; Czartoski, B.J.; Fausey, N.R.; Brown, L.C. Crop yield summary for three wetland reservoir subirrigation systems in northwest Ohio. Appl. Eng. Agric. 2014, 30, 889–903. [Google Scholar]
Figure 1. Present methods for finding drainage pipes: (a) hand-held tile probe; (b) heavy trenching equipment with inset photo showing an example of the drainage pipe damage caused during this excavation operation.
Agriculture 08 00167 g001
Figure 2. Aerial images with soil map overlays of the three agricultural sites that were investigated with GPR-RTK/GNSS: (a) Site 1; (b) Site 2; (c) Site 3. Purple lines mark site boundaries.
Agriculture 08 00167 g002
Figure 3. Equipment used in investigation: (a) Noggin GPR system (250 MHz antennas) with GNSS FC-200 rover receiver; (b) GNSS HiPer XT base station receiver; (c) Noggin GPR system (250 MHz antennas) with GNSS GRS-1 rover receiver and PG-S1 hand-held controller; (d) Field Scout TDR-300.
Agriculture 08 00167 g003
Figure 4. GPR measurement transects (yellow lines) and locations of physical RTK/GNSS base stations (orange squares): (a) Site 1; (b) Site 2; (c) Site 3.
Agriculture 08 00167 g004
Figure 5. GPR profile drainage pipe responses; (a) horizontally compressed upside down U-shaped feature (i.e., reflection hyperbola) within yellow line oval results from the GPR transect being oriented perpendicular to drain line directional trend (from Site 1); (b) the banded linear feature within the yellow line oval results from the GPR transect being oriented the over top and along the trend of a drain line (from Site 3).
Agriculture 08 00167 g005
Figure 6. GPR profile from Site 1 with potential reflection hyperbola drainage pipe responses marked via EKKO Project 5. Because GPR and RTK/GNSS data are collected concurrently, the latitude, longitude, and depth corresponding to a potential drainage pipe response mark (red dot) could then all be saved (via EKKO Project 5) into spreadsheet and KMZ files.
Agriculture 08 00167 g006
Figure 7. GPR measurement transects (yellow lines) and potential drainage pipe locations (red dots): (a) Site 1; (b) Site 2; (c) Site 3.
Agriculture 08 00167 g007aAgriculture 08 00167 g007b
Figure 8. GPR profiles showing reflection hyperbola potential drainage pipe responses highlighted by yellow line ovals; (a) homogeneous soils on west side of Site 1; (b) heterogeneous soils on east side of Site 1. The reflection hyperbola potential drainage pipe responses are far easier to discern in the homogeneous soils as opposed to the heterogeneous soils.
Agriculture 08 00167 g008
Figure 9. Interpreted drain line patterns (blue lines) overlaid on GPR measurement transects (yellow lines) and potential drainage pipe locations (red dots): (a) Site 1; (b) Site 2; and (c) Site 3. A thin black line within a thicker blue line indicates a main collector pipe.
Agriculture 08 00167 g009
Figure 10. Spiral/serpentine segments of a GPR transect can be employed to determine drain line presence and direction: (a) spiral transect segment example from Site 2 (main collector pipe); (b) serpentine transect segment example from Site 3. Drainage pipe reflection hyperbolas interpreted with EKKO Project 5 (red dots on GPR profile insets) were mapped (red dots) along with transect segments paths (yellow lines with directional arrowheads). The mapped drainage pipe locations are in a line, thereby indicating the presence and direction of a buried agricultural drain line.
Agriculture 08 00167 g010

