1. Introduction
Due to animal welfare concerns, the restricted movement of sows during their time in the farrowing crate has been intensively discussed in Germany and other countries. In accordance with European legislation, isolated confinement during lactation is still permitted, and single pens with farrowing crates is the most common system used today.
However, farrowing systems with no or only temporary confinement of sows have been shown to be beneficial for sows, whereas the benefits for piglets with regard to crushing is still a subject of controversy [
1,
2]. Besides the benefits regarding animal welfare, whether these free systems have any effect on hygiene status is of importance to the scientific field of animal hygiene. As air contaminants such as dust, airborne bacteria, and odorous compounds can negatively affect the health status of animals and workers [
3,
4], this issue is relevant to both animal health, and occupational health and safety. However, to date, the effects of different housing systems of livestock on air quality in general have not been the focus of many studies. It is known that management procedures, such as the type and method of feeding or bedding material, as well as the activity of the animals have an influence on the concentration of dust and harmful gases [
3,
5]. In our case, the increased movement activity, which is desired from an animal welfare point-of-view, could particularly impact air quality in new housing systems. [
5]. The same can also be expected from the floor type of the group system, because the tested group system has a high proportion of concrete slatted floors in order to increase movement safety and has cast-iron slats due to higher load. Increased dust concentration has effects on aerogenic bacteria because these are associated with dust particles, forming a biologically active aerosol [
4]. Ammonia can be produced in any housing system, but especially in systems where the design does not allow separation of functional areas and thus makes manure removal more difficult [
6].
Negative effects might also come from dust originating mainly from dried feces, skin, and feed [
6,
7,
8,
9,
10,
11,
12]. The most often-examined non-bacterial contaminants of air are dust and gaseous ammonia. However, the findings of these investigations, with regard to the effective levels of harmful concentrations, the health consequences, and the causes of the formation of dust and ammonia are heterogeneous, as recently shown by Michiels et al. [
13]. However, one clear result is that dust and gaseous ammonia have adverse effects on mucous membranes at the beginning of exposure. Nonetheless, it has been observed that these symptoms diminish during the course of exposure [
14,
15,
16,
17]. In addition to health effects, previous studies revealed that pigs prefer clean air as opposed to ammoniated air [
18,
19,
20,
21], which could lead to fighting about coveted places in group systems with a hierarchical social structure. This could be aggravated by the finding that raised levels of ammonia (~20.0 ppm) can make pigs more aggressive and less tolerant to conspecifics [
22]. Studies have found correlations between dust or ammonia concentrations and the state of health or the performance of livestock [
23,
24,
25]. Although there are still some uncertainties about the negative health consequences of airborne contaminants, new housing systems should be developed with a view to good air hygiene. The standard of air hygiene includes all measures to evaluate and improve air quality in the housing environment of animals, with air quality characterized by the main parameters of ammonia, carbon dioxide, hydrogen sulfide, and airborne particles, and bioaerosols like dust, endotoxins, bacteria, and fungi [
26]. Air hygiene depends on complex interactions between different factors, such as building design, animal management, and animal behavior [
26]. Therefore, the aim of this study was to provide insights into air hygiene of free-farrowing systems.
2. Materials and Methods
The study was carried out on the pig farm of the Landwirtschaftskammer Niedersachsen (Chamber of Agriculture, Lower Saxony, Germany) in Wehnen, Northern Germany, in a moderate maritime climate zone, between August 2016 and August 2017. The farm kept 80 reproductive sows of the db.Viktoria gene of the German Federal Hybrid Breeding Program (BHZP GmbH, Dahlenburg-Ellringen, Germany) and the farrowing was conducted in a five-week batch management system.
The farm building was an insulated brick house built in the 1980s. Three commercially available farrowing systems were installed for this trial: A group housing system (GH), a single loose-housing system (LH), and single pens with farrowing crates (FC) (Big Dutchman International GmbH, Vechta, Germany). Two rooms were each equipped with the respective systems, which were used alternately. The characteristics of each of the six rooms are shown in
Table 1.
2.1. Characteristics of the Farrowing Systems
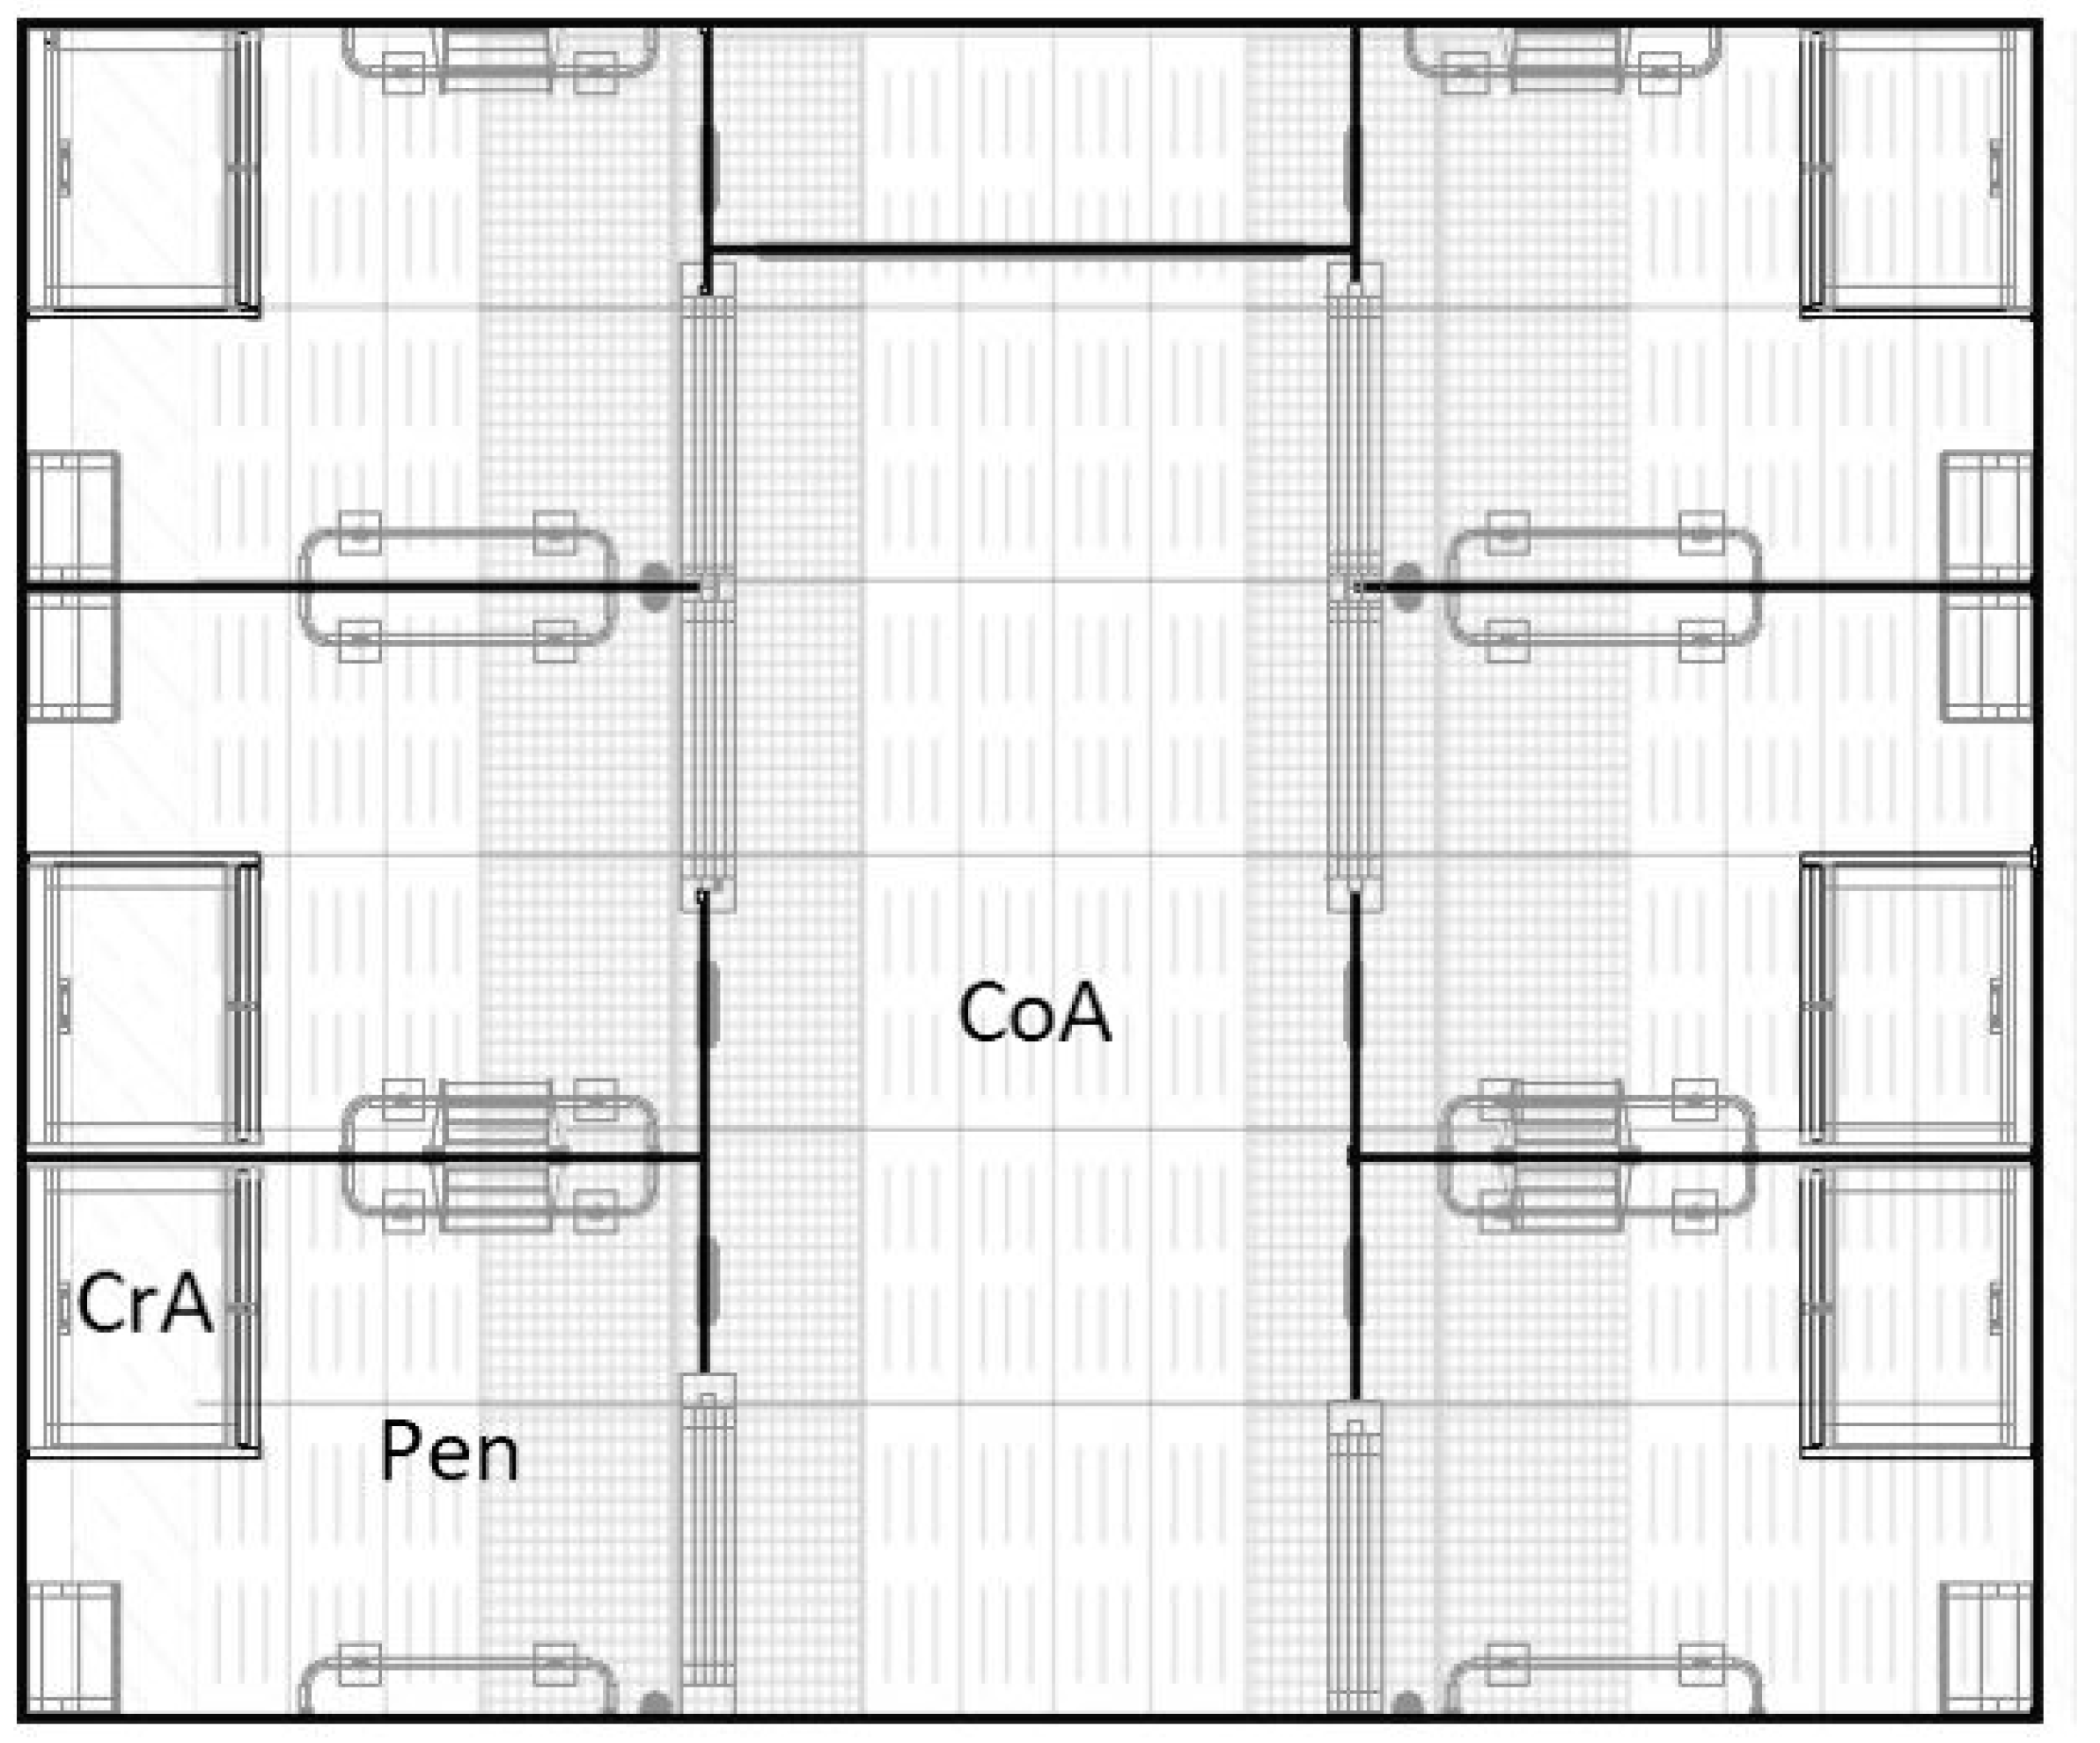
The GH system (
Figure 1) for six sows consisted of two lines of three single pens, each 202 cm × 245 cm, which were arranged opposite each other. The 610 cm × 235 cm group area was positioned between them. The totally slatted floor consisted of approximately three-fifths non-coated concrete (percentage of apertures to tread area = slat-rate 9.5%), and two-thirds coated cast-iron slats (slat-rate 43%). The group area was predominantly equipped with concrete slatted floors, and the individual pens predominantly with cast-iron slats. The 100 cm × 80 cm creep area was constructed as a largely closed box with two entrances, and was positioned in the corner of every pen. Each creep area was heated by one infrared lamp (CE-REX IRX 300, Rexlan Europe, Sorø, Denmark) with a maximum output of 270 W/h. The floor in the creep area consisted of rubber mats. Each pen provided troughs and drinkers for sows and piglets installed at a wall. All sidewalls were equipped with piglet protection bars (where possible). A part of the group area at the front end was separated for the piglets by a piglet access door. Sows in GH were never confined. They were separated in the pens for 24 h after moving to the farrowing house. During the following 48 h, the pens were opened, and the sows could enter the group area to establish their hierarchy. During birth, the sows were separated again. Five days after the last litter had been born, the sows and piglets were allowed to use all areas.
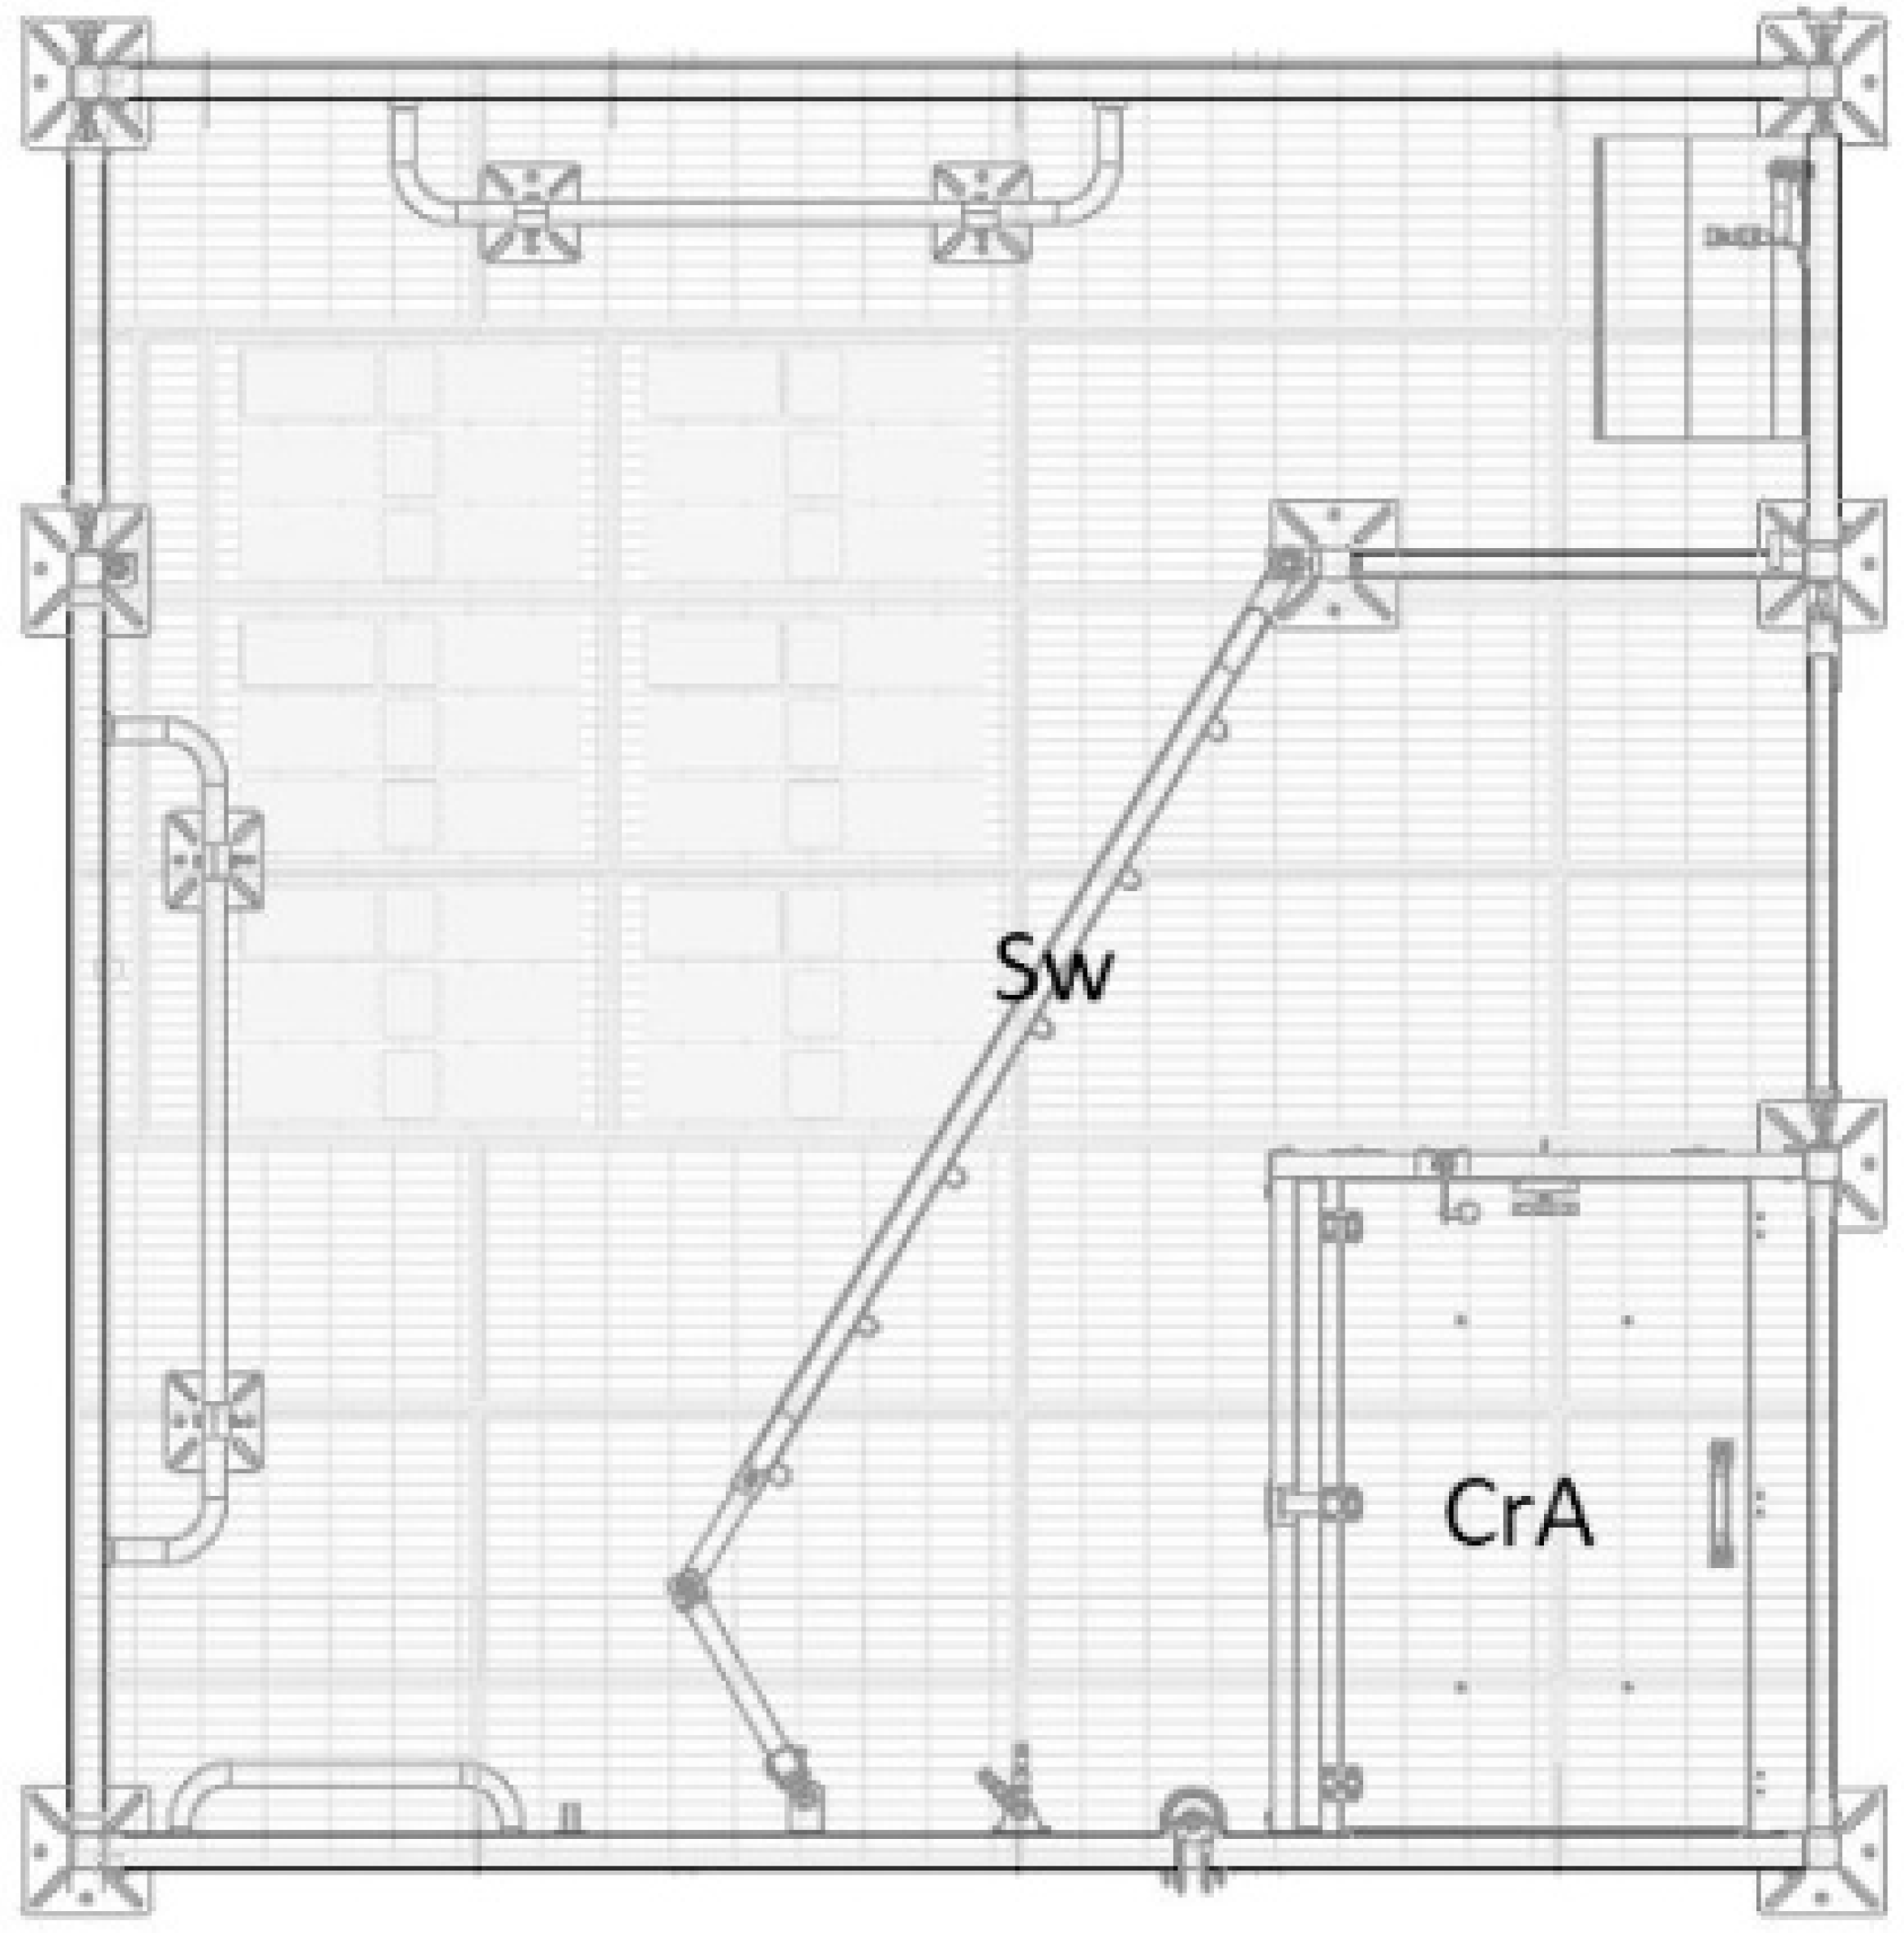
The LH pens (
Figure 2) for single housing had a fully slatted plastic floor (slat-rate 41%), and the size of the pens measured 270 cm × 270 cm and 267 cm × 264 cm, respectively. The floor in the middle of the pen (approximately 130 cm × 110 cm), the estimated lying area of the sow, had a lower slat rate of 7% to increase the lying comfort and movement safety. The creep area was the same as in GH and positioned in the corner of the pen. Piglet protection bars were placed on all sidewalls. The troughs and drinkers for the sow and piglets were installed at a side wall. The sows were not confined at any time.
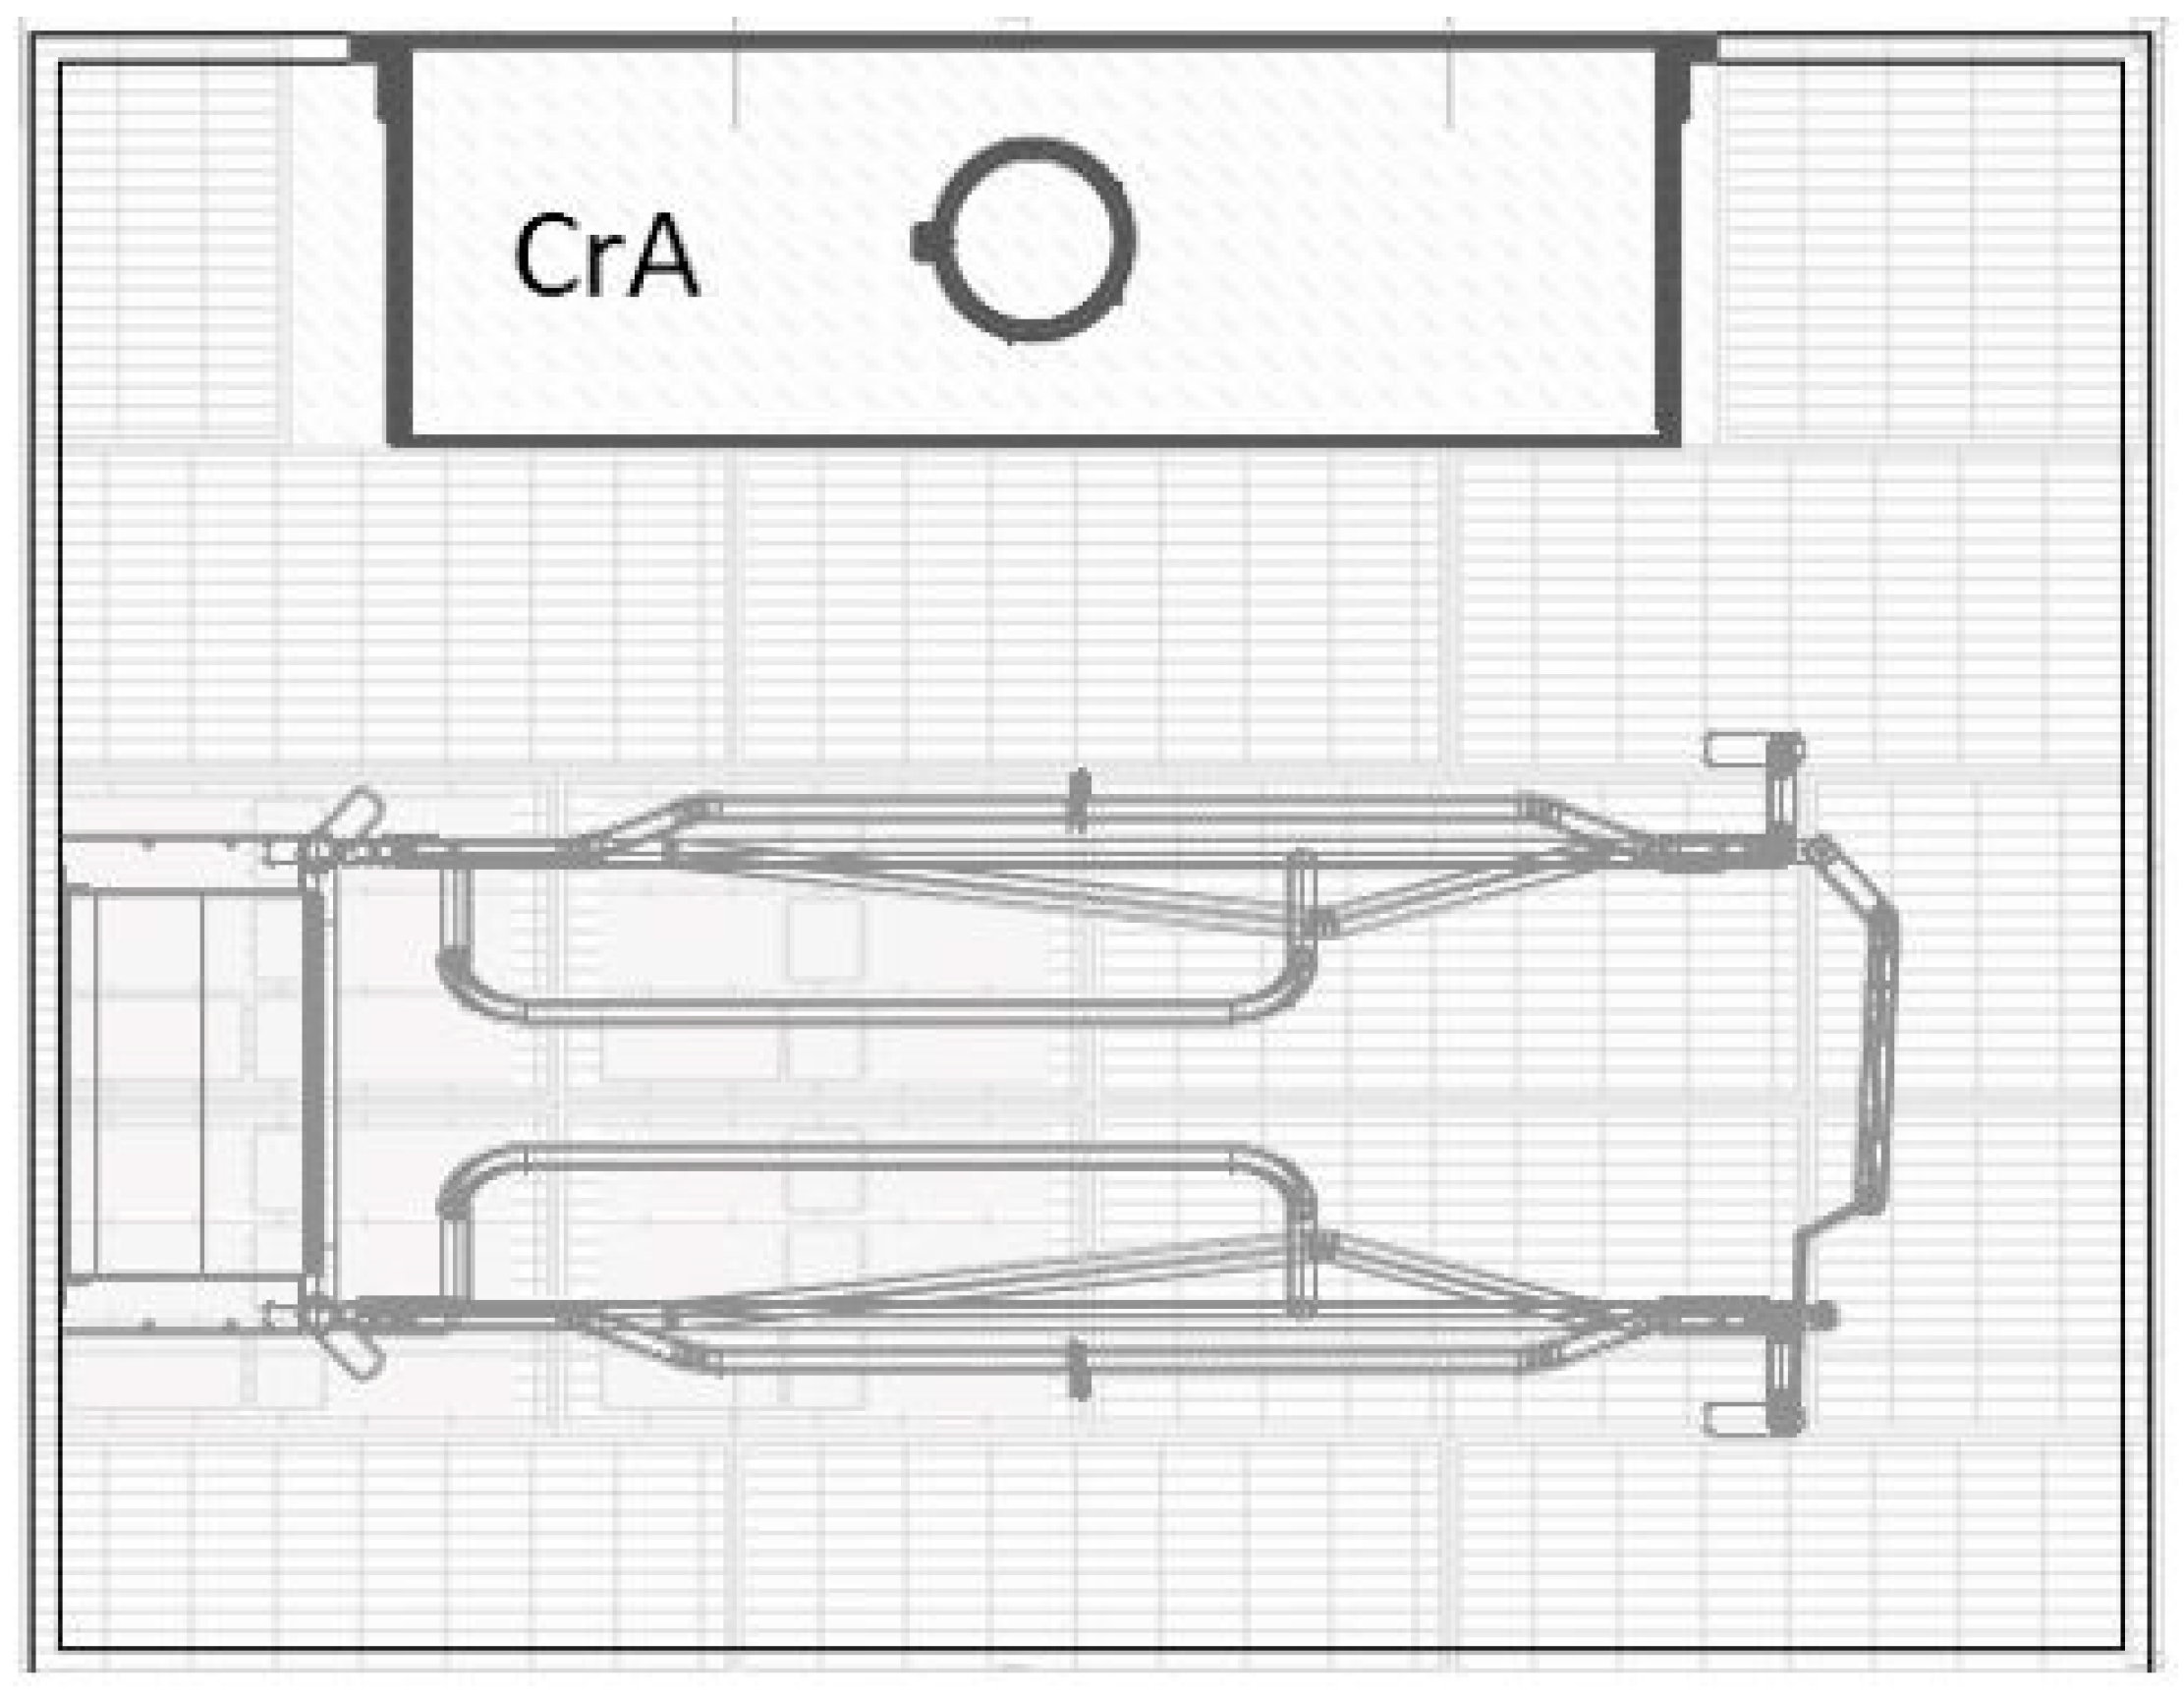
In FC (
Figure 3), the fully slatted floor was made of plastic (slat-rate 41%) and each pen measured 260 cm × 200 cm. Like in LH, the floor in the lying area (approximately 120 cm × 80 cm) had a lower slat rate of 7%. The 190 cm × 80 cm farrowing crate was made of metal and was positioned in the center with a trough at the front end. The 160 cm × 50 cm creep area was positioned at a side wall and was open at three sides. It was heated by one heating lamp (different manufacturers, output: 150 W), positioned above the center of the creep area, and heating plates were made of polymer concrete (Big Dutchman).
2.2. Management and Hygiene Routines
The target temperatures of the creep area were between 36 °C and 39 °C, depending on the age of the piglets (in all systems). Sows were confined in the system with farrowing crates all the time. Aside from the other systems, eight pens were provided for the sows in FC.
The rooms were cleaned with a pressure washer and disinfected with an appropriate product (VennoVet 1%, Menno Chemie Vertrieb GmbH, Norderstedt, Germany) before the sows were housed.
All rooms were equipped with the same automatically adjusting air-ventilation system (Big Dutchman International GmbH) and centrally controlled, hot-water-based heating. The exhausted air was discharged through a centrally positioned chimney; fresh air came in naturally through controllable side vents.
In all systems, manure removal was ensured by a deep slurry pit underneath the slatted floors.
The sows entered the rooms a week before farrowing. Parturition was not induced, so the farrowing at around day seven took place with a deviation of up to two days. Primiparous and multiparous sows were allocated as equally as possible to each system.
The sows were fed with a dry standard food for lactating sows. In FC and LH, the feeding took place at 8:00 a.m. and 5:00 p.m.; in GH, there was an automatic feeding system.
Piglets were weaned on their 26th day of life, which was at day 33 after introducing the sows to the systems. The sows were moved to the gestation house on the same day.
In this study, eight batches were considered with, if feasible, six sows in each system in every batch. This target was realized in GH and LH in almost all batches, and deviated only in one batch in LH with five sows on day 19 and 33. In FC, the number of sows deviated in six batches from the target number of six sows. In three batches, the pens were occupied by five sows, and in three batches by eight.
2.3. Measurements
In each batch, measurements of temperature, humidity, dust-, endotoxin-, ammonia-, and carbon dioxide concentrations were performed at the beginning (day 5), in the middle (day 19), and at the end (day 33) of the occupancy period of 33 days (1 week antepartum to 4 weeks after farrowing).
For management reasons, it was not possible to collect animal weights on the same days, so that the sows were weighted with a TVW615 scale (T.E.L.L.-Steuerungssysteme GmbH & Co. KG, Verden, Germany) and piglets with an IP68 AGT scale (T.E.L.L.-Steuerungssysteme GmbH & Co. KG) as follows:
Sows: Day 1 (shortly before introduction to the systems, assigned to measurements of day 5); day 14 (assigned to measurements of day 19); day 33. Piglets: Day 21 (assigned to measurements of day 19) and day 33. There are no weights for the piglets for the first date, as they were not yet born. For the total animal weight, the weights of the sows and, where appropriate (measurements of day 19 and 33), the piglets were added (separated by room, day, and batch). The total animal weights assigned to measurements of day 5 and 33 are only available for 7, and assigned to day 19 only for five batches.
To analyze humidity and temperature in the rooms while sampling, a high-precision PCE-THB 40 device (PCE Deutschland GmbH, Meschede, Germany) was used. The outside temperatures were documented on each sampling date at the same location outside the barn before sampling (at 8:00 a.m.) with the same device. Also, the climate computer with the associated sensors (climate computer 135Pro, Big Dutchman), located in the respective rooms, recorded a measured value for indoor temperature and relative humidity every 2 min for the entire duration of the occupation period. To set these values in relation to our measurements, the data from the climate computer were used to calculate an average value for temperature and humidity over a period of 120 h before the measurements.
Samples for dust measurements, which were subsequently used for endotoxin screening, were collected by SKC Universal PCXR8 pumps (SKC Inc., Eighty Four, PA, USA), which ran for 24 h at a flow rate of 2.5 L/h
−1 (3.6 m
3 in total). The pumps were positioned in the middle of each system at a height of 1.2 m. Glass microfiber filters (Whatman PLC, Little Chalfont, UK) were used for collection. The filters were weighed before and after sampling. Therefore, the filters and the corresponding bracket were stored for conditioning for at least 24 h at 20 °C before weighing with a microbalance (Sartorius AG, Göttingen, Germany). The filters were converted into sterile glasses and subsequently tested for endotoxins by using the Limulus amebocyte lysate test, as follows: One filter with 10 mL of endotoxin-free water (Lonza Group Ltd., Basel, Switzerland) was extracted for 1 h at 20 °C with a shaking device in a vial and then centrifuged at 1000 ×
g for 10 min. From the supernatant, a dilution series was prepared, and the corresponding dilution was tested for endotoxins with the Limulus amebocyte lysate test (LAL test). The endotoxin content was determined in accordance with the method described in the BIA workbook (Arbeitsmappe für Biologische Arbeitsstoffe) [
27], using the Kinetic-QCL
TM Kinetic Chromogenic LAL Assay(Lonza Group Ltd., Basel, Switzerland). The used control standard endotoxin (FCE) was calibrated on the Reference Standard Endotoxin (RSE)
Escherichia coli-6 of the US Food and Drug Administration (FDA). The endotoxin activity was indicated in endotoxin units (EU).
Due to technical problems, some data for dust and endotoxins are missing (13 measurements in total), resulting in n = 59 samples in total.
To determine the carbon dioxide and ammonia levels in the air, colorimetric tubes (Dräger GmbH, Lübeck, Germany) were used. The measurements were performed at representative locations inside the rooms at approximately 40 cm above the slats (one measurement per room and day) between 10:00 a.m. and 12:00 am.
2.4. Statistics
All results were processed with Excel (Microsoft Corporation, Redmond, WA, USA) and statistically analyzed with SAS (SAS Institute Inc., Cary, NC, USA). To detect significant differences between the systems, multifactorial variance analyses by the GLM procedure were conducted for the following explanatory variables: Inside temperature (of punctual and 120 h-period measurements), inside humidity (of punctual and 120 h-period measurements), total animal weight, concentration of dust, the concentration of endotoxins, concentration of carbon dioxide, and concentration of ammonia. “Batch” and “system” were determined as classification variables. Regarding the subsequent post-hoc test, the Tukey correction mode was used. For the application of analysis, the data for dust had to be logarithmically transformed to a normalized distribution. The Spearman’s correlation was calculated for both dust and ammonia between the following parameters: Duration of occupancy, endotoxins, outside temperature, inside humidity, inside temperature, carbon dioxide, ammonia, inside temperature, and humidity within the 120 h-period before sampling, total animal weight, and between dust and ammonia. Statistical significance was considered to be when p < 0.05.
3. Results
Regarding temperature and humidity, 72 single values for inside temperature and relative humidity at the time of sampling and 72 mean values for inside temperature and humidity within a period of 120 h before sampling, and 24 single values for outside temperature were assessed. The means of these values for each system are given per sampling date in
Table 2. The minimum and maximum inside temperatures at the time of sampling were 17.8 °C and 24.1 °C in GH, 18.5 °C and 23.7 °C in LH, and 18.7 °C and 25.1 °C in FC, and the minimum and maximum inside temperatures within a 120 h-period prior to sampling were 20.4 °C and 25.5 °C in GH, 20.1 °C and 24.0 °C in LH, and 21.0 °C and 26.0 °C in FC, respectively. The relative inside humidity at the time of sampling showed minimum and maximum values in the single systems of 56.4% and 82.7% in GH, 56.8% and 83.4% in LH, and 53.0% and 79.7% in FC, and the minimum and maximum relative inside humidity within a 120 h-period prior to sampling were of 64.4% and 80.5% in GH, 58.3% and 85.1% in LH, and 58.4% and 73.1% in FC, respectively.
For all batches, the reference outside temperature was a minimum of −5.3 °C and a maximum of 16.5 °C on day 5, a minimum of −4.5 °C and a maximum of 14.7 °C on day 19, and 2.4 °C and 17.1 °C on day 33, respectively. Statistical analysis revealed no significant differences between the systems for inside temperature and inside humidity at the time of sampling, but inside temperatures within a 120 h-period before all three sampling dates were significantly lower in LH compared to GH (p < 0.05) and FC (p < 0.05). Moreover, the relative inside humidity within 120 h before day 19 was significantly higher in GH than in FC (p = 0.042).
Statistical analysis revealed no significant differences between the systems for total animal weight, even if FC continuously showed the higher values.
Means of samples of concentrations of airborne dust are shown in
Table 3. Lowest single values were 0.38 mg/m
3, 0.08 mg/m
3, and 0.15 mg/m
3, and maximum single values were 2.47 mg/m
3, 1.54 mg/m
3, and 1.63 mg/m
3 for GH, LH, and FC, respectively. On day 1, the airborne dust concentration was not higher in GH than in LH or FC. On day 19, GH showed significantly higher dust concentrations than LH (
p = 0.022) and FC (
p = 0.004). On day 33, the dust concentration was also highest in GH, but there were no significant differences detected between the systems. For all systems, the dust concentration was significantly lower on day 5 than on day 19 (day 5 vs. day 19: GH
p < 0.001; LH
p = 0.006; FC
p < 0.002). In GH and FC, concentrations of dust on day 5 were significantly lower compared to day 33 (day 5 vs. day 33: GH
p = 0.017, FC
p < 0.026).
Means of endotoxin samples are shown in
Table 3. Lowest single values were 15.0 EU/m
3 to 2847.0 EU/m
3 in GH, 5.0 EU/m
3 to 1495.0 EU/m
3 in LH, and 9.0 EU/m
3 to 14,720.0 EU/m
3 in FC. The highest mean values for endotoxins on each date were found in FC. Nevertheless, only on day 33 was this difference significant, compared to GH (
p = 0.011) and LH (
p = 0.007). Endotoxin concentration in LH was significantly lower on day 5 than on day 19 (
p = 0.029). The endotoxin concentration in batch 5 was extremely high in FC on day 19, possibly due to contamination of the sample. After removing this value from the dataset, the mean value was 1053.0 EU/m
3.
The means of carbon dioxide measurements are shown in
Table 3. Lowest single values were 400.0 ppm for all systems, and maximum single values were 2200.0 ppm in GH and LH, and 2100.0 ppm in FC. Significant differences in carbon dioxide concentration were neither detected between the systems on any date nor between the dates for each system.
The means of ammonia measurements are shown in
Table 3. Lowest single values were 5.0 ppm, 3.0 ppm, and 4.0 ppm, and maximum single values were 33.0 ppm, 28.0 ppm, and 23.0 ppm in GH, LH, and FC, respectively. The ammonia concentration was significantly higher in GH compared to LH (
p = 0.037) and FC (
p = 0.028) on day 5, but there were no significant differences between the systems on the other dates. There were significant differences between the batches (for day 5:
p < 0.001; day 19:
p = 0.006; day 33:
p = 0.006). As for carbon dioxide and endotoxins, no significant differences between the dates within systems were detected.
Correlation coefficients of dust and ammonia with different variables are shown in
Table 4. The correlation coefficient between dust and duration of occupancy was highest for FC (
p = 0.002) but lower for GH (
p = 0.045) and LH (
p = 0.093). There was a significant correlation between endotoxins in LH (
p = 0.002). The correlation coefficients between dust and outside temperatures and inside temperatures showed values lower than r = 0.26 for all systems (all non-significant). The correlations were all negative for the outside temperatures. Correlations for inside humidity were at a low level and inhomogeneous in their orientation. Coefficients between dust and carbon dioxide revealed a positive, but moderate nonsignificant correlation, especially in FC (
p = 0.105). The correlation coefficients between dust and inside temperature and humidity in the 120 h prior to sampling were similar to the values at the time of sampling. There were moderately positive, but nonsignificant correlation coefficients for dust and total animal weight in all systems, but highest in FC (r = 0.39).
Correlation coefficients of ammonia with duration of occupancy and endotoxins showed low coefficients with a different orientation. However, the correlation between ammonia and endotoxins was moderate, with a value of r = 0.36 (p = 0.116) for LH. Ammonia was strongly negatively correlated with outside temperatures (GH: p < 0.001; LH: p < 0.001; FC: p = 0.002). There were also strong to moderate, negative correlations with inside temperatures (GH: p = 0.029; LH: p < 0.001; FC: p = 0.014). Correlations with inside humidity showed only low coefficients. Ammonia correlated positively with carbon dioxide (all: p < 0.001). Similarly to the inside temperature at the time of sampling, correlation coefficients for ammonia with inside temperature in the 120 h prior to sampling were negative and significantly high for GH (r = −0.52) and LH (r = −0.52); however, they were nonsignificant and lower for FC (r = −0.35). Correlation coefficients for ammonia with total animal weight were low, differed in their orientation, and were nonsignificant.
4. Discussion
The following discussion deals with possible explanations for the results and tries to explain the reasons for the differences and similarities between the tested farrowing systems.
With regard to dust, a wide range of values for dust concentration can be found. In general, farrowing houses show lower dust concentrations compared to piglet rearing and fattening farms [
9]. The mean dust concentrations in this study ranged in accordance with previous publications, which were conducted in the USA [
8], Ireland [
28], Germany, Great Britain, and the Netherlands [
9]. However, dust concentration data are hard to compare due to the variety of influencing factors. For instance, measurements during the daytime, especially in the afternoon, show a higher concentration than at night [
9] or in the morning [
12]. Furthermore, our data showed that the dust concentration changed during occupancy. In our study, all systems were implemented in the same building under similar conditions to ascribe possible differences to each system. In contrast to other findings, dust concentrations did not increase with the total weight of pigs or the amount of animal mass, respectively [
8]. Especially from day 19 to 33, no increase was observed. However, this could be explained by the higher weight gain and the longer occupancy period in finishing systems. Otherwise, dust concentrations were higher on day 19 and 33 than on day 5, where only sows were stabled. Such an increase in dust concentrations between farrowing and weaning have also been observed by others [
8]. This rise can also be caused by more activity [
5], or by rising levels of feces and feed, which occurs unavoidably with time of occupancy and growth of the piglets. The coefficients between dust and time of occupancy support this assumption.
The higher values of dust concentrations in GH, being significant on day 19, can be explained by the fact that the animals in GH had more space to move than in LH and FC. The activity of pigs is the most important factor associated with dust concentration [
5,
12], leading to a higher production of dust and also stirring up of deposited dust. It must be taken into account that one room of GH had distinctly lower air volume compared to the other five rooms. This could lead to the measurement of a higher concentration despite the same amount of dust.
Moreover, the design of the slatted floor might have affected dust concentration. It was observed in previous studies that concrete slatted floors led to higher dust content than synthetic slatted floors [
8]. In our study, the floors of the systems were made of different materials and differed in slat rates, reflecting commercially available housing systems. In contrast to synthetic floors, a concrete floor is more porous, less easy to clean, and promotes abrasion. Moreover, the slat rate was lower in GH than in LH and FC, leading to more fecal contamination. Whilst GH had a greater risk of fecal contamination, the lower stocking density probably reduced this risk. Possibilities to improve the situation are given by an increased percentage of synthetics and a higher slat rate in the floor. However, a concrete floor and lower slat rates can also provide more sure-footedness and durability, potentially reducing the risks of slips and falls during agonistic behavior.
Regarding endotoxins and the comparison of our results with other studies, it is important to note that in this study, the unit EU/m
3 was used, which is generally more suitable for describing the activity of endotoxins [
29], but not comparable to the unit ng/m
3. Even though the weight concentration was not used in this study, the wide range within and among studies should be taken into account. Values given for endotoxin (weight-) concentration in pig-houses are, for instance, 120.0 ng/m
3 [
30], 1880.0 ng/m
3 to 7500.0 ng/m
3 [
31], 130.0 ng/m
3 [
32], and 4.0 ng/m
3 to 108.7 ng/m
3 [
4]. There are no published studies available which provide data on endotoxins for the unit “EU/m
3” in farrowing rooms. Maximum values of endotoxin levels of other production stages in pig farming were reported to achieve 238.0 EU/m
3 in Australian piggeries [
33], 933.2 EU/m
3 in fattening houses in Europe [
34], and 818.0 EU/m
3 in nursery houses in Taiwan [
35]. Compared to these studies, the endotoxin levels in our study were higher. This is surprising insofar as fattening houses generally show a higher aerogenic bacterial load compared to farrowing and rearing units [
4]. Furthermore, studies reported that endotoxin concentration varies in the course of the day, as does dust concentration, with higher values during the daytime compared to the nighttime [
4]. As endotoxin concentration is usually identified from dust samples, these similar trends are logical and most probably caused by the activity of the pigs during the day. Due to the 24 h sampling time, the measurements in this study remained unaffected by such diurnal effects.
Endotoxin levels tended to be lower at the end of occupancy, despite increased animal density. This would argue for a higher burden of Gram-negative bacteria around the time of birth, because endotoxins are cell wall components of these dead bacteria [
4]. In FC, higher endotoxin levels were found compared to the other systems. However, this difference was significant on day 33 only. Reasons for this difference remain unclear. A higher humidity, which is reported by Banhazi et al. (2008) to have a significant positive effect on endotoxin concentration [
33], can be ruled out in our study, with no significant differences in humidity occurring between the systems. Seedorf et al. (1998) concluded that differences in concentrations might occur due to differences in the Gram-negative bacteria content of feces, especially due to intestinal diseases [
4]. In our study, we could not determine whether the sows and the piglets in FC suffered significantly more from intestinal diseases, such as diarrhea, or if the sows in GH and LH were in a better state of health due to more movement and less obstipation.
Concerning carbon dioxide, the maximum permissible value is below 3000 ppm, according to German law (TierSchNutztV). The maximum carbon dioxide concentrations in our study were in line with results of other studies [
28,
36,
37]. The carbon dioxide concentrations did not differ significantly either between the sampling dates during occupancy or between the systems. This is due to the effective ventilation. According to German law (TierSchNutztV), the concentration of gaseous ammonia must not exceed the limit of 20.0 ppm in pig housing. In our study, however, maximum ammonia concentrations of 33.0 ppm were reached, but these were only short-term, as the means of all systems were below 20.0 ppm. Values given in the literature vary, depending on—amongst others—production-, house-, floor-, or ventilation-type [
6,
38,
39]. The measured mean values in our study varied within the range of other studies. An increase in the number and weight of animals, leading to higher fecal contamination, is known to increase ammonia levels [
40]. However, we could not detect an increase between the sampling dates. The time of occupancy might have been too short, with 33 days to realize this effect, as the first distinct increase in ammonia levels was shown between days 30 and 60 of occupancy in a farrowing weaning room in a previous study [
41].
On day 5, GH had significantly higher ammonia concentrations compared to FC and LH, most probably related to the general hygiene status of GH. It is known that poor hygiene leads to higher ammonia concentrations [
33]. Adequate cleaning of GH was more difficult to be realized because of installations and piglet bars. Another explanation might be the larger floor space itself, and more particularly, that urine and feces were widely distributed by the animals’ movement, which is also known to promote the release of ammonia [
39]. The type of stable floor can also have an influence [
40]. It is assumed that the concrete slatted floor soaks the urine up like a sponge through its open-pore structure and thus promotes ammonia production.
Concerning correlations, there was a slight, non-significant, positive correlation for dust with carbon dioxide. Carbon dioxide is considered as an indicator for the ratio of air exchange [
36]. This relationship is substantiated by the findings that dust concentration in winter is higher, when ventilation rates are low, than in summer [
9,
11,
42]. Increased animal activity can also lead to an increase in both carbon dioxide and dust.
The correlation coefficients between dust and endotoxin content differed markedly between the three systems—the relationship was high in LH, but low in FC and GH. This difference might indicate the origin of the endotoxins; high levels of endotoxin concentration at a low dust concentration can only arise if either the dust contains a particularly high concentration of endotoxins, due to high concentrations of endotoxins in the source material for dust, or if endotoxins are independent of dust present in the air.
No distinct relation was found between dust and inside temperature and humidity, neither to the punctual measurement while sampling nor the 120 h measurements. These have been described as contributory factors with good correlation in other studies [
5,
9,
12]. Studies indicate that drier indoor climate leads to higher concentrations of airborne dust [
8,
9,
12,
43]. An increase in inside temperature was documented as usually having a positive effect on dust concentration, other than in farrowing units [
33]. This effect can be related to the fact that large animals, such as sows, become less active under high temperatures, which lowers dust concentrations [
33].
Concerning ammonia concentrations, Spearman’s analysis revealed significant correlations between carbon dioxide and inside and outside temperatures. These results are to be explained by a largely constant climate and a sufficiently working ventilation system, because carbon dioxide concentration and outside temperatures are strongly related to air exchange.
The correlation coefficient between the concentration of dust and ammonia were distinctly below the findings of Kim et al. (2005) [
12]. However, they investigated dust and ammonia levels in enclosed piggeries in wintertime only, in which both were significantly higher than in other seasons [
12]. Seedorf et al. (1999) reported a correlation between relative humidity and ammonia concentration only, but not for other microclimatic parameters [
39]. This was not confirmed in our study, with only very slight differences in humidity. The correlation coefficients between ammonia concentration and total animal weight indicate only a small, surprisingly negative, relationship. It is true that more animals also produce more excrement, which produce ammonia. On the contrary, the negative orientation of the correlation could be explained by the fact that more animals ensure better self-cleaning of the slatted floors.


 ,
, 


