Reproductive Biology of Wild Blueberry (Vaccinium angustifolium Aiton)


School of Biology and Ecology, University of Maine, Orono, ME 04469, USA
Agriculture 2019, 9(4), 69; https://0-doi-org.brum.beds.ac.uk/10.3390/agriculture9040069
Submission received: 7 March 2019
/
Revised: 22 March 2019
/
Accepted: 25 March 2019
/
Published: 30 March 2019
(This article belongs to the Special Issue North American Native Food Crops)
Abstract
:Wild blueberry, Vaccinium angustifolium Aiton, is a native forest understory plant that is managed as a fruit crop. Over the past 51 years, experiments have been conducted to investigate its reproduction. A model was developed that predicts bloom to begin at 100° days (base 4.4 °C) after 1 April and to end at 500° days for a period of three to four weeks. Flower stigmas are only receptive to pollen deposition for eight to 10 days, and the rate of fruit set declines rapidly after four days. Placement of pollen upon receptive stigmas suggests that fruit set occurs with as little as a single pollen tetrad. Twelve tetrads result in 50% fruit set. Several years of exploratory fruit set field experiments show viable seeds per berry, which result from pollination with compatible genotype pollen, is associated with larger berry mass (g). Decomposition of the total variance in fruit set shows that stem variation explains 65% to 79% of total variance in the fruit set. To a lesser extent, the field, year, and clone also explain the percent fruit set variation. Variation between stems may be due to variation in the number of flowers. Fruit set tends to decrease as the flower density increases, possibly due to the limitation of pollinators.
1. Introduction
Wild North American blueberry (also known as lowbush blueberry) is a native North American fruit crop that has not benefited from genetic improvement breeding programs, as has highbush blueberry, Vaccinium corymbosum L. [1]. This crop is essentially a wild complex of Vaccinium species that form the natural understory vegetation of Eastern North American forests [2,3]. Upon clearing the forest through logging, plants are managed to provide sunlight, release from plant competition, reduction of insect pests and plant pathogens that cause disease, and better soil fertility [4]. Any given wild blueberry field can range in the number of Vaccnium berry species present. Five species and hybrids can be found in Maine including Vaccinium angustifolium Aiton, V. myrtilloides Michx., V. angustifolium X V. corymbosum hybrids, V. boreale I.V. Hall and Alders, and V. pallidum Aiton [5]. However, the most abundant species are V. angustifolium, the sweet lowbush blueberry, and V. myrtilloides, the velvetleaf or sour top blueberry [5], and many fields are comprised of just these two species. Across most of the geographic production region, V. angustifolium is the dominant species [4,5,6]. Wild blueberry is a valuable commercial berry crop in Northeastern United States (Maine and, to a lesser extent, New Hampshire, Massachusetts, and Michigan), and Eastern Canada (New Brunswick, Nova Scotia, Prince Edward Island, Newfoundland and Labrador, and Quebec).
Pollination is the most significant factor in wild blueberry production [7,8]. Wild blueberry pollination is almost entirely dependent upon bees [7,9] even though nocturnal flying insects such as moths and day flying birds such as hummingbirds have been reported as visiting the bloom [10,11]. Because this crop is not planted, the spatial pattern of genotypes in the field is not due to a pre-determined plan as in many crops, such as almonds, apples, peaches, or coffee [12,13,14,15]. Wild blueberry is, for the most part, an entomophilic, obligate outcrossing species [16,17] and outcross compatibility appears to be non-reciprocal [18]. This means that pollen movement between two genets (clones as they are commonly referred to by farmers and some researchers [17]) may result in a high level of fruit set in one direction, but a low level of fruit set in the other direction, given that the number of pollen tetrads deposited on the stigmas is the same. Because of this, the spatial genetic structure among clones (genets) in a field and the number and species of bees that are present during bloom will determine the fruit set and subsequent yield of the crop [19,20].
Most of the research effort in wild blueberry pollination has investigated the bee component of pollination. Bee research has focused on the bee community composition [9,21,22], bee species efficiency [23,24], bee management and efficacy in commercially managed fields [7,8,25,26,27,28,29,30,31,32,33,34,35,36,37,38,39,40,41,42,43], bee protection and conservation [32,33,44,45,46,47,48,49,50,51,52,53], bee behavior and ecology [24,37,54,55,56], landscape ecology and wild blueberry pollinator abundance [57,58], and bee forager movement and pollination [19,20,24,30].
However, despite several investigations into the plant’s role in wild blueberry pollination, tradeoffs in the reproductive effort investment [8,59,60,61], reproductive self-incompatibility/ compatibility [62,63,64], spatial genetic structure and relatedness [65,66], dynamics of sex germ tissue investment [67,68], gene flow [69,70], phenology of flowering [71], and the potential effects of climate change on wild blueberry pollination [22,72], there is still much that is not known about wild blueberry reproduction. The objectives of this study were to investigate five distinct aspects of wild blueberry reproduction and synthesize their significance to provide a greater overall understanding of wild blueberry plant pollination, reproduction, and commercial yield. The phenomena studied were: (1) phenology of bloom, (2) flower (stigma) viability duration post-anthesis, (3) fruit set as a function of pollen quantity deposition on floral stigmas, (4) the relationship between the fruit set and viable seed set and berry size or mass, and (5) the variance in fruit set between years, fields, clones, locales within clones, and stems.
2. Materials and Methods
All laboratory studies were conducted at the University of Maine, Orono, ME, USA. Field studies were conducted from 1967 to 2017 in managed wild blueberry fields in Knox, Lincoln, Hancock, Waldo, and Washington Counties, ME, USA.
2.1. Phenology of Bloom
The objective of this study was to develop a degree day predictive model for a wild blueberry bloom in Maine. In 2015, 18 wild blueberry fields and, in 2016, eight fields were sampled to develop the model. In both years, the fields sampled were randomly selected from both major growing regions in Maine, the Mid-coast, and down east. An initial model was developed from the 2015 and 2016 dataset and then fields visited in 2017 (seven fields) were used for a validation dataset. After validation, all the data was used to build a final predictive model. Each field was visited 4 to 5 times during bloom. At each visit, we collected 10 new stems (1 per clone) and, on each stem, counted the number of open and closed flower buds and calculated the proportion of flowers in the field in bloom. To develop a degree day model for Maine, daily maximum and minimum air temperatures were collected from local weather stations in the vicinity of each field. Using this data, the number of degree-days was calculated for the threshold base temperature of 4.4 °C using the formula: degree days = (average daily air temperature − threshold base temperature), where average temperature is: [(maximum air temperature + minimum air temperature)/2]. The threshold of 4 °C was estimated as the best threshold in 2016 for bloom estimates measured in the field in both 2015 and 2016. Cumulative percent bloom as a function of degree days with a threshold temperature of 4.4 °C was modeled with the equation below.
where 100 is the ceiling, a is the slope of the non-linear regression, and b is the inflection point.
% bloom = 100/[1 + e (a − b × DD)]
The model was fit with non-linear least squares using the Levenberg-Marquardt damped least squares method [73]. To use this model degree days at base = 4.4 °C are accumulated from 1 April. This is a date at which, on average, frost has left the upper layers of the soil in most Maine production areas and plants begin to develop.
2.2. Stigma Longevity and Fruit Set
Two field studies were conducted in 2007 (Jonesboro, ME, USA) and 2015 (Winterport, ME, USA) in wild blueberry fields to determine the longevity of stigma (receptivity) and the resulting fruit set post bloom. In both studies, 5 randomly selected clones (genets) were selected before bloom in early May. A week later, 10 non-blooming stems/clone were covered with fine mesh bags to prevent pollination when flowers first opened. Starting in mid-May, bags were checked daily and newly opened flowers were marked with a Sharpie® pen of a specific color on the calyx. At the same time, pollen was collected from 5 nearby clones (not the pre-selected target clones) by cutting stems with open flowers and bringing them into the lab for 24 h. This allowed the flowers to dry overnight. The next morning, the flowers were vibrated with a tuning fork (440 Hz) over a petri dish and the pollen was collected. Pollen from all 5 pollen sire clones was mixed and taken out to the field for hand pollination. At least 5 flowers from each clone of each age 1 to 10 days old were hand pollinated with a paintbrush with approximately 50–100 pollen tetrads (see [18]). The mesh bags were left on the stems for 10 days after the last pollination (mid-June). In early July, all marked flowers were examined for fruit development indicated by a swollen calyx. The calyx ends were re-marked with a Sharpie pen and then examined again during the third-fourth week in July for proportion of fruit set from the initial number of hand-pollinated flowers. The proportion of mature fruit from the initial number of flowers were calculated. Least squares regression analysis was used to determine the relationship between the initial fruit set and the proportion of mature fruit as a function of each flower age at pollination. The dependent variable was the mean proportion of fruit set and mature fruit for each flower age where pollination took place per clone. The independent variables were year, clone, flower age, and the two-way and three-way interactions. Homogeneity of variance and outliers were judged by the inspection of Studentized residuals [74]. Normality of residuals was assessed with the Shapiro-Wilk W test [75]. Serial correlation with flower age was tested with the Durban Watson statistic [76]. Linear correlation (Pearson) was used to assess the relationship between the proportion fruit set and the proportion mature fruit (both years pooled). All modeling was conducted using JMP, version 14 [77].
2.3. Fruit Set as a Function of Pollen Tetrad Quantity
The objective of this 2008 laboratory study was to determine the number of pollen tetrads when placed on a wild blueberry flower stigma that resulted in the fruit set. A preliminary study was conducted in 2000 at the University of Maine Blueberry Hill farm to determine if it was feasible to hand pollinate flowers in wild blueberry clones that had been dug from the ground and placed in blueberry plastic harvest tote boxes (45.7 cm × 38 cm × 12.7 cm). Clones were identified that could set fruit with a moderate amount of self-pollen [65]. In the spring of 2008, a section of each of three wild blueberry clones were excavated and placed in a tote box. The boxes were watered and brought into the laboratory for the pollen tetrad quantity study. Every day, as the bloom progressed, newly opened flowers were marked on the base of the corolla with a Sharpie® pen. When the flowers were two or three days old, they were pollinated with a mixture of pollen tetrad genotypes that was collected from the field (see methods in the previous experiment). Appropriate age flowers were arbitrarily chosen from the three clones and received one of the following pollen tetrad treatments upon the receptive stigmas: 0, 5, 10, 15, 20, 50, 75, and 100 pollen tetrads per stigma. Pollen tetrads were carefully sorted into batches of known quantities and then the designated number of pollen tetrads (with some minor variation) was picked up with assorted paintbrushes with 1–5 moist (distilled H2O) camel hairs. The brush was then used to apply the number of pollen grains desired to each stigma carefully so as not to damage the stigma or pollen tetrads. At least five flowers from each clone constituted each treatment even though 10–20 flowers per treatment was the goal. The control (0 tetrads) was represented by 30 to 50 flowers. After the pollination treatments were complete, the tote boxes were maintained in the laboratory under 18:6 D:N (day:night) conditions at room temperature (ca. 23 °C) and watered when necessary, until bloom was completed. Then the totes were taken out into a blueberry field and placed along the edge in a partially shaded environment. Totes were watered when necessary and, on 17 June, the fruit set was assessed based upon the occurrence of green fruit. A general linearized logistic regression model was used to determine the effect of clone and pollen tetrad deposition treatment on the proportion fruit set. Both an asymptotic logistic regression and a polynomial regression were used to quantify the relationship between the mean proportion fruit set (averaged over clones) and pollen tetrad deposition. All modeling was conducted using JMP, version 14 [77].
2.4. Fruit Set and Seed Development in Fruit
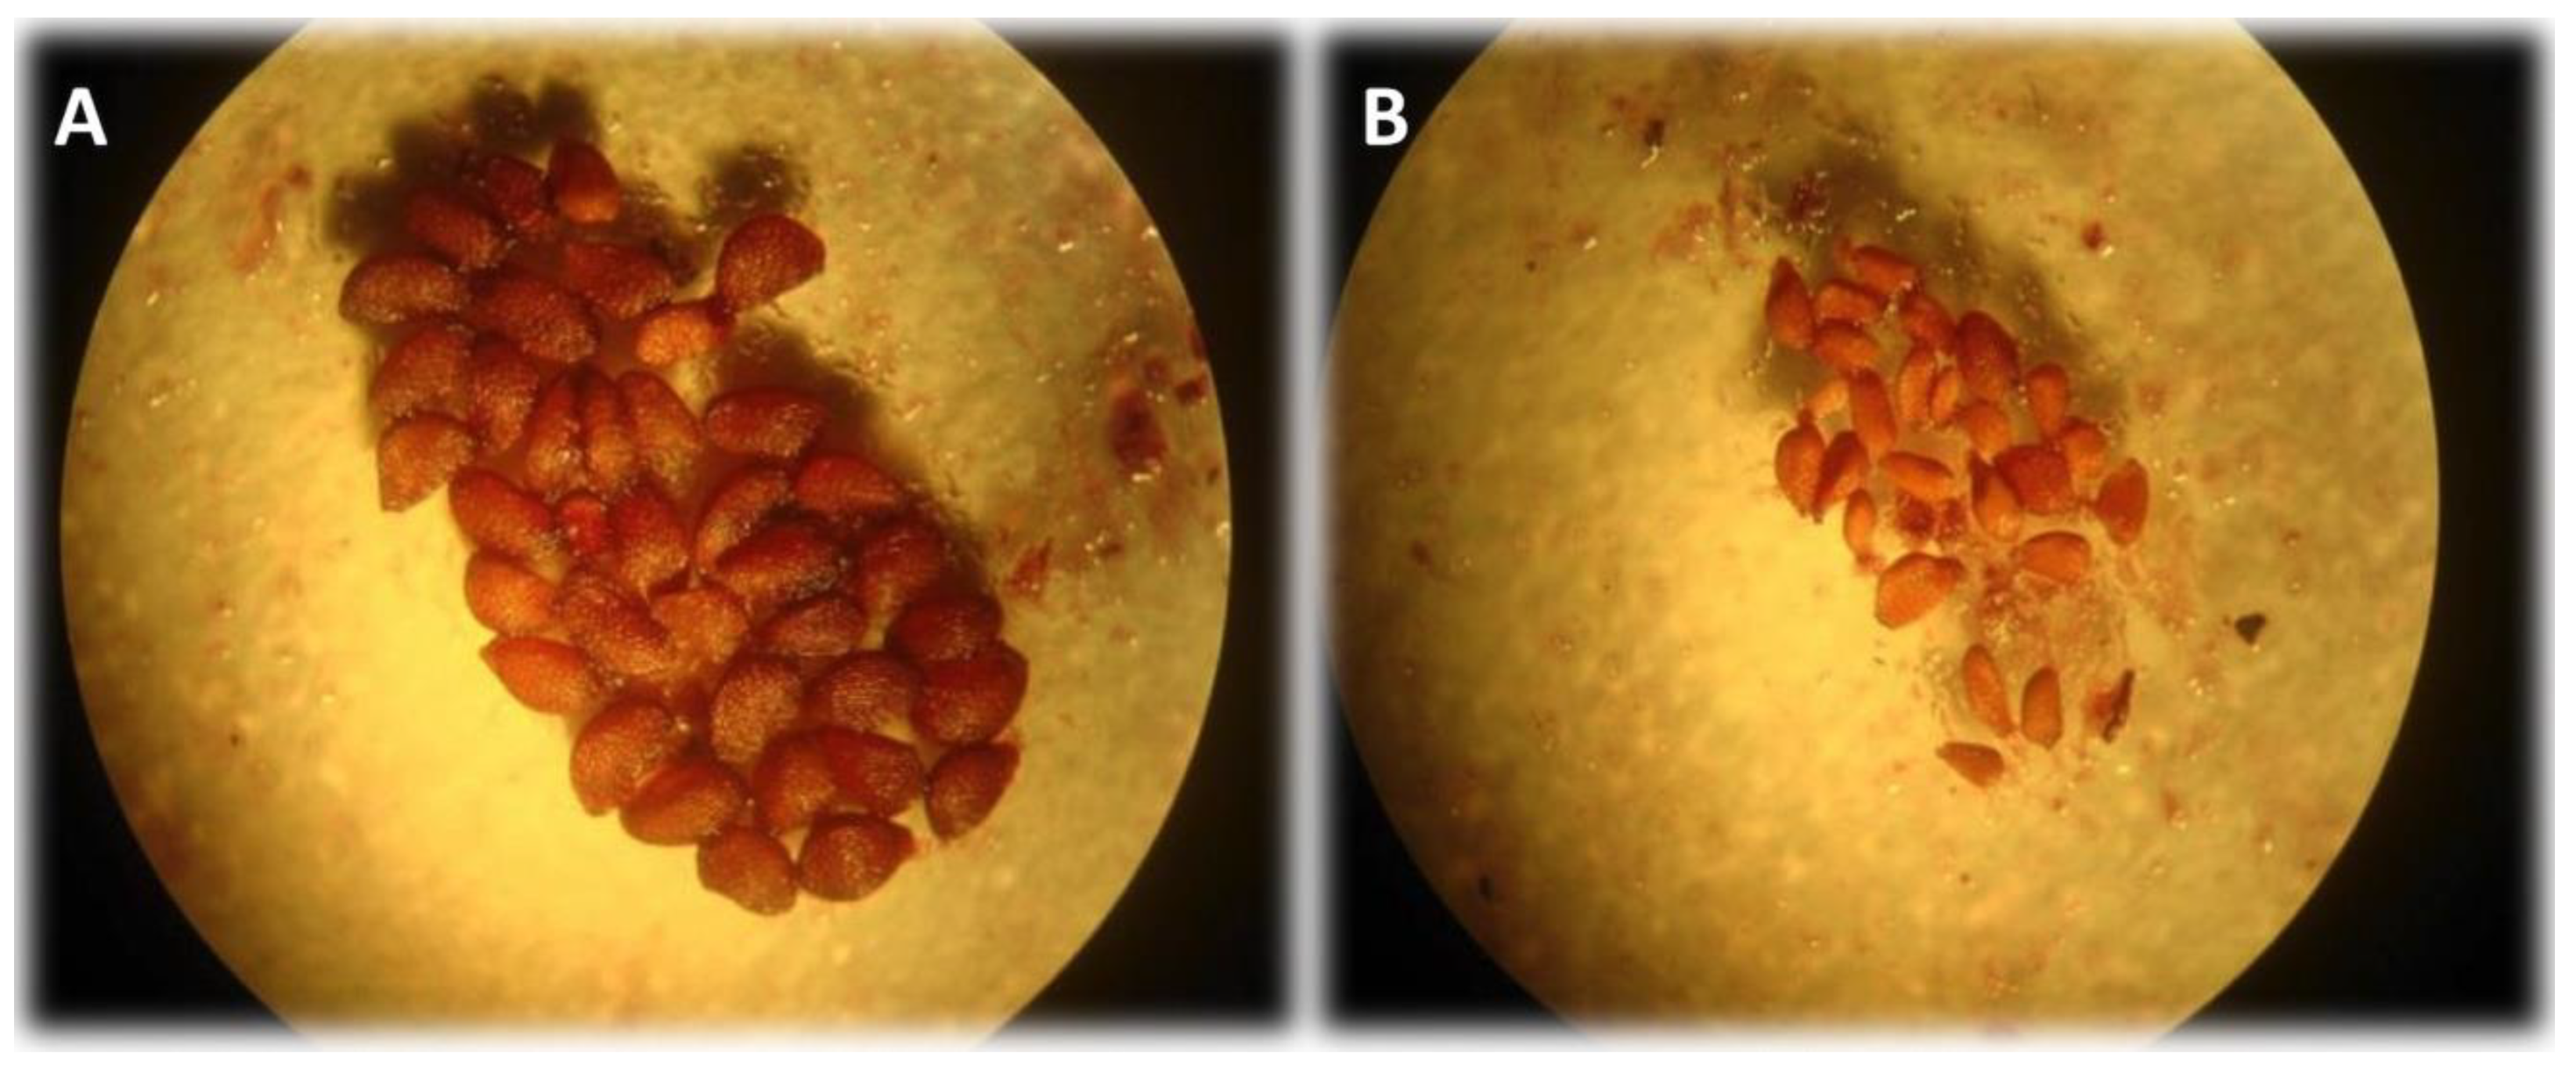
This study was a field experiment conducted in 2006, 2007, and 2011. The objective was to estimate the relationships between seed number in fruit and fruit mass both within and between fields as well as the proportion fruit set and seed number in fruit between fields. In 2006, six fields were sampled, in 2007, one field was sampled, and, in 2011, 12 fields were sampled. In 2011, these 12 fields represented three organic fields, three low input fields, three medium input fields, and three high input fields [8]. In 2006, on 19 July, 10 berries were arbitrarily collected from each of 10 clones in each field. In 2007 on 15 July, 10 fruits were arbitrarily selected from each of 18 clones. Ten berries from each of 10 clones in each field were collected in 2011. In addition, the fruit set was measured in each field in 2011. To do this, six clones were selected and, within each clone, five arbitrary stems were marked with a string around the base tied to a metal identification disk with a number. Just prior to bloom, all flowers on a stem were counted. After bloom in mid-June, the number of green fruits were counted per stem and the proportion fruit set was calculated as the ratio of green fruit on each stem to the number of flowers that were previously recorded on that stem. In all three years, the fruits were taken back to the laboratory and individually weighed to the nearest thousandth of a gram and dissected to quantify the number of viable seeds in each fruit. Non-fertilized ovules and aborted seeds were only counted in 2011 (Figure 1, see Reference [65] for distinguishing viable and aborted seeds). A proxy for floral ovules from which the berries collected was estimated by dissecting the berries and counting all of the viable seeds, aborted seeds, and remnants of non-fertilized ovules that can still be seen under the microscope. This is most likely an underestimate of the true number of ovaries in flowers, which was determined by Bell et al. [69]. However, a comparison of distributions between my estimates and theirs allows us to determine the existence of bias.
Mixed effects of general linear models were used to estimate the relationship between the number of seeds per berry and clone (and the interaction between seeds and clone) with fruit mass. Berries nested within the clone being a random effect was used for the error term and the restricted maximum likelihood was used to estimate the parameters [77]. The 2011 data set was also used to test the relationship between data aggregated to the field level. Seeds per berry, berry mass, yield, and fruit set at the field level were modeled using a general linear fixed effects model. The statistical software JMP version 14 was used for estimating the general linear models [77].
2.5. Decomposition of Total Variance in the Fruit Set
Two studies were conducted in order to determine the sources of variation in the fruit set. The first study was a six-year study (1966–1971). The second study was a four-year study (2011–2015, excluding 2012). The first study was conducted in a commercial blueberry field in Deblois, Maine, USA. Each year, 10 unique clones (in 1971, only nine clones were selected) were arbitrarily selected and, prior to bloom, each clone was divided into five sections (except in 1970 and 1971 when each clone was divided into two sections). Within each Section, 20 stems were tagged with string and given a unique identification label. Then, during the loose cluster stage to early bloom, all flower buds and flowers were counted on each stem and recorded. After bloom, when green fruit began to swell, fruits were counted on each stem. The percent fruit set on a per stem basis was calculated by dividing the number of fruits per stem by the number of original flowers per stem and, then, multiplying the quotient by 100.
In the second study, 12 clones were selected in each of 12 fields per year (2011–2015, except 2012). Clones were not divided into sections, as described in the first study. In each clone, three stems were arbitrarily chosen and labeled prior to bloom. Determination of the percent fruit set followed the same methodology described in the first study.
In order to decompose, the total variance in the percent fruit set, restricted maximum likelihood (REML) modeling was performed on the nested random effects model for each study [78]. Both studies had as the dependent variable, percent fruit set. The independent variables for the first study model were year + clone (year) + section (clone) + residual or stems (sections). There was only one field in the first study and the field was not included in the decomposition of variance. The independent variables for the second model were year + field (year) + clone (field) + residual or stems (clone). A general linear model of flowers/stem on percent fruit set was used to assess the effect of the flower stem density affected percent fruit set.
3. Results
3.1. Phenology of Bloom
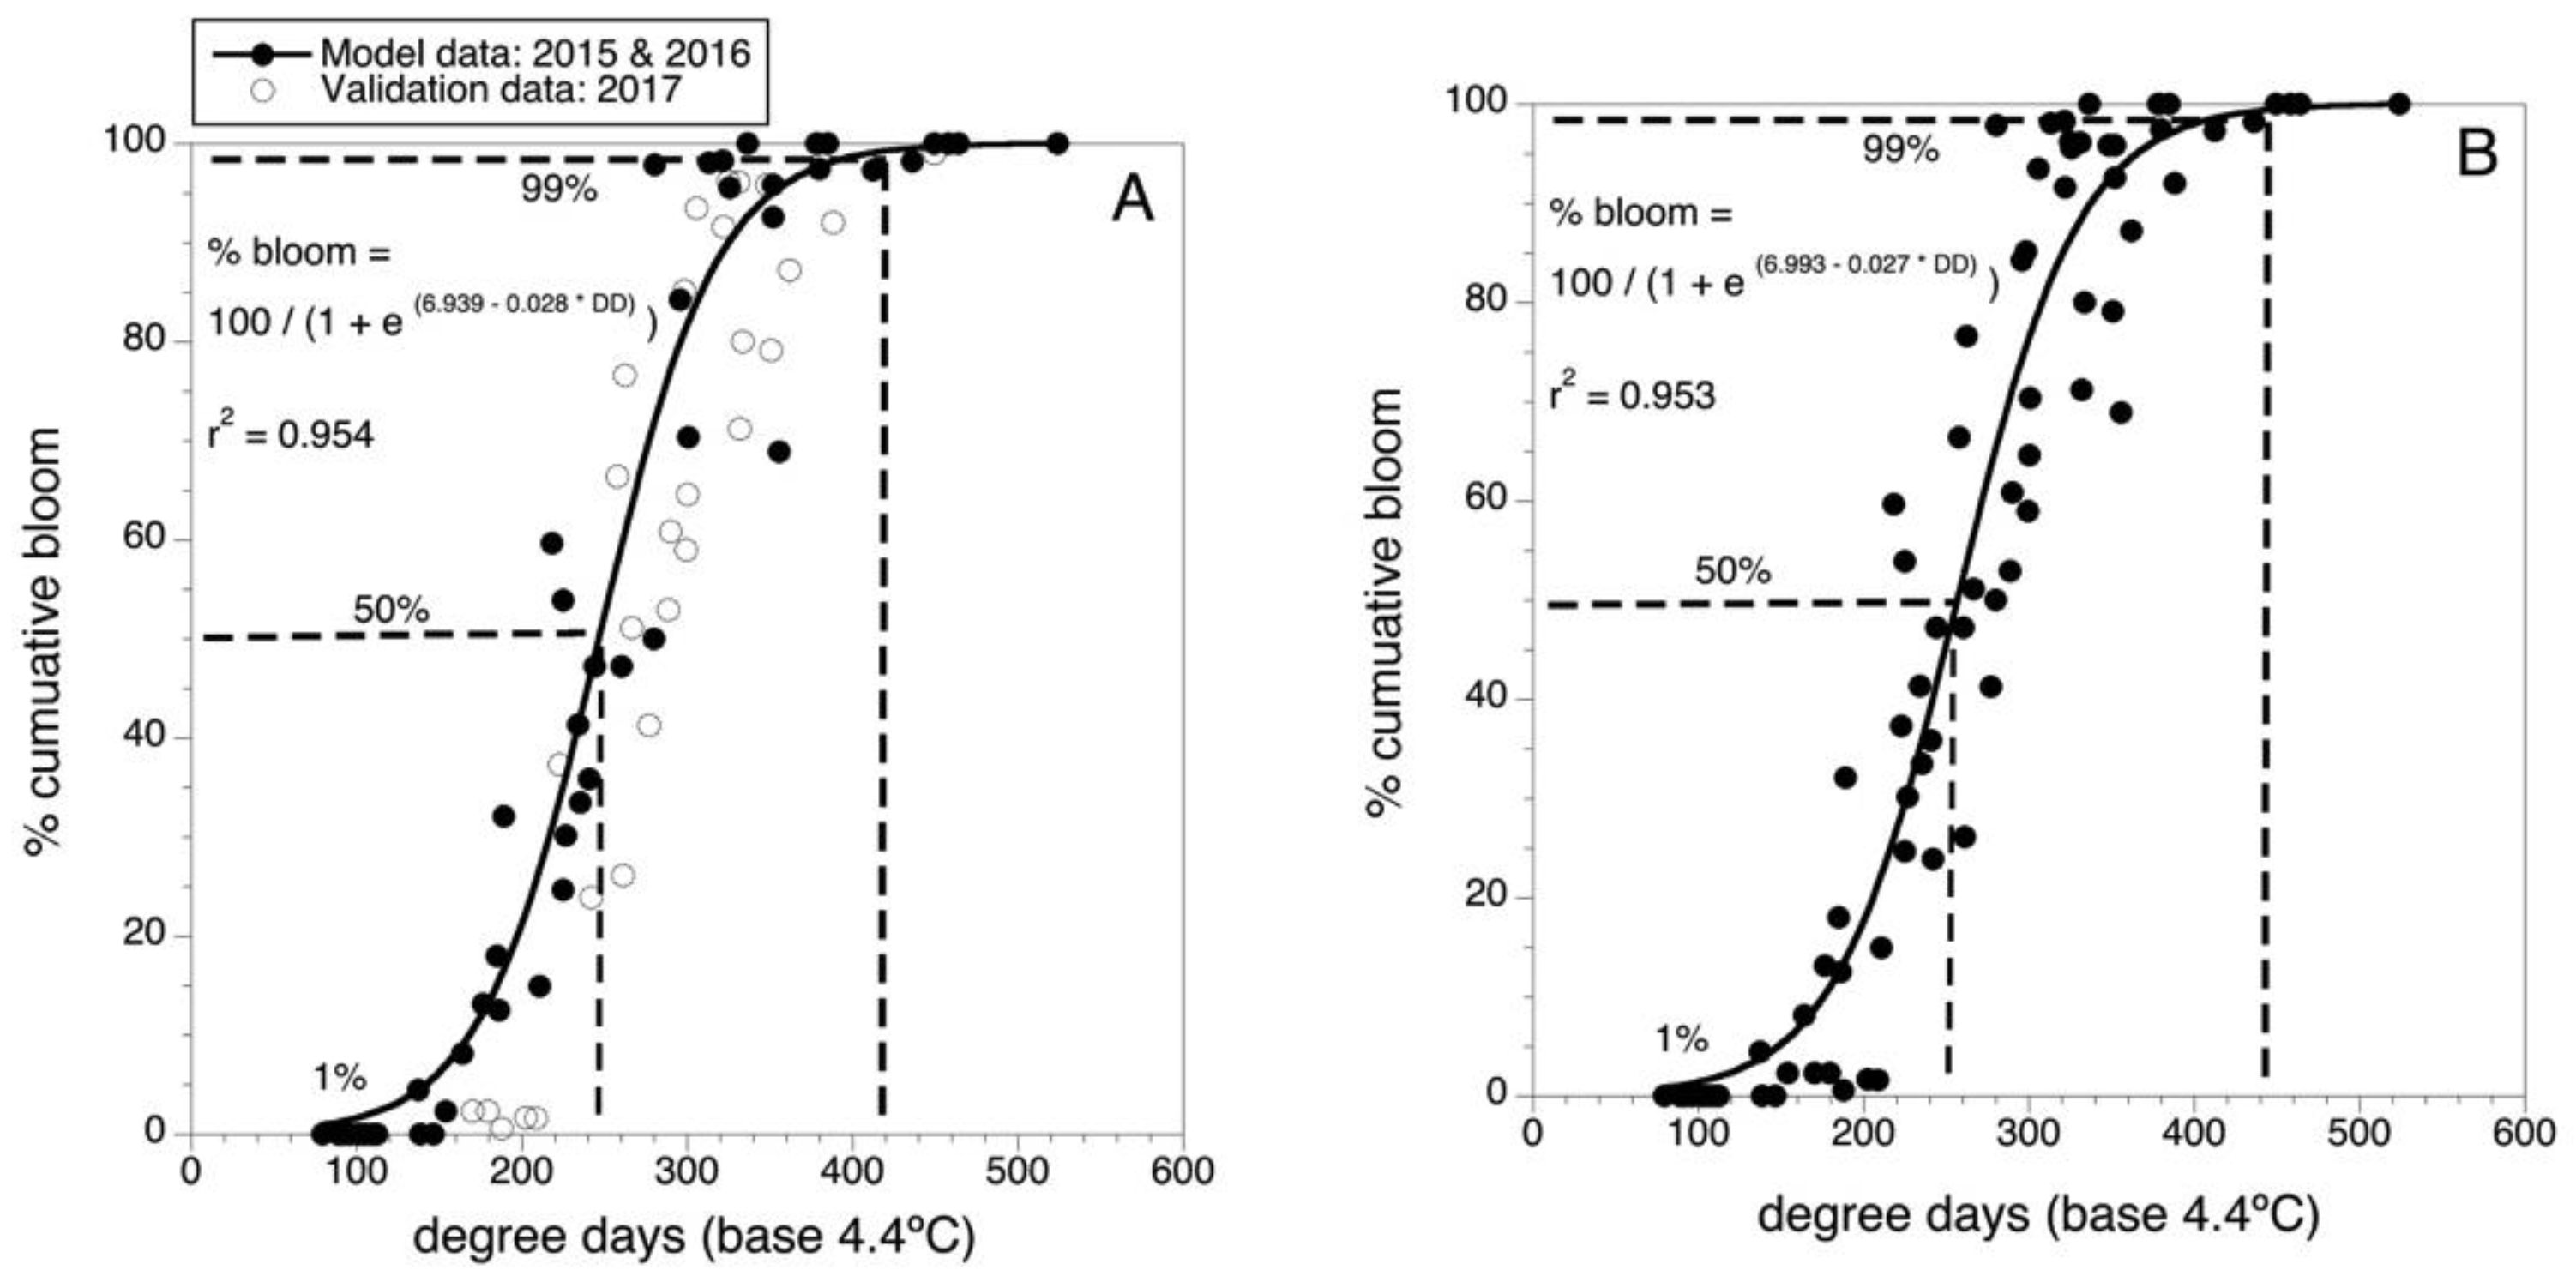
Figure 2A shows the model for predicting bloom developed in 2016 with data collected in 2015 and 2016 as well as the overlay of the validation data collected in 2017. Because the 2017 validation data was well described by the predictive model, the parameters of the model were fine-tuned by using the data from all three years (n = 33 wild blueberry fields) to fit a final predictive model. The parameter values are shown in Figure 2B. There was only a small change to the final model parameters because the validation data (2017) was similar in phenology to the model building data (2015 and 2016) and to the predicted bloom. The final model is:
% bloom = 100/[1 + e (6.993 − 0.027 × DD)]
This model had an r2 = 0.953 (i.e., 95.3 % of the variance in percent bloom is described by air temperature degree-days (threshold of 4.4 °C and degree-days accumulated from 1 April). It can be seen in Figure 2B that 50% bloom is predicted to occur at 250 DD and 99% bloom at 440 DD.
3.2. Stigma Longevity and Fruit Set
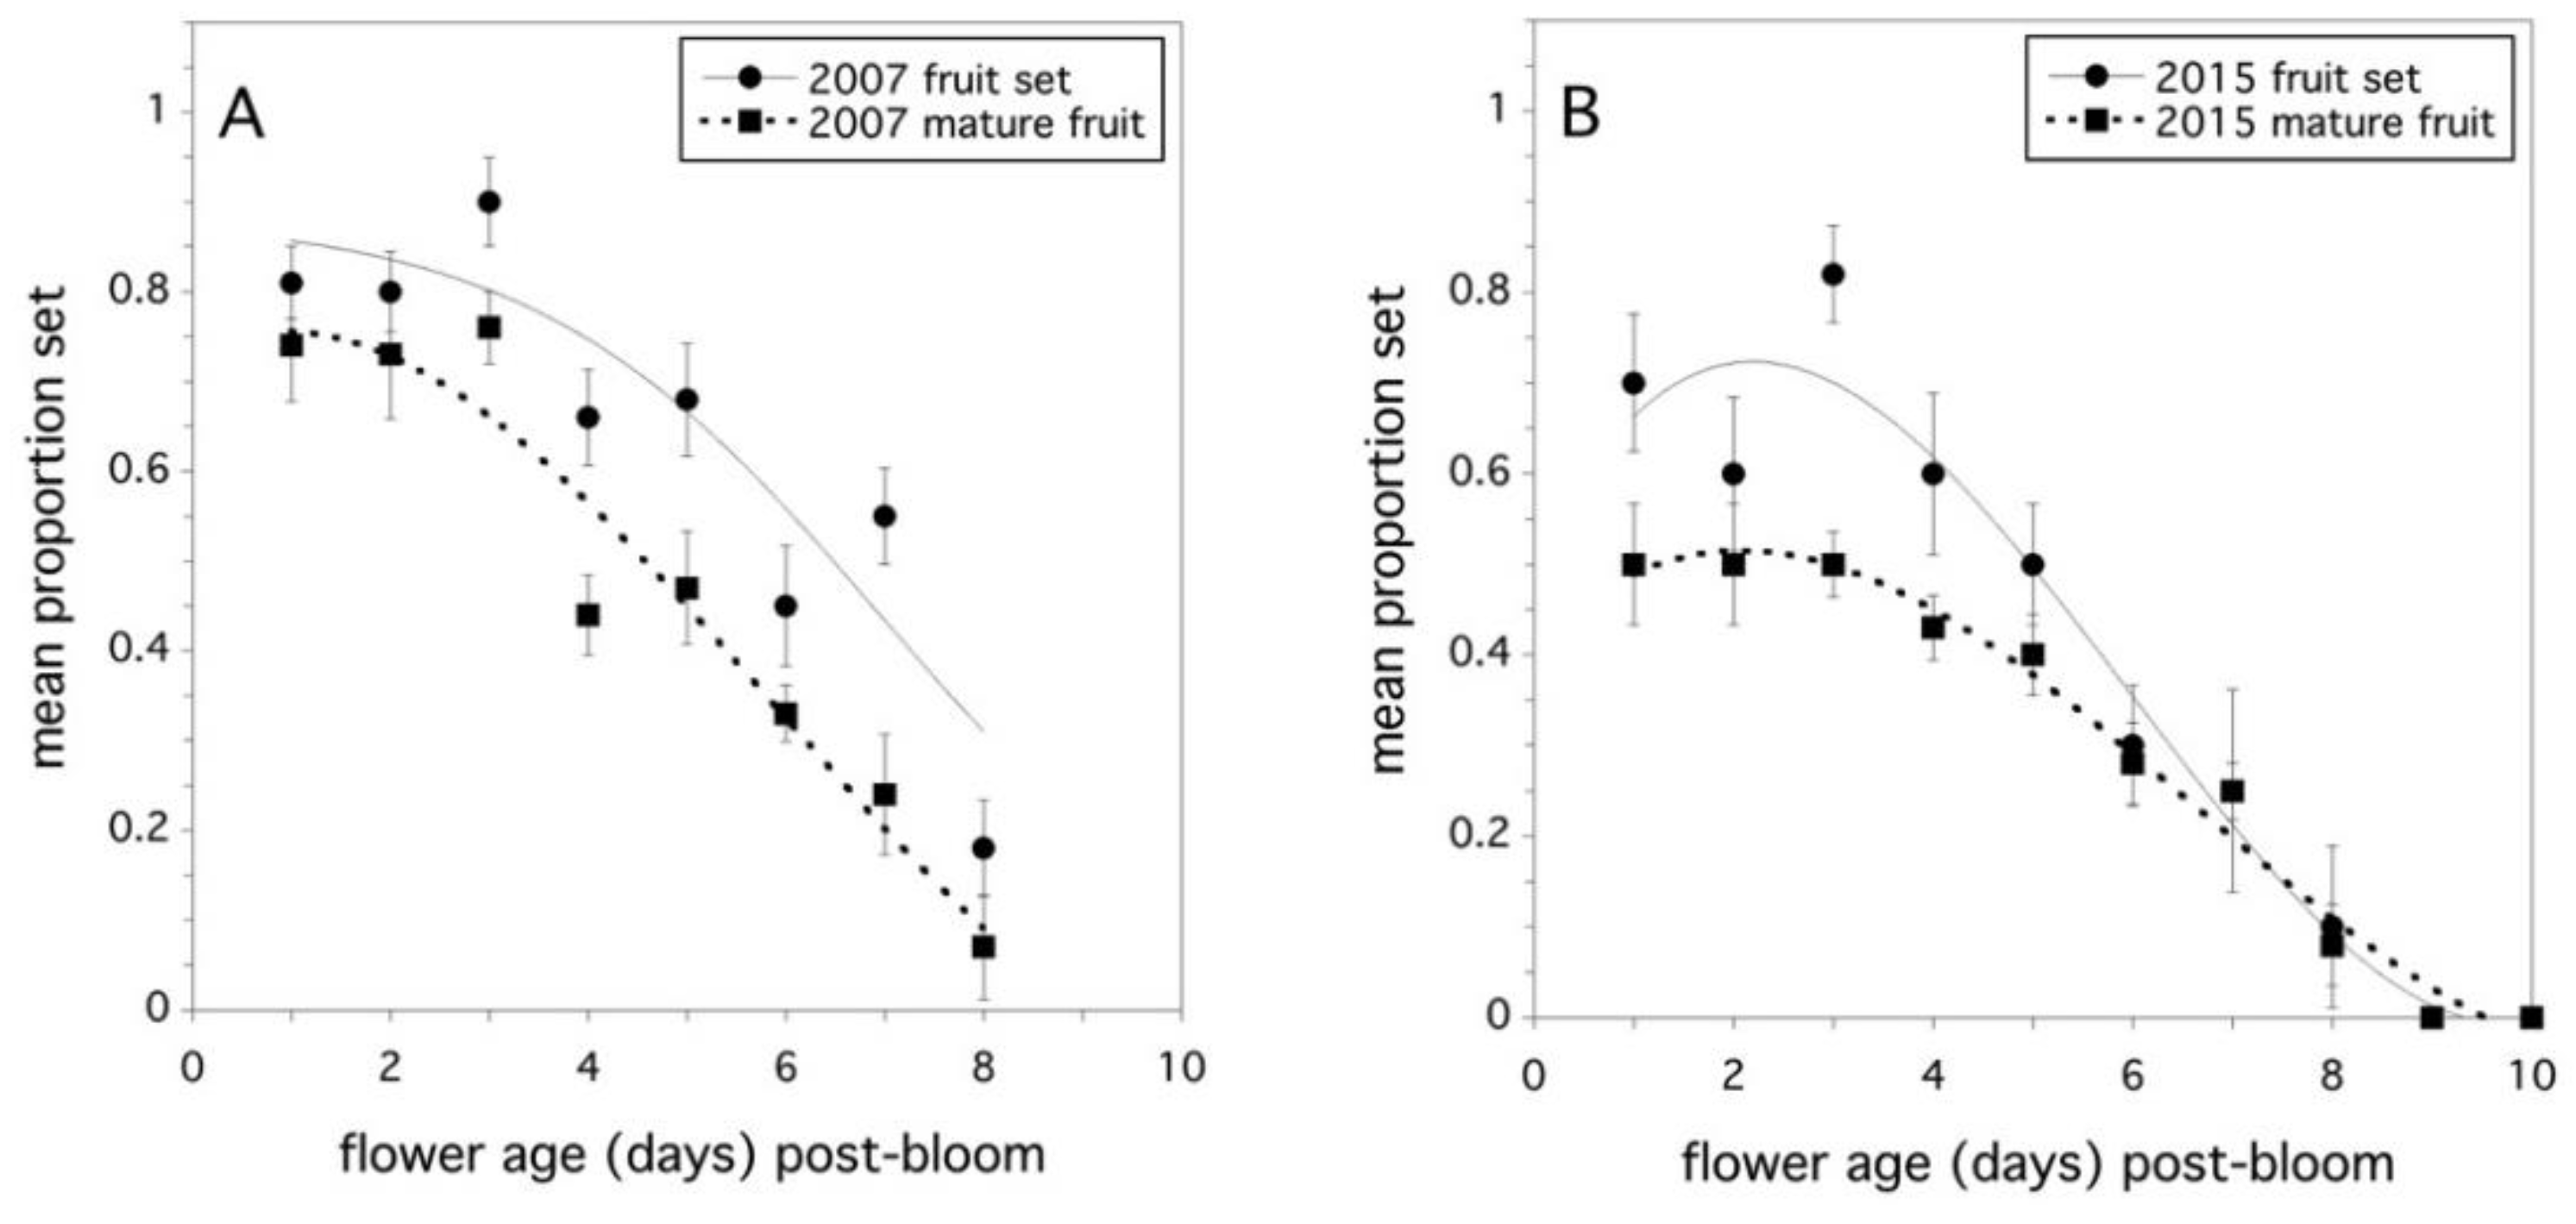
Evidence was found to support the hypothesis that flower age determines the proportion fruit set when equal amounts of pollen tetrads are applied to the stigma. This was a strong effect and was significant when pooled over years (F(1,60) = 142.169, p < 0.0001, full model r2 = 0.775). However, the proportion fruit set was also affected by the maternal clone (F(4,60) = 5.934, p = 0.0004), and the maternal clone effect varied by year (F(4,60) = 3.328, p = 0.016). There was no significant year effect or any significant interactions with year (p > 0.05). The proportion of mature fruit resulting from pollinated flowers was more complicated. Flower age was significant (F(1,60) = 332.984, p < 0.0001, full model r2 = 0.888), but all the main effects and two-way interaction effects with clone and year were also significant. Only the three-way interaction of flower age x maternal clone x year was not significant. The proportion fruit set and proportion mature fruit developing from pollinated flowers were highly correlated for both study years (2007: r = +0.744, p < 0.0001, 2015: r = +0.821, p < 0.0001). Figure 3A and Figure 3B show the decline in stigma receptivity, expressed as proportion fruit set, as a function of flower age. In addition, these figures also show how fruit production can be affected by the age at which a flower is pollinated.
3.3. Fruit Set as a Function of Pollen Tetrad Quantity
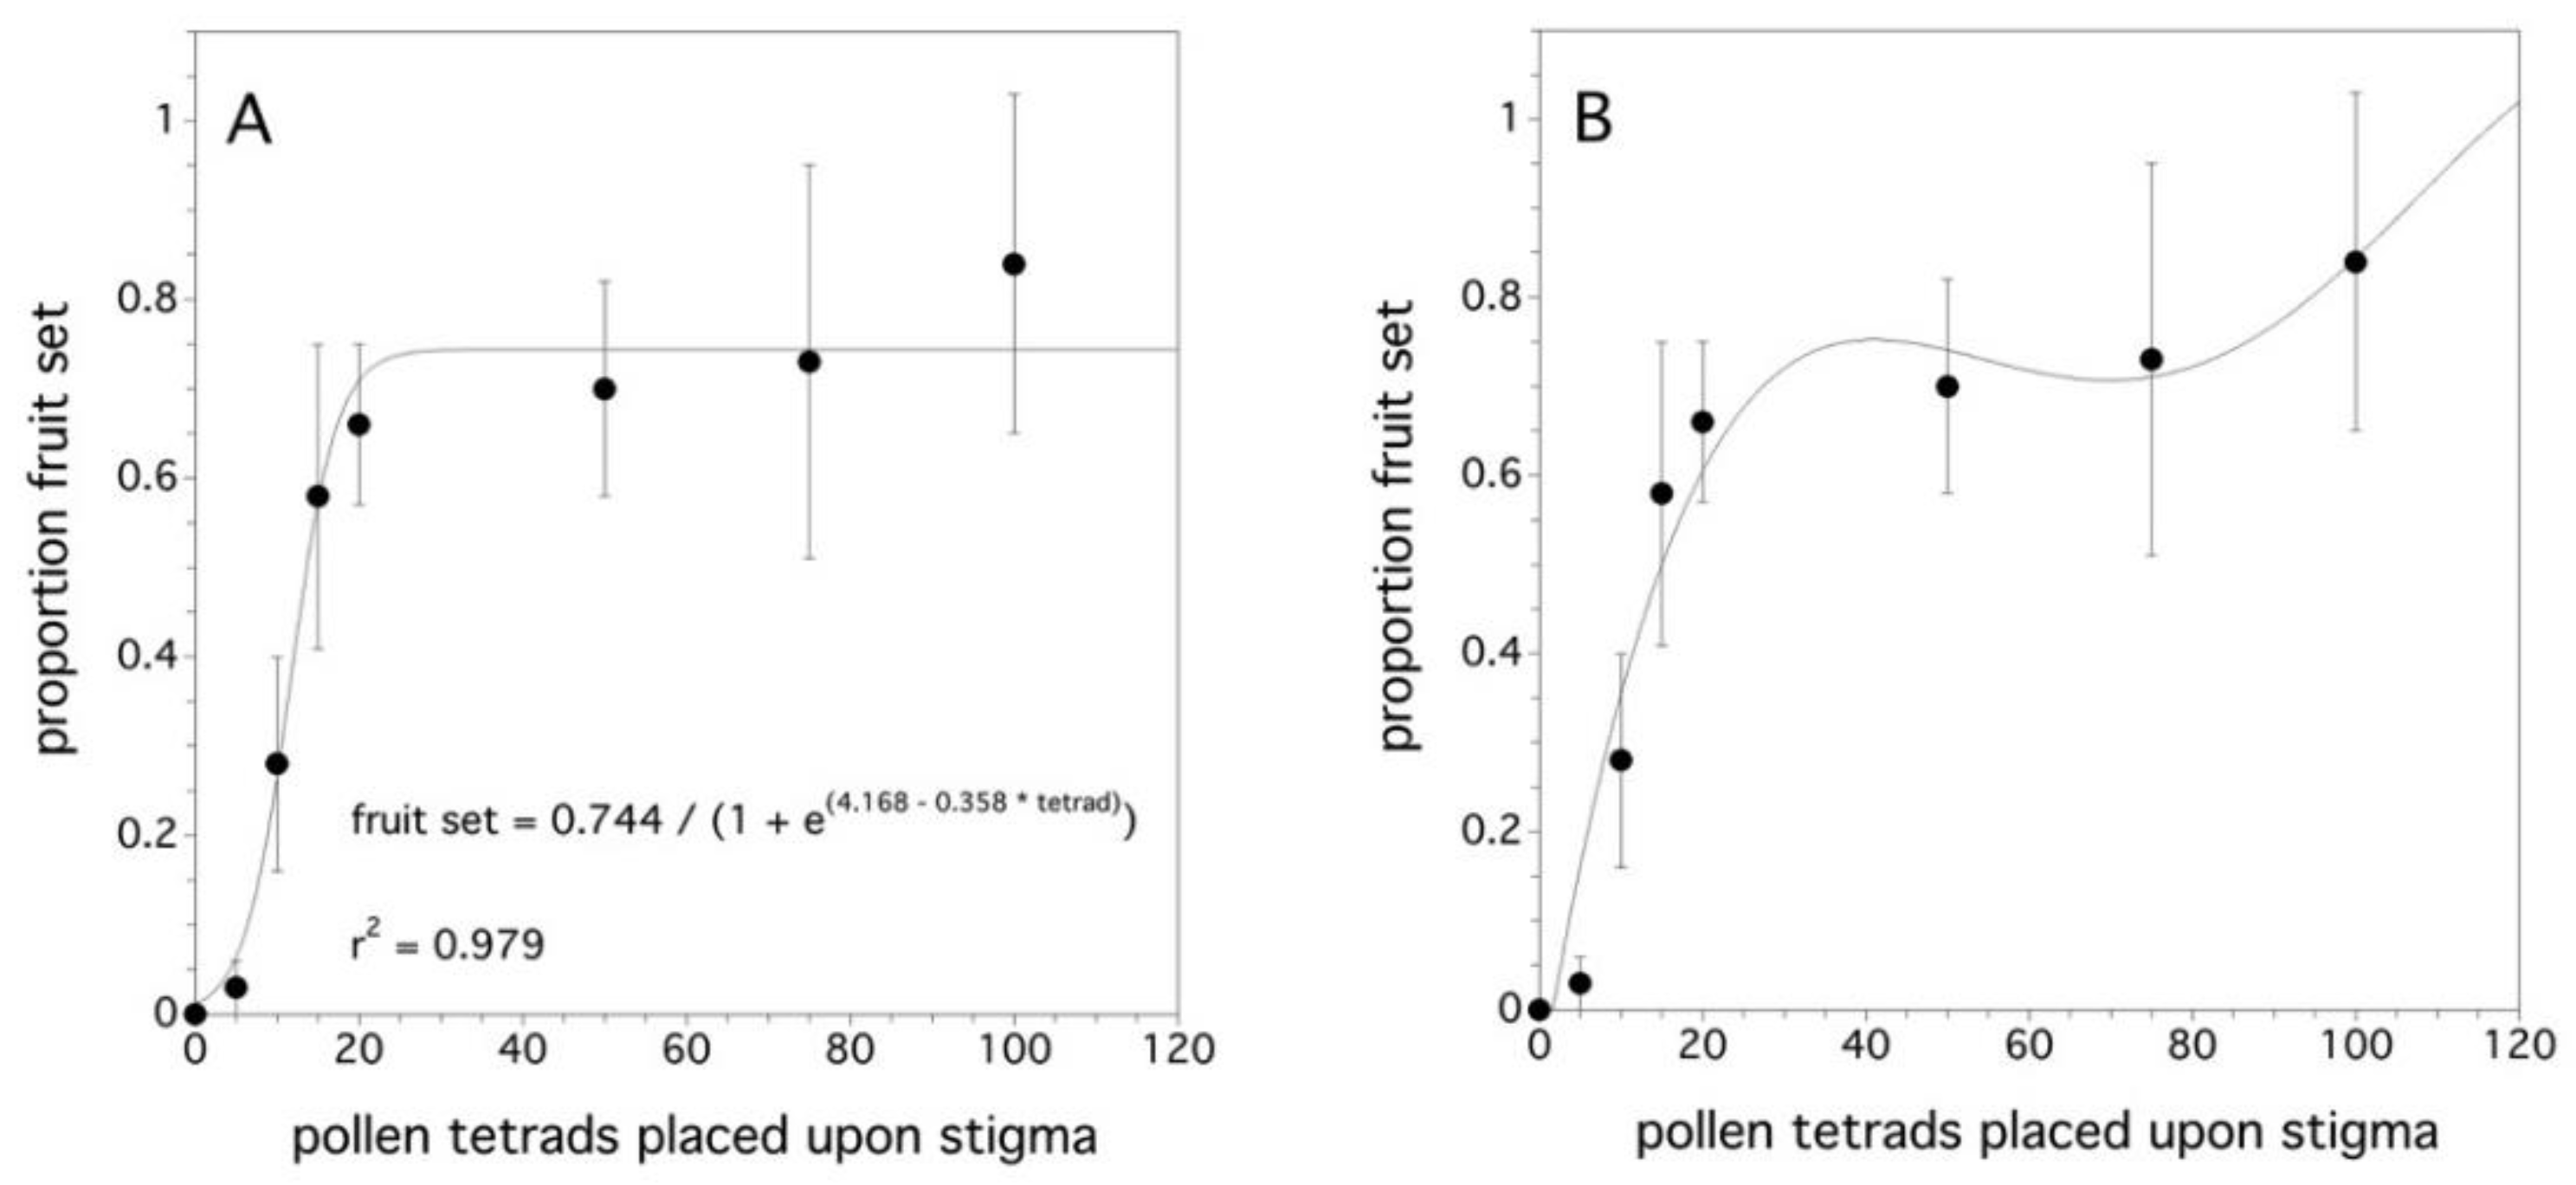
As the number of pollen tetrads placed upon a stigma increased, the proportion fruit set increased (χ2(1) = 95.108, p < 0.001). The difference among clones was not significant (p = 0.168). Figure 4A shows that a proportion fruit set asymptote occurs at about 25 tetrads per stigma. The asymptotic model was the initial hypothesis since the proportion fruit set cannot, in theory, exceed 1.0. However, Figure 4B suggests that another pattern might explain the relationship between the proportion fruit set and the pollen tetrad deposition on a stigma. This pattern appears to have an initial plateau and then approaches a proportion fruit set of 1.0 at a decreasing rate. However, there is high uncertainty due to the large variance.
3.4. Fruit Set and Seed Development in Fruit
A total of 1252 berries were collected and dissected over the duration of the study (2006, 2007, and 2011). The relationship between viable seeds/berry and berry mass is important because the viable number of seeds/berry reflects the intensity of pollination that a flower received with compatible pollen. In all three years, a significant relationship was found between within-field viable seeds/berry and berry mass (g). However, other factors affected this relationship. In 2006 (n = 6 fields), berry mass was significantly affected by all main effects (field (F(5,343) = 4.428, p = 0.0006), clone (F(9,372) = 4.497, p < 0.00061), and viable seeds/berry (F(1,418) = 4.428, p < 0.0001)). A seed * clone interaction was significant (F(9,438) = 2.276, p = 0.017), but not a field x seed, nor a field x clone x seed interaction (p > 0.05). The significant seed x clone interaction demonstrated that the relationship between viable seed number/seed and fruit mass was not parallel among clones, but that slopes differed, which suggests a possible physiological component to this phenomenon. This pattern could not be tested when observed in 2007 (n = 1 field), but there was a significant clone effect (F(17,144) = 2.861, p = 0.0003) and a viable seed/berry effect (F(1,144) = 30.748, p < 0.0001), but no clone x seed/berry interaction (p > 0.05). In 2011 (n = 12 fields), all the main effects were significant (field (F(11,350) = 17.989, p < 0.0001), clone (F(6,100) = 2.250, p = 0.044, viable seeds per berry (F(1,367) = 11.196, p = 0.0009)). There was a significant field x seed/berry interaction (F(11,365) = 3.219, p = 0.0003), but not a clone x seed/berry interaction. This suggests that, in 2011, the slopes of the viable seed/berry and berry mass regressions were significantly different for at least one of the fields.
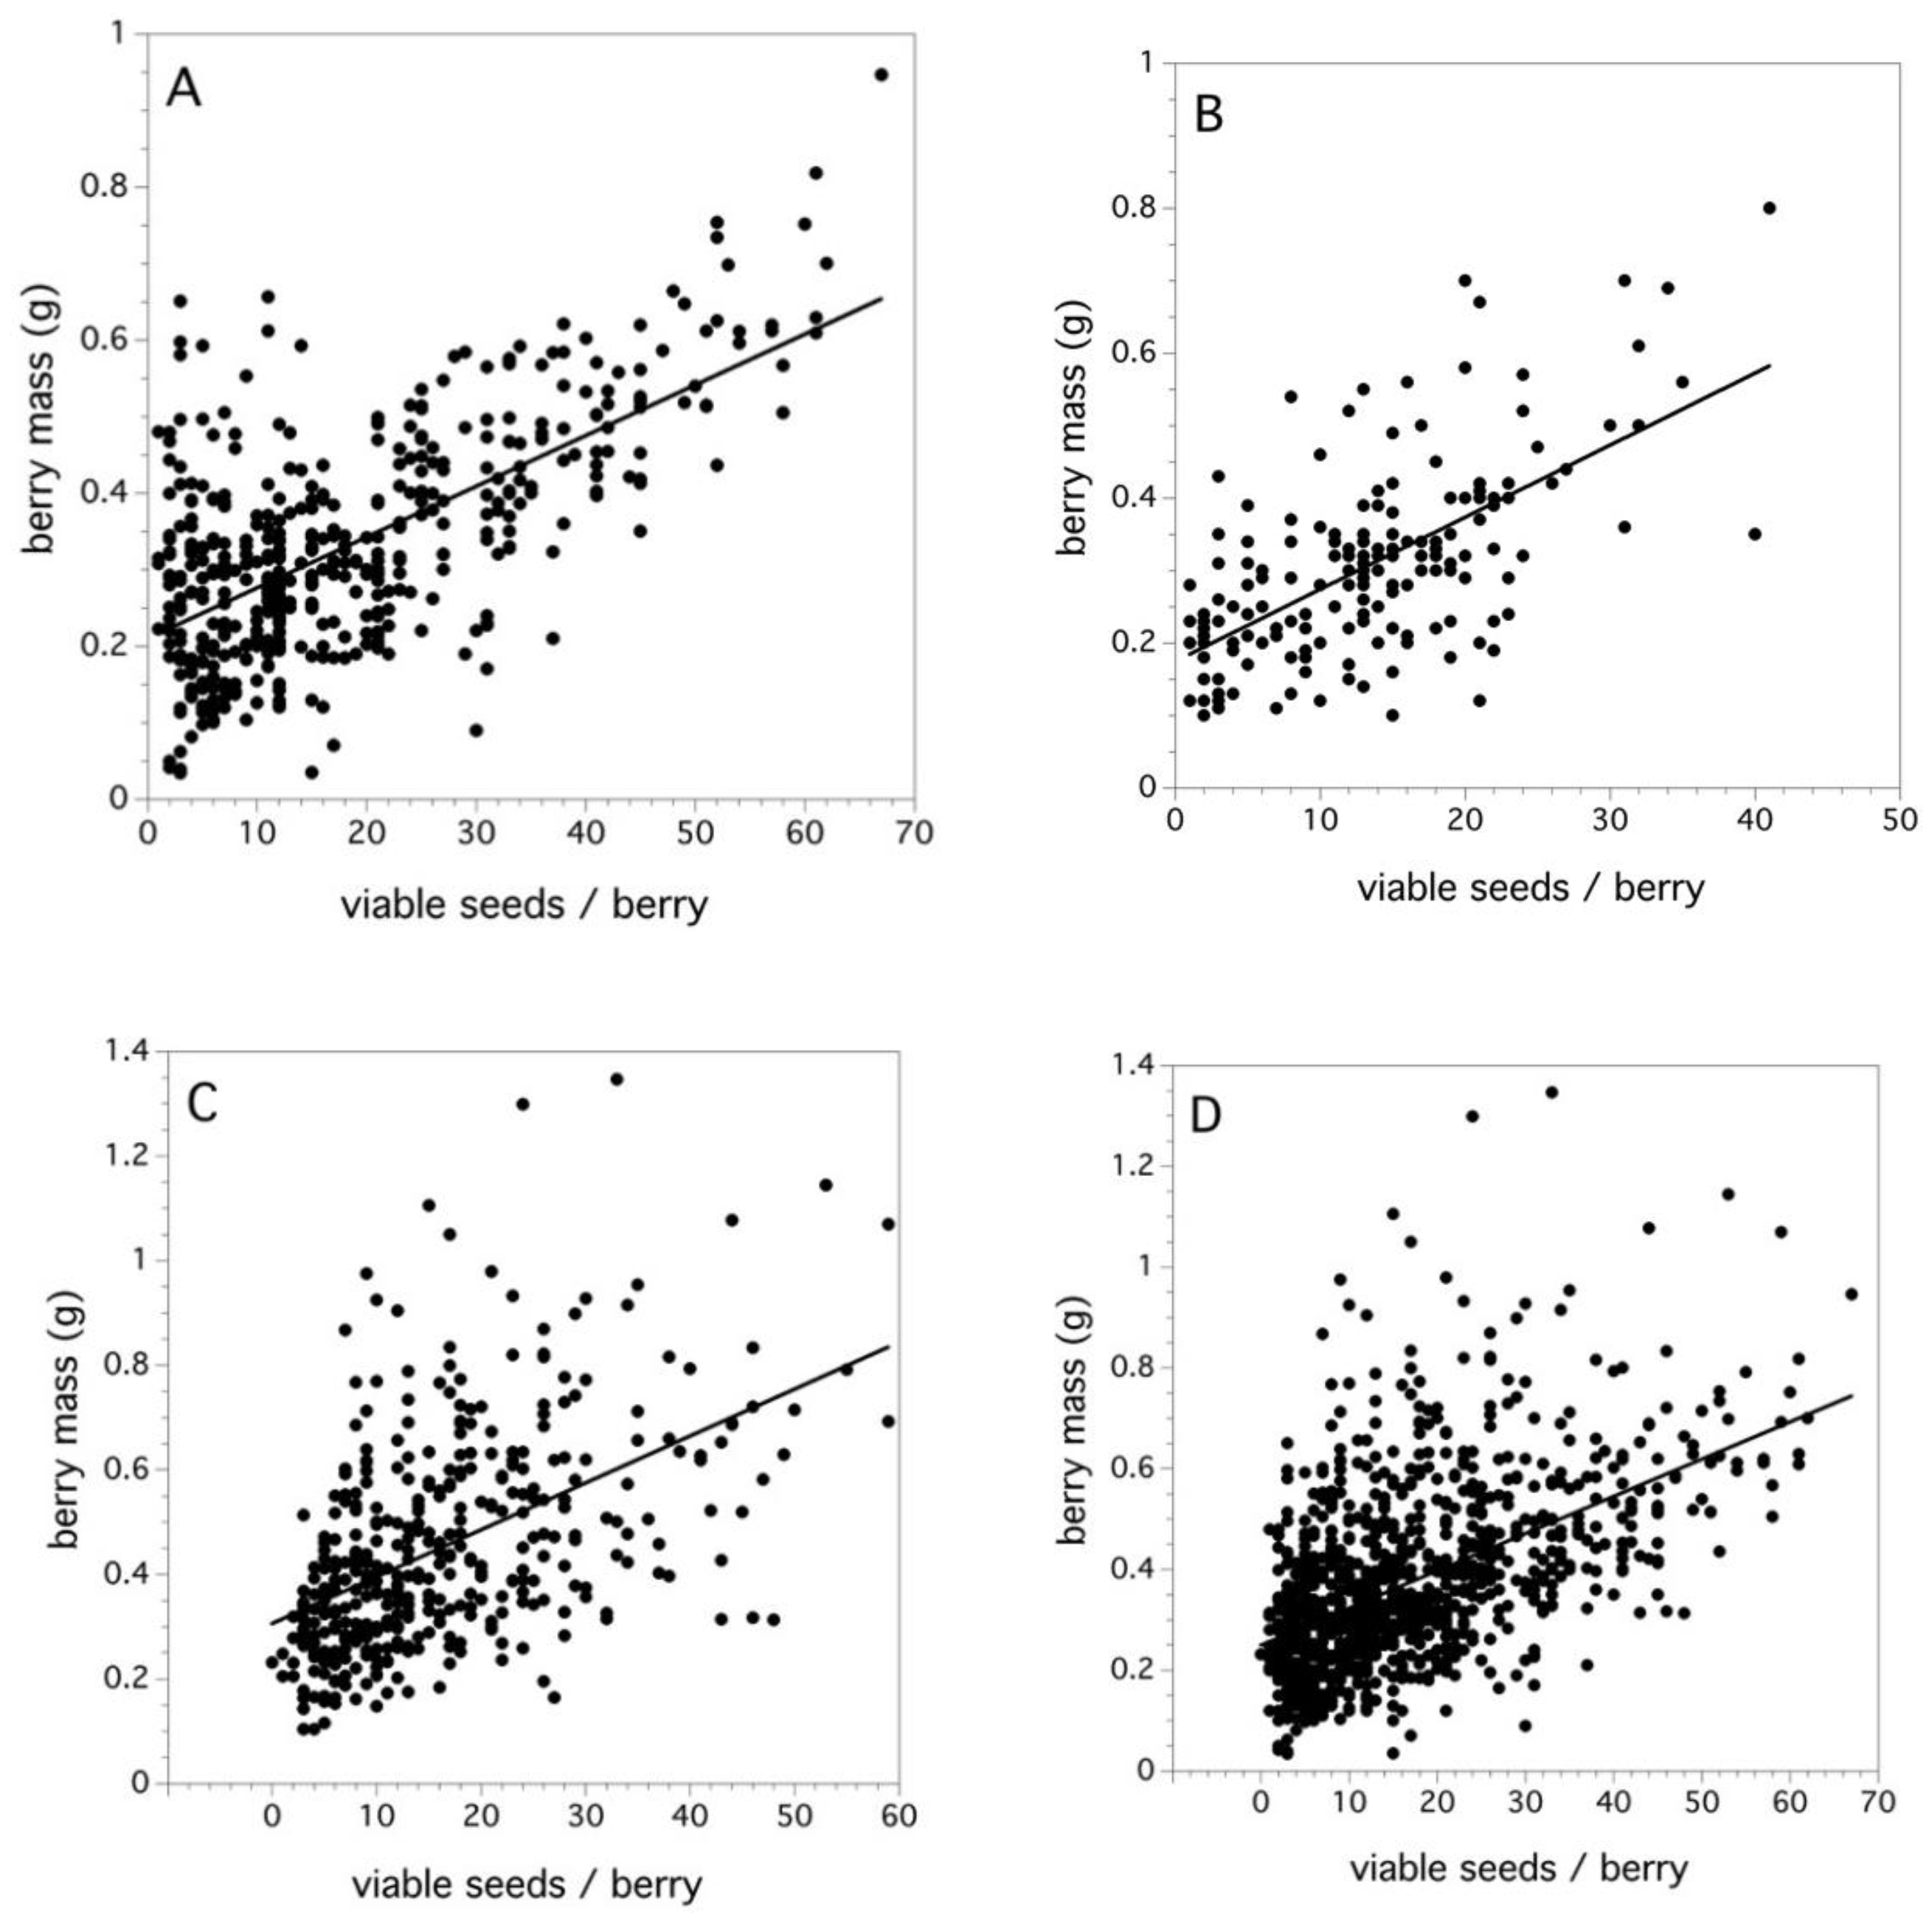
Figure 5A–C shows the relationship between viable seeds/berry and berry mass when the data is pooled over clones and fields for each of the three study years. For all three years and when all years were pooled together, the regression relationships were significant on Box-Cox transformed berry mass (2006: F(1,475) = 355.515, p < 0.0001, r2 = 0.429, β = 0.0066; 2007: F(1,178) = 118.727, p < 0.0001, r2 = 0.400, β = 0.0092; 2011: F(1,402) = 131.457, p < 0.0001, r2 = 0.258, β = 0.0089; all years: F(1,1059) = 382.218, p < 0.0001, r2 = 0.296, β = 0.0074). The slopes (β) = are not significantly different across all three years. Figure 5D, data pooled over all three years, suggests that, despite the effects of variation in maternal clone, soil fertility, and weather, a main factor determining berry mass is the intensity of pollination that the flower receives during bloom and this is reflected by the number of viable seeds per berry.
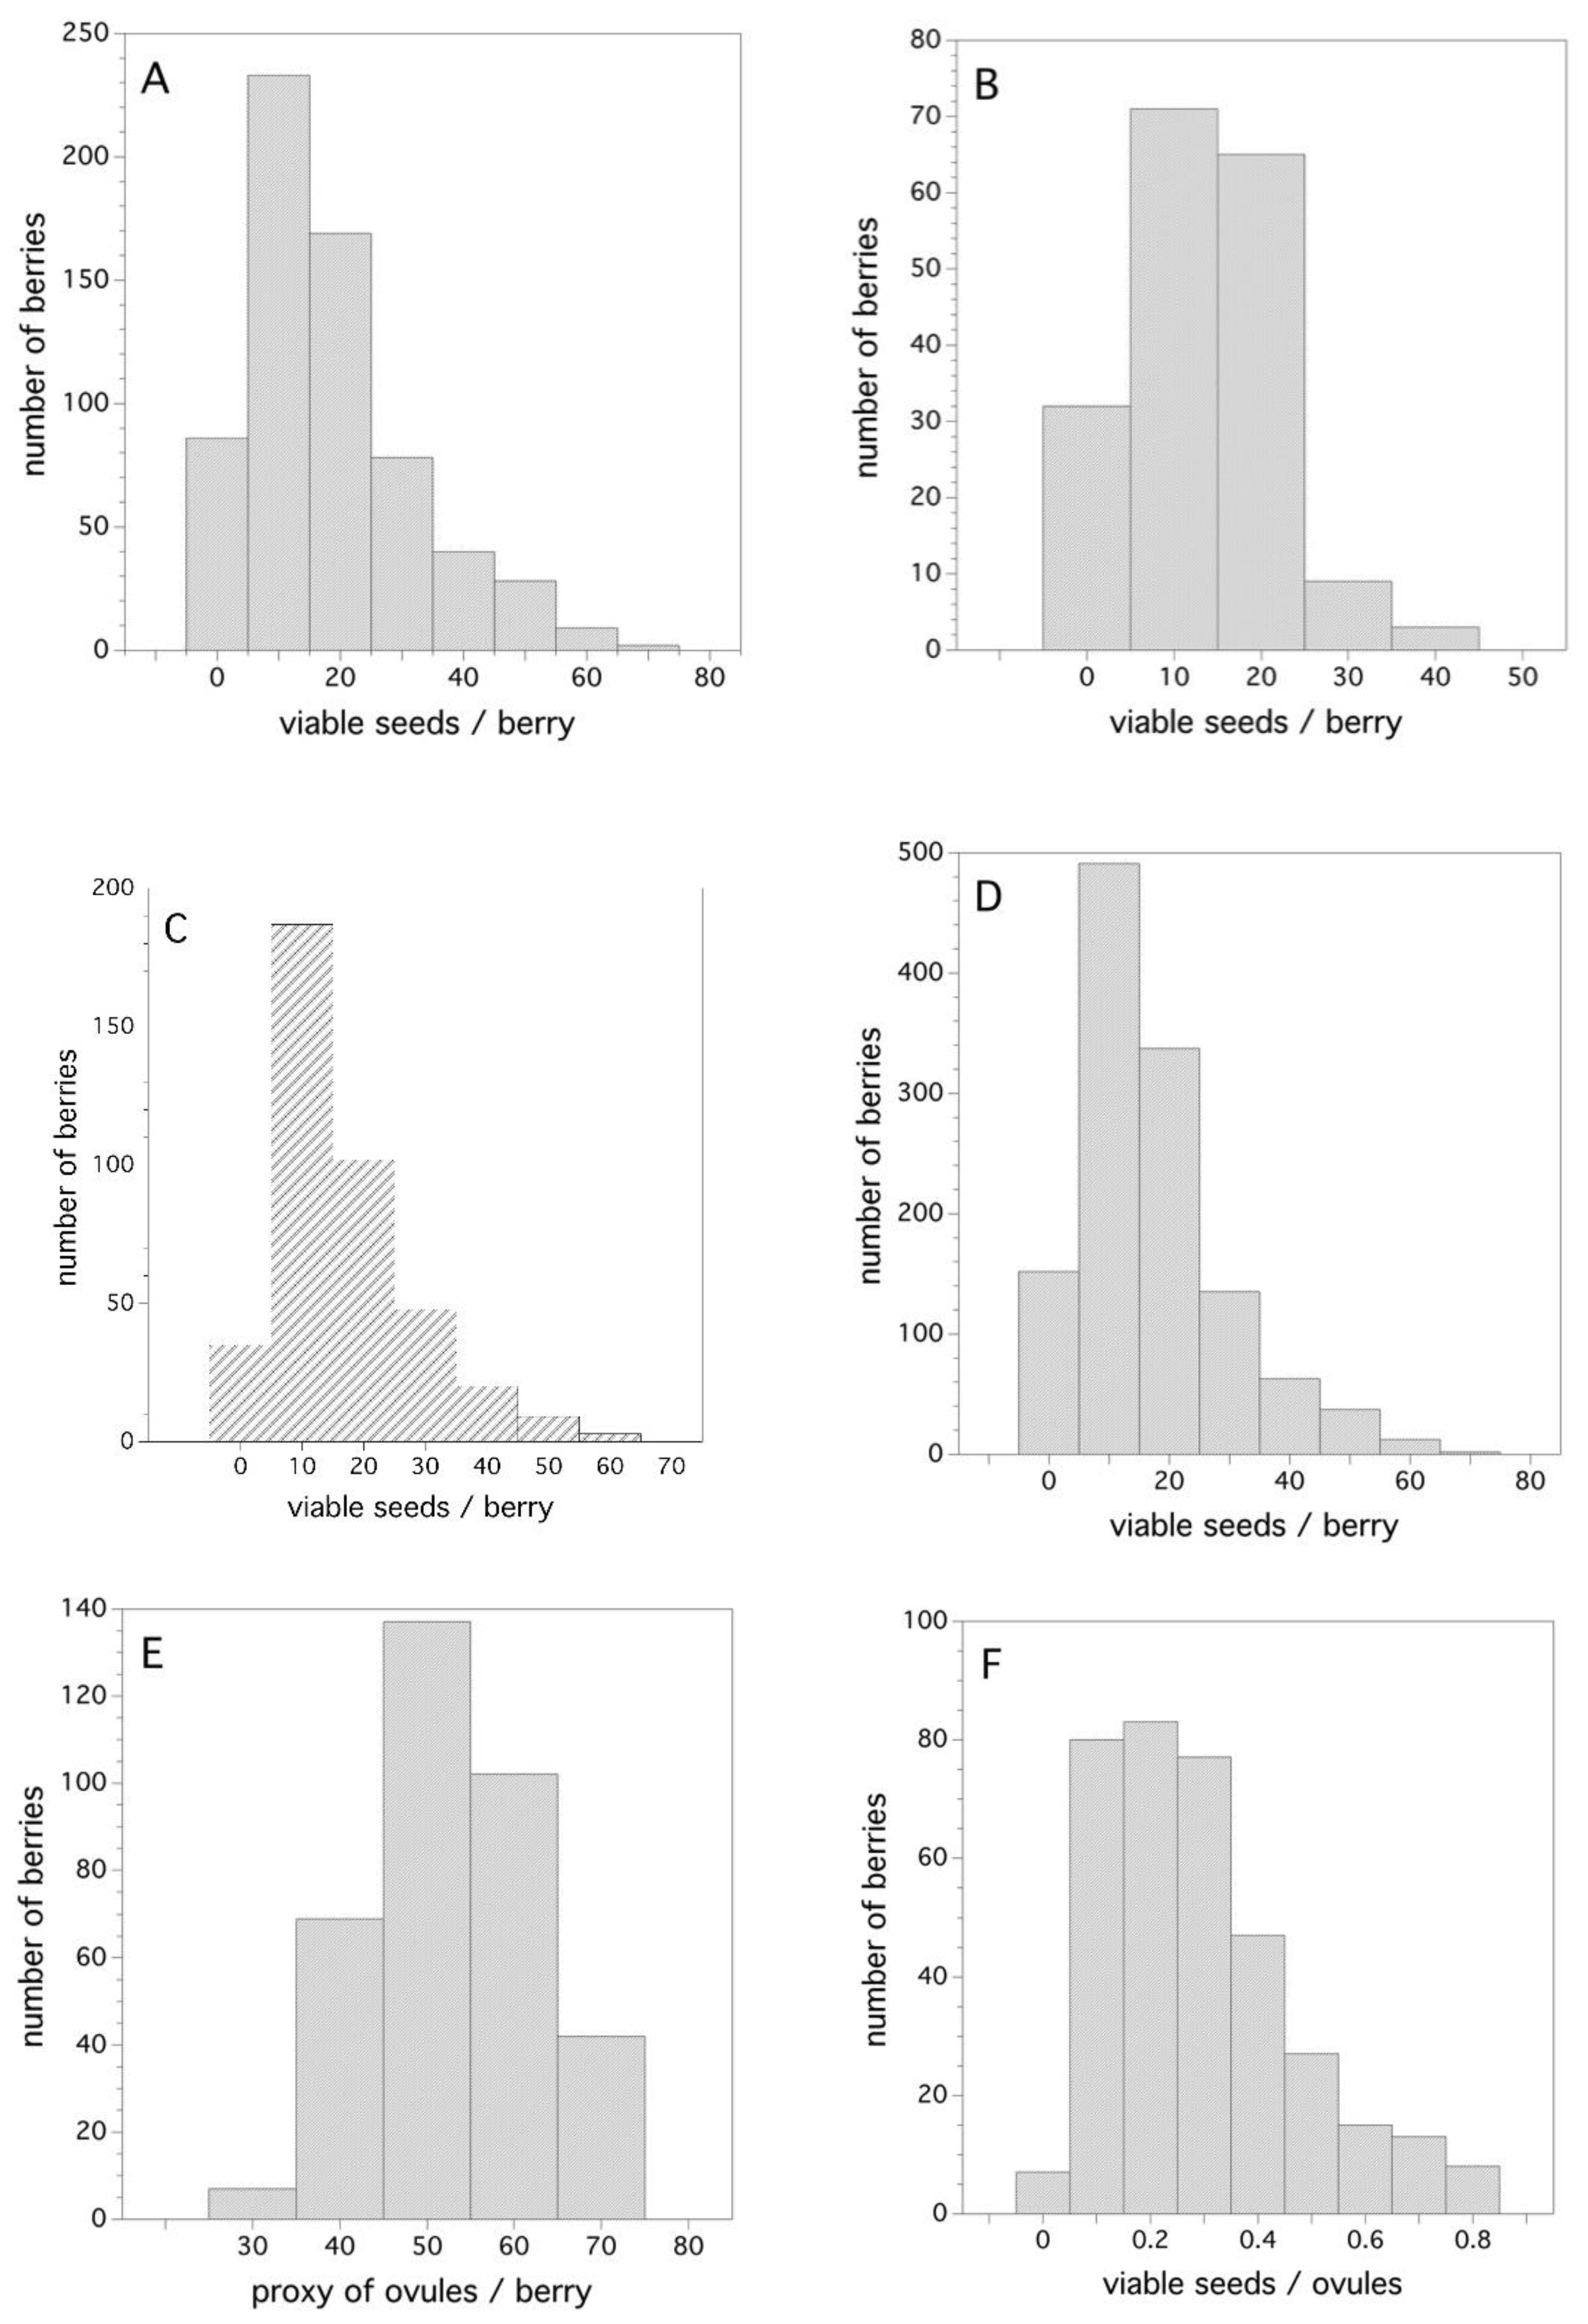
Figure 6A–D show the frequency distribution of viable seeds/berry for all three years (Figure 6A–C) and the combined data for all years (Figure 6D). The distributions are right skewed mostly due to the fact that they are zero truncated (cannot have negative numbers of viable seeds). A probability density function that best describes the frequency distribution for the combined three years (Figure 6D) is a two-parameter Gamma distribution where α = 1.8721 and σ = 8.929 (Cramer von Mises W test, p = 0.388). The estimated 50th, 75th, and 99th percentiles from this density function is: 14, 22, and 60 viable seeds/berry, respectively.
To put the number of seeds/berry in perspective, it is important to know how many potential ovules there are in a flower that can be fertilized after pollination. The frequency distribution for my proxy of the number of ovules that existed in the flowers, from which the berries were derived, is depicted in Figure 6E. As expected, this distribution is symmetrical about the mean and is well described by a Gaussian distribution with μ = 52.25 and σ = 9.06 (Shapiro-Wilk test, p = 0.17). Figure 6F shows the ratio of viable seeds (fertilized ovules with compatible pollen) and the number of proxy ovules. This is also a skewed frequency distribution with the estimated 50th, 75th, and 99th percentiles being 0.26, 0.39, and 0.84, respectively. The best-fit probability density function is also a two-parameter Gamma distribution, where α = 2.625 and σ = 0.109 (Cramer von Mises W test, p = 0.250).
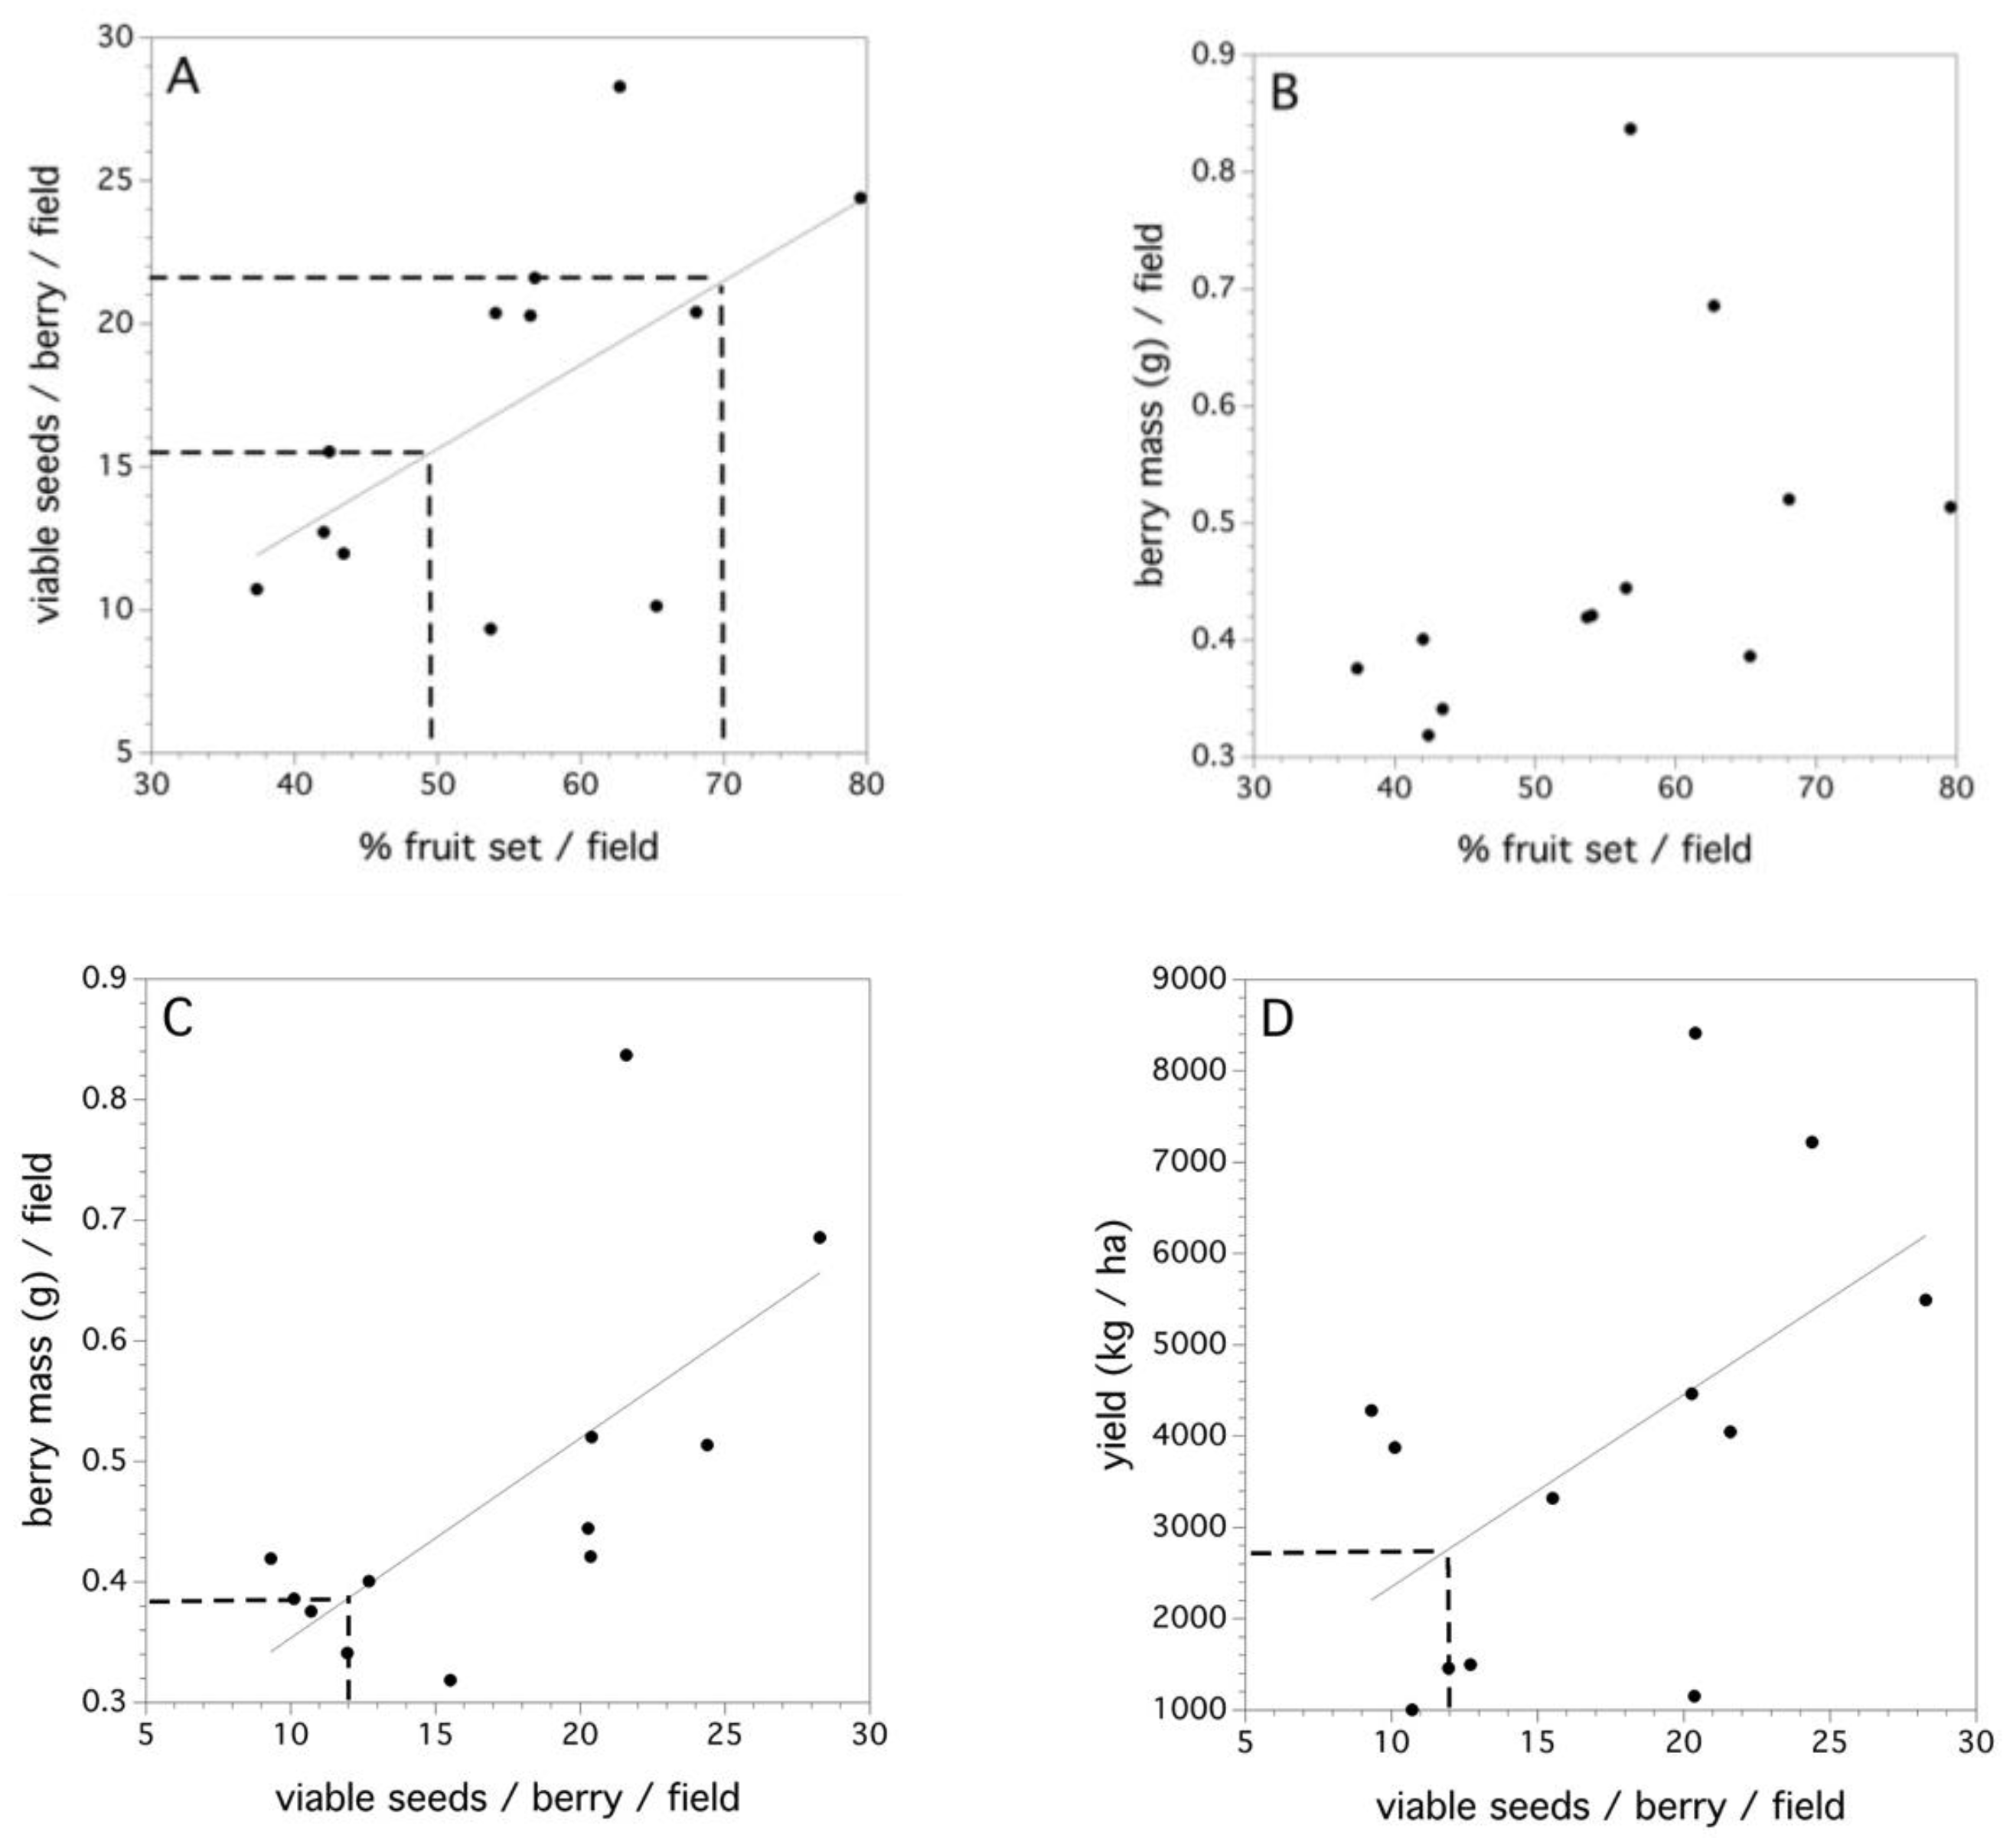
The 2011 data collected in 12 fields is the only data where estimates of fruit set and yield at the field level could be estimated (Figure 7A–D). There was a significant linear relationship between percent fruit set in each of the fields and the average number of viable seeds/berry (F(1,10) = 5.299, p = 0.044, r2 = 0.346, Figure 7A). High variance in the fruit set in this relationship can be seen when high numbers of viable seeds per berry occur in a field. The dashed lines in Figure 7A denotes moderate and excellent percent fruit set in the field [7]. Percent fruit set did not explain a significant proportion of the variation in the average berry mass (per berry) in a field (p = 0.149, Figure 7B). However, the average individual numbers of viable seeds per berry did explain a significant amount of the variation in average berry mass (F(1,10) = 8.759, p = 0.014, r2 = 0.467, Figure 7C). Therefore, percent fruit set determines the average number of viable seeds per berry and the average number of viable seeds per berry determines the average berry mass. The dashed line in Figure 7C depicts the number of pollen tetrads that, when placed upon a stigma, will result in a 0.50 likelihood of a berry (or 50% fruit set). Figure 7D shows that the average number of viable seeds per berry in a field can determine yield (F(1,10) = 4.899, p = 0.049, r2 = 0.304). However, there are considerable differences in yield for the same number of viable seeds per berry across fields. This most likely reflects the multitude of other factors that affect yield (see Reference [8]).
The 12 fields sampled in 2011 represented three replicates of each of the four production systems practiced in a wild blueberry culture in Maine (organic, low input, medium input, and high input). No significant effect of the production system (p > 0.05) on the average number of seeds per berry or average berry mass was observed. Evidence was found suggesting a significant effect of the production system on foraging bee densities (F(3,8) = 6.251, p = 0.017, r2 = 0.709), percent fruit set (F(3,8) = 6.059, p = 0.019, r2 = 0.694), and yield (kg/ha, F(3,8) = 5.442, p = 0.025, r2 = 0.671).
3.5. Decomposition of the Total Variance in the Fruit Set
In the first study (1966–1971), the variance in percent fruit set between stems was much higher than all other sources of variation (64.9–78.9%, Table 1). In the second study (2011–2015), between field variation explains 20.2% of the variance in percent fruit set, between year variation is the next highest (3.5–11.2%), and the clone and section were almost equal in explaining about 11% of the total variance in the percent fruit set combined.
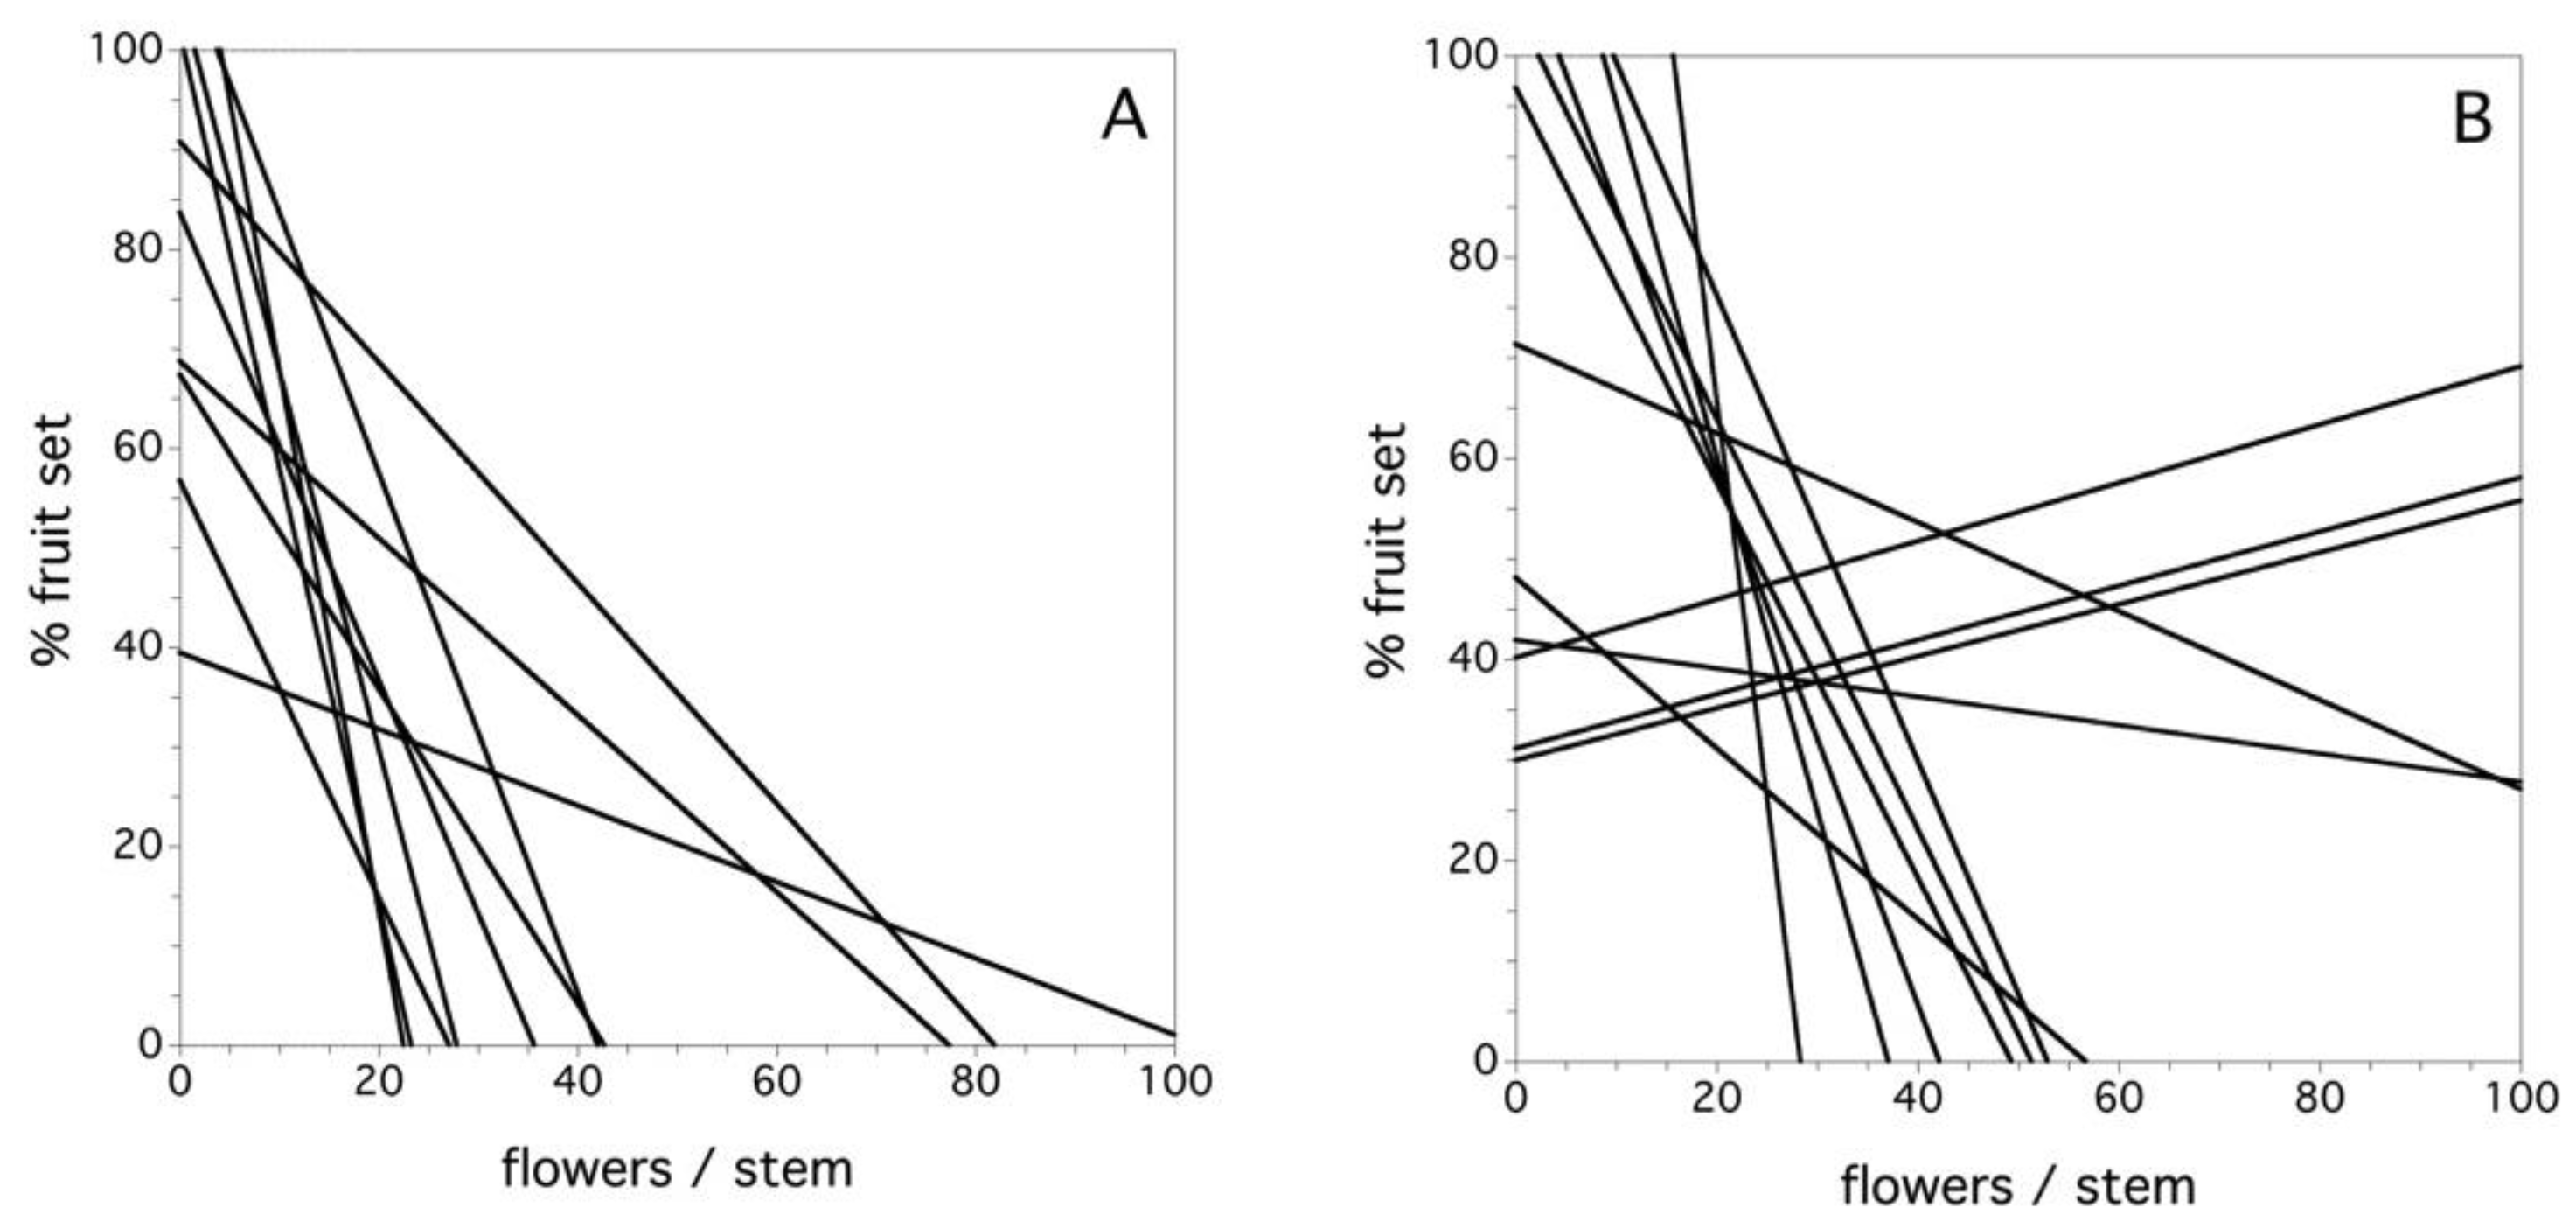
Figure 8A shows the relationship between flower number/stem and the percent fruit set in the field by clone for the year 1969 in the first study. In this year, all of the clones were characterized by a negative relationship between the flower density and the percent fruit set at varying levels of decline. Overall, during the six years of the first study, there was a significant negative relationship between the flower number per stem and the percent fruit set, but there was also a significant interaction among clone and flower density per stem (F(9, 1252) = 8.110, p < 0.0001). A similar relationship emerged in the second study. On average, there was a significant negative relationship between the flower number per stem and the percent fruit set, but there was also a significant interaction among clone and flower density per stem (F(11, 3346) = 2.029, p = 0.022). Figure 8B depicts this relationship for the 2013 year. In this case, three of 12 clones exhibited a positive relationship between flower density and percent fruit set. Therefore, in both studies, there was a predominance of lower levels of fruit set associated with higher flower densities/stem, but the interaction for both studies points to the fact that this relationship is quite variable and, in 2013, there are several exceptions to negative slopes in the relationship. I suspect that the exceptions are due to a combination of high pollinator densities and few flowers per stem in a given year.
4. Discussion
A degree day model for wild blueberry bloom in Maine has been developed and validated based upon field sampling in the two major growing areas in Maine for three years (2015–2017). This model is different from a previous model developed in Nova Scotia [71]. The model developed is based upon a higher base or threshold temperature, 4.4 °C vs. 0.0 °C, and degree day accum- ulation is initiated on 1 April in my model and 1 January in the Nova Scotia model. The Nova Scotia model did not always do well in providing predictions of bloom phenology in Maine, primarily because the soil always freezes in Maine winters, while Nova Scotia has a milder climate. When the soil is frozen and air temperatures are slightly above 0.0 °C, the wild blueberry is not energetically active, even if dormancy has been terminated [11]. The precision (percentage (s.e./mean)) for two years and two regions (<10%) is higher than the typical 20–25% precision often seen in field-based predictive models. Figure 2B suggests that bloom starts at 100 ° days (1.34% cumulative bloom) and ends at close to 500 ° days (99.85% cumulative bloom) or 22–28 days during May and June, on average. Currently, this model has been used to estimate the bloom period in a wild blueberry pollination simulation model [20] and a model for the impact of climate change on pollination of wild blueberries in Maine [22]. Maine wild blueberry growers have used this model to assess the threat of frost damage, mummy berry fungicide applications, and timing for importation of commercial pollinators, such as honeybees and bumble bees.
There does not appear to have been previous investigations into wild blueberry stigma longevity. A common methodology of determining stigma receptivity is to bioassay for the presence of wet stigmas and/or chemical constituents of the stigma surface exudates such as alcohol dehydrogenase and hydrogen peroxidase [78]. However, while these methods have been validated [79] and are a quick method to assess stigma receptivity, they only yield a qualitative assessment outlining receptive or not receptive factors. The measurement of the fruit set provides a more informative measure of stigma receptivity since it reflects a change in receptivity over time. There have been several studies of stigma receptivity in wild flowers, but fewer in crop plants. Egea et al. [80] showed that apricot cultivars have short stigma longevities of only four days. Gonzalez et al. [81] hand pollinating kiwi flowers found that stigma receptivity was viable only in one-to-four day old flowers, after which no fruit set occurred. They attributed stigma longevity as the main factor resulting in a short pollination period in kiwi, despite ovules appearing viable for 10 days post-anthesis. Almost all studies have shown short and decreasing stigma receptivity as flowers age (see Yi et al. [82] for almonds). A current hypothesis is that receptive stigmas are susceptible to infection by bacterial and fungal pathogens and, therefore, natural selection has resulted in a short stigma longevity relative to ovules and other floral tissues [83]. Wild blueberry may not be an exception to this phenomenon even though stigma longevity appears to be much longer than many crop plants at nine or 10 days (Figure 4A,B). The major pathogen is Monilinia vaccinii-corymbosi (Reade) causing mummy berry disease [84]. The fungal conidia are transmitted to wild blueberry stigmas mostly by bees. Conidia germinate and grow down the style and infect the ovary [85]. It is not known if the decrease in stigma receptivity to pollen tetrads is also the case with germinating M. vaccinii-corymbosi conidia.
When the stigma is maximally receptive to pollen (flower age: one to three days, Figure 4A,B), it was shown that, as the number of pollen tetrads placed on the stigma increased, the likelihood of the fruit set increased. As few as 5 tetrads resulted in a prediction of a 0.03 proportion fruit set, while 12 tetrads per stigma resulted in a 0.5 proportion fruit set. The initial hypothesis was that proportion fruit set would reach an asymptote at 1.0 and with an average of 63 ovules per ovary [69], this asymptote would plateau at 15–16 tetrads/stigma, if every tetrad produced four viable pollen tubes capable of producing four ovules in an ovary. In the asymptotic model (Figure 4A), the asymptote was 20 ± 9.1 pollen tetrads per stigma. However, fruit set levels did not reach 1.0, but rather 0.75. This might suggest that the plant was physiologically aborting early stage fruit. This “June” fruit drop is a common phenomenon [11] in wild blueberry as it is in apples, apricot, avocado, citrus, coffee, pears, and others [86,87]. It has been suggested that the fruit drop may be due to pollen limitation or nutrient or water stress after pollination during fruit development [88]. However, the polynomial model (Figure 4B) suggests that increasing pollen tetrad deposition beyond the quantities that I used in my experiment may have resulted in 100% fruit set. Observations in the laboratory suggest that it is not common for more than two pollen tubes to germinate from a wild blueberry pollen tetrad [11]. This has also been observed in cranberry [89]. The polynomial model may reflect a mechanism in which only high pollen tetrad densities on the stigma do three or four pollen tubes emerge from a tetrad, which results in the pattern of an initial plateau and then an increase in the proportion fruit set until a fruit set of 1.0 is reached (Figure 4B). The initial fruit set levels close to 100% in the field [11], but, often, subsequent fruit drop reduces the levels to much less (50% to 75%) [41]. Because sampling was not intensive enough to quantify early fruit drop in this experiment, it is not clear which model to put forward as a response to pollen tetrad deposition on wild blueberry stigmas. In addition, similar to the finding with wild blueberry, Cane and Schiffhauer [90] showed that an asymptotic model with fruit set levels of less than 1.0 is exhibited in cranberries. Brown and McNeil [91] suggest that the natural fruit drop is part of a bet hedging life history strategy and that cranberries always produce more flowers than they will bring to maturity. This is a possible hypothesis that might explain the wild blueberry asymptotic model and the plasticity in shifting resource allocation from the reproductive tissue to the vegetative tissue supports this type of life history strategy [60,61].
In cranberries, it has been demonstrated that yield is primarily explained by the fruit set and less by fruits mass, and little if any by the number of seeds per fruit [92]. However, the relationship between viable seeds per berry and berry mass in wild blueberry is a pollination phenomenon that has important implications in crop yield. Fruit set is a major determinant of wild blueberry yield [7], but, in this study, I suggest that pollen deposition on the stigma with compatible pollen results in fertilized ovules and, thus, viable seeds. I have just discussed that an increase in pollen deposition results in an increase in the fruit set. This, in turn, should result in an increase in the number of viable seeds per berry as more ovules are fertilized [17]. My field studies in 2006, 2007, and 2011 showed that an increase in the number of viable seeds per berry resulted in an increased berry mass (Figure 5A–D). The variation in berry mass explained by viable seeds per berry (coefficient of determination) ranges from 0.258 to 0.429, being 0.296 for all fields combined. This is a strong and consistent relationship (slopes ranged from 0.007–0.009), which may be explained in that soil fertility and plant water relations do not appear to affect wild blueberry individual fruit mass [93]. The distributions of viable seeds per berry were right skewed, which would be expected since the distributions are necessarily truncated at 0. The median values for these distributions ranged from 13–15 and, for all years combined, the median viable seeds per berry was 14. It is interesting that the pollen tetrad deposition study determined that an estimated 12 pollen tetrads placed on the stigma results in a 0.5 proportion fruit set. Therefore, the question is, does the median fruit set result in the median viable seeds per berry (14 viable seeds/berry)? The 10% (four viable seeds) and 99% (60 viable seeds) percentiles of seeds per berry characterizing these distributions appear to be a result of a low and high level of pollen tetrad deposition. Inspection of Figure 4A suggests that four pollen tetrads placed upon a stigma results in a 0.05 proportion fruit set and 60 pollen tetrads result in the maximum asymptotic level of the proportion fruit set. Therefore, it appears that the proportion fruit set not only determines the number of fruits that will develop from a given number of flowers after pollination, but it also determines the number of viable seeds per berry. This is borne out by the field level analysis of the 2011 study. Figure 7A shows that there is a significant relationship between the fruit set and viable seeds per berry at the field level. Because the viable seeds per berry determine berry mass and yield (Figure 6A–D and Figure 7D), then it can be seen that fruit set levels affect yield in both the number of fruits and the size of fruits. Snow [94] showed that a similar relationship occurs between the fruit set and seeds per fruit for the Passion Flower in Costa Rica, Passiflora vitifolia Kunth. He found that the pollen to seed set was a 1:1.6 ratio. Galen [95] found that the seed set in Jacob’s-ladder, Polemonium viscosum Nutt., was also pollen limited, which shows that an increase in pollen placed on the stigma with hand crosses increased the seed set in fruit. Delaplane et al. [96] list several crop plants where increased seed set, because of increased pollination, results in increased fruit size or mass.
The estimate of wild blueberry ovules per fruit does not appear to depart substantially from the floral estimate by Bell et al. [69]. They found a mean of 63 ± 8 (SD) and a range of 33–77 ovules per flower (n = 56 clones). My proxy estimate of ovules, based upon fruit dissection, was 52.25 ± 9.06 (SD) with a range of 27 to 70 ovules per flower. Therefore, the proxy derived from dissected fruit slightly underestimates the mean number of ovules per flower, but provides an accurate estimate of the range of ovules per flower. Dissections of berries producing frequency distributions of viable seeds/ovule could be used as a measure of pollination intensity. Comparisons of this metric to the number of bees/ha might be an effective means of estimating if an adequate density and species diversity of bees were present during bloom. In an obligate outcrossing, mostly self-incompatible plants where there is no equal mating success among genotypes [65], the species diversity of bees is important because they ensure “jump” dispersal foraging [20,24]. This ensures pollen is not only received from highly related neighboring clones [67,70]. Measures of the seed set as a measure of pollination intensity is often used for wild plant reproduction studies [97], but is not common in crop production [96]. However, in seed crops such as canola, it is a measure that is used [98]. I propose that this measure should be utilized more for berry crops since it provides a better insight into actual crop yield than the fruit set, which is only a potential yield measure [7].
Because the fruit set appears to determine the seed set and berry size in wild blueberries, it is important to know what the factors are that explain variation in fruit set. Yarborough et al. [8] showed that fruit set was negatively affected by the mummy berry disease, blueberry thrips infestation, and frost. The fruit set was positively affected by bee forager density and flower buds per stem. This study shows that variation among stems contribute most to the percent fruit set, greater than among years, and among fields. It appears that the variation in flower density per stem and the attraction, recruitment, and number of sequential flowers visited on a stem may explain this variation. Drummond [24] demonstrated that the number of wild blueberry flowers visited on a stem is bee species-dependent.
5. Conclusions
This study increases our knowledge of wild blueberry pollination and reproduction. The bloom period, flower (stigma) longevity, and pollen deposition and resulting fruit set can now be predicted in Maine and this can be an important tool for wild blueberry growers trying to estimate the best timing for importation of bees and for scientists modeling climate change, economics of bee pollination, and mummy berry disease management. In addition, I have shown that the level of fruit set determines the seed set and that the seed set determines berry size and yield. This is important because, for the first time, the fruit set, which is a function of bee foraging intensity, can be seen as more than just the number of berries, but also the size and quality of berries. Because of this, the seed set should be considered as a measure or tool to assess the adequacy of pollination in commercial fields. The importance of bee foraging in a heterogeneous environment, one where stems have a high variation of flowers, has been illustrated in assigning sources of variation to the fruit set, among stem variation contributing more of the proportion of total variance than variability due to the year, field, or clone.
This study and the published literature cited in the introduction have contributed to the development of a conceptual model of wild blueberry pollination that includes: (1) a predictive phenology of bloom, (2) stigma receptive longevity, (3) pollen genotype and non-reciprocity of outcrossing, (4) an understanding of genetic load and self-compatibility, (5) spatial genetic structure of genets, (6) gene flow as measured by pollen movement by bees, (7) bee species differential efficiency in pollen deposition, (8) pollen tetrad quantity on stigmas and resulting fruit set, (9) bee forager density efficacy and fruit set, and effects on fruit set by: (10) flower density per stem, (11) seed set, and (12) deleterious impacts of mummy berry disease, thrips, and frost. Two other aspects of wild blueberry reproduction that need to be incorporated into this conceptual model is: (1) the contribution of self-compatible clones and (2) the phenomena of the fruit drop as it relates to pollination and plant fitness. One could also add to this conceptual model the socio-economic aspects of wild blueberry pollination. This aspect of pollination is starting to receive more attention [99,100,101,102].
Author Contributions
F.D. is the sole author of this paper. The experimental designs, data collection, data analysis, and writing are his contribution. The study that was conducted between 1967 and 1971 was designed and conducted by Dutch Forsythe, but the analysis of this data, data interpretation, and writing of the conclusions were solely the contributions of F.D.
Funding
This research was made possible, in part, through support from the USDA National Institute of Food and Agriculture, Hatch project number ME0-21505, the Maine Agricultural and Forest Experiment Station. In addition, support was also received from a USDA/NIFA Specialty Crop research Initiative Grant 2011-01389 and the Wild Blueberry Commission of Maine. This is Maine Agricultural and Forest Experiment Station publication number 3699.
Acknowledgments
I would like to thank a good friend and colleague Daniel J. Bell for advice on the technique of hand pollination. I thank Dutch Forsythe for designing and conducting the clone variance study during the years 1967–1971. I also thank Elissa Ballman, Everett Booth, Hillary Morin, Sarah Watts, and Mary Plaisted, who spent countless hours dissecting fruit and counting seeds for this study. Judy Collins supervised much of the research conducted in the field. I am also grateful to the wild blueberry growers who allowed me to use their fields for experiments.
Conflicts of Interest
The author declares no conflict of interest. The funding agencies had no role in the design of the experiments, in the collection, analyses, or interpretation of the data, in the writing of the manuscript, or in the decision to publish the results.
References
- Rowland, L.J.; Drummond, F.A.; Graham, J.; Alkharouf, N.; Buck, E.J.; Hancock, J.F.; Bassil, N.V.; Finn, C.E.; Olmstead, J.W. Generating genomic tools for blueberry improvement. Int. J. Fruit Sci. 2012, 12, 276–287. [Google Scholar] [CrossRef]
- Aalders, L.E.; Hall, I.V.; Brydon, A.C. Yield of native clones of lowbush blueberry under cultivation. Fruit Var. J. 1978, 32, 64–67. [Google Scholar]
- Drummond, F.A.; Smagula, J.; Annis, S.; Yarborough, D. Organic Wild Blueberry Production. Univ. Maine Agric. For. Exp. Stn. Tech. Bull. 2009, 852, 43. [Google Scholar]
- Yarborough, D.E. Wild Blueberry Culture in Maine. Wild Blueberry Fact Sheet. No. 220, Bulletin No. 2088. 2009. Available online: https://extension.umaine.edu/blueberries/factsheets/production/wild-blueberry-culture-in-maine/ (accessed on 6 March 2019).
- Jones, M.S.; Vanhanen, H.; Peltola, R.; Drummond, F.A. A global review of arthropod-mediated ecosystem-services in Vaccinium berry agroecosystems. Terr. Arthro. Rev. 2014, 7, 41–78. [Google Scholar] [CrossRef]
- Strik, B.C.; Yarborough, D.E. Blueberry production trends in North America, 1992 to 2003, and predictions for growth. HortTechnology 2005, 15, 91–398. [Google Scholar] [CrossRef]
- Asare, E.; Hoshide, A.K.; Drummond, F.A.; Chen, X.; Criner, G.K. Economic risk of bee pollination in Maine wild blueberry, Vaccinium angustifolium Aiton. J. Econ. Entomol. 2017, 110, 1980–1992. [Google Scholar] [CrossRef]
- Yarborough, D.; Drummond, F.A.; Annis, S.; D’Appollonio, J. Maine wild blueberry systems analysis. Acta Hort. 2017, 1180, 151–160. [Google Scholar] [CrossRef]
- Bushmann, S.; Drummond, F.A. Abundance and diversity of wild bees (Hymenoptera: Apoidea) found in lowbush blueberry growing regions of Downeast Maine. Environ. Entomol. 2015, 43, 1–15. [Google Scholar] [CrossRef]
- Cutler, C.G.; Reeh, K.W.; Sproule, J.M.; Ramanaidu, K. Berry unexpected: Nocturnal pollination of lowbush blueberry. Can. J. Plant Sci. 2012, 92, 707–711. [Google Scholar] [CrossRef] [Green Version]
- Drummond, F.A.; (University of Maine, Orono, ME, USA). Personal communication, 2019.
- Dicenta, F.; Ortega, E.; Canovas, J.A.; Egea, J. Self-pollination vs. cross-pollination in almond: Pollen tube growth, fruit set and fruit characteristics. Plant Breeding 2002, 121, 163–167. [Google Scholar] [CrossRef]
- Scorza, R.; Bassi, D.; Liverani, A. Genetic interactions of pillar (columnar), compact, and dwarf peach tree genotypes. J. Am. Soc. Hort. Sci. 2002, 127, 254–261. [Google Scholar] [CrossRef]
- Frankel, R.; Galun, E. Pollination Mechanisms, Reproduction and Plant Breeding; Springer Science & Business Media: Berlin, Germany, 2012; Volume 2, 284p. [Google Scholar]
- Ramírez, F.; Davenport, T.L. Apple pollination: A review. Sci. Hort. 2013, 162, 188–203. [Google Scholar] [CrossRef]
- Hepler, P.R.; Yarborough, D.E. Natural variability in yield of lowbush blueberries. J. Am. Soc. Hort. Sci. 1991, 26, 245–246. [Google Scholar] [CrossRef]
- Bell, D.J.; Rowland, L.J.; Smagula, J.; Drummond, F.A. Recent advances in the biology and genetics of lowbush blueberry. Maine Agric. For. Exp. Stn. Tech. Bull. 2009, 203, 36. [Google Scholar]
- Bell, D.J.; Rowland, L.J.; Stommel, J.; Drummond, F.A. Yield variation among clones of lowbush blueberry as a function of kinship and self-compatibility. J. Hort Sci. 2010, 135, 1–12. [Google Scholar]
- Bajcz, A.; Hiebeler, D.; Drummond, F.A. Grid-Set-Match, an agent-based simulation model, predicts fruit set for the Maine lowbush blueberry (Vaccinium angustifolium) agroecosystem. Ecol. Model. 2017, 361, 80–94. [Google Scholar] [CrossRef]
- Qu, H.; Drummond, F.A. Simulation-based modeling of wild blueberry pollination. Electr. Comp. Agric. 2018, 144, 94–101. [Google Scholar] [CrossRef]
- Boulanger, L.W.; Wood, G.W.; Osgood, E.A.; Dirks, C.O. TB26: Native Bees Associated with the Low-Bush Blueberry in Maine and Eastern Canada. Maine Life Sci. Tech. Bull. 1967, 26, 23. [Google Scholar]
- Drummond, F.A.; Dibble, A.C.; Stubbs, C.; Bushmann, S.; Ascher, J.; Ryan, J. A natural history of change in native bees associated with lowbush blueberry in Maine. Northeast. Nat. 2017, 24, 49–68. [Google Scholar] [CrossRef]
- Javorek, S.K.; Mackenzie, K.E.; Vander Kloet, S.P. Comparative pollination effectiveness among bees (Hymenoptera: Apoidea) on lowbush blueberry (Ericaceae: Vaccinium angustifolium). Ann. Entomol. Soc. Am. 2002, 95, 345–351. [Google Scholar] [CrossRef]
- Drummond, F.A. Behavior of bees associated with the wild blueberry agro-ecosystem in the USA. Inter. J. Entomol. Nematol. 2016, 2, 27–41. [Google Scholar]
- Wood, G.W. The influence of honeybee pollination on fruit set of the lowbush blueberry. Can. J. Plant Sci. 1961, 41, 332–335. [Google Scholar] [CrossRef]
- Aras, P.; De Oliveira, D.; Savoie, L. Effect of a honey bee (Hymenoptera: Apidae) gradient on the pollination and yield of lowbush blueberry. J. Econ. Entomol. 1996, 89, 1080–1083. [Google Scholar] [CrossRef]
- Eaton, L.J.; Murray, J.E. Relationships of pollinator numbers in blueberry fields to fruit development and yields. Acta Hort. 1996, 446, 181–188. [Google Scholar] [CrossRef]
- Drummond, F.A.; Stubbs, C.S. Potential for management of the blueberry bee, Osmia atriventris Cresson. Acta Hort. 1997, 446, 77–86. [Google Scholar] [CrossRef]
- Stubbs, C.S.; Drummond, F.A. Pollination of wild lowbush blueberry, Vaccinium angustifolium by the alfalfa leafcutting bee, Megachile rotundata. Acta Hort. 1997, 446, 189–196. [Google Scholar] [CrossRef]
- Stubbs, C.S.; Drummond, F.A. Management of the alfalfa leafcutter bee, Megachile rotundata (Hymenoptera: Megachilidae), for pollination of wild lowbush blueberry. J. Kan. Ent. Soc. 1997, 70, 81–93. [Google Scholar]
- Stubbs, C.S.; Drummond, F.A.; Yarborough, D. How to Manage Alfalfa Leafcutting Bees for Wild Blueberry Pollination. Wild Blueberry Fact Sheet. No. 300, Bulletin No. 2413. 1997. Available online: https://extension.umaine.edu/blueberries/factsheets/bees/300-how-to-manage-alfalfa-leafcutting-bees-for-wild-blueberry-production/ (accessed on 6 March 2019).
- Stubbs, C.S.; Drummond, F.A.; Allard, S.L. Bee conservation and increasing Osmia spp. in Maine wild blueberry fields. Northeast. Nat. 1997, 4, 133–144. [Google Scholar] [CrossRef]
- Stubbs, C.S.; Drummond, F.A.; Yarborough, D. Field Conservation Management of Native Leafcutting and Mason Osmia Bees. Wild Blueberry Fact Sheet. No. 301, Bulletin No. 2420. 2000. Available online: https://extension.umaine.edu/blueberries/factsheets/bees/301-field-conservation-management-of-native-leafcutting-and-mason-osmia-bees/ (accessed on 6 March 2019).
- Stubbs, C.S.; Drummond, F.A. Bombus impatiens (Hymenoptera: Apidae): An alternative to Apis mellifera (Hymenoptera: Apidae) for lowbush blueberry pollination. J. Econ. Entomol. 2001, 94, 609–616. [Google Scholar] [CrossRef] [PubMed]
- Stubbs, C.S.; Drummond, F.A.; Osgood, E.A. Osmia ribifloris biedermannii and Megachile rotundata (Hymenoptera: Megachilidae) introduced into the lowbush blueberry agroecosystem in Maine. J. Kansas Ent. Soc. 1994, 67, 173–185. [Google Scholar]
- Stubbs, C.; Drummond, F.A. Blueberry and cranberry (Vaccinium spp.) pollination: A comparison of managed and native bee foraging behavior. Acta Hort. 1997, 437, 341–343. [Google Scholar] [CrossRef]
- Stubbs, C.S.; Drummond, F.A. Pollination of lowbush blueberry by Anthophora pallipes villosula and Bombus impatiens (Hymenoptera: Anthophoridae and Apidae). J. Kan. Entomol. Soc. 2000, 72, 330–333. [Google Scholar]
- Stubbs, C.S.; Drummond, F.A.; Yarborough, D. Commercial Bumble Bee, Bombus impatiens, Management for Lowbush Blueberry. Wild Blueberry Fact Sheet. No. 302, Bulletin No. 2421. 2001. Available online: https://extension.umaine.edu/blueberries/factsheets/bees/302-commercial-bumble-bee-bombus-impatiens-management-for-wild-blueberry-pollination/ (accessed on 6 March 2019).
- Desjardins, È.C.; De Oliveira, D. Commercial bumble bee, Bombus impatiens (Hymenoptera: Apidae) as a pollinator in lowbush blueberry (Ericale: Ericaceae) fields. J. Econ. Entomol. 2006, 99, 443–449. [Google Scholar] [CrossRef]
- Eaton, L.J.; Nams, V.O. Honey bee stocking numbers and wild blueberry production in Nova Scotia. Can. J. Plant Sci. 2012, 92, 1305–1310. [Google Scholar] [CrossRef]
- Drummond, F.A. Commercial bumblebee pollination of lowbush blueberry. Int. J. Fruit Sci. 2012, 12, 54–64. [Google Scholar] [CrossRef]
- Venturini, E.M.; Drummond, F.A.; Ballman, E. Native Andrena response to burning in the wild blueberry agroecosystem. J. Kan. Entomol. Soc. 2017, 90, 131–145. [Google Scholar] [CrossRef]
- Drummond, F.; Collum, K.; Hanes, S.; Wilson, M.; Skinner, J.; Collins, J. A Pollination Toolbox for Wild Blueberry Growers. In Proceedings of the NABREW Conference 2014, Atlantic City, NJ, USA, 24 June 2014; Available online: http://0-dx-doi-org.brum.beds.ac.uk/doi:10.7282/T3NZ8980 (accessed on 6 March 2019).
- Kevan, P.G. Forest application of the insecticide Fenitrothion and its effect on wild bee pollinators (Hymenoptera: Apoidea) of lowbush blueberries (Vaccinium spp.) in Southern New Brunswick. Can. Biol. Conserv. 1975, 7, 301–309. [Google Scholar] [CrossRef]
- Stubbs, C.S.; Drummond, F.A. Asana, impact on alfalfa leafcutting bees and other pollinators. Arthro. Manag. Tests 1998, 23, 52. [Google Scholar] [CrossRef]
- Drummond, F.A.; Stubbs, C.S. Wild Bee Conservation for Wild Blueberry Fields. Wild Blueberry Fact Sheet. No. 630, Bulletin No. 2111. 2003. Available online: https://extension.umaine.edu/blueberries/factsheets/bees/630-wild-bee-conservation-for-wild-blueberry-fields/ (accessed on 6 March 2019).
- Bushmann, S.L.; Drummond, F.A.; Beers, L.A.; Groden, E. Wild bumblebee (Bombus) diversity and Nosema (Microsporidia: Nosematidae) infection levels associated with lowbush blueberry (Vaccinium angustifolium) production and commercial bumblebee pollinators. Psyche 2012, 429398. [Google Scholar] [CrossRef]
- Venturini, E.M.; Berg-Stack, L.; Dibble, A.; Drummond, F.A.; Hoshide, A. Enhancing Native Bees for Wild Lowbush Blueberry Crop Pollination: Bee Pasture. Wild Blueberry Fact Sheet. 2015. Available online: http://umaine.edu/blueberries/files/2010/05/2015-Bee-Pasture-Fact-Sheet.pdf (accessed on 6 March 2019).
- Venturini, E.M.; Drummond, F.A.; Hoshide, A.K.; Dibble, A.C.; Stack, L.B. Pollination reservoirs in Maine lowbush blueberry. J. Econ. Entomol. 2017, 110, 333–346. [Google Scholar] [PubMed]
- Cote, J.; Yarborough, D.E.; Drummond, F.A.; Collins, J.A. Maine Wild Blueberry Pesticide Chart–1 of 3. 2018. Available online: http://umaine.edu/blueberries/files/2010/05/2013-ME-Wild-BB-Pesticide-Chart-Insecticides.pdf (accessed on 6 March 2019).
- Dibble, A.C.; Leach, M.; Drummond, F.A. Pollinator habitat: Demonstration gardens at two sites in Maine, a cooperative project between the landfill industry and wild blueberry growers. J. Exten. Rural Devel. 2018, 10, 89–98. [Google Scholar] [CrossRef]
- Venturini, E.M.; Drummond, F.A.; Hoshide, A.K. Organic establishment of pollination reservoirs in the lowbush blueberry (Ericales: Ericaceae) agroecosystem. Open Agric. 2018, 3, 393–403. [Google Scholar] [CrossRef]
- Calderwood, L.; Drummond, F.A. Bees–IPM Tactics to Reduce Pesticide Exposure to Honey and Native Bees. Wild Blueberry Fact Sheet. No. 2009. 2009. Available online: https://extension.umaine.edu/blueberries/factsheets/bees/2009-ipm-tactics-to-reduce-pesticide-exposure-to-honey-and-native-bees/ (accessed on 6 March 2019).
- Stubbs, C.S.; Jacobson, H.A.; Osgood, E.A.; Drummond, F.A. Alternative forage plants for native (wild) bees associated with lowbush blueberry, Vaccinium spp., in Maine. Maine Agric. For. Exp. Stn. Tech. Bull. 1992, 148, 54. [Google Scholar]
- Drummond, F.A.; Stubbs, C.S. Sampling bee populations in lowbush blueberry in Maine. Proc. VI Int. Symp. on Vaccinium Cult. Acta Hort. 1997, 446, 101–108. [Google Scholar] [CrossRef]
- Drummond, F.A.; Ballman, E.; Collins, J. Are They Weeds or a Life Force? Or Sustainability on the Edge. Spire Maine J. Cons. Sustain. 2017. Available online: https://umaine.edu/spire/2017/05/04/drummond-et-al/ (accessed on 6 March 2019).
- Groff, S.C.; Loftin, C.S.; Drummond, F.A.; Bushmann, S.; McGill, B. Spatial prediction of lowbush blueberry native bee pollinators in Maine, USA. Environ. Model. Soft. 2016, 79, 1–9. [Google Scholar] [CrossRef]
- Du Clos, B.; Loftin, C.; Drummond, F.A. BeeMapper tool Quick reference Guide. 2017. Available online: https://umaine.edu/beemapper/wp-content/uploads/sites /353/2017/07/ BeeMapper-Quick-Guide-for-Web.pdf (accessed on 6 March 2019).
- Drummond, F.A.; Yarborough, D. Growing season effects on wild blueberry (Vaccinium angustifolium) in Maine and implications for management. Acta Hort. 2014, 1017, 101–108. [Google Scholar] [CrossRef]
- Bajcz, A.W.; Drummond, F.A. Flower power: Floral and resource manipulations reveal the consequences of reproductive effort in lowbush blueberry (Vaccinium angustifolium). Ecol. Evol. 2017, 7, 1–15. [Google Scholar] [CrossRef]
- Bajcz, A.W.; Drummond, F.A. Bearing fruit: Flower removal reveals the trade-offs associated with high reproductive effort for lowbush blueberry. Oecologia 2017, 185, 13–26. [Google Scholar] [CrossRef] [PubMed]
- Aalders, L.E.; Hall, I.V. Pollen incompatibility and fruit set in lowbush blueberries. Can. J. Gen. Cytol. 1961, 3, 300–307. [Google Scholar] [CrossRef]
- Wood, G.W. Self-fertility in the lowbush blueberry. Can. J. Plant Sci. 1968, 48, 431–433. [Google Scholar] [CrossRef]
- Hokanson, K.; Hancock, J. Early-acting inbreeding depression in three species of Vaccinium (Ericaceae). Sex. Plant Repro. 2000, 13, 145–150. [Google Scholar] [CrossRef]
- Bell, D.J.; Rowland, L.J.; Zhang, D.; Drummond, F.A. Spatial genetic structure of lowbush blueberry, Vaccinium angustifolium, in four fields in Maine. Botany 2009, 87, 932–946. [Google Scholar] [CrossRef]
- Bell, D.J.; Rowland, L.J.; Drummond, F.A. Fine-scale spatial genetic structure associated with Vaccinium angustifolium Aiton (Ericaceae). Int. J. Bot. 2012, 2, 72–82. [Google Scholar]
- Myra, M.; MacKenzie, K.; Vander Kloet, S.P. Investigation of a possible sexual function specialization in the lowbush blueberry (Vaccinium angustifolium Ait. Ericaceae). Small Fruits Rev. 2004, 3, 313–324. [Google Scholar] [CrossRef]
- Bell, D.J.; Drummond, F.A.; Rowland, J.L. Evidence of functional gender polymorphisms in a population of the hermaphroditic lowbush blueberry (Vaccinium angustifolium Ait.). Botany 2012, 90, 393–399. [Google Scholar] [CrossRef]
- Bell, D.J.; Rowland, L.J.; Drummond, F.A. Does pollen neighborhood affect berry yield in lowbush blueberry (Vaccinium angustifolium Ait.)? Int. J. Fruit Sci. 2012, 12, 65–74. [Google Scholar] [CrossRef]
- Rowland, L.J.; Ogden, E.L.; Bell, D.J.; Drummond, F.A. Pollen-mediated gene flow in managed fields of lowbush blueberry. 2019; Manuscript in preparation. [Google Scholar]
- White, S.N.; Boyd, N.S.; van Acker, R.C. Growing degree-day models for predicting lowbush blueberry (Vaccinium angustifolium Ait.) ramet emergence, tip dieback, and flowering in Nova Scotia, Canada. HortScience 2012, 47, 1014–1021. [Google Scholar] [CrossRef]
- Collins, J.A.; Drummond, F.A. Fertilizer and fungicides: Effects on wild blueberry growth, insect attack, and disease incidence. Proc. NABREW 2019, 1–24. Available online: https://digitalcommons.library.umaine.edu/cgi/viewcontent.cgi?article=1014&context=nabrew2018 (accessed on 6 March 2019).
- Kanzow, C.; Yamashita, N.; Fukushima, M. Levenberg-Marquardt methods with strong local convergence properties for solving nonlinear equations with convex constraints. JCAM 2004, 172, 375–397. [Google Scholar] [CrossRef]
- Cook, R.D.; Weisberg, S. Residuals and Influence in Regression; Chapman and Hall: New York, NY, USA, 1982; 230p, ISBN 0-412-24280-0. [Google Scholar]
- Shapiro, S.S.; Wilk, M.B. An analysis of variance test for normality (complete samples). Biometrika 1965, 52, 591–611. [Google Scholar] [CrossRef]
- Durbin, J.; Watson, G.S. Testing for serial correlation in least squares regression III. Biometrika 1971, 58, 1–19. [Google Scholar] [CrossRef]
- SAS Institute. JMP® Version 14; SAS Institute Inc.: Cary, NC, USA, 2017; pp. 1989–2007. [Google Scholar]
- Dafni, A.; Maués, M.M. A rapid and simple procedure to determine stigma receptivity. Sex. Plant. Repro. 1998, 11, 177–180. [Google Scholar] [CrossRef]
- Galen, C.; Plowright, R.C. Testing the accuracy of using peroxidase activity to indicate stigma receptivity. Can. J. Bot. 1987, 65, 107–111. [Google Scholar] [CrossRef]
- Egea, J.; Burgos, L.; Garcia, J.E.; Egea, L. Stigma receptivity and style performance in several apricot cultivars. J. Am. Soc. Hort. Sci. 1991, 66, 19–25. [Google Scholar] [CrossRef]
- González, M.V.; Coque, M.; Herrero, M. Stigmatic receptivity limits the effective pollination period in kiwifruit. J. Am. Hort. Sci. 1995, 120, 199–202. [Google Scholar] [CrossRef]
- Yi, W.; Law, S.E.; Mccoy, D.; Wetzstein, H.Y. Stigma development and receptivity in almond (Prunus dulcis). Ann. Bot. 2005, 97, 57–63. [Google Scholar] [CrossRef] [PubMed]
- Sanzol, J.; Rallo, P.; Herrero, M. Asynchronous development of stigmatic receptivity in the pear (Pyrus communis; Rosaceae) flower. Am. J. Bot. 2003, 90, 78–84. [Google Scholar] [CrossRef] [PubMed]
- Batra, L.R.; Batra, S.W. Floral mimicry induced by mummy-berry fungus exploits host’s pollinators as vectors. Science 1985, 228, 1011–1013. [Google Scholar] [CrossRef] [PubMed]
- Ehlenfeldt, M.K.; Stretch, A.W.; Brewster, V. Genetic and morphological factors influence mummy berry blight resistance in highbush blueberry cultivars. HortScience 1996, 31, 252–254. [Google Scholar] [CrossRef]
- Luckwill, L.C. Studies of fruit development in relation to plant hormones: I. Hormone production by the developing apple seed in relation to fruit drop. J. Am. Soc. Hort. Sci. 1953, 28, 14–24. [Google Scholar] [CrossRef]
- Xie, R.J.; Deng, L.; Jing, L.; He, S.L.; Ma, Y.T.; Yi, S.L.; Zheng, Y.Q.; Zheng, L. Recent advances in molecular events of fruit abscission. Biol. Planta 2013, 57, 201–209. [Google Scholar] [CrossRef]
- Racskó, J.; Leite, G.B.; Petri, J.L.; Zhongfu, S.; Wang, Y.; Szabó, Z.; Soltész, M.; Nyéki, J. Fruit drop: The role of inner agents and environmental factors in the drop of flowers and fruits. Inter. J. Am. Soc. Hort. Sci. 2007, 13, 13–23. [Google Scholar]
- Cane, J.H. Pollen viability and pollen tube attrition in cranberry (Vaccinium macrocarpon Aiton). Proc. IXth Inter. Symp. Vaccinium Cult. Acta Hort. 2009, 810, 563–566. [Google Scholar] [CrossRef]
- Cane, J.H.; Schiffhauer, D. Dose-response relationships between pollination and fruiting refine pollinator comparisons for cranberry (Vaccinium macrocarpon [Ericaceae]). Am. J. Bot. 2003, 90, 1425–1432. [Google Scholar] [CrossRef]
- Brown, A.O.; McNeil, J.N. Fruit production in cranberry (Ericaceae: Vaccinium macrocarpon): A bet-hedging strategy to optimize reproductive effort. Am. J. Bot. 2006, 93, 910–916. [Google Scholar] [CrossRef]
- Baumann, T.E.; Eaton, G.W. Competition among berries on the cranberry upright. J. Am. Soc. Hort. Sci. 1986, 111, 869–872. [Google Scholar]
- Benoit, G.R.; Grant, W.J.; Ismail, A.A.; Yarborough, D.E. Effect of soil moisture and fertilizer on the potential and actual yield of lowbush blueberries. Can. J. Plant Sci. 1984, 64, 683–689. [Google Scholar] [CrossRef]
- Snow, A.A. Pollination intensity and potential seed set in Passiflora vitifolia. Oecologia 1982, 55, 231–237. [Google Scholar] [CrossRef]
- Galen, C. Regulation of seed-set in Polemonium viscosum: Floral scents, pollination, and resources. Ecology 1985, 66, 792–797. [Google Scholar] [CrossRef]
- Delaplane, K.S.; Mayer, D.R.; Mayer, D.F. Crop Pollination by Bees; Cabi Publishing: London, UK, 2000; 344p. [Google Scholar]
- Silander, J.A.; Primack, R.B. Pollination intensity and seed set in the evening primrose (Oenothera fruticosa). Am. Mid. Nat. 1978, 100, 213–216. [Google Scholar] [CrossRef]
- Morandin, L.A.; Winston, M.L. Wild bee abundance and seed production in conventional, organic, and genetically modified canola. Ecol. Appl. 2005, 15, 871–881. [Google Scholar] [CrossRef]
- Hanes, S.P.; Collum, K.; Hoshide, A.K.; Drummond, F.A.; Asare, E. Grower perceptions of native pollinators and pollination strategies in the lowbush blueberry industry. Renew. Agric. Food Sys. 2013, 28, 1–8. [Google Scholar] [CrossRef]
- Stevens, T.; Hoshide, A.K.; Drummond, F. Willingness to pay for native pollination of blueberries: A conjoint analysis. Int. J. Agric. Mark. 2015, 2, 68–77. [Google Scholar]
- Hanes, S.; Collum, K.; Hoshide, A.; Drummond, F. Assessing wild pollinators in conventional agriculture: A case study from Maine, USA’s blueberry industry. Hum. Ecol. Rev. 2018, 24, 97–113. [Google Scholar] [CrossRef]
- Hoshide, A.K.; Drummond, F.A.; Stevens, T.H.; Venturini, E.M.; Hanes, S.P.; Sylvia, M.M.; Loftin, C.S.; Yarborough, D.E.; Averill, A.L. What is the value of wild bee pollination for wild blueberries and cranberries and who values it? Environments 2018, 5, 98. [Google Scholar] [CrossRef]
Figure 1.
Wild blueberry seeds dissected from fruit under a stereo microscope (40X). (A) viable fully formed “plump” seed. (B) Shriveled and deformed aborted seeds. Aborted seeds are due to incompatible pollen, often self-pollen.
Figure 1.
Wild blueberry seeds dissected from fruit under a stereo microscope (40X). (A) viable fully formed “plump” seed. (B) Shriveled and deformed aborted seeds. Aborted seeds are due to incompatible pollen, often self-pollen.

Figure 2.
Degree-day predictive model for Maine wild blueberry cumulative bloom. (A) Initial model and validation, model building data are solid round black data points, n = 26 fields. Overlaid validation data are non-filled round data points, n = 7 fields. (B) Final model with all 33 data points (2015–2017). Dashed lines are 50 and 99 predicted percentile levels of bloom.

Figure 3.
Relationship between the proportion fruit set (solid line) and the proportion mature fruit (dotted line), and the flower age in days post-bloom. (A) 2007 and (B) 2015. Error bars are standard errors of the clone mean.
Figure 3.
Relationship between the proportion fruit set (solid line) and the proportion mature fruit (dotted line), and the flower age in days post-bloom. (A) 2007 and (B) 2015. Error bars are standard errors of the clone mean.

Figure 4.
Relationship between the proportion fruit set and the pollen tetrad deposition. Two models: (A) an asymptotic logistic model and (B) a fourth degree polynomial. Error bars are standard errors.
Figure 4.
Relationship between the proportion fruit set and the pollen tetrad deposition. Two models: (A) an asymptotic logistic model and (B) a fourth degree polynomial. Error bars are standard errors.

Figure 5.
Relationships between viable seeds/berry and berry mass (g) for (A) 2006, (B) 2007, (C) 2011, and (D) all 3 years. Lines are least square regression lines.
Figure 5.
Relationships between viable seeds/berry and berry mass (g) for (A) 2006, (B) 2007, (C) 2011, and (D) all 3 years. Lines are least square regression lines.

Figure 6.
Frequency distributions for viable seeds, ovules, and the ratio of viable seeds per number of ovules/berry, (A) 2006, (B) 2007, (C) 2011, (D) all years, (E) 2011 ovules/berry, and (F) 2011 ratio of viable seeds/ovules/berry.
Figure 6.
Frequency distributions for viable seeds, ovules, and the ratio of viable seeds per number of ovules/berry, (A) 2006, (B) 2007, (C) 2011, (D) all years, (E) 2011 ovules/berry, and (F) 2011 ratio of viable seeds/ovules/berry.

Figure 7.
Field-level relationships between: (A) percent fruit set and average viable seeds/berry, dashed lines at 50% and 70% fruit set, (B) percent fruit set and average individual berry mass, (C) average viable seeds/berry and average individual berry mass, dashed lines at 12 viable seeds/berry, and (D) average viable seeds/berry and field yield (kg/ha). Solid lines are significant linear regressions fit to the aggregated field level data.

Figure 8.
The relationship between flowers/stem and percent fruit set for each clone, (A) year 1969 and (B) year 2013. Data is not shown because the number of data points obscures the fitted relationships.
Figure 8.
The relationship between flowers/stem and percent fruit set for each clone, (A) year 1969 and (B) year 2013. Data is not shown because the number of data points obscures the fitted relationships.


Table 1.
Variance in percent fruit set explained by year, field, clone, and stems.
| Study | Source of Variation | Variance | % of Total Variance |
|---|---|---|---|
| 1966–1971 * | year | 271.9 | 11.2 |
| clone | 144.0 | 5.9 | |
| section | 96.2 | 4.0 | |
| stem | 1911.0 | 78.9 | |
| total | 2423.1 | 100.0 | |
| 2011–2015 | year | 29.4 | 3.5 |
| field | 170.5 | 20.2 | |
| clone | 96.8 | 11.4 | |
| stem | 549.4 | 64.9 | |
| total | 846.1 | 100.0 |
* Only 1 field each year in this study, but the clone was divided into five sections and subsampled.
© 2019 by the author. Licensee MDPI, Basel, Switzerland. This article is an open access article distributed under the terms and conditions of the Creative Commons Attribution (CC BY) license (http://creativecommons.org/licenses/by/4.0/).
Share and Cite
MDPI and ACS Style
Drummond, F. Reproductive Biology of Wild Blueberry (Vaccinium angustifolium Aiton). Agriculture 2019, 9, 69. https://0-doi-org.brum.beds.ac.uk/10.3390/agriculture9040069
AMA Style
Drummond F. Reproductive Biology of Wild Blueberry (Vaccinium angustifolium Aiton). Agriculture. 2019; 9(4):69. https://0-doi-org.brum.beds.ac.uk/10.3390/agriculture9040069
Chicago/Turabian StyleDrummond, Frank. 2019. "Reproductive Biology of Wild Blueberry (Vaccinium angustifolium Aiton)" Agriculture 9, no. 4: 69. https://0-doi-org.brum.beds.ac.uk/10.3390/agriculture9040069
Note that from the first issue of 2016, this journal uses article numbers instead of page numbers. See further details here.