Technical Note

Calibration and Validation of a Low-Cost Capacitive Moisture Sensor to Integrate the Automated Soil Moisture Monitoring System

by
Ekanayaka Achchillage Ayesha Dilrukshi Nagahage
*,
Isura Sumeda Priyadarshana Nagahage
and
Takeshi Fujino
Graduate School of Science and Engineering, Saitama University, 255 Shimo-Okubo, Sakura-ku, Saitama 338-8570, Japan
*
Author to whom correspondence should be addressed.
Submission received: 18 May 2019 / Revised: 2 July 2019 / Accepted: 3 July 2019 / Published: 4 July 2019
(This article belongs to the Special Issue Sensors Application in Agriculture)

Abstract

:
Readily available moisture in the root zone is very important for optimum plant growth. The available techniques to determine soil moisture content have practical limitations owing to their high cost, dependence on labor, and time consumption. We have developed a prototype for automated soil moisture monitoring using a low-cost capacitive soil moisture sensor (SKU:SEN0193) for data acquisition, connected to the internet. A soil-specific calibration was performed to integrate the sensor with the automated soil moisture monitoring system. The accuracy of the soil moisture measurements was compared with those of a gravimetric method and a well-established soil moisture sensor (SM-200, Delta-T Devices Ltd, Cambridge, UK). The root-mean-square error (RMSE) of the soil water contents obtained with the SKU:SEN0193 sensor function, the SM-200 manufacturer’s function, and the SM-200 soil-specific calibration function were 0.09, 0.07, and 0.06 cm3 cm−3, for samples in the dry to saturated range, and 0.05, 0.08, and 0.03 cm3 cm−3, for samples in the field capacity range. The repeatability of the measurements recorded with the developed calibration function support the potential use of the SKU:SEN0193 sensor to minimize the risk of soil moisture stress or excess water application.

1. Introduction

Readily available soil moisture is a key requirement for the growth and development of plants and depends on the physical properties of the soil and the meteorological conditions of the surrounding environment. The upper and lower limits of the readily available soil moisture are known as the field capacity and the permanent wilting percentage, respectively. At the field capacity, sufficient water and air are retained in the soil, resulting in optimum plant growth. The effect of the meteorological conditions on soil moisture is minimal in indoor systems. However, the readily available soil moisture content varies throughout the soil, owing to the differences in transpiration and moisture loss from the soil, even in controlled environments [1]. Thus, continuous monitoring of the soil moisture content at different locations is required in indoor systems. These practices are costly, time-consuming, and labor-dependent.
There are several techniques to determine the soil moisture content, including the destructive gravimetric method as well as nuclear, electromagnetic, tensiometric, hygrometric, and remote sensing processes [2]. Among them, sensors employing an electromagnetic technique are widely utilized to measure soil moisture levels. Time-domain reflectometry (TDR), time-domain transmission (TDT), and capacitance sensors are the most commonly used sensors based on an electromagnetic technique [3,4]. TDR and TDT sensors are accurate but have limited large-scale applicability owing to the cost of investment. In contrast, capacitance sensors are less expensive but require precise calibration. The capacitance of a sensor is determined by the dielectric constant [5,6] and the volume fraction of each phase (bulk water, water vapor, air, solid minerals, etc.) [7,8]. It provides real-time soil moisture data according to the changes in the moisture content of the soil.
Many researchers have focused on the calibration of low-cost sensors which are used in different sensing techniques, such as capacitance-based sensors [9,10], resistivity-based granular matrix sensors [9,11], and sensors based on a tensiometer technique [9], to measure the soil water content in fields [2,12,13,14] and to develop low-cost automated irrigation systems [15]. Some studies have considered the effects of the physical and chemical properties of soil on the performances of soil moisture sensors [4,13,14,16,17,18]. These studies provide valuable insight into the necessity of soil-specific calibration.
A variety of capacitance sensors have become increasingly popular because they are less expensive than TDR and TDT high-frequency (GHz range) sensors and sufficiently reliable. Considering the cost of investment, a low-cost sensor even with a relatively weak accuracy is preferred in agriculture [19].
The SKU:SEN0193 sensor is a commercially available, low-cost capacitive soil moisture sensor which operates in low-power consumption. However, this soil moisture sensor has not been properly investigated for its accuracy and repeatability under laboratory conditions. Hence, the present study was performed (i) to investigate the accuracy and reliability of the SKU:SEN0193 low-cost capacitive soil moisture sensor under laboratory conditions, (ii) to develop a calibration function, and (iii) to integrate this sensor with a data acquisition system.

2. Materials and Methods

The SKU:SEN0193 capacitive soil moisture sensor, (DFRobot, Shanghai, China) with dimensions of 9.8 × 2.3 cm (L × W) was used for this study. The SKU:SEN0193 sensor can be powered from a voltage source in the range of 3.3 to 5.5 V. Thus, it can be interfaced with low-power microcontrollers. In addition, the sensor is made of corrosion-resistant material which increases durability. In parallel, SM-200 (Delta-T Devices Ltd., Cambridge, UK) a well-established commercially available soil moisture sensor was used for comparison to evaluate the accuracy of the SKU:SEN0193 sensor. The SM-200 sensor operates at 100 MHz, which measures a material (soil, water, air) response to polarization in an electromagnetic field (i.e., permittivity). The permittivity of the soil can be detected as a voltage output corresponding to the soil moisture content. The measuring accuracy is ±0.3% for volumetric water content, θ from 0 to 0.50 m3 m−3. The SM-200 sensor has been used in studies as a reliable soil moisture sensor to determine the soil moisture content in the plant root zone [20] and as a reference sensor to compare the accuracy of other capacitive-type soil moisture sensors [21]. In addition, the SHT30 temperature and humidity sensor was used to obtain the temperature and humidity of the air.
Commercially available organic-rich gardening soil was obtained from a local producer (Gardening. Pro, Maruki, Japan), hereafter referred to as organic-rich soil. This soil was originally obtained from the surface of the kanto loam layer (Black soil, Kanuma city, Tochigi Prefrecture, Japan). The measured organic matter content and mineral content were 24.8 and 75.2%, respectively [22]. The air-dried soil was sieved through a 2 mm mesh to remove aggregated soil clumps, and the <2 mm fraction of the soil was used in this study. In addition, a laboratory soil mixture was prepared by mixing the organic-rich soil with vermiculite in a 1:1 ratio [23,24]. This soil mixture was used as a growing medium for laboratory plants.

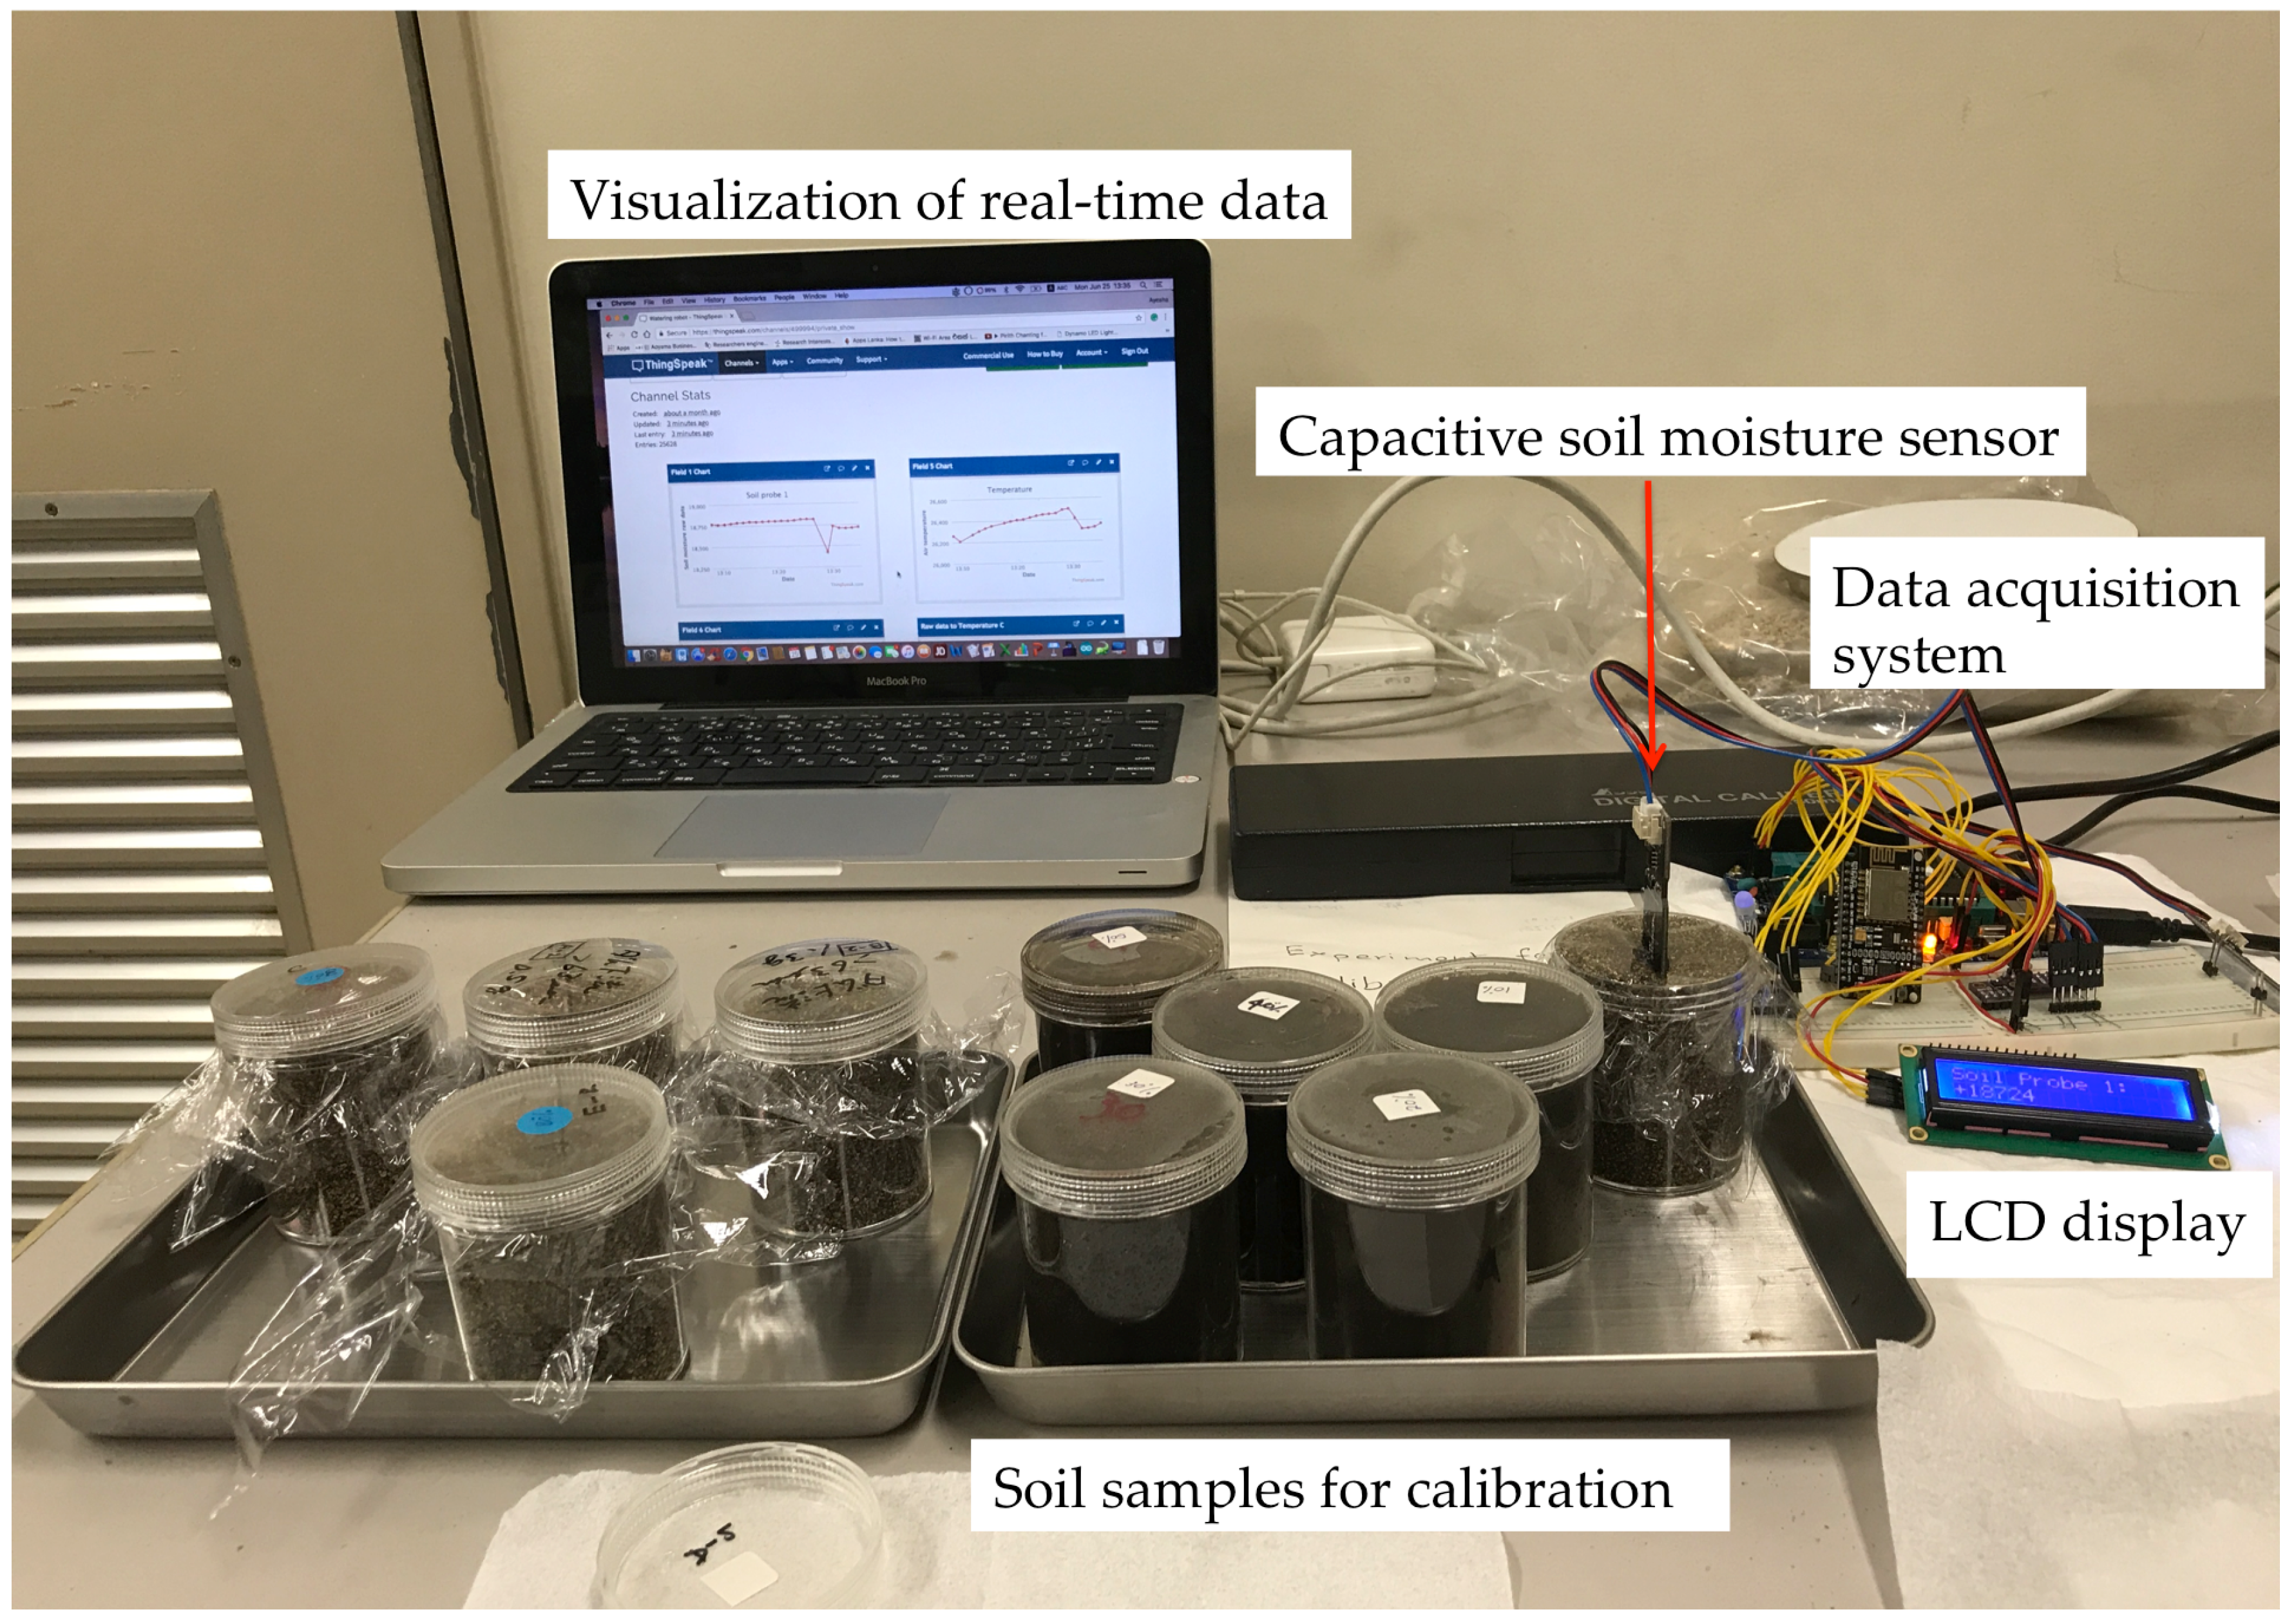
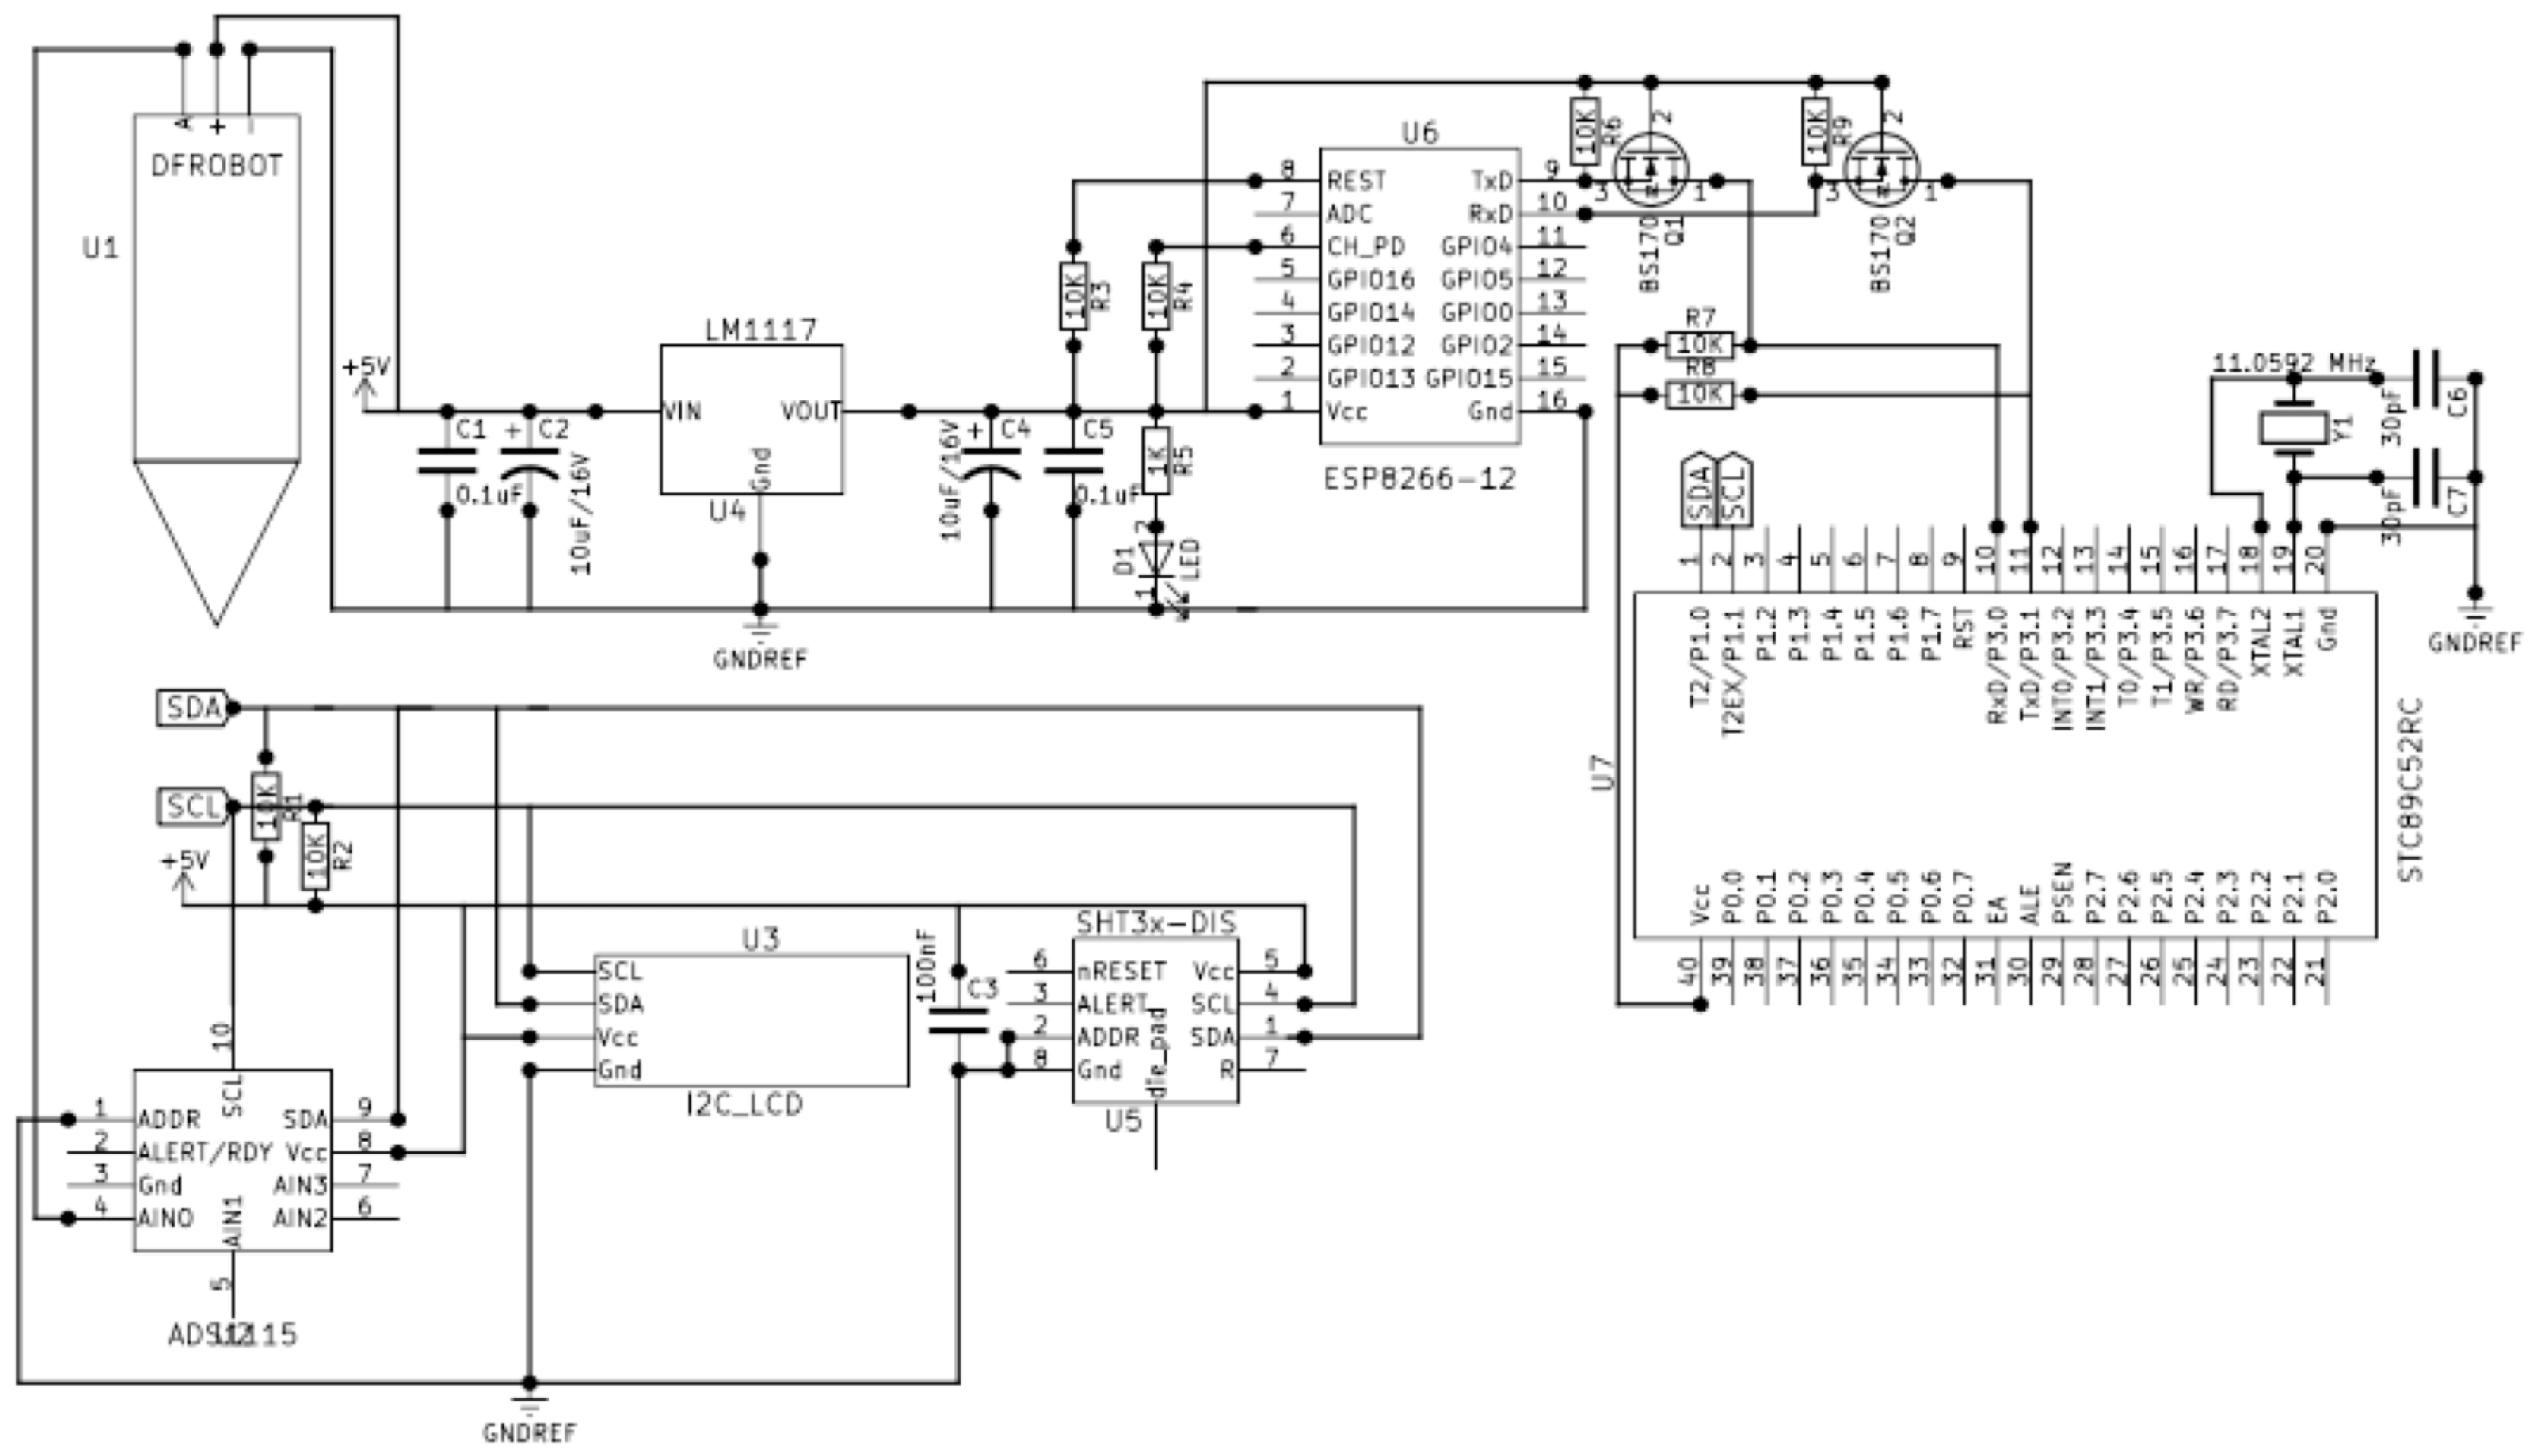
2.1. Data Acquisition and Analysis via an Internet-Based Platform

The data acquisition system used in this study consisted of two main components called the microcontroller unit and the Wi-Fi module. The main microcontroller STC89C52RC was operated at a speed of 11.0592 MHz. A software-implemented I2C bus [25] was used to interface a 16 × 2 LCD (1602 character-type liquid crystal display) module, an ADS1115 16-bit analog-to-digital converter (ADC), and temperature and humidity sensor with the microcontroller. An ESP8266-12E low-cost serial-to-WiFi module was interfaced through STC89C52RC inbuilt UART. The analog data output pin of the SKU:SEN0193 sensor was connected to the ADS1115 with a full-scale range of ±4.096 V. The ADS1115 converted the voltage of SKU:SEN0193 sensor to raw counts (raw). ThingSpeak API, an open IoT (Internet of Things) platform, was used to collect and analyze data with MATLAB@ analytics. The assembly program for the microcontroller (Supplementary Material: Microcontroller program code) was written by using Keil µVision 5 IDE, and AT commands were used to control the WiFi module (Figure 1 and Figure 2). The total cost of the developed prototype was around $45.7 (Table 1).

2.2. Soil Sample Preparation

Soil samples with different soil moisture contents were prepared by adjusting the soil moisture content gravimetrically. The moisture-adjusted samples were packed into polycarbonate containers (average volume 110 cm3 (Area: 18.08 cm2 × Height: 6.1 cm)) with an average dry bulk density, ρd, of 0.6 g cm−3 for organic-rich gardening soil and 0.3 g cm−3 for the laboratory soil mixture. Then the containers were covered with plastic wrappings to avoid moisture loss during the calibration, and the samples were stored after sealing with a lid. The sensor was inserted to the center of the soil core at a depth of 5–6 cm from the upper soil surface. Then, the samples were let achieve equilibrium for 15 to 20 min, before performing the measurements. The noise of the data, i.e., data fluctuation, was very limited during the measurements. All experiments were performed at room temperature (25 °C). The raw counts of the samples for each gravimetric water content were stored using the Thingspeak platform.

2.3. Sensor-to-Sensor Variability Study

Prior to the calibration, the sensor-to-sensor reading variability (raw counts) of the SKU:SEN0193 sensors for predetermined soil moisture contents was evaluated (Table 2). The sensor-to-sensor variability study was performed only for the organic-rich soil. Samples with two different soil moisture contents (40 and 80%, g g−1 of organic-rich soil), in duplicate, and water were used to test sensor-to-sensor variability. Repeated measurements (twenty replications of sensor measurements) were obtained for every duplicated soil sample with four SKU:SEN0193 sensors (S1, S2, S3, and S4). The sensor-to-sensor variability was analyzed using a one-way Analysis of Variance (ANOVA) statistical test [26]. Further, to estimate the measurement noise of the SKU:SEN0193 sensors, the coefficient of variance (CV) of raw counts was determined. The CV values thus obtained were CVS1 = 0.05%, CVS2 = 0.10%, CVS3 = 0.06%, CVS4 = 0.09% for 80%, g g−1 sample, i.e., an organic-rich soil sample in a field capacity range.

2.4. Calibration of the Sensor

Considering the sensor-to-sensor variability, the samples were measured repeatedly using two selected SKU:SEN0193 sensors to obtain a calibration function. The soil-specific calibration was performed using the organic-rich gardening soil and the laboratory soil mixture. The moisture contents of the tested soil and soil mixture were adjusted gravimetrically using distilled water. Moisture-adjusted samples were prepared with gravimetric water content of 0 (oven dried), 10, 20, 30, 40, 50, 60, 70, 80, 90, and 100 g g−1. The moisture-adjusted samples were kept in closed plastic bags for 24 h for equilibration, and the gravimetric water content was verified by evaluating the moisture content of each sample by oven-drying at 105 °C [27]. The raw counts for the samples of the two different materials with each gravimetric water content were stored using the Thingspeak platform.

2.5. Validation of the Developed Calibration Function

The developed calibration function was validated by measuring organic-rich soil samples with different moisture contents: oven-dried samples, air-dried samples, samples with a moisture content of up to 100%, and saturated samples (>100%, g g−1). The samples with different moisture contents were packed into polycarbonate containers. The soil water content of the samples was measured by the SKU:SEN0193 and SM-200 sensors. These values were confirmed gravimetrically by oven-drying. Similarly, data validation was performed in the selected values of the field capacity using samples with soil water contents of 60, 65, 70, 75, and 80% g g−1. A soil-specific calibration was performed for the SM-200 sensor in accordance with its user manual [28]. The calculated coefficients a0 and a1, which conveniently parameterize the dielectric properties of soils, were 1.3 and 6.1, respectively, for the organic-rich soil (Equations (1)–(3)).
ε = a 0 + a 1 θ
a 0 = ε d r y _ s o i l
ε = 1.0 + 16.103 V 38.725 V 2 + 60.881 V 3 46.032 V 4 + 13.536 V 5
where ε is the dielectric permittivity of the soil, θ (cm3 cm−3) is the volumetric water content, and V is the SM-200 reading in Volts of the corresponding soil moisture content.
A polynomial conversion (Equation (4)) was performed to calculate the volumetric water content θ (cm3 cm−3) after soil-specific calibration for the organic-rich soil:
θ = [ 1.0 + 16.103 V 38.725 V 2 + 60.881 V 3 46.032 V 4 + 13.536 V 5 ] a 0 a 1

3. Results and Discussion

The data measured by the low-cost SKU:SEN0193 sensor and the temperature and humidity sensor were stored and visualized via an internet-based platform. The soil water contents predicted using the linear equation (which we developed by considering the raw counts of the sensor for bulk water and air with average values of 10,653 and 20,240, respectively) were inaccurate for both the organic-rich soil and the laboratory soil mixture. Hence, new calibration functions were developed by plotting the volumetric water content θ of the tested materials as a function of the raw count.
The volumetric water content θ (cm3 cm−3) of the samples can be obtained by the measured gravimetric water content w (g/g, %) of the samples, the dry bulk density of the material ρb (g cm−3), and the density of water ρw (g cm−3) as follows (Equation (5)) [29]:
θ = w ρ b ρ w

3.1. Results of the Sensor-to-Sensor Variability Study

The results of the ANOVA test at a 5% significance level for 20 replications of sensor response measurements (for each duplicated soil sample) of 4 SKU:SEN0193 sensors indicated that the mean sensor response was significantly different for the 4 SKU:SEN0193 sensors (see Table 2), demonstrating significant sensor-to-sensor variability.

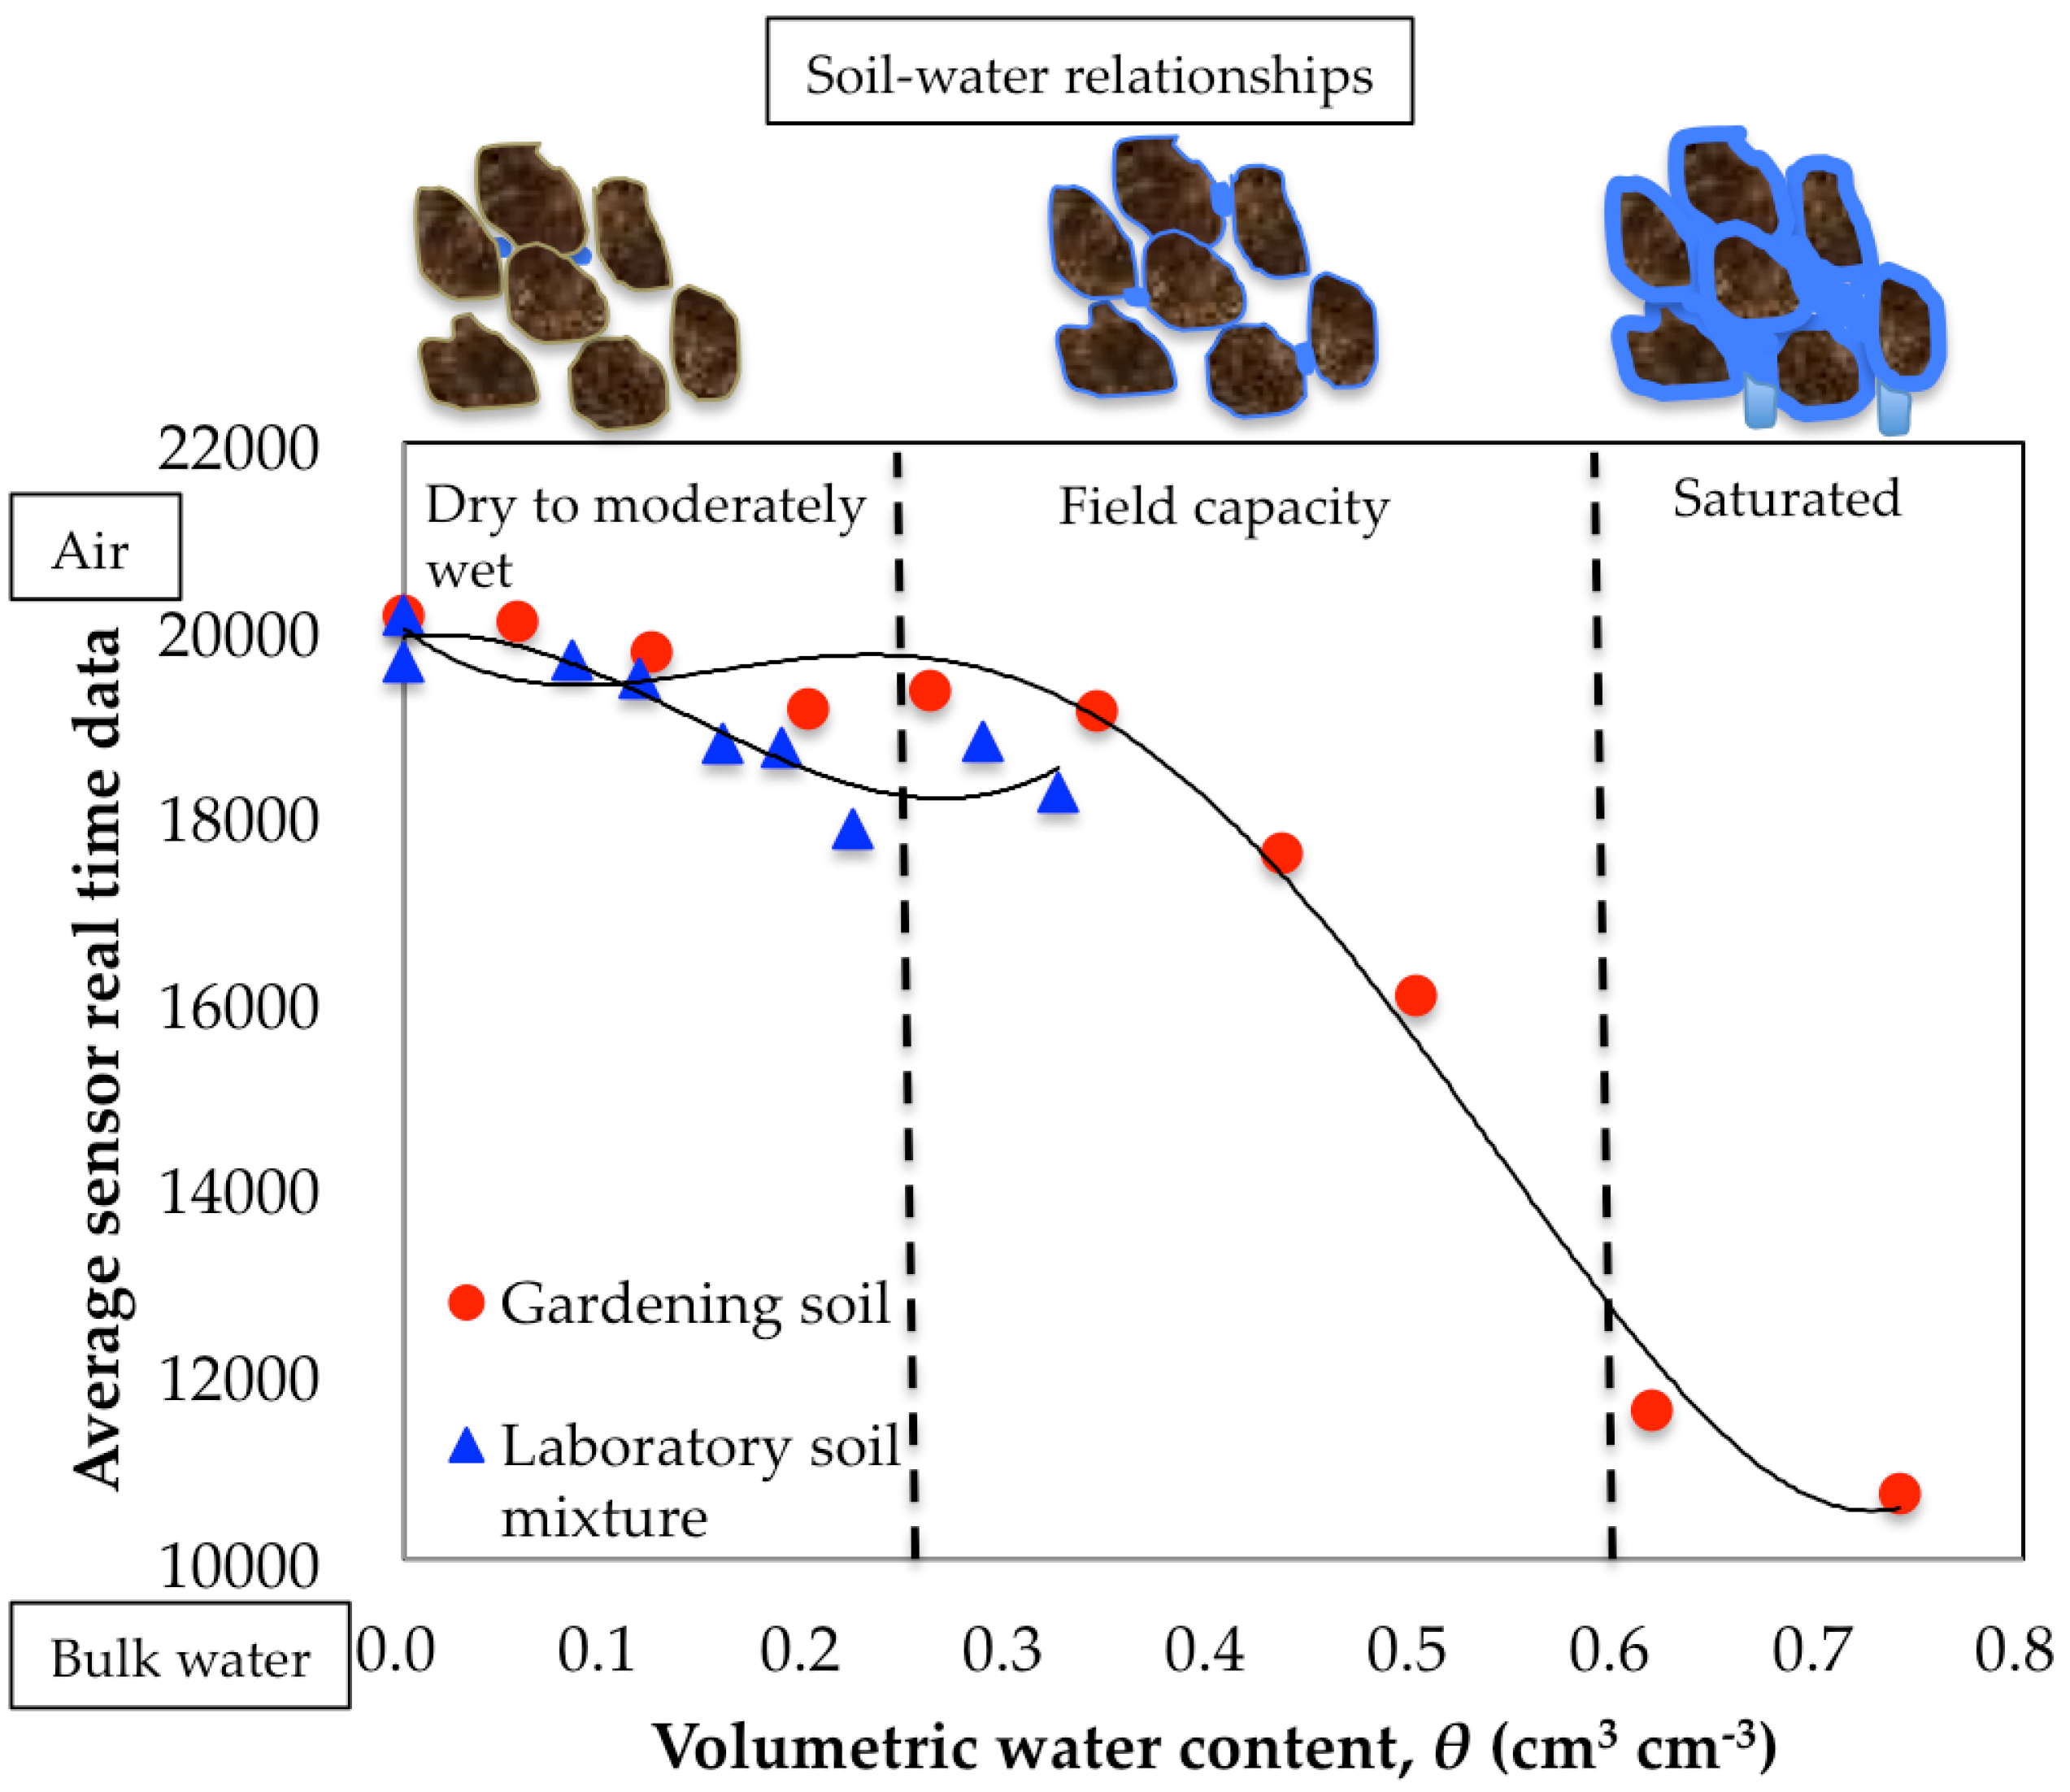
3.2. Calibration of the SKU:SEN0193 Sensor for Organic-Rich Soil and Laboratory Soil Mixture

The sensor-to-sensor variability study suggested that the responses of the tested four sensors were different, and therefore, their accuracy should be improved by using a sensor-specific calibration model for each sensor [29]. Considering the sensor-to-sensor variability, the samples were measured repeatedly using two selected SKU:SEN0193 sensors to obtain a calibration function.
The average raw count of the two SKU:SEN0193 sensors was obtained for each moisture-adjusted sample. Soil moisture, temperature, and humidity data were recorded at intervals of 1 min. After the equilibrium, the data were recorded over 15–20 min for each sample (n = 15–20). The averaged raw count as a function of volumetric water content, θ, was plotted in Figure 3. Here, we show the results for three moisture categories for organic-rich soil: dry to moderately wet samples with volumetric water content around 0.0–0.26 cm3 cm−3, field capacity samples with volumetric water content around 0.34–0.50 cm3 cm−3, and saturated samples with volumetric water content around 0.62–0.74 cm3 cm−3. In addition, these data indicate that the sensor could distinguish the three different soil moisture levels of dry to moderately wet, field capacity, and saturated. Hence, the minimum and maximum values of the readily available soil moisture (permanent wilting percentage and field capacity) can be maintained using the SKU:SEN0193 sensor in organic-rich soil. Interestingly, the calibration curve obtained for the laboratory soil mixture did not show a clear difference among the three moisture categories. The laboratory soil mixture was prepared by mixing organic-rich soil and vermiculite. It has been reported that also high-cost sensors such as TDR do not accurately predict the soil moisture content of soil substitutes based on mineral media (vermiculite, tuff, perlite) [30]. Furthermore, it is known that less expensive capacitance moisture sensors operate in low frequencies and are thereby more sensitive to effects of soil textural variances and salinity [4,31]. Thus, the low sensitivity of the SKU:SEN0193 sensor for the soil moisture content of the laboratory soil mixture could be due to the high mineral content of the laboratory soil mixture.

3.3. Soil-Specific Calibration Function

The derived soil-specific calibration function for the organic-rich soil accurately predicted the soil moisture values of known samples, while that for the laboratory soil mixture did not. Therefore, further studies were carried out using organic-rich soils.
The derived calibration function (polynomial function) of the SKU:SEN0193 sensor for the organic-rich soil is (R2 = 0.98):
θ = 13.248 2.576 × 10 3   r a w + 1.726 × 10 7   r a w 2 3.839 × 10 12   r a w 3

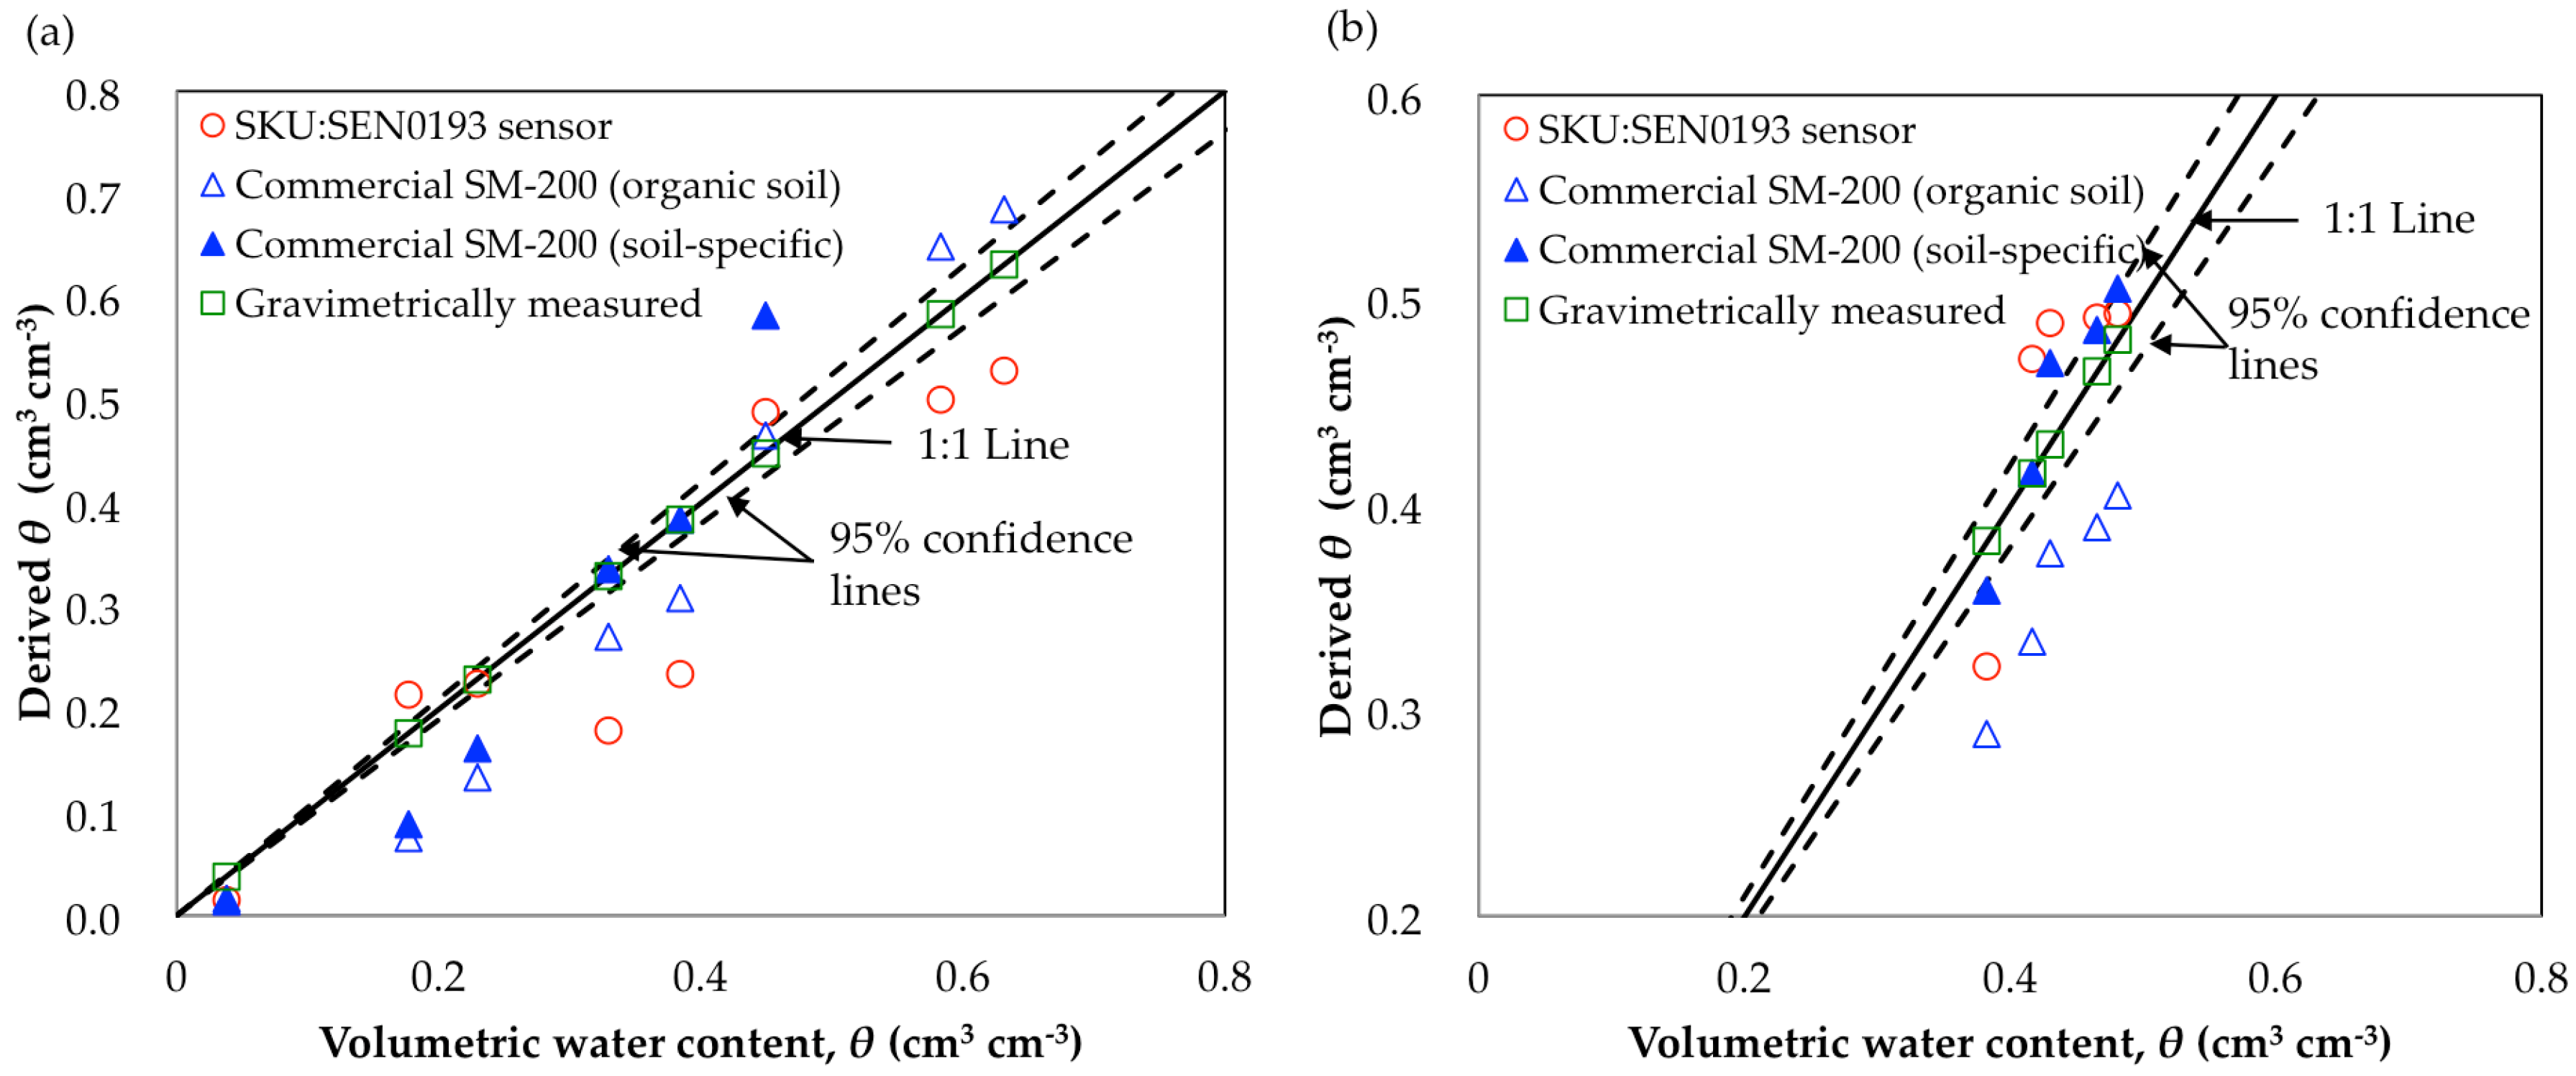
3.4. Data Validation with the Commercially Available SM-200 Sensor and the Low-Cost SKU:SEN0193 Capacitive Sensor

Soil samples were analyzed for their soil water content using the commercial available SM-200 sensor and the low-cost SKU:SEN0193 capacitive sensor. The volumetric water contents derived from the polynomial function of the SKU:SEN0193 sensor, the polynomial function of the SM-200 sensor for organic soil (manufacturer’s function), and the soil-specific calibration (the function obtained from the measured coefficients) are plotted in Figure 4 as a function of the measured volumetric water content. The root-mean-square error (RMSE) was calculated for the soil water contents derived by the different calibration (polynomial) functions. The RMSE values of the SKU:SEN0193 sensor function, the SM-200 manufacturer’s function, and the SM-200 soil-specific calibration function were 0.09, 0.07, and 0.06 cm3 cm−3, respectively, for the samples with dry to saturated levels of soil water content. The soil water content at 0.45 cm3 cm−3 (74% gravimetric water content) was predicted precisely by the derived polynomial functions of both sensors (Figure 4a). Hence, data prediction at the field capacity (a gravimetric water content of 60–80%) was performed by measuring the moisture-adjusted samples (Figure 4b). The RMSE was calculated as before. The RMSE values of the SKU:SEN0193 sensor function, the SM-200 manufacturer‘s function, and the SM-200 soil-specific calibration function were 0.05, 0.08, and 0.03 cm3 cm−3, respectively, in the field capacity range. The data prediction ability of the sensor appeared similar to that of the SM-200 sensor (with soil-specific calibration) at a lower investment cost. This study highlights the potential use of the low-cost SKU:SEN0193 capacitive moisture sensor for predicting the water content of soil.
Prior to deploying the system in the field, it is necessary to evaluate the performance of the derived function for continuous operation. Thus, soil moisture loss from a sample in the field capacity range was evaluated using the derived polynomial function (gravimetric basis) (Figure 5). The experiment was performed for 12 h, from day to nighttime, under laboratory conditions. The room temperature and the relative humidity of the room ranged from 25 to 26 °C and 72 to 75%, respectively, during the measurements. The 3D scatter-plot in Figure 5 illustrates the soil moisture loss with time. It shows a gradual decrease in soil moisture during 12 h of measurements.

4. Conclusions

We evaluated the accuracy and reliability of the SKU:SEN0193 low-cost capacitive soil moisture sensor under laboratory conditions. The developed soil-specific calibration function for gardening soil performed satisfactorily during the sensor validation procedure for the prediction of soil water content. Furthermore, our data suggest that the soil-specific calibration function of the SKU:SEN0193 sensor can be used to predict the soil water contents in three different ranges of soil moisture. Hence, it can be used to maintain the minimum and maximum values of readily available soil moisture in indoor systems. In contrast, the SKU:SEN0193 capacitive soil moisture sensor did not perform acceptably for the laboratory soil mixture in predicting the soil moisture content. This result suggests that the accuracy of the sensor depends on the soil mixture constituents.
However, it is necessary to investigate the effects of soil temperature, bulk density of the soil profile, and salinity levels on the accuracy of the sensor measurements. Further studies should be undertaken to assess its behavior in a real working scenario under field conditions.

Supplementary Materials

The following are available online at https://0-www-mdpi-com.brum.beds.ac.uk/2077-0472/9/7/141/s1, Supplementary Material: Microcontroller program code.

Author Contributions

Conceptualization, validation, and production of the final manuscript, E.A.A.D.N. and I.S.P.N.; Microcontroller program and prototype development, I.S.P.N.; Experiments for sensor calibration, E.A.A.D.N.; Supervision, revision and editing, T.F.

Funding

This study was supported by Saitama University president’s discretion program.

Conflicts of Interest

The authors declare no conflict of interest.

References

  1. Kramer, P.J.; Boyer, J.S. Soil and water. In Water Relations of Plants and Soils; Academic Press: San Diego, CA, USA, 1995; pp. 84–114. Available online: http://udspace.udel.edu/handle/19716/2830. (accessed on 15 December 2018).
  2. Zazueta, F.S.; Xin, J. Soil Moisture Sensors; Florida Cooperative Extension Service, Institute of Food and Agricultural Science; University of Florida: Gainesville, FL, USA, 1994. [Google Scholar]
  3. Bogena, H.R.; Huisman, J.A.; Schilling, B.; Weuthen, A.; Vereecken, H. Effective calibration of low-cost water content sensors. Sensors 2017, 17, 208. [Google Scholar] [CrossRef]
  4. Vaz, C.M.P.; Jones, S.; Meding, M.; Tuller, M. Evaluation of Standard Calibration Functions for Eight Electromagnetic Soil Moisture Sensors. Vadose Zone J. 2013, 12, 1–16. [Google Scholar] [CrossRef]
  5. Terzic, E.; Terzic, J.; Nagarajah, R.; Alamgir, M. Capacitive sensing technology. In Neural Network Approach to Fluid Quantity Measurement in Dynamic Environments; Springer: London, UK, 2012. [Google Scholar]
  6. Robbins, A.; Miller, W. Circuit Analysis: Theory and Practice; Delmar: Albany, NY, USA, 2000. [Google Scholar]
  7. Fen-Chong, T.; Fabbri, A.; Guilbaud, J.; Coussy, O. Determination of liquid water content and dielectric constant in porous media by the capacitive method. Comptes Rendus Mécanique 2004, 332, 639–645. [Google Scholar] [CrossRef]
  8. Kaatze, U. The dielectric properties of water in its different states of interaction. J. Solution Chem. 1997, 26, 1049–1112. [Google Scholar] [CrossRef]
  9. Ganjegunte, G.K.; Sheng, Z.; Clark, J.A. Evaluating the accuracy of soil water sensors for irrigation scheduling to conserve freshwater. Appl. Water Sci. 2012, 2, 119–125. [Google Scholar] [CrossRef] [Green Version]
  10. Parvin, N.; Degré, A. Soil-specific calibration of capacitance sensors considering clay content and bulk density. Soil Res. 2016, 54, 111–119. [Google Scholar] [CrossRef]
  11. Payero, J.O.; Mirzakhani-Nafchi, A.; Khalilian, A.; Qiao, X.; Davis, R. Development of a low-cost Internet-of-Things (IOT) system for monitoring soil water potential using Watermark 200SS sensors. Adv. Internet Things 2017, 7, 71–86. [Google Scholar] [CrossRef]
  12. Archer, N.A.L.; Rawlins, B.R.; Marchant, B.P.; Mackay, J.D.; Meldrum, P.I. Approaches to calibrate in-situ capacitance soil moisture sensors and some of their implications. SOIL Discuss. 2016. [Google Scholar] [CrossRef]
  13. Fares, A.; Awal, R.; Bayabil, H.K. Soil water content sensor response to organic matter content under laboratory conditions. Sensors 2016, 16, 1239. [Google Scholar] [CrossRef]
  14. Mittelbach, H.; Lehner, I.; Seneviratne, S.I. Comparison of four soil moisture sensor types under field conditions in Switzerland. J. Hydrol. 2012, 430–431, 39–49. [Google Scholar] [CrossRef]
  15. Ferrarezi, R.S.; Dove, S.K.; Van Iersel, M.W. An automated system for monitoring soil moisture and controlling irrigation using low-cost open-source microcontrollers. HortTechnology 2015, 25, 110–118. [Google Scholar] [CrossRef]
  16. Cardenas-Lailhacar, B.; Dukes, M. Effect of temperature and salinity on the precision and accuracy of landscape irrigation soil moisture sensor systems. J. Irrig. Drain. Eng. 2015, 141, 7. [Google Scholar] [CrossRef]
  17. Inoue, M.; Ould Ahmed, B.A.; Saito, T.; Irshad, M.; Uzoma, K.C. Comparison of three dielectric moisture sensors for measurement of water in saline sandy soil. Soil Use Manag. 2008, 24, 156–162. [Google Scholar] [CrossRef]
  18. Nemali, K.S.; Montesano, F.; Dove, S.K.; Van Iersel, M.W. Calibration and performance of moisture sensors in soilless substrates: ECH2O and Theta probes. Sci. Hortic. 2007, 112, 227–234. [Google Scholar] [CrossRef]
  19. Kojima, Y.; Shigeta, R.; Miyamoto, N.; Shirahama, Y.; Nishioka, K.; Mizoguchi, M.; Kawahara, Y. Low-cost soil moisture profile probe using thin-film capacitors and a capacitive touch sensor. Sensors 2016, 16, 1292. [Google Scholar] [CrossRef] [PubMed]
  20. Puértolas, J.; Alcobendas, R.; Alarcón, J.J.; Dodd, I.C. Long-distance abscisic acid signalling under different vertical soil moisture gradients depends on bulk root water potential and average soil water content in the root zone. Plant Cell Environ. 2013, 36, 1465–1475. [Google Scholar] [CrossRef]
  21. Kodešová, R.; Kodeš, V.; MRáz, A. Comparison of two sensors ECH2O EC-5 and SM200 for measuring soil water content. Soil Water Res. 2011, 6, 102–110. [Google Scholar] [CrossRef] [Green Version]
  22. ASTM D 2974. Standard Test Methods for Moisture, Ash, and Organic Matter of Peat and Organic Soils; ASTM International: West Conshohocken, PA, USA, 2007. [Google Scholar]
  23. Ding, S.; Zhang, B.; Qin, F. Arabidopsis RZFP34/CHYR1, a ubiquitin E3 ligase, regulates stomatal movement and drought tolerance via SnRK2.6-mediated phosphorylation. Plant Cell. 2015, 27, 3228–3244. [Google Scholar] [CrossRef] [PubMed]
  24. Ma, Q.; Xia, Z.; Cai, Z.; Li, L.; Cheng, Y.; Liu, J.; Nian, H. GmWRKY16 enhances drought and salt tolerance through an ABA-mediated pathway in Arabidopsis thaliana. Front Plant Sci. 2019, 9, 1979. [Google Scholar] [CrossRef]
  25. Quarles, S.D. How to implement I2C serial communication using Intel MCS-51 microcontrollers; 1993. Intel Corporation: P.O. Box 7641, Mt. Prospect, IL 60056-7641. Available online: http://electro8051.free.fr/I2C/27231901.pdf. (accessed on 8 March 2018).
  26. Rosenbaum, U.; Huisman, J.A.; Weuthen, A.; Vereecken, H.; Bogena, H.R. Sensor-to-sensor variability of the ECH2O, EC-5, TE, and 5TE sensors in dialectic liquids. Vadose Zone J. 2010, 9, 181–186. [Google Scholar] [CrossRef]
  27. ASTM D 2216. Standard Test Method for Laboratory Determination of Water (Moisture) Content of Soil, Rock, and Soil-Aggregated Mixture; ASTM International: West Conshohocken, PA, USA, 2010. [Google Scholar]
  28. Delta-T. Devices Ltd. User Manual for the SM200 Soil Moisture Sensor; SM200-UM-1; 1 May 2006; Delta-T. Devices Ltd.: Cambridge, UK, 2006. [Google Scholar]
  29. Hillel, D. Introduction to Environmental Soil Physics; Academic press, Elsevier Science: San Diego, CA, USA, 2004; pp. 14–15. Available online: https://dewagumay.files.wordpress.com/2011/12/environmental-soil-physics.pdf (accessed on 16 December 2018).
  30. Da Silva, F.F.; Wallach, R.; Polak, A.; Chen, Y. Measuring water content of soil substitutes with time-DOMAIN reflectometry (TDR). J. Am. Soc. Hortic. Sci. 1998, 123, 734–737. [Google Scholar] [CrossRef]
  31. Kizito, F.; Campbell, C.S.; Campbell, G.S.; Cobos, D.R.; Teare, B.L.; Carter, B.; Hopmans, J.W. Frequency, electrical conductivity and temperature analysis of a low-cost capacitance soil moisture sensor. J. Hydrol. 2008, 352, 367–378. [Google Scholar] [CrossRef]
Figure 1. Acquisition and visualization of real-time data during the soil sample calibration process.
Agriculture 09 00141 g001
Figure 2. Circuit diagram of the data acquisition system.
Agriculture 09 00141 g002
Figure 3. Average raw count as a function of the volumetric water content θ of the tested porous materials (n = 20). The raw count varies with the dielectric constants of the bulk water and air and ranges between 10,000 and 20,000 according to the sensor output.
Agriculture 09 00141 g003
Figure 4. The samples’ soil water contents θ derived from the polynomial function of the SKU:SEN0193 sensor, the polynomial function of the SM-200 sensor for organic soil (manufacturer’s function), and the soil-specific calibration function as a function of volumetric water content: (a) in the range of soil water contents from dry to saturated, (b) in the range of the field capacity.
Agriculture 09 00141 g004
Figure 5. Soil moisture loss with time. The developed calibration function (gravimetric basis) was used to derive the soil moisture loss every minute (Equation (6)).
Agriculture 09 00141 g005
Table 1. The total cost of the developed soil moisture monitoring system (US$ in 2019).
ComponentUnitsUnit Cost ($)Subtotal ($)Total ($)
STC89C52RC11.121.12
ADS111512.732.73
ESP8266-12E11.791.79
SKU:SEN0193 47.2428.96
SHT3013.983.98
LCD160212.122.12
Other components 5.00
45.7
Table 2. Results of the ANOVA test for 20 replications of sensor response measurements of 4 SKU:SEN0193 sensors for 3 different conditions.
ConditionConsiderationDf *Sum of Squares (Raw counts)Mean Square (Raw counts)F Value
40%, g g−1Sensor-to-sensor variability314888295496276530091
Noise7612535165
80%, g g−1Sensor-to-sensor variability333893919112979739813
Noise76874991151
WaterSensor-to-sensor variability3761082425369411121
Noise761719772263
* df: degrees of freedom.

