
Factor Structure of the Daily Spiritual Experiences Scale in a Polish-Christian Sample


1
Institute of Psychology, Pedagogical University of Krakow, 30-084 Krakow, Poland
2
Institute of Psychology, Jesuit University Ignatianum in Krakow, 31-501 Krakow, Poland
*
Author to whom correspondence should be addressed.
Religions 2022, 13(4), 274; https://0-doi-org.brum.beds.ac.uk/10.3390/rel13040274
Submission received: 22 December 2021
/
Revised: 18 March 2022
/
Accepted: 21 March 2022
/
Published: 24 March 2022
(This article belongs to the Section Religions and Health/Psychology/Social Sciences)
Abstract
:The current article presents the factor structure of the Daily Spiritual Experience Scale (DSES) in a Polish-Christian sample. The DSES is a scale that attempts to measure a person’s perception of transcendent experiences in daily life. It covers the following constructs: awe, gratitude, mercy, a sense of connection with the transcendent, and compassionate love. Most validation studies on the DSES show the scale loadings on a single factor, although different populations can show different factor loadings. The study aims to verify the factor structure of the DSES results and to test the psychometric properties of its Polish version. The results of exploratory factor analysis conducted on a sample of 246 individuals and confirmatory factor analysis performed in a sample of 738 participants supported the single-factor model, which includes all 16 items of the DSES. Therefore, it was concluded that qualitatively different spiritual experiences have one common and integrated core with a homogeneous structure. Very high values of internal consistency measures indicate the excellent reliability of the Polish version of the DSES.
1. Introduction
Religious and spiritual experiences are as varied as the interpretations people use to understand their existence. These experiences attract interest from one of the most vibrant branches of the psychology of religion and spirituality (Hood et al. 2018; Paloutzian and Park 2014). Religiosity and spirituality play an important role in the process of fostering well-being and physical and mental health (Chester et al. 2006; Moon and Kim 2013); they can also support coping skills in individuals with depression spectrum disorders (Bonelli et al. 2012). The concepts of spirituality and religiosity are not identical (Oman 2013), and in the literature on the subject, one can encounter various positions regarding the relationship between them. There is intense debate among researchers about these concepts (Harris et al. 2018; Hill et al. 2000; Krok 2009; Skrzypińska 2014; Zinnbauer and Pargament 2005). Spirituality does not necessarily imply the profession or observance of a particular religion. As such, spirituality may be more akin to an individual’s subjective, transcendent experience (Reutter and Bigatti 2014), which emerges whenever one embraces, for example, the beauty of nature or unity with other people (Fisher 2011). Nevertheless, the emergence of the concept of spirituality has led to a narrowing of the classical understanding of religiosity and a stronger polarization of both these terms. As a result, in descriptions of religiosity, formalization, objectivity, and connection with the external structure began to be emphasized, while in descriptions of spirituality—individuality, internal features, and subjectivism are emphasized. Religiosity has thus been linked to beliefs and institutional worship, and spirituality to following positive values, self-actualization, meaning, and authenticity (Mahoney and Shafranske 2013; Zinnbauer and Pargament 2005). Contemporary psychological studies on religiosity and spirituality are increasingly conducted with experimental and quasi-experimental methods, and neuroimaging techniques. However, since the beginning of the psychology of religion, it is self-report questionnaire tools that have been the prevalent method in the study of spiritual and religious experiences (Hood and Belzen 2013).
Created by Underwood (2011), the Daily Spiritual Experiences Scale (DSES) is a self-report questionnaire with 16 items formulated as questions or statements regarding ordinary, everyday experiences related to spirituality and religiosity. As such, these items refer to the realm of experiences rather than specific beliefs or behaviors. The scale is used to measure a generalized sense of connection with the divine or the transcendent as manifested in a variety of experiences that occur in everyday situations (Underwood and Teresi 2002). This connection is relatively independent of any religious or non-religious interpretations. A generalized sense of connection with the divine or the transcendent is conceptualized as a homogeneous subjective property that manifests itself to a similar degree in many different spiritual experiences. People tend to attribute great significance to these experiences and consider them important (Underwood 2011).
DSES items provide descriptions of different types of spiritual experiences such as gratitude, compassion, a sense of transcendence, awe, compassionate love, and a sense of deep tranquility (Underwood 2011). The respondents were asked to indicate the frequency of these experiences on a scale of 1 to 6 (1—never, 2—rarely, 3—some days, 4—most days, 5—every day, 6—many times a day). For the question concerning their closeness to God, they were asked to provide the answer on a scale of 1 to 4 (1—no closeness, 2—I feel some closeness, 3—I feel a very strong closeness, 4—I feel a maximum closeness). Underwood (2011) envisaged the DSES scale as a tool to be used in cross-cultural research involving the followers of different religions or non-believers. The experiences described in the DSES items can include both relationships with God and other non-theistic experiences related to spirituality. The tool has been translated into a number of languages, including Polish (Wnuk et al. 2009), Korean (Shim and Kim 2018), Persian (Saffari et al. 2016), Croatian (Rakošec et al. 2015), and Czech (Malinakova et al. 2018). The psychometric properties of the tool have been analyzed in studies involving individuals from different faiths and populations. For example, Kalkstein and Tower (2009) examined the Jewish population, Shim and Kim (2018) adapted the tool for the study of Korean Christians, Loustalot et al. (2011) used the scale to investigate African Americans.
The purpose of this study is to verify the factor structure of the Polish version of the DSES scores with a population of Christian respondents. Our theoretical and practical rationale for conducting a factor analysis on a Polish-Christian sample is based on a few assumptions. First, that many people live their spirituality in the context of a specific religious tradition (Mahoney and Shafranske 2013), and this applies—among others—to Christians of different denominations (Luhrmann 2012; Zarzycka 2021). Second, in the original version of DSES, only half of the questions use the word God for a personal relationship with the divine/holy/transcendent (Underwood 2013), which does not adequately reflect the religious spirituality of Christians because for them the content of spirituality does not emerges only from the personal choice of the individual. Third, some qualitative and quantitative research suggests that practicing Christians express their essential spirituality in terms of religion (Luhrmann 2012; Swinton 2020; Swinton and Mowat 2016). In short, we wanted to avoid the trap of “thin spirituality” (Swinton and Pattison 2010) in the case of religious people involved in the development of their spiritual life (Beck and Haugen 2013).
1.1. Psychometrics of the DSES
The factor structure of the DSES has been investigated in a number of studies in individuals from various cultures or religions as well as non-believers. The author of the original version of the DSES proposed a single-factor structure for the questionnaire (Underwood and Teresi 2002). The unidimensionality of the DSES has been confirmed in several scientific studies (Graciete et al. 2016; Kim et al. 2016; Saffari et al. 2016; Soósová and Mauer 2021; Underwood and Teresi 2002). However, the single-factor solution is not always reflected in the results of psychometric analyses.
The psychometric analysis of the DSES scale conducted by Malinakova et al. (2018), across a sample of 1800 Czech respondents, indicated a two-factor structure of the questionnaire. They identified “Intrapsychic” (13 items) and “Interpsychic” (3 items) factors using exploratory factor analysis (EFA) with the Kaiser criterion, parallel analysis (Horn 1965), and minimum average partial (Velicer 1976). EFA was performed using weighted least squares (WLS) with oblique rotation (Oblimin). Due to the high correlation between 2 items in the “Interpsychic” factor, the authors decided to exclude one item from the final model. The data fit of the created model was tested using confirmatory factor analysis (CFA) with the diagonally weighted least squares (DWLS) estimation method. The single-factor model ( = 1351.4, df = 90, SRMR = 0.055, TLI = 0.997, CFI = 0.997, RMSEA = 0.088) and two-factor model compared in the study obtained a satisfactory fit to the data. However, it was the proposed two-factor model that showed a much better data fit ( = 648.1, df = 89, SRMR = 0.037, TLI = 0.999, RMSEA = 0.059). The main limitation of this study was a high number of non-religious respondents (70.5%), and as a result, it is unknown how the model would perform on a population of religious individuals.
The psychometric properties of the DSES scale in a study involving a sample of 649 American students from a private, Catholic university (Lace and Handal 2017) also suggest a two-factor structure for the questionnaire. Using principal component analysis (PCA) with promax (oblique) rotation and the Kaiser criterion, the authors extracted two main components, which they defined as Closeness to the Divine (10 items) and Selflessness (6 items). The resulting model was verified using CFA with the unweighted least squares (ULS) estimation method in the same sample (GFI = 0.95, AGFI = 0.94, NFI = 0.94, RFI = 0.93, SRMR = 0.16). Participants in this study were from diverse religious backgrounds. They identified themselves as Catholic (56.2%), Protestant, other Christian denominations, agnostic, Hindu, Muslim, Buddhist, and Jewish. Therefore, the two-factor model proposed by the researchers is not justified for replication on a religiously homogeneous group.
A study in a sample of Australian adults by Schuurmans-Stekhoven (2013) also confirms the two-factor model of the scale. By conducting EFA with orthogonal rotation, the authors extracted factors that they defined as theistic (“God”—10 items) and non-theistic (“Civil”—6 items). Two-thirds (59%) of the study participants declared an affiliation to a specific religion, and Catholics were the dominant group (91%).
Research on individuals from Judaic religions conducted by Kalkstein and Tower (2009) using unrotated EFA suggests the same two-factor structure of the scale in a group of homogenous religious affiliation (N = 88) and in a group with various religious affiliation (N = 409). The 14 DSES items which contained the words “God” or “religion” achieved high single-factor loadings. The other two items: “I feel a selfless caring for others” and “I accept others even when they do things I think are wrong” formed the second factor, which Kalkstein and Tower (2009) labeled “compassionate love”, following the remarks of Underwood and Teresi (2002) about their content.
Analyses conducted in Alcoholics Anonymous by Zemore and Kaskutas (2004) revealed a two-factor structure for the DSES scale. The researchers presented the EFA scores as the following factors: Theism (9 items) and Self-Transcendence (5 items). Due to their low correlation with other items included in the extracted factors, the items “I feel thankful for my blessings" and "In general, how close do you feel to God?” were not included in the discussed model. The structure of the DSES scale was verified by the researchers using CFA with maximum likelihood (ML) in the same sample. The proposed two-factor model showed a better data fit ((diff) = 83.8, df = 1) than the single-factor model including all 16 items. However, the authors did not present the item structure of the extracted factors or provide information on whether they used any rotation in EFA.
The Polish validation of the DSES scale was carried out by Wnuk et al. (2009) in a group of 70 Alcoholics Anonymous and 115 students. Both groups obtained satisfactory results in the questionnaire’s accuracy and reliability. The results of EFA in this study suggested a two-factor solution. The author did not provide any information about the factor structure of DSES items and about the applied method of factors rotation. To date, all psychometric data collected in Poland have come from studies conducted in groups of people with alcohol dependence (Wnuk et al. 2009), or shopping addiction and students (Charzyńska et al. 2021; Wnuk et al. 2009).
The conducted factor analyses show that the factor structure of the DSES scale is different depending on the type of psychometric methods used (various estimation methods, PCA and EFA) and the background, degree of religiosity, and creed of the respondents. The two most frequently verified models are single-factor and two-factor structures, in which individual factors are composed of different items. The vast majority of those researchers who investigated the structure of the DSES scale indicate the need for further research on the factor structure of the responses given to its items, especially those related to the age, background, creed, and religiosity of the respondents (Hammer and Cragun 2019; Lace and Handal 2017; Malinakova et al. 2018; Saffari et al. 2016; Soósová and Mauer 2021). However, resolving this issue requires the availability of cultural adaptations of the DSES, tailored to the specific characteristics of different groups, with a previously validated factor structure and psychometric properties. In our study, we addressed this very issue.
1.2. Present Study
The aim of this study was to verify the factor structure of the DSES scores and to test the psychometric properties of its Polish version in a population of Christians. For this purpose, the study was conducted in two separate samples. An EFA was performed on data from Sample 1. Results from Sample 2 were subjected to CFA. We compared the fit of the data to three different structural models: one-dimensional model (Underwood and Teresi 2002), two-factor model of Kalkstein and Tower (2009), and two-factor model of Schuurmans-Stekhoven (2013). We derived these models from studies conducted on non-clinical, religiously homogeneous groups, which included a detailed description of the factor analyses and their results, including factor loadings and correlations between factors. Finally, using Cronbach’s alpha and McDonald’s omega coefficient values, the internal consistency of the scale covering all 16 items was determined according to the univariate model. Mcdonald (1999)’s omega method provides a correction for alpha underestimation error whenever the tau equivalence assumption is violated (Dunn et al. 2014).
2. Methods
2.1. Participants
Sample 1 included 246 participants with 71 males (28.9%) and 175 females (71.1%). The mean age of the Sample 1 respondents was 44.4 years, and the standard deviation was 14.4 years. Higher education was declared by 183 people, which was 74.4% of the sample. Secondary education was declared by 25.6% of the participants. Approximately half the sample was married (46.7%), a fourth were single 26.8%, and the remaining participants were either in a relationship (11.8%), divorced (6.1%), clergy (5.3%), or widowed (3.3%). All participants in Sample 1 declared Catholic denomination.
Sample 2 (the CFA part of the study) consisted of 738 participants, including 168 males (22.8%) and 570 females (77.2%) aged 18 to 81 years. The mean age of the respondents was 39.5 years, with a standard deviation of 13.5. The majority of the respondents (73.4%) declared a university degree; secondary education was declared by 25.1% of the participants, and primary education by 11 people, representing 1.5% of Sample 2. Almost half the sample was married (44.2%), over a third were single 40.9%, and the remaining participants were either in a relationship (9.8%) or clergy (5.1%). Most of the respondents were Christians, including Catholics, who made up the vast majority (97.0%) of the sample. The second-largest group of Christians in the sample were Protestants (1.8%). The third-largest group (0.8%) were those who described their religion as “other Christian denominations”.
2.2. Procedure
The study was conducted between 17 November 2020, and 14 March 2022. Due to the COVID-19 pandemic, surveys were conducted online. The calls to participate in the study with links to the web-based surveys were distributed via social media. The recipients of the message were also requested to share it with their friends. A combination of convenience and snowball sampling was used. The study was anonymous and conducted according to the guidelines of the Declaration of Helsinki (World Medical Association 2013), and approved by the appropriate institutional Research Ethics Board.
2.3. Measures
The DSES is a 16-item scale consisting of questions or statements regarding everyday experiences related to spirituality and religiosity. Respondents were asked to indicate the frequency of these experiences on a scale of 1 to 6 (1—never, 2—rarely, 3—some days, 4—most days, 5—daily, 6—many times a day). The last question, regarding closeness with God, respondents were asked to answer on a scale of 1 to 4 (1—no closeness, 2—I feel some closeness, 3—I feel very strong closeness, 4—I feel maximum closeness). The original version of the scale for research use can be downloaded from the author’s website (Underwood 2022). Subjects were also asked to answer questions about their age, gender, education level, marital status, and declared religion.
2.4. Statistical Analysis
The Pearson correlation coefficient was applied to evaluate the relationships between responses to the individual items of DSES. The EFA was performed on data obtained from Sample 1, using the principal axis factor extraction method with Oblimin rotation. Bartlett’s (1950) test of the sphericity of the correlation matrix and the Kaiser–Meyer–Olkin normalized measure of sampling adequacy (MSA) (Kaiser and Rice 1974) were computed to assess the suitability of data for factor analysis. The comparison of initial eigenvalues with the results of simulations on random data obtained in parallel analysis (Horn 1965) was used to determine the number of factors.
A total of 771 individuals participated in the CFA part of the study, 738 of whom were qualified for further analysis. Responses from 3 subjects were considered unreliable because they simultaneously declared female gender and being a priest, which is not under the tradition and law of the Catholic Church. The remaining 30 records were removed due to declaring a denomination other than Christianity. A total of 33 observations were excluded from further analyses.
Structural equation modeling was conducted using the DWLS estimation method (Jöreskog 1994), which provides more accurate estimates of model parameters and is more robust to deviations from normality (Mindrila 2010). Factor metrics were scaled from the variance of the first factor indices using the marker-variable method. The root mean square error of approximation (RMSEA), comparative fit index (CFI), Tucker–Lewis index (TLI), and /df ratio were used to assess the data fit of the model during CFA. The criteria for a good model fit proposed by Weston and Gore (2006) were considered when evaluating each model: RMSEA < 0.06, CFI > 0.95, and TLI > 0.95. A /df ratio < 3 was also considered a good model fit (Kline 2005).
The free and open-source statistical software, jamovi (The jamovi Project 2021), which is based on the R programming language for statistical computing (R Core Team 2021), was used for statistical analysis. Structural equation modeling was conducted in the jamovi SEM Analysis (Gallucci and Jentschke 2021) module, which is based on the lavaan R package for structural equation modeling (Rosseel 2012). Cronbach’s alpha and McDonald’s omega internal consistency coefficients were also computed. Values of these reliability coefficients higher than 0.7 are considered satisfactory, higher than 0.8 are considered good, and higher than 0.9 are considered excellent.
3. Results
3.1. Sample 1
Figure 1 presents the correlations between responses to DSES items in Sample 1. All correlations were positive and significant, ranging from 0.23 to 0.87. The results of Bartlett’s test of sphericity of the correlation matrix, ( = 3214.993, df = 120, p < 0.001) indicated that correlations among responses to the individual items of the Polish version of DSES in Sample 1 differed significantly from zero. The overall Kaiser–Meyer–Olkin MSA was high (MSA = 0.945) and all MSA values for individual items ranged from 0.885 to 0.982 (see: Table 1), which confirmed the good factorability of the correlation matrix in Sample 1.
3.2. Sample 2
All correlations between DSES items were positive and ranged from 0.07 to 0.86. The matrix is shown as a heatmap in Figure 3.
Presented in Table 2, the results of CFA for the models tested in the study show that the two-factor models built according to Kalkstein and Tower (2009) and the Schuurmans-Stekhoven (2013) factor solutions do not meet the criteria for a good data fit for the results obtained in the study conducted in the Christian sample.
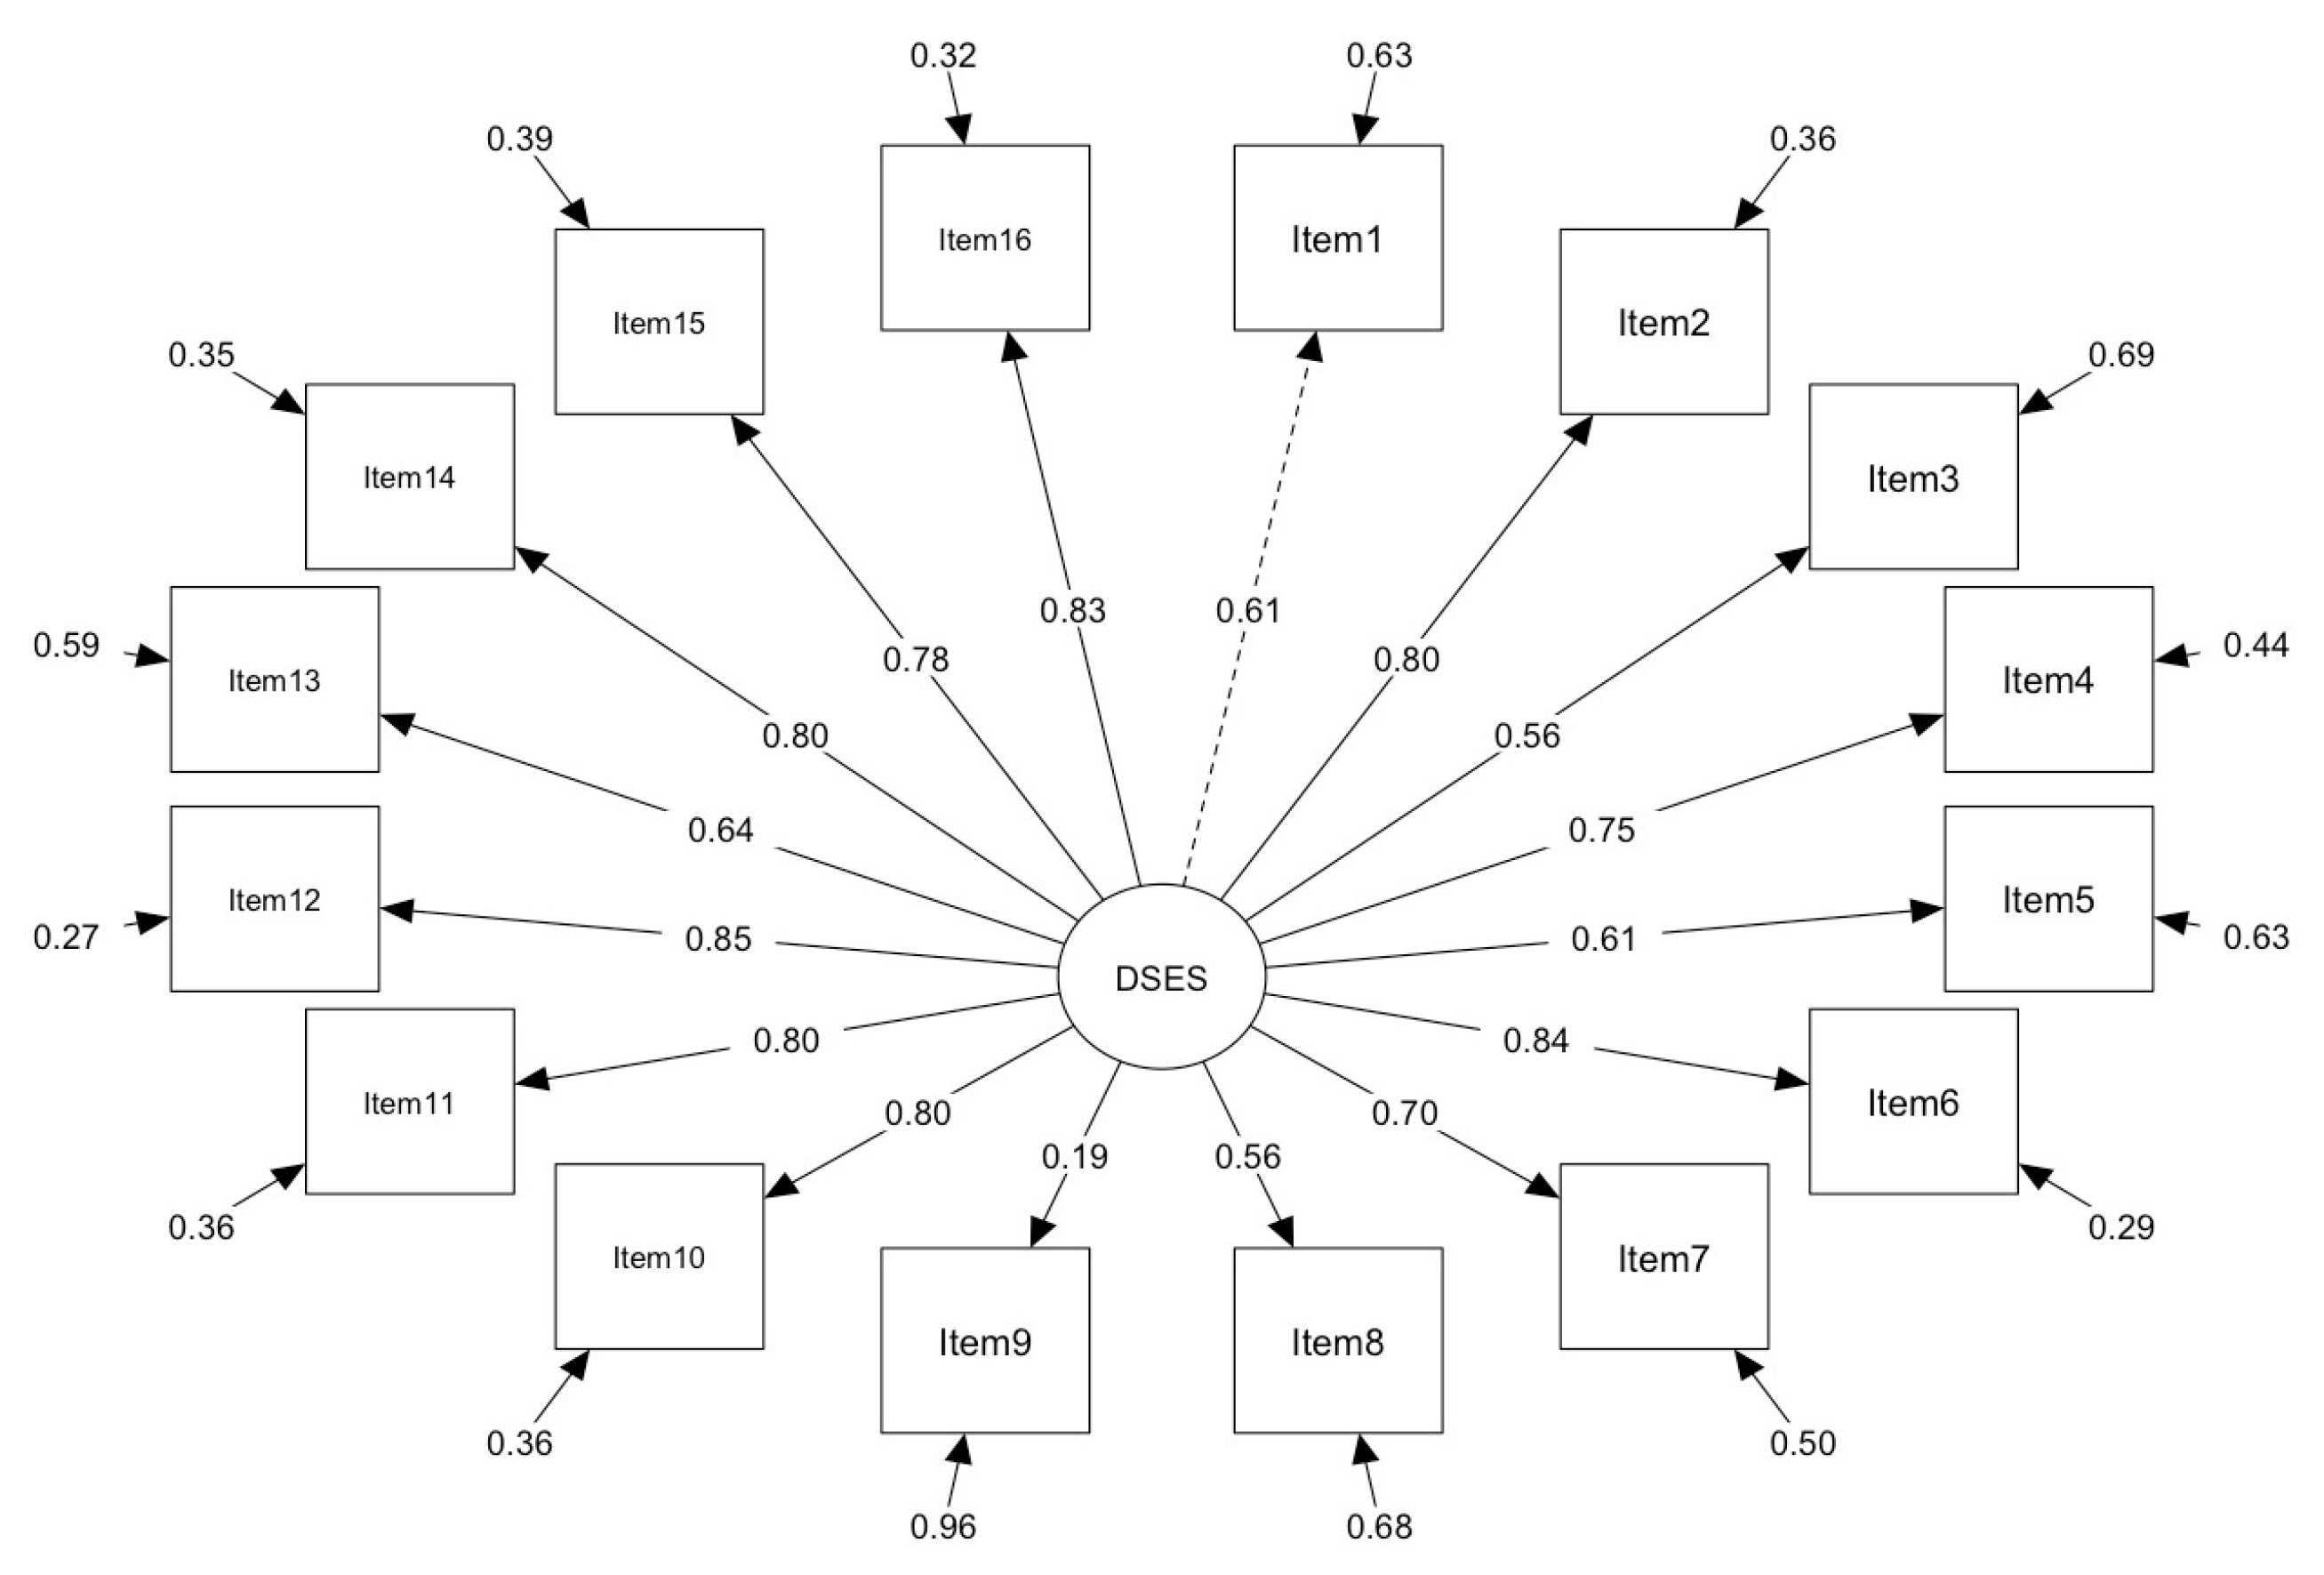
The univariate model by Underwood and Teresi (2002) tested in the study had good fit indices ( = 261, df = 104, RMSEA = 0.046, CFI = 0.990, TLI—0.989). All item factor loadings, except item 9, were between 0.56 and 0.85 (Table 3). The factor loading of item 9 (“I accept others even when they do things I think are wrong”) was 0.19 in this model. As the model including all items had high fit indices, we decided to leave one item with a relatively low loading. The covariance matrices of the residuals are included in the Supplementary Materials. A graphical presentation of the results obtained for the univariate model is shown in Figure 4.
In the univariate model, the mean score in the DSES was 59.5 in Sample 2 and 62.7 in Sample 1, with a standard deviation of 14.576 in Sample 2 and 16.776 in Sample 1. The median score was 61 in Sample 1 and 65 in Sample 2 (Table 4). Reliability statistics for DSES items are shown in Table 5 and Table 6.
4. Discussion
The aim of the study was to verify the factor structure of the results obtained in the Polish version of DSES and to define its psychometric properties. In EFA conducted on data from Sample 1, only the first initial eigenvalue exceeded the simulated data from parallel analysis and was over eight times higher than the second eigenvalue. This clearly indicates a univariate factor structure of responses to the items of the Polish version of DSES. One extracted factor explains more than half of the common variance and is formed by responses to all DSES items. Thus, the EFA results indicate that the factor structure obtained in our study is consistent with the Underwood and Teresi’s (2002) model. It should also be noted that responses to item 9 (“I accept others even when they do things I think are wrong”) are somewhat less related to the latent variable (factor load = 0.417) and have relatively high unique variance (uniqueness = 0.80). This is due to the weaker correlation of this item with the others, apparent in the correlation matrix. This item also has a lower item-rest correlation (0.41) than the others. However, the strength of the association of responses to this item with the latent variable and with the DSES total score meets the criteria for inclusion of this item in the scale, and dropping this item would not lead to higher internal consistency measures for the total score. Similarly, in Underwood and Teresi’s (2002) study, item 9 showed a slightly weaker association with the total score but was retained since it was considered important in terms of the range of content addressed by the scale (Underwood 2011).
CFA was used to test the fit of the data from Sample 2 to the three alternative structural models: Kalkstein and Tower’s (2009) two-factor model, Schuurmans-Stekhoven’s (2013) two-factor model, and the unifactorial model, first presented by Underwood and Teresi (2002). The unifactorial model was the only one to meet the data fit criteria we adopted for the study. The goodness of fit of CFI and TLI for the unifactorial model turned out to be very high, which suggests an excellent fit of the model. However, the goodness of fit for both two-factor models was significantly different from the assumed threshold values. The results confirm that in the sample of Polish Christians the generalized sense of connection with the divine or transcendent shows as a homogeneous, cohesive individual property, and it is manifested to a similar degree in different types of spiritual experiences that occur in everyday situations. Therefore, it can be concluded that there is probably one common and integrated root of homogeneous structure underlying qualitatively different spiritual experiences. The obtained results confirm that the generalized sense of connection with the divine or transcendent can be quantitatively measured with high accuracy and low measurement error using the Polish version of the DSES. This is indicated by the very high values of both measures of internal consistency (Cronbach’s alpha and McDonald’s omega).
Therefore, the covariances of the residuals of items 1 and 3, and 10 and 11 for all three models are slightly elevated, which may indicate that in all three models tested, the relationship between these variables may be underestimated. It should also be noted that the responses to item 9 (“I accept others even if they do things I think are wrong”) show a weak correlation with the factor representing the latent variable in the CFA (factor loading = 0.19) and DSES total score (adjusted item-total correlation = 0.20). This result may indicate the poor content validity of this item. Alternatively, this can be explained by the fact that individuals in the study population tend to exhibit aversion to those with a different worldview and a different attitude toward religion. However, this conclusion would need to be confirmed in separate studies conducted using appropriate methods. We decided not to remove this item, given the very high values of both measures of internal consistency (Cronbach’s alpha and McDonald’s omega) and the need to ensure a cross-cultural comparison in research conducted using the Polish version of the DSES and other language versions of the scale.
The psychometric properties of the Polish version of the DSES turned out to be similar to the original version of the scale. Therefore, the Polish version of the DSES is an easy-to-use and valuable self-report questionnaire for the examination of a generalized sense of spiritual connection with the divine or transcendent. This connection is defined as a common and homogeneous inner root that underlies a variety of experiences occurring in everyday situations. One important avenue for further explorations would be to verify whether the response structure of the DSES items exhibits measurement and structural invariance with respect to language versions of the scale, cultural variables, and types of religion. This requires further international research using different language versions of the DSES. It can be conducted in groups of people from different cultures and professing different religions, as well as non-believers.
Our study had also some limitations. First, the combination of convenience sampling and snowball sampling we used has some disadvantages as it may not provide a fully representative sample and is not robust to community bias. The sampling method used in our study is associated with a predominance of subjects with higher education. The use of the snowball method and convenience recruitment may lead to limited generalizability of the results of this study to the general population of Polish Christians. Second, in online research, the ability to control for confounding factors such as time of day, other activities going on at the same time, physical factors (e.g., noise, music), and social factors, including the possible presence of other people and possible interactions with them, is limited.
Supplementary Materials
The following supporting information can be downloaded at: https://0-www-mdpi-com.brum.beds.ac.uk/article/10.3390/rel13040274/s1.
Author Contributions
Conceptualization, Ł.K., J.W. and J.P.; methodology, Ł.K. and J.W.; writing—original draft preparation, J.W. and Ł.K.; formal analysis, Ł.K. and J.W.; investigation, Ł.K.; supervision, J.P.; project administration, J.P. All authors have read and agreed to the published version of the manuscript.
Funding
Funds for publication costs were granted to the authors on the basis of application number BN.302.268.2021.RN from a research subsidy for the maintenance and development of research potential that was awarded to the Pedagogical University in Krakow by the Polish Ministry of Education and Science.
Institutional Review Board Statement
The study was conducted according to the guidelines of the Declaration of Helsinki, and approved by the Research Ethics Board at the Jesuit University Ignatianum in Cracow.
Informed Consent Statement
Informed consent was obtained from all subjects involved in the study.
Data Availability Statement
The data that support the findings of this study are available from the author, J.W., upon reasonable request.
Conflicts of Interest
The authors declare no conflict of interest.
References
- Bartlett, Maurice S. 1950. Tests of significance in factor analysis. British Journal of Statistical Psychology 3: 77–85. [Google Scholar] [CrossRef]
- Beck, Richard, and Andrea D. Haugen. 2013. The Christian Religion: A Theological and Psychological Review. APA Handbooks in Psychology®. Washington, DC: American Psychological Association, pp. 697–711. [Google Scholar] [CrossRef]
- Bonelli, Raphael, Rachel E. Dew, Harold G. Koenig, David H. Rosmarin, and Sasan Vasegh. 2012. Religious and spiritual factors in depression: Review and integration of the research. Depression Research and Treatment 2012: 962860. [Google Scholar] [CrossRef] [PubMed]
- Charzyńska, Edyta, Magdalena Sitko-Dominik, Ewa Wysocka, and Agata Olszanecka-Marmola. 2021. Exploring the roles of daily spiritual experiences, self-efficacy, and gender in shopping addiction: A moderated mediation model. Religions 12: 355. [Google Scholar] [CrossRef]
- Chester, Deirdra N., Susan P. Himburg, and Lorraine J. Weatherspoon. 2006. Spirituality of African-American women: Correlations to health-promoting behaviors. The Journal of the National Black Nurses Association 17: 1–8. [Google Scholar] [CrossRef]
- Dunn, Thomas J., Thom Baguley, and Vivienne Brunsden. 2014. From alpha to omega: A practical solution to the pervasive problem of internal consistency estimation. British Journal of Psychology 105: 399–412. [Google Scholar] [CrossRef] [Green Version]
- Fisher, John. 2011. The four domains model: Connecting spirituality, health and well-being. Religions 2: 17–28. [Google Scholar] [CrossRef]
- Gallucci, Marcello, and Sebastian Jentschke. 2021. Semlj: Jamovi SEM Analysis. [Jamovi Module]. Available online: https://semlj.github.io/ (accessed on 10 December 2021).
- Graciete, Lo, Chen Jack, Wasser Thomas, Portenoy Russell, and Dhingra Lara. 2016. Initial validation of the Daily Spiritual Experiences Scale in Chinese immigrants with cancer pain. Journal of Pain and Symptom Management 51: 284–91. [Google Scholar] [CrossRef]
- Hammer, Joseph H., and Ryan T. Cragun. 2019. Daily spiritual experiences and well-being among the nonreligious, spiritual, and religious: A bifactor analysis. Psychology of Religion and Spirituality 11: 463–73. [Google Scholar] [CrossRef] [Green Version]
- Harris, Kevin A., Desiree S. Howell, and Don W. Spurgeon. 2018. Faith concepts in psychology: Three 30-year definitional content analyses. Psychology of Religion and Spirituality 10: 1–29. [Google Scholar] [CrossRef]
- Hill, Peter C., Kenneth Pargament II, Ralph W. Hood, Michael E. McCullough Jr., James P. Swyers, David B. Larson, and Brian J. Zinnbauer. 2000. Conceptualizing religion and spirituality: Points of commonality points of departure. Journal for the Theory of Social Behaviour 30: 51–77. [Google Scholar] [CrossRef]
- Hood, Ralph W., and Jacob A. Belzen. 2013. Research methods in the psychology of religion and spirituality. In Handbook of the Psychology of Religion and Spirituality, 2nd ed. Edited by Raymond F. Paloutzian and Crystal L. Park. New York: The Guilford Press, pp. 75–93. [Google Scholar]
- Hood, Ralph W., Peter C. Hill, and Bernard Spilka. 2018. The Psychology of Religion: An Empirical Approach, 5th ed. New York: The Guilford Press. [Google Scholar]
- Horn, John L. 1965. A rationale and test for the number of factors in factor analysis. Psychometrika 30: 179–85. [Google Scholar] [CrossRef] [PubMed]
- Jöreskog, Karl G. 1994. Structural Equation Modeling with Ordinal Variables. In Multivariate Analysis and Its Applications. Edited by Theodore W. Anderson, Kai T. Fang and Ingram Olkin. Beachwood: Institute of Mathematical Statistics, pp. 297–310. [Google Scholar] [CrossRef]
- Kaiser, Henry F., and John Rice. 1974. Little jiffy, mark iv. Educational and Psychological Measurement 34: 111–17. [Google Scholar] [CrossRef]
- Kalkstein, Solomon, and Roni Beth Tower. 2009. The Daily Spiritual Experiences Scale and well-being: Demographic comparisons and scale validation with older Jewish adults and a diverse Internet sample. Journal of Religion and Health 48: 402–17. [Google Scholar] [CrossRef] [PubMed]
- Kim, Seong-Hyeon, Bess J. Martin, and Anne T. Nolty. 2016. The factor structure and measurement invariance of the Daily Spiritual Experiences Scale. The International Journal for the Psychology of Religion 26: 240–51. [Google Scholar] [CrossRef]
- Kline, Rex B. 2005. Principles and Practice of Structural Equation Modeling, 2nd ed. New York: The Guilford Press. [Google Scholar]
- Krok, Dariusz. 2009. Religijność a duchowość—Różnice i podobieństwa z perspektywy psychologii religii (religiousness and spirituality—Differences and similarities from the perspective of psychology of religion). Polskie Forum Psychologiczne 14: 126–41. [Google Scholar]
- Lace, John W., and Paul J. Handal. 2017. Psychometric properties of the Daily Spiritual Experiences Scale: Support for a two-factor solution, concurrent validity, and its relationship with clinical psychological distress in university students. Religions 8: 123. [Google Scholar] [CrossRef] [Green Version]
- Loustalot, Fleetwood, Sharon B. Wyatt, Mario Sims, Christopher G. Ellison, Herman A. Taylor, and Lynn Underwood. 2011. Psychometric testing of the Daily Spiritual Experiences Scale among African Americans in the Jackson Heart Study. Journal of Religion and Health 50: 675–85. [Google Scholar] [CrossRef] [Green Version]
- Luhrmann, Tanya M. 2012. When God Talks Back: Understanding the American Evangelical Relationship with God. New York: Vintage Books. [Google Scholar]
- Mahoney, Annette, and Edward P. Shafranske. 2013. Envisioning an integrative paradigm for the psychology of religion and spirituality. In APA handbook of Psychology, Religion, and Spirituality (Volume 1): Context, Theory, and Research. Edited by Kenneth I. Pargament, Julie J. Exline and James W. Jones. APA Handbooks in Psychology. Washington, DC: American Psychological Association, pp. 3–19. [Google Scholar] [CrossRef]
- Malinakova, Klara, Radek Trnka, Gabriela Sarnikova, Vladimir Smekal, Jana Furstova, and Peter Tavel. 2018. Psychometric Evaluation Of The Daily Spiritual Experience Scale (DSES) In The Czech Environment. Ceskoslovenska Psychologie 62: 100–13. [Google Scholar]
- Mcdonald, Roderick P. 1999. Test Theory: A Unified Treatment. New York: Psychology Press. [Google Scholar] [CrossRef]
- Mindrila, Diana. 2010. Maximum Likelihood (ML) And Diagonally Weighted Least Squares (DWLS) Estimation Procedures: A Comparison Of Estimation Bias With Ordinal And Multivariate Non-normal Data. International Journal of Digital Society 1: 60–66. [Google Scholar] [CrossRef]
- Moon, Yoo Sun, and Do Hoon Kim. 2013. Association between religiosity/spirituality and quality of life or depression among living-alone elderly in a South Korean city. Asia Pac Psychiatry 5: 293–300. [Google Scholar] [CrossRef]
- Oman, Doug. 2013. Defining religion and spirituality. In Handbook of the Psychology of Religion and Spirituality, 2nd ed. Edited by Raymond F. Paloutzian and Crystal L. Park. New York: The Guilford Press, pp. 23–47. [Google Scholar]
- Paloutzian, Raymond F., and Crystal L. Park. 2014. Handbook of the Psychology of Religion and Spirituality, 2nd ed. New York: The Guilford Press. [Google Scholar]
- R Core Team. 2021. R: A Language and Environment for Statistical Computing. Version 4.0 (Computer Software). Vienna: R Foundation for Statistical Computing, Available online: https://www.r-project.org (accessed on 10 December 2021).
- Rakošec, Željko, Štefica Mikšić, Brankica Juranić, and Lana Batinić. 2015. Psychometric characteristics of Croatian version of the Daily Spiritual Experience Scale. Religions 6: 712–23. [Google Scholar] [CrossRef] [Green Version]
- Reutter, Kirby K., and Silvia M. Bigatti. 2014. Religiosity and spirituality as resiliency resources: Moderation, mediation, or moderated mediation? Journal for the Scientific Study of Religion 53: 56–72. [Google Scholar] [CrossRef] [Green Version]
- Rosseel, Yves. 2012. lavaan: An R package for structural equation modeling. Journal of Statistical Software 48: 1–36. [Google Scholar] [CrossRef] [Green Version]
- Saffari, Mohsen, Amir H. Pakpour, Seyed Fattah Mortazavi, and Harold G. Koenig. 2016. Psychometric characteristics of the Muslim Religiosity Scale in Iranian patients with cancer. Palliat Support Care 14: 612–20. [Google Scholar] [CrossRef] [PubMed] [Green Version]
- Schuurmans-Stekhoven, James Benjamin. 2013. ‘As A Shepherd Divideth His Sheep From The Goats’: Does The Daily Spiritual Experiences Scale Encapsulate Separable Theistic And Civility Components? Social Indicators Research 110: 131–46. [Google Scholar] [CrossRef]
- Shim, Jung Yeon, and Jun Soo Kim. 2018. Development Of The Korean Christian Version Of The Daily Spiritual Experience Scale (KCDSES). Mental Health, Religion & Culture 21: 910–25. [Google Scholar] [CrossRef]
- Skrzypińska, Katarzyna. 2014. The Threefold Nature Of Spirituality (TNS) In A Psychological Cognitive Framework. Archive for the Psychology of Religion 36: 277–302. [Google Scholar] [CrossRef]
- Soósová, Mária Sováriová, and Boris Mauer. 2021. Psychometrics properties of the Daily Spiritual Experience Scale in Slovak elderly. Journal of Religion and Health 60: 563–75. [Google Scholar] [CrossRef]
- Swinton, John. 2020. Finding Jesus in the Storm: The Spiritual Lives of Christians with Mental Health Challenges. London: SCM Press. [Google Scholar]
- Swinton, John, and Harriet Mowat. 2016. Practical Theology and Qualitative Research. London: SCM Press. [Google Scholar]
- Swinton, John, and Stephen Pattison. 2010. Moving beyond clarity: Towards a thin, vague, and useful understanding of spirituality in nursing care. Nursing Philosophy 11: 226–37. [Google Scholar] [CrossRef]
- The Jamovi Project. 2021. Jamovi. Version 2.2.2 (Computer Software). Available online: https://www.jamovi.org (accessed on 10 December 2021).
- Underwood, Lynn. 2013. Spiritual Connection in Daily Life: Sixteen Little Questions That Can Make a Big Difference. West Conshohocken: Templeton Foundation Press. [Google Scholar]
- Underwood, Lynn G. 2011. The Daily Spiritual Experiences Scale: Overview and results. Religions 2: 29–50. [Google Scholar] [CrossRef]
- Underwood, Lynn G. 2022. Daily Spiritual Experiences Scale. Available online: http://www.dsescale.org (accessed on 10 December 2021).
- Underwood, Lynn G., and Jeanne A. Teresi. 2002. The Daily Spiritual Experiences Scale: Development, theoretical description, reliability, exploratory factor analysis, and preliminary construct validity using health-related data. Annals of Behavioral Medicine 24: 22–33. [Google Scholar] [CrossRef]
- Velicer, Wayne F. 1976. Determining the number of components from the matrix of partial correlations. Psychometrika 41: 321–27. [Google Scholar] [CrossRef]
- Weston, Rebecca, and Paul A. Gore Jr. 2006. A brief guide to structural equation modeling. The Counseling Psychologist 34: 719–51. [Google Scholar] [CrossRef]
- Wnuk, Marcin, Jerzy Marcinkowski, and Mateusz Hędzelek. 2009. Pośredni charakter relacji między doświadczeniami duchowymi a dobrostanem jednostek współuzależnionych (indirect relationship between spiritual experience and wellbeing among co-dependent persons). Psychiatria 6: 82–90. [Google Scholar]
- World Medical Association. 2013. World Medical Association Declaration of Helsinki: Ethical Principles for Medical Research Involving Human Subjects. JAMA 310: 2191–94. [Google Scholar] [CrossRef] [PubMed] [Green Version]
- Zarzycka, Beata. 2021. Tradycja czy charyzma? religijność w polsce (tradition or charisma? religiosity in poland). In Wybrane Zagadnienia z Psychologii Religii. Funkcja i tożsamość (Selected Issues in the Psychology of Religion. Function and Ddentity). Edited by Bartczuk Rafał, Marzel Marek, Wiechetek Michał, Zarzycka Beata and Jacek Śliwak. Lublin: Wydawnictwo Uniwersytetu Marii Curie-Skłodowskiej, pp. 11–34. [Google Scholar]
- Zemore, Sarah E., and Lee Ann Kaskutas. 2004. Helping, spirituality and alcoholics anonymous in recovery. Journal of Studies on Alcohol 65: 383–91. [Google Scholar] [CrossRef]
- Zinnbauer, Brian J., and Kenneth I. Pargament. 2005. Religiousness and spirituality. In Handbook of the Psychology of Religion and Spirituality, 1st ed. Edited by Raymond F. Paloutzian and Crystal L. Park. New York: The Guilford Press, pp. 21–42. [Google Scholar]
Figure 1.
A heatmap showing Pearson correlations between DSES items in Sample 1.

Figure 2.
Scree plot showing the initial eigenvalues for exploratory factor analysis in Sample 1 and results of simulations on random data obtained in parallel analysis.
Figure 2.
Scree plot showing the initial eigenvalues for exploratory factor analysis in Sample 1 and results of simulations on random data obtained in parallel analysis.

Figure 3.
A heatmap showing Pearson correlations between DSES items in Sample 2.

Figure 4.
Diagram presenting the results obtained in confirmatory factor analysis for our data fitted to (Underwood and Teresi)’s (2002) unifactorial model in Sample 2.
Figure 4.
Diagram presenting the results obtained in confirmatory factor analysis for our data fitted to (Underwood and Teresi)’s (2002) unifactorial model in Sample 2.


Table 1.
Kaiser–Meyer–Olkin measure of sampling adequacy (MSA) for individual items of DSES, factor loadings, and uniqueness which was obtained in exploratory factor analysis performed on data from Sample 1.
Table 1.
Kaiser–Meyer–Olkin measure of sampling adequacy (MSA) for individual items of DSES, factor loadings, and uniqueness which was obtained in exploratory factor analysis performed on data from Sample 1.
| Item | Kaiser–Meyer–Olkin MSA | Factor Loadings in EFA | Uniqueness in EFA |
|---|---|---|---|
| 1 | 0.920 | 0.610 | 0.627 |
| 2 | 0.936 | 0.810 | 0.345 |
| 3 | 0.885 | 0.565 | 0.680 |
| 4 | 0.982 | 0.756 | 0.429 |
| 5 | 0.962 | 0.812 | 0.340 |
| 6 | 0.924 | 0.855 | 0.268 |
| 7 | 0.956 | 0.788 | 0.379 |
| 8 | 0.950 | 0.624 | 0.611 |
| 9 | 0.946 | 0.417 | 0.826 |
| 10 | 0.908 | 0.820 | 0.327 |
| 11 | 0.924 | 0.846 | 0.284 |
| 12 | 0.964 | 0.854 | 0.271 |
| 13 | 0.948 | 0.795 | 0.368 |
| 14 | 0.960 | 0.780 | 0.392 |
| 15 | 0.967 | 0.815 | 0.336 |
| 16 | 0.963 | 0.839 | 0.296 |
Table 2.
Goodness-of-fit for the three DSES factor models tested in the study in Sample 2.
| Model | /df Ratio | RMSEA (90% CI) | CFI | TLI |
|---|---|---|---|---|
| 2-factor Kalksetin and Tower’s model | 1224/103 (11.9) | 0.121 (0.115–0.128) | 0.863 | 0.840 |
| 2-factor Schuurmans-Stekhoven’s model | 1215/103 (11.8) | 0.121 (0.115–0.127) | 0.864 | 0.841 |
| Underwood and Teresi’s model | 261/104 (2.5) | 0.046 (0.039–0.053) | 0.990 | 0.989 |
Table 3.
Fully standardized factor loadings and standardized errors for the three models under study in Sample 2.
Table 3.
Fully standardized factor loadings and standardized errors for the three models under study in Sample 2.
| Items | Schuurmans-Stekhoven’s 2-Factor Model | Kalkestein’s 2-Factor Model | Underwood and Teresi’s Model | |||||||
|---|---|---|---|---|---|---|---|---|---|---|
| Factor 1 | Factor 2 | Factor 1 | Factor 2 | Factor 1 | ||||||
| Factor Loadings | Standard Error | Factor Loadings | Standard Error | Factor Loadings | Standard Error | Factor Loadings | Standard Error | Factor Loadings | Standard Error | |
| 1 | 0.610 | 0.628 | 0.574 | 0.671 | 0.608 | 0.631 | ||||
| 2 | 0.802 | 0.356 | 0.801 | 0.360 | 0.799 | 0.361 | ||||
| 3 | 0.565 | 0.680 | 0.522 | 0.727 | 0.558 | 0.688 | ||||
| 4 | 0.759 | 0.424 | 0.755 | 0.429 | 0.751 | 0.435 | ||||
| 5 | 0.607 | 0.632 | 0.607 | 0.631 | 0.612 | 0.626 | ||||
| 6 | 0.847 | 0.283 | 0.844 | 0.287 | 0.840 | 0.294 | ||||
| 7 | 0.685 | 0.531 | 0.689 | 0.525 | 0.704 | 0.504 | ||||
| 8 | 0.561 | 0.686 | 0.972 | 0.055 | 0.564 | 0.682 | ||||
| 9 | 0.218 | 0.953 | 0.304 | 0.908 | 0.194 | 0.962 | ||||
| 10 | 0.819 | 0.330 | 0.813 | 0.339 | 0.800 | 0.360 | ||||
| 11 | 0.828 | 0.315 | 0.821 | 0.325 | 0.801 | 0.358 | ||||
| 12 | 0.847 | 0.235 | 0.870 | 0.244 | 0.852 | 0.275 | ||||
| 13 | 0.650 | 0.577 | 0.650 | 0.578 | 0.639 | 0.591 | ||||
| 14 | 0.805 | 0.352 | 0.809 | 0.346 | 0.804 | 0.353 | ||||
| 15 | 0.801 | 0.359 | 0.773 | 0.403 | 0.781 | 0.391 | ||||
| 16 | 0.852 | 0.274 | 0.830 | 0.311 | 0.827 | 0.317 | ||||
All factor loadings are significant at p < 0.001.
Table 4.
Characteristics of the scores in the DSES comprising all 16 items, Cronbach’s alpha and McDonald’s omega internal consistency coefficient according to the univariate model in both samples.
Table 4.
Characteristics of the scores in the DSES comprising all 16 items, Cronbach’s alpha and McDonald’s omega internal consistency coefficient according to the univariate model in both samples.
| Statistic | Value in Sample 1 | Value in Sample 2 |
|---|---|---|
| Mean | 62.7 | 59.5 |
| Median | 65.0 | 61.0 |
| Standard deviation | 16.8 | 14.6 |
| Cronbach’s alpha | 0.954 | 0.939 |
| McDonald’s omega | 0.955 | 0.941 |
Table 5.
Reliability statistics for DSES items in Sample 1.
| Item | M | SD | Corrected Item-Total Correlation | Value for Scale If Item Dropped | |
|---|---|---|---|---|---|
| Cronbach’s Alpha | McDonald’s Omega | ||||
| 1 | 3.67 | 1.30 | 0.610 | 0.953 | 0.955 |
| 2 | 3.85 | 1.43 | 0.790 | 0.950 | 0.951 |
| 3 | 3.52 | 1.43 | 0.562 | 0.955 | 0.955 |
| 4 | 3.93 | 1.25 | 0.733 | 0.951 | 0.952 |
| 5 | 4.37 | 1.31 | 0.789 | 0.950 | 0.951 |
| 6 | 3.86 | 1.44 | 0.833 | 0.949 | 0.950 |
| 7 | 3.74 | 1.39 | 0.775 | 0.950 | 0.951 |
| 8 | 3.63 | 1.27 | 0.617 | 0.953 | 0.954 |
| 9 | 3.89 | 1.19 | 0.410 | 0.957 | 0.957 |
| 10 | 4.03 | 1.44 | 0.798 | 0.950 | 0.951 |
| 11 | 4.18 | 1.39 | 0.823 | 0.949 | 0.950 |
| 12 | 4.03 | 1.44 | 0.827 | 0.949 | 0.950 |
| 13 | 4.34 | 1.38 | 0.773 | 0.950 | 0.951 |
| 14 | 3.53 | 1.38 | 0.756 | 0.951 | 0.952 |
| 15 | 4.37 | 1.25 | 0.794 | 0.950 | 0.951 |
| 16 | 3.66 | 1.41 | 0.816 | 0.949 | 0.950 |
Table 6.
Reliability statistic fors DSES items in Sample 2.
| Item | M | SD | Corrected Item-Total Correlation | Value for Scale If Item Dropped | |
|---|---|---|---|---|---|
| Cronbach’s Alpha | McDonald’s Omega | ||||
| 1 | 3.94 | 1.33 | 0.596 | 0.937 | 0.939 |
| 2 | 3.97 | 1.42 | 0.766 | 0.933 | 0.935 |
| 3 | 3.57 | 1.45 | 0.552 | 0.938 | 0.940 |
| 4 | 3.99 | 1.28 | 0.721 | 0.934 | 0.936 |
| 5 | 4.92 | 1.17 | 0.600 | 0.937 | 0.939 |
| 6 | 3.99 | 1.43 | 0.805 | 0.932 | 0.934 |
| 7 | 4.06 | 1.33 | 0.687 | 0.935 | 0.937 |
| 8 | 4.06 | 1.31 | 0.565 | 0.938 | 0.940 |
| 9 | 4.28 | 1.19 | 0.199 | 0.945 | 0.946 |
| 10 | 4.52 | 1.37 | 0.777 | 0.933 | 0.935 |
| 11 | 4.55 | 1.37 | 0.777 | 0.933 | 0.935 |
| 12 | 4.31 | 1.50 | 0.812 | 0.932 | 0.934 |
| 13 | 4.65 | 1.38 | 0.624 | 0.937 | 0.939 |
| 14 | 3.82 | 1.40 | 0.774 | 0.933 | 0.935 |
| 15 | 4.68 | 1.26 | 0.760 | 0.934 | 0.936 |
| 16 | 4.02 | 1.45 | 0.798 | 0.932 | 0.934 |
Publisher’s Note: MDPI stays neutral with regard to jurisdictional claims in published maps and institutional affiliations. |
© 2022 by the authors. Licensee MDPI, Basel, Switzerland. This article is an open access article distributed under the terms and conditions of the Creative Commons Attribution (CC BY) license (https://creativecommons.org/licenses/by/4.0/).
Share and Cite
MDPI and ACS Style
Wasiewicz, J.; Krzywoszański, Ł.; Prusak, J. Factor Structure of the Daily Spiritual Experiences Scale in a Polish-Christian Sample. Religions 2022, 13, 274. https://0-doi-org.brum.beds.ac.uk/10.3390/rel13040274
AMA Style
Wasiewicz J, Krzywoszański Ł, Prusak J. Factor Structure of the Daily Spiritual Experiences Scale in a Polish-Christian Sample. Religions. 2022; 13(4):274. https://0-doi-org.brum.beds.ac.uk/10.3390/rel13040274
Chicago/Turabian StyleWasiewicz, Jakub, Łukasz Krzywoszański, and Jacek Prusak. 2022. "Factor Structure of the Daily Spiritual Experiences Scale in a Polish-Christian Sample" Religions 13, no. 4: 274. https://0-doi-org.brum.beds.ac.uk/10.3390/rel13040274
Note that from the first issue of 2016, this journal uses article numbers instead of page numbers. See further details here.