Content-Aware Retargeted Image Quality Assessment

1
School of Electronics and Information Engineering, Hebei University of Technology, Tianjin 300401, China
2
School of Artificial Intelligence, Hebei University of Technology, Tianjin 300401, China
*
Author to whom correspondence should be addressed.
Information 2019, 10(3), 111; https://0-doi-org.brum.beds.ac.uk/10.3390/info10030111
Submission received: 16 January 2019
/
Revised: 22 February 2019
/
Accepted: 5 March 2019
/
Published: 12 March 2019
(This article belongs to the Section Information Processes)
Abstract
:In targeting the low correlation between existing image scaling quality assessment methods and subjective awareness, a content-aware retargeted image quality assessment algorithm is proposed, which is based on the structural similarity index. In this paper, a similarity index, that is, a local structural similarity algorithm, which can measure different sizes of the same image is proposed. The Speed Up Robust Feature (SURF) algorithm is used to extract the local structural similarity and the image content loss degree. The significant area ratio is calculated by extracting the saliency region and the retargeted image quality assessment function is obtained by linear fusion. In the CUHK image database and the MIT RetargetMe database, compared with four representative assessment algorithms and other latest four kinds of retargeted image quality assessment algorithms, the experiment proves that the proposed algorithm has a higher correlation with Mean Opinion Score (MOS) values and corresponds with the result of human subjective assessment.
1. Introduction
With the popularity of electronic display devices (Personal Digital Assistants, Personal Computers, mobile phones, tablets, etc.), in order to solve the problem of image mismatch on differently sized display devices, content-aware image retargeting technology has gradually become a focus for research. In this case, it is important to maintain the quality of the image retarget. The main indicator of image quality evaluation after content-aware retargeting is whether the retargeted image quality is corresponds with human subjective visual perception. Subjective quality assessment is the most accurate way to determine the quality of retargeted images but in most cases it is time-consuming and impractical. Therefore, the quality evaluation of the retarget images are mainly based on objective evaluation.
The content-aware image retargeting algorithm can intelligently scale according to the features of the image content. The implementation of the specific algorithm can be divided into two steps: image content recognition and feature-based scaling. Avidan and Shamir first proposed a content-aware image retargeting algorithm—the Seam Carving (SC) algorithm—at the SIGGRAPH conference in 2007 [1]. In 2008, Rubinstein et al. proposed the forward seam carving algorithm [2], which considers the newly generated energy of the adjacent left and right pixels after the seam is deleted. In a completely random resizing method [3] the energy vector is scrambled and then resized and the result is consistent with the result of directly scrambling and resizing the image column. However, this method does not make use of the importance map and the effect of irregularly random resizing and the scaling are not much different.
At present, content-aware image retargeting techniques are mainly divided into three categories: discrete, continuous and multi-operational. The discrete method is mainly based on the scaling method of seam carving [4,5], which treats the image as discrete pixels and determines the pixels to be deleted by calculating the importance of each pixel. The SCSC algorithm is a discrete method that achieves the purpose of scaling an image by performing line cropping and uniform scaling in a coherent manner. The continuous method is mainly based on the image retargeting method of mesh deformation [6,7].
The retargeting operation often results in image content loss and structure deformation of the retargeted image. Different types of retargeting methods [8] may lead to different degrees of image content loss and structure distortion [9]. Discrete retargeting methods treat images as pixels [10], and the structural distortion is mainly caused by duplication or deletion of the pixels, which leads to the phenomenon of jagged edges, broken lines, and aspect ratio changes (e.g., cropping (CR), seam carving (SC), and shift-map (SM)). Continuous retargeting methods usually treat the image as composed of different meshes and then adjust the mesh size under the constraint condition, which causes the geometrical deformation of images (e.g., non-homogeneous warping (WARP) [6], scaling (SCL), scale-and-stretch (SNS) [11], and streaming video (SV) [12]).
Recently, great progress has been made in traditional image quality assessment methods [13], but the assessment of content-aware retargeted image quality is still in its infancy. The reason is that the traditional quality evaluation standard is only effective for images of the same size and not for the retargeted images [14]. In addition, traditional image quality evaluation standards cannot measure the artifacts in the retargeted images [15]. The design of suitable content-aware retargeted image quality evaluation algorithms has always been a challenge in this field.
2. Image Quality Evaluation Technology
Image quality evaluation methods are divided into subjective evaluation methods and objective evaluation methods [16]. Subjective evaluation methods [17] conform to human visual aesthetics but are time consuming and require a large number of participants to perform repeat evaluations, which is inefficient. The objective evaluation method is simple in operation, less time consuming and convenient for future experimental analysis. Such methods have gradually become the research focus of image quality evaluation. There are three main types of objective quality evaluation methods: full reference (FR), reduced-reference (RR) and no reference (NR). The key to the full reference method evaluation is to obtain a perfect original image. The strength of the error signal directly affects the degradation of the image quality. The full reference method is less difficult and the evaluation effect is optimal, such as mean-squared error (MSE) and Peak Signal-to-Noise Ratio (PSNR). The premise of partial reference methods is that there are partial original images. The core of the method is the selection of effective feature parameters to represent the original image. The non-reference method has no requirement for an original image and the most objective is the development direction of image quality evaluation, which is the most difficult. The goal of content-aware image retargeting technology is to enable the resized image to achieve the same human visual aesthetic requirements as the original image, suitable for full reference image quality evaluation methods. While there is relative maturity with image quality assessment methods [13], Image Retargeting Quality Assessment (IRQA) is still in its infancy and lacks a comprehensive and unified evaluation system.
The objective evaluation method mainly includes the Earth Mover Distance (EMD) [18], Edge Histogram (EH) [19] and the SIFT flow method (SF) [20]. EMD is a classic IRQA method, which was first proposed by Stolfi in 1994 to calculate the difference between the two images by using the earth mover distance of the two images. This algorithm can effectively calculate the overall difference between the two images but the extracted feature marks cannot describe all the details of the whole image. When the resized image shows partial detail distortion, the measurement results are not necessarily accurate. The edge histogram (EH) method was proposed by Manjunath and mainly focused on the spatial distribution information of the image edges. The greater the difference between the two images, the more the edge structure of the two images differs and the worse the image retargeting algorithm. The algorithm can effectively calculate the change of image edge shape information but does not consider the content information of the image. Therefore, this method does not accurately evaluate the scaling result of all images.
Recently, many IRQA methods have evaluated the quality of the retargeted image by image matching algorithms. The SIFT flow [20] method uses the SIFT stream to match the descriptors obtained from the original image and the scaled image. It should be noted that the SIFT matching algorithm has also some disadvantages, such as decreased uniformity distribution and fewer matching points, which will affect the final evaluation.
In order to measure the differences in images after retargeting, the optical flow descriptor was used by Karimi et al. [21] for the first time. They directly adjusted the retargeted image to the original image size by using an optical flow descriptor and then calculated the optical flow difference between the two images’ blocks. Then, Lin et al. [22] proposed a Hybrid Distortion Pooled Model (HDPM) based on the mixed distortion combining model, which takes into account the local similarity, content loss and image structure distortion of the image. However, HDPM lacks accuracy in evaluating the detail distortion of an image because the original image does not match point-to-point with the retargeted image. The ARS [23] (Aspect Ratio Similarity) evaluation method proposed by Zhang et al. can successfully evaluate the local block changes under geometrical changes and the evaluation effect is still better than the previous evaluation methods. However, since the ARS evaluation method is based on the local underlying features, it is impossible to explicitly evaluate the weakened special attributes, such as polylines and features that violate symmetry.
Recently, effective features of correspondence estimation for retargeting images have been developed by some researchers. Zhang [24] proposed a three-level representation of the retargeting process and combined inconsistency detection and fidelity measurement. This method improved the alignment between the original image and the retargeted image; however, the same number of discontinuities or shape distortions in a three-level representation may have different effects on the quality of the retargeting. In addition, the deep-learned features extracted from the CNN model were used by Fu et al [25] to measure texture and semantic similarity, and in the meanwhile, hand-crafted features and deep-learned features were used to estimate the degradation of perceived quality.
The premise for traditional image quality evaluation methods is that the evaluated image has the same size as the original image but for content-aware image scaling technology, the original image and the scaled image size are not the same. For this reason, this paper proposes an image quality evaluation method. Firstly, the SURF features of the original image and the scaled image are extracted and matched and the localized similarity of each image block is calculated by segmenting the image with the matching SURF feature as the center and the content loss degree of the scaled image is calculated according to the unmatched SUFR feature. Secondly, detecting the saliency regions in the original image and the scaled image respectively and the loss of important feature content in the image is represented according to the change of the saliency region area in the original image and the scaled image. Finally, fusing the local similarity of the image, the content loss degree and the change of the area of the saliency region are obtained and the scaled image quality evaluation function is also obtained. Then, the evaluation of the scaled image is completed. The schematic diagram is shown in Figure 1.
3. Content-Aware Retarget Quality Evaluation Method
The method in this paper is obtained by a combination of three features, including: local similarity, content loss degree and ratio of salient region area.
3.1. Local Similarity
The structural similarity index is used to measure the similarity of two images of the same size but since the size of the scaled image is different from the original image, the structural similarity index cannot be directly used to evaluate the content-aware scaling image. Based on the structural similarity index, this paper proposes a similarity index-local structural similarity algorithm that can measure different sizes of the same image. The SURF algorithm is used to extract and match the SURF feature of the original image and the scaled image. Then the image is segmented into subblock by taking the matched SURF feature as the center of subblock and the structural similarity of each image block is calculated, respectively.
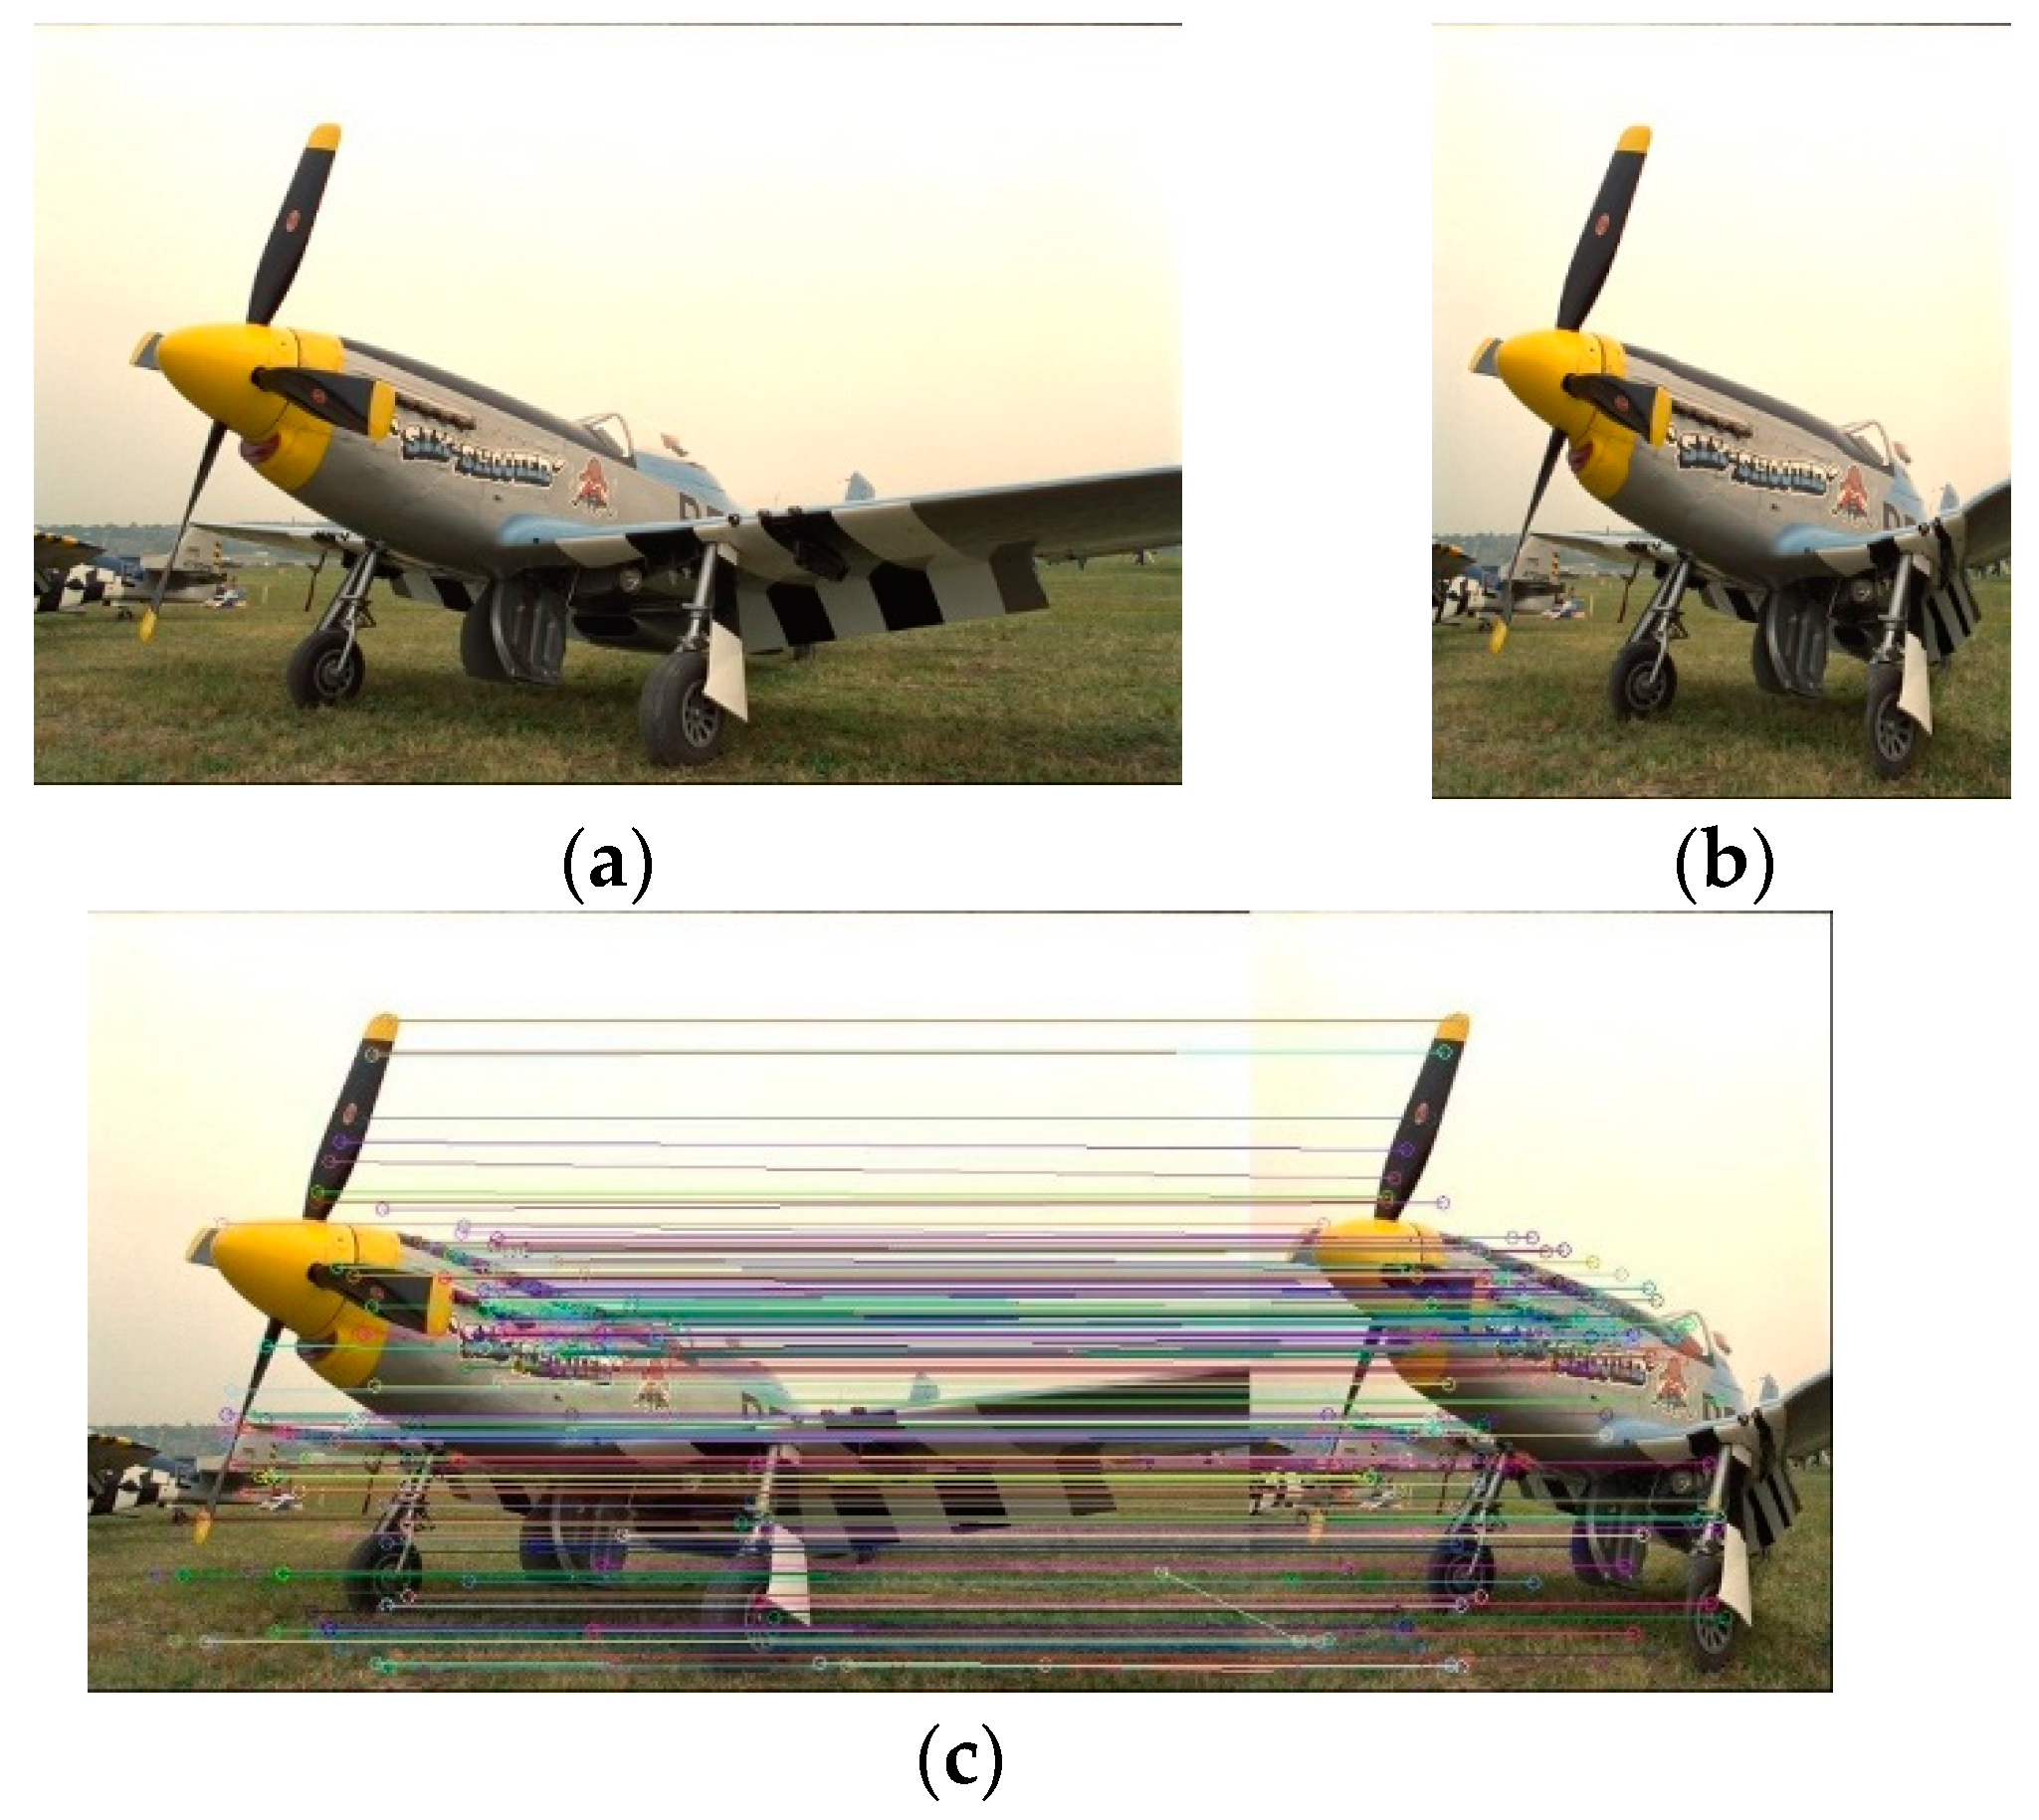
The image pyramid is established first and then high-speed filtering is performed on each layer of the image pyramid. Finally, Difference of Gaussian (DOG) of the image is obtained and the feature points are extracted. The features of the two images are extracted and matched. The matching effect picture is shown in Figure 2. The features of the complex fuselage area match more feature points and the smooth wing, grassland and other areas match fewer feature points. In order to detect and match the feature points with scale invariance, the matrix Hessian is used to determine the feature points of the image candidates and then the non-maximum value suppression is performed. Image is set as I, H refers to Hessian matrix and then Hessian matrix of pixels I(x,y) in the image is shown in the formula:
The characteristic values of the Hessian matrix are:
Structural self-similarity is considered from the perspective of image composition, image brightness information, contrast information and structural information. The distortion is modeled and are set as the original image and the target image respectively, among them, the structural self-similarity can be obtained by:
Among them, , are the mean value of the images ,, respectively, , are the variance of the images ,, and is the covariance of the image. Meanwhile, in order to avoid the denominator being zero, and are set, where L is the dynamic range of the image pixel value.
Since the original image is inconsistent with the size of the scaled image, the structural similarity index does not apply to two images of inconsistent size. Therefore, structural similarity algorithms cannot be used to directly measure structural changes in images before and after scaling. In view of the above problems, this paper blocks the image centered on the matched feature points for and gets the structural similarity of the image block .
Since the SURF feature in the original image cannot be matched with the SURF feature in the scaled image , the number of matched SURF features is and the number of unmatched features is . For any pair of matched SURF feature points and , and calculate the structural similarity of image block respectively with the feature points and as centers, is set as a pixel block of 15 × 15 with as center in , and is set as a pixel block of 15 × 15 with as center in . Therefore, the structural similarity for two image blocks and can be calculated and the specific details are shown as in Figure 3. The white square in the figure is the image block of 15 × 15 with the matched characteristics as center.
Finally, the matched structural self-similarity of all the image blocks is calculated, thereby obtaining the average local similarity of the two images, as shown below:
In order to ensure that the denominator is not 0, the constant term C in the denominator is taken as 1. The larger value means that the two images are more similar.
3.2. Content Loss Degree
The feature points obtained by the SURF algorithm can indicate the important content of the image to some extent, so the loss of important content in the image is calculated according to the feature points obtained by image matching. Therefore, the image content loss is defined as follows:
where n is the number of features extracted in the original image
and the original image is matched with the features obtained by the scaled image and the obtained number of matched SURF features is . Then the number of features that are not matched in the two images is and the number of features that are not matched indicates to some extent that the scaled image loses important content relative to the original image. Here, describes the size of the content loss before and after image retargeting. The lower the value of indicates the smaller the loss of content in the image retargeting operation and thus, the more similar are the two images.
3.3. The Area Ratio of Salient Region
Because the saliency detection technique detects areas that attract human visual attention in the image, employing the saliency detection algorithm proposed by Goferman et al. [26] detects saliency regions in the image. The loss of important content in the scaled image and the original image is represented by the change in the saliency region area before and after scaling. The specific formula is as follows:
where, is the size of the salient region in the original image, in order to facilitate the calculation, is the number of all the pixels whose pixel values are larger than the threshold in the saliency image of the original image and is the number of all pixels in the saliency image of the scaled image whose pixel value is greater than the threshold. indicates the change in the saliency image before and after the image is scaled. The smaller the value, the smaller is the change of the important area of the scaled image compared with the original image and the smaller the loss of the important content of the image caused by the image retargeting operation. The result being two images that are more similar.
3.4. Evaluation Factor Fusion Processing
The local structural similarity of the original image and the scaled image, the loss degree of the image content and the degree of change of the important content in the image obtained through the above calculation are linearly blended to obtain a final scaled image quality evaluation function, as follows:
where ALS is the local structural similarity of the image. is the image content loss degree. is the degree of change of important content in the image, Since the two evaluation factors and are inversely proportional to the degree of similarity between the two images, the coefficient is negative. , and are coefficients. v is a constant.
The four coefficients , , , are determined by linearly fitting the Mean Opinion Score (MOS).
4. Experimental Results and Analysis
4.1. Determination of the Evaluation Function Coefficient
In the CUHK database [27], different scaled images and their corresponding subjective MOS are provided. The first part has a total of 69 scaled images and their corresponding MOS, while the second part has a total of 102 scaled images and their corresponding MOS. The 102 scaled images and their corresponding average opinion scores were used as the training set to fit the four coefficients , , , , and the remaining 69 images were used as the experimental set.
For the scaled images in the 102 training sets, the respective image local structural similarity, the image content loss degree and the degree of change of important content in the image are calculated and the MOS values of each image are linearly fitted. Finally, the parameters obtained by fitting. , , , . Therefore, the specific scaled image evaluation formula is as follows:
Since the two evaluation factors and are inversely proportional to the degree of similarity between the two images, the coefficient is negative and in the above formula is the evaluation factor of the final scaled image.
4.2. Evaluation Criteria
In this experiment, we used five indicators to verify the performance of the image quality evaluation algorithm including Spearman Rank Order Correlation Coefficient (SROCC), Kendall Rank Correlation Coefficient (KRCC), Pearson Linear Correlation Coefficient (PLCC), Root Mean Square Error (RMSE) and Outlier Ratio (OR).
SROCC is used to reflect the monotonicity of the algorithm. In the experiments, the coefficient is used to verify the consistency of the evaluation method with the MOS value. The higher the coefficient of SROCC is, the more relevant the evaluation method is to the MOS value. The objective and subjective alignment of the scaling effect is a measure of quality. The important principle of the proposed method is to use the Kendall coefficient as an indicator to measure the correlation between our objective evaluation indicators and subjective evaluation indicators. The two evaluation indicators, SROCC and KRCC, only consider the location information of the data and ignore the correlation between the data. PLCC is a statistic used to measure the correlation between the score of the quality evaluation algorithm and the MOS value. The larger the value, the better the performance of the algorithm will become. The correlation coefficient is often used to measure the accuracy of the quality evaluation method. The RMSE can measure the prediction accuracy between the quality evaluation score and the MOS value. The smaller the value, the better the performance of the algorithm will be. The outlier ratio is used to measure the consistency of the algorithm’s prediction results, which can reflect the stability of the model. The smaller the value, the more stable the model will be.
4.3. Database Analysis
In order to evaluate the effect of the image retargeting quality evaluation algorithm more objectively, the choice of database is very important. This paper selected two public databases: MIT RetargetMe database [28] and CUHK database [27]. According to the correlation between objective scores and subjective scores provided by the two databases, the performance of the proposed algorithm is evaluated. The images in the database are diverse, including natural scenes with complex backgrounds, character shapes that focus on details, simple backgrounds and eye-catching placards. The main observation and evaluation experiments were carried out on the results of typical image retargeting methods and the effect of grouping and sorting of different methods were given. The database details are summarized in Table 1.
In this paper, the reasons for selecting these two databases are as follows: the image content of the MIT RetargetMe database is various but it also covers the six commonly used attributes. In addition, it contains the result graph and subjective score of the current main scaling method. The scaling result graph shows different types of scaling effects, including content loss and structural deformation in different situations that occur during the zooming process, which is a good guarantee for verifying the consistency of subjective and objective methods. The CUHK database was chosen as it disrupts the alignment of the image retargeting method and complements the MIT RetargetMe database validation method.
In the MIT database, 37 original images and 296 scaling result maps are selected, which correspond to the result maps of 8 scaling methods, specifically, CR (Cropping), SCL (Scaling), SC (Seam Carving), MO (Multi-operator), SM (Shift-Map), SNS (Scale-and-Stretch), SV (Streaming Video) and WARP (non-homogeneous Warping). The scaling percentage is 50% or 25% of the length or width. These 37 sets of images contain 6 main image attributes and include more than one attribute in each image, Line/Edge (L/E), Face/People (F/P), Texture (T), Foreground Objects (FO), Geometric Structures (GS) and Symmetry (S). Subjective evaluations are analyzed in a pairwise comparison, with one of the two retargeted images being selected for better results. The correlation between the objective score and the subjective evaluation score is represented by KRCC.
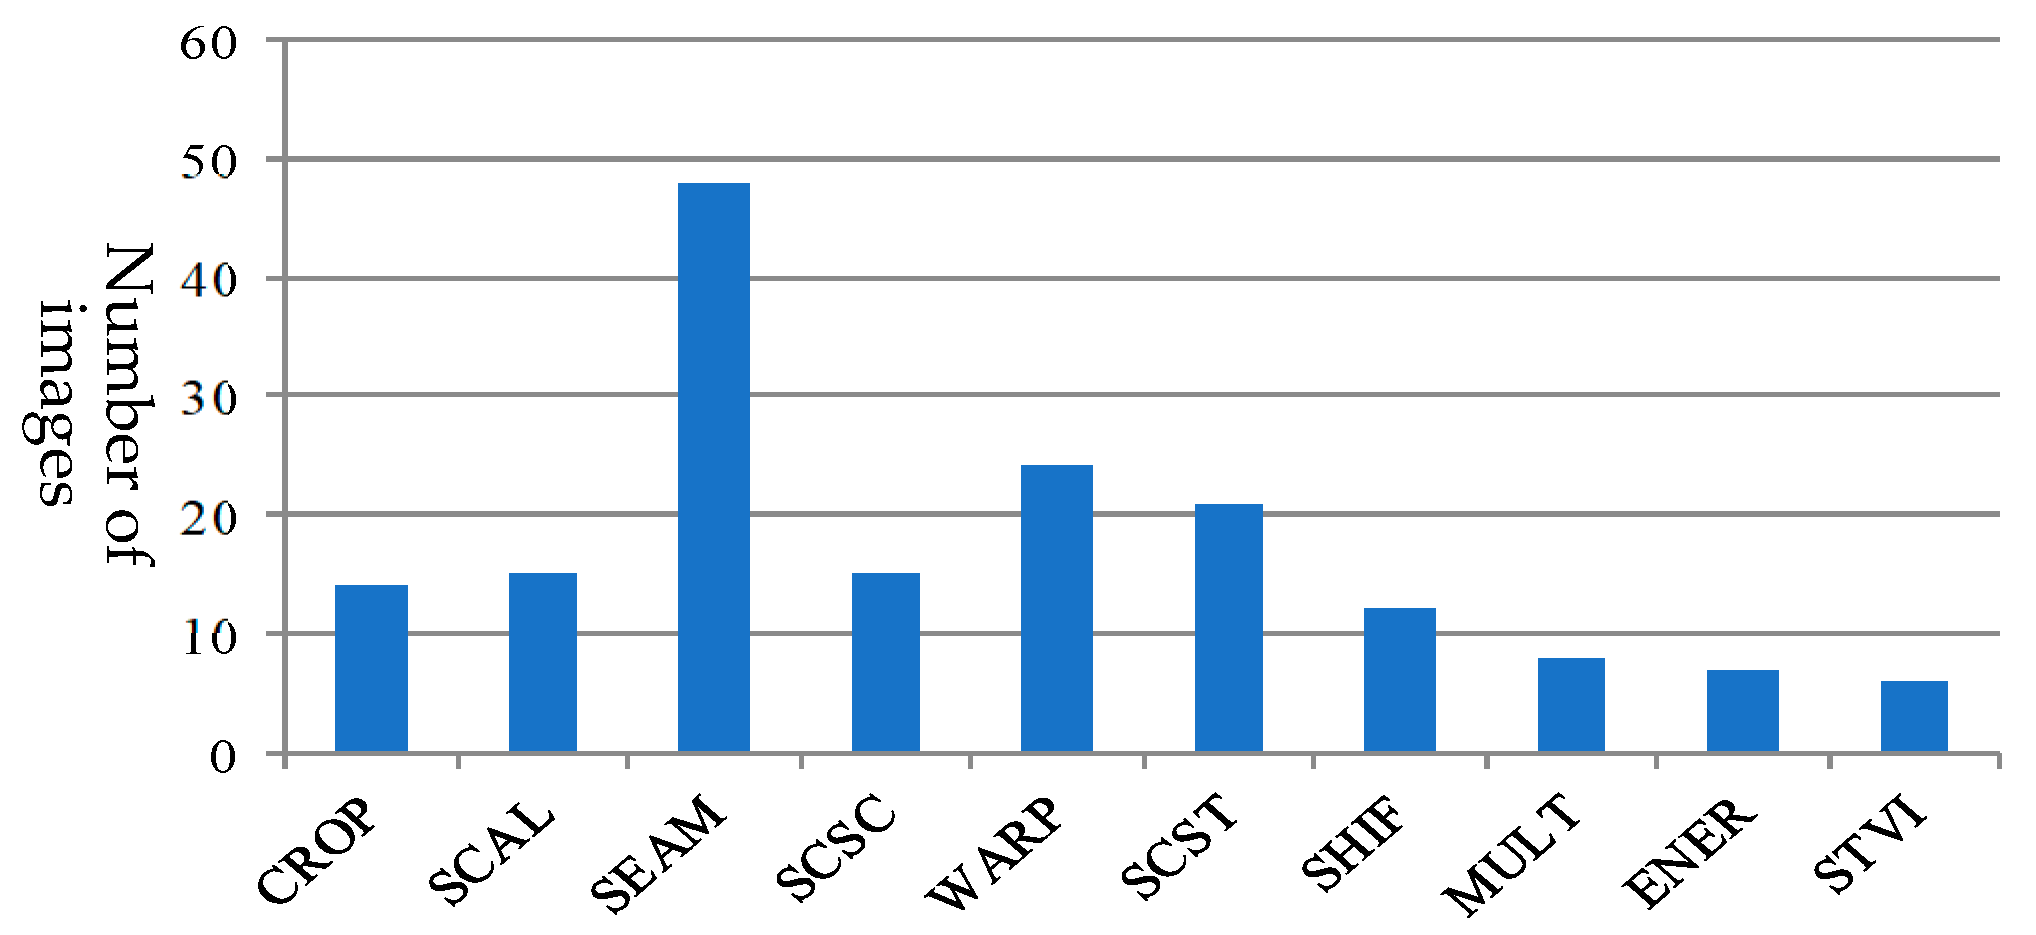
The CUHK database contains a total of 57 original images, including characters, natural scenery, geometry, texture and symmetry and foreground objects. Each of the original images contains 3 scaled images, so the database contains a total of 171 scaled images. Compared to the MIT database, the database also uses two additional scaling methods: Seam-carving and scale (SCSC) [8] and energy-based deformation (ENER) [29]. The number of images obtained using different scaling algorithms is shown in Figure 4.
Unlike the pairwise comparison in the MIT database, subjective testing is divided into five quality score levels in the CUHK database: very good, good, ordinary, poor, very poor. An average opinion score MOS is generated for every scaled image.
4.4. Verification of the Effectiveness of the Evaluation Algorithm
To verify the effectiveness of the proposed algorithm, there are 8 algorithms used as the contrast algorithms on CUHK database [27], which include EH, EMD, SIFT-flow and fusing EH+EMD+SIFT-flow (hereafter referred to as “fusion algorithm”), Hybrid Distortion Pooled Model (HDPM) [21], (Q Q’) [22], Bi-directional natural Salient Scene Distortion (BNSSD) [24] and Aspect Ratio Similarity for Image Retargeting Quality Assessment (ARS-IRQA) [23]. The specific comparison results are shown in Table 2. Among them, PLCC is used to measure the accuracy of the quality evaluation method and SROCC is used to reflect the monotonicity of the algorithm. In the experiment, this coefficient is used to verify the consistency of the evaluation method with the MOS value. The higher the coefficient of PLCC and SROCC, the more relevant the evaluation method is to the MOS value and the OR reflects the stability of the model. The smaller the value, the more stable the model is.
As shown in Table 2 and Table 3, compared with the other eight methods, the IRQA algorithm proposed in this paper has significantly higher values of PLCC and SROCC than the representative four algorithms and is also higher than the latest four algorithms. The evaluation result is more consistent with MOS value. Its OR value is lower than the other eight methods compared, indicating that the algorithm model is more stable. It can be seen that the correlation between the proposed method and the MOS value is greatly improved compared with the representative method and the latest method and the algorithm model is more stable.
In Table 3, compared with the method in this paper, EH and SIFT-flow algorithms do not take into account the loss of important content in the image. The EMD algorithm cannot consider the distortion of the local image and the fusion algorithm is stronger than the above three methods to some extent. However, the values of PLCC and SROCC are 0.4463 and 0.4202 individually, respectively and the evaluation results are unsatisfactory. Compared to the fusion algorithm and the (Q Q’) algorithm, the HDPM algorithm’s value of PLCC and SROCC are improved but its OR value is relatively high, which indicates that the performance of HDPM is relatively good. But its stability is not satisfactory, its lack of accuracy in evaluating image detail distortion this is due to the original image is not point-to-point matched with the retargeted image; the (Q Q’) algorithm is a simple and effective objective image quality evaluation method based on five elements. However, this method has a fast calculation speed but the symmetry detection is not accurate enough, needing human-assisted judgment. Because the ARS-IRQA algorithm is based on local underlying features, it is impossible to explicitly evaluate the weakened special attributes, such as polylines and features that violate symmetry. The BNSSD algorithm is a two-way significant natural scene distortion model, which has obvious advantages in the evaluation of natural scene images. It is effective in evaluating other types of images and lacks universality.
The IRQA method proposed in this paper integrates the three evaluation factors, that is, local structural similarity in the image, the loss of content in the image and the change of important content in the image. The values of PLCC and SROCC have been improved to some extent relative to the other eight algorithms. The OR value is lower than the other eight methods compared therewith and it can be seen that the evaluation effect of the proposed method is better than the contrast algorithm.
4.5. Classification Measurement Evaluation Method
To further verify the effectiveness of the proposed algorithm, on the widely-used MIT RetargetMe database [28] and CUHK database [27], firstly, the images in the database are divided into characters, natural scenery, geometric structure, texture, symmetry and foreground targets and then each type of image is subject to the contrast experiment. On the MIT and CUHK databases, the proposed algorithm and representative image quality evaluation algorithms EH, EMD, SIFT-flow and fusion algorithms, the latest IRQA algorithm, HDPM [21], (Q Q’) [22], BNSSD [24] and ARS-IRQA [23] evaluation algorithms were used for comparative experiments.
The objective and subjective sorting correlation of image retargeting effect is an important principle for measuring quality evaluation methods. KRCC is used as an indicator to measure the advantages and disadvantages of various evaluation methods. It indicates the degree of correlation of multiple level variables. The larger the value, the more effective the image quality evaluation algorithm is proved. As shown in Table 4 and Table 5, KRCCs for various algorithms are respectively compared on MIT and CUHK database.
As shown in Table 4 and Table 5, among the four representative algorithms, SITF-flow is more effective for image evaluation including people and textures and its evaluation effect is better than EH and EMD methods. The fusion method is more effective in evaluating various types of images, especially in the evaluation of the geometric structure and symmetry of the image. The proposed algorithm is superior to the current comparison algorithm in evaluating various type of images, especially in the evaluation of images containing people, foreground objects and geometric structures, the evaluation effect is more prominent; in the evaluation of images containing symmetry the evaluation performance on the CUHK database is more prominent, however its evaluation effect on the MIT database is slightly higher than other comparison algorithms, indicating that the evaluation effect is not stable enough in the image containing symmetry; in the evaluation of the image containing the natural scene in the MIT database Its evaluation performance is more prominent, while its evaluation effect on the CUHK database is slightly higher than other comparison algorithms, indicating that its performance is not stable enough when evaluating natural scene images and needs to be improved. In Table 5, the fusion method in texture and foreground target images in the CUHK database evaluation is not satisfactory. It can be seen that the fusion method is more effective in the representative four algorithms but its stability needs to be improved. The performance of the latest four comparison algorithms is significantly higher than the representative four algorithms.
The evaluation algorithm proposed in this paper, either on the MIT database or the CUHK database, in the classification comparison of various images, all of their KRCCs are higher than other eight contrast algorithms. This is because the proposed algorithm considered the local structure similarity, image content loss and the change in important content of image as the evaluation standard. However, the proposed algorithm in the evaluation of images containing natural scene and symmetry, the evaluation performance on both databases is higher than other comparison algorithms but the KRCC values are different, not stable enough. So, indicating that the effect of the evaluation method proposed in this paper is better than eight other comparison methods with a satisfactory evaluation effect, while in the evaluation of images containing natural scene and symmetry, the stability of this algorithm needs to be further improved.
5. Conclusions
On the basis of the structural similarity index, this paper proposes a local structure similarity algorithm enabling to measure the similarity index for different sizes of same image and also proposed an image retargeting quality evaluation algorithm on this basis, considering three evaluation factors, that is, local structure similarity in image, image content degree of loss and degree of change of important contents in image and carrying out the objective evaluation of the scaled image. With a contrast experiment, with respect to the representative and latest method, the algorithm was verified and its evaluation results are close to MOS value and to a degree, stating that the objective evaluation algorithm proposed in this paper is evaluated and the results are in line with the visual aesthetics of human beings. In future research, the proposed evaluation algorithm in this paper will continue to be improved, improving the stability of the evaluation including natural scene and symmetry image and further apply it to the evaluation of video image.
Author Contributions
The work presented in this paper represents a collaborative effort by all authors. T.Z. wrote the paper. M.Y. and Y.G. made a contribution to the Methodology. Y.L. analyzed the data and checked language. All the authors have read and approved the final manuscript.
Funding
This research was funded by [National Natural Science Foundation of China] grant number [61806071], [Open Projects Program of National Laboratory of Pattern Recognition] grant number [201900043], [Natural Science Foundation of Hebei Province, China] grant number [F2015202239] and [Tianjin Sci-tech Planning Projects] grant number [17ZLZDZF00040,15ZCZDNC00130 and 14RCGFGX00846].
Conflicts of Interest
The authors declare no conflict of interest.
References
- Avidan, S.; Shamir, A. Seam carving for content-aware image resizing. ACM Trans. Graph. 2007, 26, 10–18. [Google Scholar] [CrossRef]
- Rubinstein, M.; Shamir, A.; Avidan, S. Improved seam carving for video retargeting. ACM Trans. Graph. 2008, 27, 16. [Google Scholar] [CrossRef]
- Zhao, D.F.; Wang, B.; Yang, D.W. Content-aware image resizing based on random permutation. J. Jilin Univ. Eng. Technol. Ed. 2015, 4, 1324–1328. [Google Scholar]
- Dong, W.; Zhou, N.; Paul, J.; Zhang, X. Optimized image resizing using seam carving and scaling. ACM Trans. Graph. 2009, 28, 125. [Google Scholar] [CrossRef]
- Oliveira, S.A.F.; Rocha Neto, A.R.; Bezerra, F.N. A novel Genetic Algorithms and SURF-Based approach for image retargeting. Expert Syst. Appl. 2016, 44, 332–343. [Google Scholar] [CrossRef]
- Wolf, L.; Guttmann, M.; Cohenor, D. Non-homogeneous Content-driven Video-retargeting. In Proceedings of the 2007 IEEE 11th International Conference on Computer Vision, Rio de Janeiro, Brazil, 14–21 October 2007; Volume 2007, pp. 1–6. [Google Scholar]
- Xu, J.; Kang, H.; Chen, F. Content-aware image resizing using quasi-conformal mapping. Vis. Comput. 2018, 34, 431–442. [Google Scholar] [CrossRef]
- Zhu, L.; Chen, Z. Fast genetic multi-operator image retargeting. In Proceedings of the 2016 Visual Communications and Image Processing (VCIP), Chengdu, China, 27–30 November 2016; pp. 1–4. [Google Scholar]
- Liang, Y.; Liu, Y.; Gutierrez, D. Objective Quality Prediction of Image Retargeting Algorithms. IEEE Trans. Vis. Comput. Graph. 2017, 23, 1099–1110. [Google Scholar] [CrossRef] [PubMed]
- Fang, Y.; Fang, Z.; Yuan, F.; Yang, Y.; Yang, S.; Xiong, N.N. Optimized Multioperator Image Retargeting Based on Perceptual Similarity Measure. IEEE Trans. Syst. Man Cybern. Syst. 2017, 47, 2956–2966. [Google Scholar] [CrossRef]
- Wang, Y.; Tai, C.; Sorkine, O.; Lee, T. Optimized scale-and-stretch for image resizing. ACM Trans. Graph. 2008, 27, 118. [Google Scholar] [CrossRef]
- Lang, M.; Hornung, A.; Gross, M. A system for retargeting of streaming video. ACM Trans. Graph. 2009, 28, 126. [Google Scholar] [Green Version]
- Gao, H.; Tang, Y.; Jing, L.; Li, H.; Ding, H. A Novel Unsupervised Segmentation Quality Evaluation Method for Remote Sensing Images. Sensors 2017, 17, 2427. [Google Scholar] [CrossRef]
- Fu, Y.; Wang, S. A No Reference Image Quality Assessment Metric Based on Visual Perception. Algorithms 2016, 9, 87. [Google Scholar] [CrossRef]
- Li, L.; Xia, W.; Fang, Y.; Gu, K.; Wu, J.; Lin, W.; Qian, J. Color image quality assessment based on sparse representation and reconstruction residual. J. Vis. Commun. Image Represent. 2016, 38, 550–560. [Google Scholar] [CrossRef]
- Zhu, Y.; Cao, L.; Wang, X. No reference Screen content image quality assessment. J. Softw. 2018, 4, 973–986. [Google Scholar]
- Kamble, V.; Bhurchandi, K.M. No-reference image quality assessment algorithms: A survey. Optik Int. J. Light Electron Opt. 2015, 126, 1090–1097. [Google Scholar] [CrossRef]
- Charles, A.S.; Bertrand, N.P.; Lee, J.; Rozell, C.J. Earth-Mover’s distance as a tracking regularizer. In Proceedings of the 2017 IEEE 7th International Workshop on Computational Advances in Multi-Sensor Adaptive Processing (CAMSAP), Curaçao, Dutch Antilles, 10–13 December 2017; pp. 1–5. [Google Scholar]
- Kerouh, F.; Ziou, D.; Serir, A. Histogram modelling-based no reference blur quality measure. Signal Process. Image Commun. 2018, 60, 22–28. [Google Scholar] [CrossRef]
- Li, L.; Zhou, Y.; Gu, K.; Lin, W.; Wang, S. Quality Assessment of DIBR-Synthesized Images by Measuring Local Geometric Distortions and Global Sharpness. IEEE Trans. Multimed. 2018, 20, 914–926. [Google Scholar] [CrossRef]
- Karimi, M.; Samavi, S.; Karimi, N.; Soroushmehr, S.R.; Lin, W.; Najarian, K. Quality assessment of retargeted images by salient region deformity analysis. J. Vis. Commun. Image Represent. 2017, 43, 108–118. [Google Scholar] [CrossRef]
- Lin, J.; Zhu, L.; Chen, Z.; Chen, X. Objective quality assessment for image retargeting based on hybrid distortion pooled model. In Proceedings of the 2015 Seventh International Workshop on Quality of Multimedia Experience (QoMEX), Pilos, Greece, 26–29 May 2015; pp. 1–6. [Google Scholar]
- Zhang, Y.; Fang, Y.; Lin, W.; Zhang, X.; Li, L. Backward Registration Based Aspect Ratio Similarity (ARS) for Image Retargeting Quality Assessment. IEEE Trans. Image Process. 2016, 25, 4286–4297. [Google Scholar] [CrossRef]
- Zhang, Y.; Ngan, K.N.; Ma, L.; Li, H. Objective Quality Assessment of Image Retargeting by Incorporating Fidelity Measures and Inconsistency Detection. IEEE Trans. Image Process. 2017, 26, 5980–5993. [Google Scholar] [CrossRef]
- Fu, Z.; Shao, F.; Jiang, Q.; Fu, R.; Ho, Y.S. Quality assessment of retargeted images using hand-crafted and deep-learned features. IEEE Access 2018, 6, 12008–12018. [Google Scholar] [CrossRef]
- Goferman, S.; Zelnik-Manor, L.; Tal, A. Context-Aware Saliency Detection. IEEE Trans. Pattern Anal. 2012, 34, 1915–1926. [Google Scholar] [CrossRef] [PubMed] [Green Version]
- Ma, L.; Lin, W.; Deng, C.; Ngan, K.N. Image Retargeting Quality Assessment: A Study of Subjective Scores and Objective Metrics. IEEE J. Sel. Top. Signal Process. 2012, 6, 626–639. [Google Scholar] [CrossRef] [Green Version]
- Rubinstein, M.; Gutierrez, D.; Sorkine, O.; Shamir, A. Retarget-Me—A Benchmark for Image Retargeting. Available online: http://people.csail.mit.edu/mrub/retargetme/ (accessed on 22 February 2019).
- Karni, Z.; Freedman, D.; Gotsman, C. Energy-Based Image Deformation. Comput. Graph. Forum 2009, 28, 1257–1268. [Google Scholar] [CrossRef] [Green Version]
Figure 1.
Schematic diagram of the image quality evaluation method.

Figure 2.
Speed Up Robust Feature (SURF) feature points matching effect picture. (a) Original image; (b) retargeted image; (c) SURF algorithm matching result.
Figure 2.
Speed Up Robust Feature (SURF) feature points matching effect picture. (a) Original image; (b) retargeted image; (c) SURF algorithm matching result.

Figure 3.
Calculating the similarity of the matching image block structure.

Figure 4.
Quantitative chart of the images obtained by using different retargeting algorithms in the CUHK database.
Figure 4.
Quantitative chart of the images obtained by using different retargeting algorithms in the CUHK database.


Table 1.
Image retargeting quality assessment (IRQA) benchmark database information comparison table.
Table 1.
Image retargeting quality assessment (IRQA) benchmark database information comparison table.
| Database | MIT | CUHK |
|---|---|---|
| Number of original images | 37 | 57 |
| Number of scaled images | 296 | 171 |
| 25% of scaled images | 184 | 46 |
| 50% of scaled images | 112 | 125 |
| Number of scaling operations | 8 | 10 |
| Subjective score | 210 | 64 |
| Subjective scoring type | Pair-wise | MOS |
Table 2.
Comparison of the proposed method with other methods in database CUHK.
| Contrast Algorithms | PLCC | SROCC | OR |
|---|---|---|---|
| EH | 0.3422 | 0.3288 | 0.2047 |
| EMD | 0.2760 | 0.2904 | 0.1696 |
| SIFT-flow | 0.3141 | 0.2899 | 0.1462 |
| Fusion algorithm | 0.4361 | 0.4203 | 0.1462 |
| HDPM | 0.6712 | 0.6897 | 0.1423 |
| (Q Q’) | 0.5042 | 0.4224 | 0.1473 |
| ARS-IRQA | 0.6835 | 0.6693 | 0.1401 |
| BNSSD | 0.7422 | 0.7648 | 0.1373 |
| Proposed algorithm | 0.7528 | 0.7754 | 0.1331 |
Table 3.
Comparison among the proposed method and other methods in the MIT database.
| Contrast Algorithms | PLCC | SROCC | OR |
|---|---|---|---|
| EH | 0.3533 | 0.3278 | 0.2147 |
| EMD | 0.2862 | 0.2984 | 0.1706 |
| SIFT-flow | 0.3241 | 0.2799 | 0.1492 |
| Fusion algorithm | 0.4463 | 0.4202 | 0.1471 |
| HDPM | 0.6815 | 0.6687 | 0.1523 |
| (Q Q’) | 0.6428 | 0.4669 | 0.1718 |
| ARS-IRQA | 0.6835 | 0.6553 | 0.0916 |
| BNSSD | 0.752 | 0.7608 | 0.1475 |
| Proposed algorithm | 0.7758 | 0.7654 | 0.1435 |
Table 4.
Classification comparing Kendall rank correlation coefficient (KRCC) of multiple evaluation methods in database MIT.
Table 4.
Classification comparing Kendall rank correlation coefficient (KRCC) of multiple evaluation methods in database MIT.
| Contrast Algorithm | MIT Attribute | Total | ||||||
|---|---|---|---|---|---|---|---|---|
| L/E | F/P | T | FO | GS | S | Mean | Std | |
| EH | 0.040 | 0.190 | 0.060 | 0.167 | −0.004 | −0.012 | 0.083 | 0.268 |
| EMD | 0.220 | 0.262 | 0.107 | 0.226 | 0.053 | 0.150 | 0.251 | 0.272 |
| SIFT-flow | 0.097 | 0.252 | 0.119 | 0.218 | 0.085 | 0.071 | 0.145 | 0.262 |
| Fusion algorithm | 0.431 | 0.390 | 0.286 | 0.389 | 0.438 | 0.523 | 0.415 | 0.296 |
| HDPM | — | — | — | — | — | — | 0.471 | — |
| (Q Q’) | 0.351 | 0.271 | 0.304 | 0.381 | 0.415 | 0.548 | 0.399 | — |
| ARS-IRQA | 0.463 | 0.519 | 0.330 | 0.444 | 0.505 | 0.464 | 0.452 | 0.283 |
| BNSSD | 0.448 | 0.552 | 0.423 | 0.494 | 0.497 | 0.471 | 0.473 | 0.257 |
| Proposed algorithm | 0.674 | 0.680 | 0.522 | 0.602 | 0.621 | 0.497 | 0.599 | 0.076 |
Table 5.
Classification comparing KRCC of multiple evaluation methods in database CUHK.
| Contrast Algorithm | Attribute | Score | ||||||
|---|---|---|---|---|---|---|---|---|
| Natural Scene | People | Texture | Foreground Objects | Geometric Objects | Symmetry | Mean | Std | |
| EH | 0.0025 | −0.0006 | −0.0043 | −0.0343 | −0.0003 | 0.2423 | 0.0342 | 0.0938 |
| EMD | 0.0037 | −0.0012 | −0.0057 | −0.0237 | 0.0008 | 0.2144 | 0.0313 | 0.0823 |
| SIFT-flow | 0.0052 | 0.2121 | 0.1150 | 0.0273 | 0.0530 | −0.0392 | 0.0622 | 0.0817 |
| Fusion algorithm | 0.0062 | 0.2213 | 0.1110 | 0.0120 | 0.0721 | 0.0752 | 0.0829 | 0.0719 |
| HDPM | Null | 0.0865 | ||||||
| (Q Q’) | 0.0059 | 0.2182 | 0.1350 | 0.0197 | 0.0659 | 0.0772 | 0.0870 | 0.0790 |
| ARS-IRQA | 0.0063 | 0.3002 | 0.1428 | 0.0384 | 0.0784 | 0.0684 | 0.1058 | 0.1056 |
| BNSSD | 0.0058 | 0.3223 | 0.2260 | 0.0422 | 0.0676 | 0.0692 | 0.1222 | 0.1237 |
| Proposed algorithm | 0.0078 | 0.3714 | 0.2403 | 0.0637 | 0.0853 | 0.0943 | 0.1438 | 0.1356 |
© 2019 by the authors. Licensee MDPI, Basel, Switzerland. This article is an open access article distributed under the terms and conditions of the Creative Commons Attribution (CC BY) license (http://creativecommons.org/licenses/by/4.0/).
Share and Cite
MDPI and ACS Style
Zhang, T.; Yu, M.; Guo, Y.; Liu, Y. Content-Aware Retargeted Image Quality Assessment. Information 2019, 10, 111. https://0-doi-org.brum.beds.ac.uk/10.3390/info10030111
AMA Style
Zhang T, Yu M, Guo Y, Liu Y. Content-Aware Retargeted Image Quality Assessment. Information. 2019; 10(3):111. https://0-doi-org.brum.beds.ac.uk/10.3390/info10030111
Chicago/Turabian StyleZhang, Tingting, Ming Yu, Yingchun Guo, and Yi Liu. 2019. "Content-Aware Retargeted Image Quality Assessment" Information 10, no. 3: 111. https://0-doi-org.brum.beds.ac.uk/10.3390/info10030111
Note that from the first issue of 2016, this journal uses article numbers instead of page numbers. See further details here.