Benchmarking Natural Language Inference and Semantic Textual Similarity for Portuguese †


1
INESC-ID, Rua Alves Redol 9, 1000-029 Lisboa, Portugal
2
Departamento de Informática, Universidade de Évora, Rua Romão Ramalho, 59 7000-671 Évora, Portugal
3
Instituto Superior Técnico, Universidade de Lisboa, Av. Rovisco Pais, 1 1049-001 Lisboa, Portugal
*
Author to whom correspondence should be addressed.
†
This paper is an extended version of our paper published in PROPOR 2020.
Information 2020, 11(10), 484; https://0-doi-org.brum.beds.ac.uk/10.3390/info11100484
Submission received: 1 August 2020
/
Revised: 18 September 2020
/
Accepted: 29 September 2020
/
Published: 15 October 2020
(This article belongs to the Special Issue Selected Papers from PROPOR 2020)
Abstract
:Two sentences can be related in many different ways. Distinct tasks in natural language processing aim to identify different semantic relations between sentences. We developed several models for natural language inference and semantic textual similarity for the Portuguese language. We took advantage of pre-trained models (BERT); additionally, we studied the roles of lexical features. We tested our models in several datasets—ASSIN, SICK-BR and ASSIN2—and the best results were usually achieved with ptBERT-Large, trained in a Brazilian corpus and tuned in the latter datasets. Besides obtaining state-of-the-art results, this is, to the best of our knowledge, the most all-inclusive study about natural language inference and semantic textual similarity for the Portuguese language.
1. Introduction
Different types of semantic relations can be found between two sentences. For instance, two sentences are considered to be equivalent (paraphrases) if they have the same meaning. Additionally, it is possible that one sentence contradicts the other (contradictions), or that no relation at all is found between them (neutral). An entailment relation is also possible, and we say that a source sentence (the premise) entails a target sentence (the conclusion) when the conclusion is most probably true if the source is true [1]. These (and other) semantic relations have been deeply studied in natural language processing (NLP). For instance, equivalence between sentences is tackled in paraphrase identification tasks; the detection of relations as contradictions, neutral or entailment is the research target of natural language inference (NLI), which is also referred to as recognizing textual entailment (RTE). In this paper, we focus on the tasks of semantic textual similarity (STS)—where the similarity level between two sentences is calculated—and NLI. Our focus is in the Portuguese language.
Many NLP application scenarios have been boosted recently due to pre-trained models, which can be directly used or tuned to specific domains/tasks. BERT [2] is an example of such models. With BERT, various NLP tasks achieved state-of-the-art results, including STS and NLI for Portuguese [3,4].
In this paper, we test three BERT models for the Portuguese language:
- Multilingual BERT (from now on mBERT), a model trained for several languages at the same time [5];
- Two BERT models trained with (Brazilian) Portuguese corpora (https://github.com/neuralmind-ai/portuguese-bert), differing in size (from now on ptBERT-Base and ptBERT-Large).
We studied the performances of these models by following two different approaches: in the first, we tuned BERT models in NLI and STS corpora; in the second, we used BERT embeddings to feed more traditional classification/regression algorithms, namely, random forests (RF) and support vector machines (SVM).
Moreover, we tested the performance of lexical features in both tasks, either alone or combined with BERT embeddings, in a voting process.
State-of-the art results were obtained with ptBERT-Large in almost all the considered corpora and metrics. Although BERT (and other embedding sources) has already been used in these tasks (and for the Portuguese language), this is, as far as we know, the most detailed study on this topic.
2. Related Work
Both NLI and STS have been studied from some time now. A benchmark for systems aimed at performing RTE was initially developed in the PASCAL challenge series [6], where RTE was defined as the task of labelling two sentences as entailed or not entailed. To target a broader range of semantic relations, more recent challenges and corpora introduced the task of NLI, where sentences may also be labeled as contradictions or neutral (no semantic relation), other than entailment. The most popular of such challenges are the ones from the International Workshop on Semantic Evaluation (Semeval) (https://semeval.github.io).
STS is a regression task, where the aim is to find a continuous value, usually, between 0 and 5 for the similarity among two sentences. To compare the performances of systems measuring semantic similarity, various shared tasks on STS were defined in Semeval [7], including cross-lingual and multilingual tracks [8], which did not cover Portuguese.
To the best of our knowledge, the first corpus to include entailment labels and similarity values for Portuguese sentences was ASSIN (Avaliação de Similaridade Semântica e Inferência Textual) [9], containing pairs of sentences from news sources, split into subsets for Brazilian and European Portuguese, and provided in a shared task with the same name (http://propor2016.di.fc.ul.pt/?page_id=381). The same types of annotations can be found in SICK [10], a corpus of image and video captions, in English, annotated by crowd-sourcing. Recently, a translation of SICK sentences to Portuguese, the SICK-BR corpus [11], was made available. The ASSIN2 shared task followed ASSIN, and produced a corpus based on SICK-BR entailment and neutral examples, expanded by lexical transformations [12]. In this paper we evaluate our models on all of the mentioned Portuguese corpora.
Several methods were tested in these corpora, including feature-based approaches from similarity metrics on various text representations [13], word embeddings built with word2vec [14] from the Portuguese Wikipedia [15,16] and feature-based models relying on syntactic properties and lexical semantics [17]. Compositional methods that derive sentence similarity from word similarities [18] were also tested. With ASSIN, the corpus continued to be employed after the shared task, and in particular, Pinheiro et al. [19] built a new Portuguese word2vec model from Brazilian news data and Wikipedia; Rocha and Cardoso [20] employed a Portuguese WordNet; and Alves et al. [21] explored word embedding models other than word2vec. In this paper we test several embedding models; in addition, and as previously said, we test two different approaches, one based on tuning pre-trained models; in the second by using pre-trained models as feature suppliers. For the latter approach, we also test a combination of embeddings and lexical features.
Recently, the BERT model [2] was made available, and achieved state-of-the-art results on various NLP tasks for English, like those in the GLUE benchmark [22], which is aimed at solving multiple NLP tasks. BERT produces contextual and dynamic embeddings from a deep learning architecture based on bidirectional transformers [23], such that the embedding of a word is specific to the context in which it is employed, and the same word employed in different contexts results in different embeddings. Training a BERT model is expensive in terms of time and resources, but pre-trained models (in base or larger versions), based on Wikipedia, were made available on various languages including Portuguese [5].
In ASSIN2 various systems already relied on the BERT model, where the best results were obtained by Rodrigues et al. [24] by employing an enhanced BERT model, only available for English, with a machine translated version of the ASSIN2 corpus. Competitive results were also achieved by Rodrigues et al. [3], through augmenting the mBERT-Base model with data not in the ASSIN2 corpus, and by Cabezudo et al. [4], who identified and explored relations between NLI and STS annotations, such that the mBERT-Base model was fine tuned on the NLI task, and the resulting model was employed to compute embeddings to address the STS task.
The system of Cabezudo et al. [4] employs lexical features, such as BLEU [25], and features based on the Brazilian WordNet of OpenWordNet-PT [26], to analyze examples relative to their NLI and STS annotations, and to combine them with BERT embeddings for addressing the ASSIN2 tasks. Such features did not improve the performance of BERT, but the mentioned corpus analysis supported an alternative split of training and development examples with which their best result was obtained.
In Rodrigues et al. [3], a new instance of the BERT model was introduced, specific to Portuguese, as trained with the Portuguese Wikipedia and various news sources, from European and Brazilian Portuguese variants. The motivation for such model is to avoid language interpretation issues proper to the encoding of multiple languages in the official mBERT-Base model, as exemplified by the authors. However, said model did not succeed in providing the best results, which were instead obtained with mBERT-Base. Experiments included fine tuning on each task, fine tuning in the mentioned Portuguese texts and using the corpus from the previous ASSIN edition to increase training data.
3. Features and Models
Available resources to assess the similarity between Portuguese sentences include embeddings and lexical similarity metrics. We used both, separately and in combination. In the next sections we describe the features used in this work, and the models we have built.
3.1. Features
3.1.1. BERT Embeddings
We obtained embeddings from BERT, namely, a single embedding for the concatenation of two target sentences, by employing Portuguese and multilingual BERT models, not tailored to a particular task. From such a generic embedding of a sentence pair, as we will see, we can build a model through supervised learning with non-deep-learning methods.
The BERT architecture defines two variants in model size, with 12 layers and embeddings of 768 dimensions for BERT-Base models and 24 layers with embeddings of 1024 dimensions for BERT-Large models. The output of a BERT layer is a sequence of embeddings for input words and special tokens of the BERT architecture, and each layer encodes different linguistic information [27,28]. As such, the embedding of an input text is obtained from the output of a certain layer, either from its CLS special token, intended for classification purposes [2], or by reducing the sequence into a single embedding, such as by weighted average.
A generic BERT model is obtained by pre-training, a process where the weights of these layers are adjusted according to two unsupervised language modeling tasks, applied to a collection of unlabeled texts [2]. One such unsupervised task randomly masks some of the input tokens, and then finds the original forms of the masked tokens, according to a predefined vocabulary. As such, pre-training a BERT model requires a collection of texts and a vocabulary. The final BERT model is then defined by a network of pre-trained weights and the vocabulary, and its output is a generic representation of the semantics in the input text, according to pre-training data.
We employed the base and large versions of the Portuguese BERT model (ptBERT-Base and ptBERT-Large) described in https://github.com/neuralmind-ai/portuguese-bert, which was pre-trained in a Brazilian corpus collected from the internet, with a vocabulary of 30,000 units computed from the Brazilian Wikipedia. We also employed the multilingual BERT model, which is only available in base version (mBERT-Base), and was pre-trained on Wikipedia for 100 languages, with a vocabulary of 110,000 units for all languages [5]. All employed models consider raw text that was not transformed by lower casing or accent removal.
Given a pair of sentences, the essential input to a BERT model is a sequence of indexes on its vocabulary, one for each token in the concatenated sentence pair. For sentence pairs, BERT defines an optional second input, as a mask vector that identifies which tokens belong to which sentence. Moreover, BERT defines a final optional input as a mask vector that identifies padding tokens to discard, which we employed to limit our input sequence to 128 tokens, by padding or truncating sequences of other lengths, as also employed by the original BERT scripts (https://github.com/google-research/bert).
We operated generic BERT models with the bert-as-service framework (https://github.com/hanxiao/bert-as-service), where the full BERT input is automatically computed from a sentence pair concatenated by the “|||” separator. The default output is computed from the second to last layer, which has shown to contain better embeddings [29], using a weighted average of token embeddings, normalized by the padding mask to consider only non-padding tokens.
3.1.2. Lexical Similarity Features
The output of a similarity metric is a score for the similarity between two sentences. Several of such metrics exist; some are applicable to inputs composed of heterogeneous symbols, such as the Jaccard coefficient [30]. We employed a previously released system that generates 96 features for a pair of sentences, based on applying such metrics to various representations of text. Namely, lexical features were obtained from the INESC-ID@ASSIN [13] system, since it achieved state-of-the-art results on the European Portuguese track of the ASSIN challenge [9]. These included metrics for symbols, such as the previously mentioned Jaccard, but also similarity metrics aimed at text, such as BLEU [25]. Each metric was applied to the original sentences, but also to alternative representations of the text, such as that obtained from phonetic encoding. A comprehensive description of such metrics and representations is available in [13].
3.2. Models
Given a corpus where each example is composed of a pair of sentences and its target outcome is a label and/or continuous value related to the equivalence between the two sentences, our (traditional) models are based on two distinct types of feature vector: (a) the embedding of each sentence pair according to BERT, and (b) a vector of scores from similarity metrics. Using BERT embeddings, we also built models based on fine tuning the embeddings (BERT fine tuned) to tasks in a particular corpus, in an end-to-end fashion, where BERT is tailored to the tasks in a corpus.
3.2.1. Traditional Models
In this work we employed such a system to Portuguese corpora annotated with NLI labels and STS values. Therefore, we produced a classification and a regression model for each type of feature vector, such that the same type of features was employed for both tasks. These models were built with traditional machine learning algorithms, rather than neural networks and deep learning.
3.2.2. BERT Fine Tuned
We define BERT fine tuning as a multi-input and multi-output neural network that encompasses the BERT architecture. In our fine tuning architecture, BERT is followed by two neural output layers, one for NLI classification and the other for STS regression. As such, the inputs of our fine tuning model are the same as those of the BERT model, namely, the indexes and masks computed from a sentence pair, as previously described. The outputs are a similarity value, for the STS task, and a probability distribution for the target classes of the NLI task.
Following the original BERT fine tuning setup [2], the weights of our task specific layers were initialized from a truncated normal distribution, and their input was the embedding of the CLS special token in the last layer of the BERT model, further normalized by a non-linear tanh-based layer (https://github.com/google-research/bert/issues/43) and processed by a dropout layer. As all evaluated corpora each describe a classification and a regression task, the activations of our task-specific layers are accordingly softmax and linear, where softmax corresponds to reducing the features in the BERT embedding into a probability distribution for the classes of the classification task in a target corpus, and linear corresponds to reducing the BERT features into a single value.
In fine tuning, the layers concerning the BERT model are initialized with pre-trained weights, which are adjusted according to the loss between the outputs of the classification and regression layers and the correspondent labels in a target corpus. Namely, for regression we employed the mean absolute error loss, since it provides robustness to outliers, as convenient in applying our model to diverse corpora. For classification, we employed the categorical cross entropy loss, which allowed us to address binary and multi-class tasks with the same setup. We employed the same pre-trained models as in the system based on the generic BERT models, and assigned the same weights to classification and regression losses.
Due to the dropout layer, which randomly ignores a different part of the BERT output on each training of the same model, our network outputs are non deterministic. Hence, all reported results for fine tuned models correspond to an average of five instances of each model.
3.2.3. Voting Model
For both classification and regression, we employed a voting strategy on a set of different models, to leverage different learning strategies at once. For regression, voting consists of averaging predictions from a set of models, while for classification different strategies of computing the output class may apply, whether by choosing the class predicted by most classifiers or by averaging the prediction probabilities that each classifier reports for a certain class, and choosing the class with the highest average.
4. Experimental Setup
In this section, we describe the models used (Section 4.1), corpora (Section 4.2) and evaluation measures (Section 4.3).
4.1. Models
The fine tuning architecture was defined with the Keras framework (https://keras.io/). Loading the BERT model and preparing its inputs from a sentence pair was performed with the Transformers toolkit (https://huggingface.co/transformers/). We followed the fine tuning parameter recommendations from Devlin et al. [2], such as for the range of values for epochs, batch size and learning rate, but did not perform automatic search for optimal parameters. Instead, we selected the maximum number of recommended epochs and batch size, respectively 4 and 32, and the intermediate value for learning rate (3 × 10⁻⁵). For the optimizer, we employed Adam [31], since in early experiments this was the best setting, unlike the original BERT model which employs a version of Adam featuring weight decay [2]. ptBERT-Large, ptBERT-Base and mBERT were all tuned in our experiments.
Regarding the most traditional classification/regression setting, all machine learning was performed in scikit-learn [32]. Classification models were chosen in various combinations, mainly by considering learning algorithms with simple and complex versions available, and the processing times to build them. The final set was composed of two types of SVM and random forests of decision trees. In addition, we considered an ensemble of all models based on a voting algorithm. The simple version of SVM has a linear kernel (LIBLINEAR implementation), while the more complex versions correspond to the non linear polynomial and RBF kernels. A random forest is a combination of decision trees and random feature selection, hence a complex version of decision trees. The voting model also considers decision trees, as the simpler version of random forests, although its algorithm is not competitive with the latter. Regression models implement the same types of algorithms selected for classification models.
With respect to the voting model, we considered that all models have the same weight, and for classification models we employed a strategy (named “soft voting” in scikit-learn) in which the output class was chosen by averaging the prediction probabilities that each classifier reported for a certain class, and choosing the highest class average using argmax. To ensure reliable prediction probabilities, all classifiers were calibrated [33], using the Platt method [34] in scikit-learn.
For all models, optimal parameters were identified from a combination of various parameters, including various degrees for the polynomial kernel, the number of decision trees in random forests and the existence of class imbalance on all classification models. Said parameter search was applied for each corpus. For instance, to obtain the final model, for a certain corpus and feature sets, when using SVM with a linear kernel, seven different models were trained, corresponding to different values for the C parameter, sampled from a logarithmic scale between 0.001 and 1000. When using SVM with the remaining kernels, the search included at least the C and gamma parameters, such that each of the mentioned seven models implies training another set of models, corresponding to combinations of a certain C values and various values for gamma, which were sampled from a logarithmic scale between 0.0001 and 10. For random forests, various types of parameters were also included in the search, such as the number of trees (we experiment with 100 or 200 trees) and the maximum depth of each tree.
4.2. Corpora
In this section we survey the three corpora we use in our experiments: ASSIN, SICK-BR and ASSIN2.
4.2.1. ASSIN
The ASSIN dataset [9] contains 10,000 sentence pairs collected from Google News, split into training and test sets with an equal number of Portuguese and Brazilian examples in each set (each Portuguese variety has 2500 examples for training, 500 for trial and 2000 to test). Each example is annotated for both the STS and NLI tasks.
For STS, semantic relatedness is a continuous value from 1 to 5. These values should be given to sentence pairs, according to the following guidelines [9]:
- Completely different sentences, on different subjects.
- Sentences are not related, but are roughly on the same subject.
- Sentences are somewhat related. They may describe different facts but share some details.
- Sentences are strongly related, but some details differ.
- Sentences mean essentially the same thing.
In ASSIN, NLI is defined as a categorical assignment to the classes: entailment, paraphrase or none (neutral). The distribution of examples with these labels is approximately balanced between the European and Brazilian splits of this corpus but is not balanced relative to examples per label, with a total in both corpora of 7316 examples of neutral, 2080 of entailment and 604 of paraphrase.
Within the ASSIN campaign, performance was measured separately for European Portuguese and Brazilian Portuguese, but also for the concatenation of both corpora.
4.2.2. SICK-BR
SICK-BR corpus [11] is a Brazilian Portuguese translation of the SICK [10] corpus (NLI and STS). The original SICK was the target corpus for a shared task at Semeval 2014 [35].
As in the original SICK corpus, SICK-BR is composed of 4906 test examples, 495 trial/development examples and 4439 train examples.
Each example, that is, each sentence pair, is annotated for the STS task with a continuous value between 0 and 5, for how similar the two sentences are; and for the NLI task, with labels neutral, contradiction and entailment to indicate the relationship between the two sentences. The distribution of these labels in the corpus is not balanced, with 5595 examples of neutral, 2821 of entailment and 1424 of contradiction. More information is available, such as the original English sentences. The development of SICK-BR only targeted sentence translation; hence, the remaining annotations are the same as in SICK.
4.2.3. ASSIN2
ASSIN2 [12] extends SICK-BR with more examples. These examples were created by modifying examples of SICK-BR, by replacing words by their synonyms, for instance. ASSIN2 has approximately the same size as SICK-BR, although it does not include contradiction examples. Instead, the NLI task is defined as a binary classification, for entailment or non for entailment. Example distribution for ASSIN2 contains 6500 examples for training, 500 for validation and 2448 for testing, and this is the only corpus in our evaluation that describes a balanced distribution of examples per NLI label, where exactly half of the examples on each corpus partition are of the entailment class, while examples of the other half correspond to the not entailment class. The STS task is also included in ASSIN2, as inherited from SICK-BR.
4.3. Evaluation Metrics
For NLI, we report accuracy, precision, recall and F score (F1, as we consider precision and recall to have the same weight/importance).
Precision measures the performance of a system in predicting the correct class of all its predictions for a certain class. It is implemented as the number of examples where the predicted class matches the true class, divided by the total number of examples predicted as being of said class.
Recall measures the fraction of examples of a certain class that were correctly predicted, and is implemented as the number of examples wherein the predicted class matches the true class, divided by the total number of examples of said class.
The F1 score represents the harmonic mean of precision and recall, where 1 indicates the importance factor of precision in respect to recall. Generally, the F score is defined as in Equation (1), which we employ with .
Accuracy measures the fraction of correct predictions with respect to all predictions.
Precision, recall and F1 metrics are based on the assumption that a positive class exists (as in binary classification). For classification tasks with multiple classes, such as NLI in most of our evaluated corpora, these metrics are computed for each class, by considering predictions of other classes as negative instances. As such, a multi class problem is solved as a series of binary problems. An average of all such outputs produces the multi-class version of these metrics, where certain forms of averaging may consider data aspects such as class imbalance. Following the ASSIN task definition, we compute a macro average for all evaluated corpora, which corresponds to an unweighted average where all classes are considered equally important. However, most evaluated corpora describe an unbalanced distribution of examples per class.
We report multi-class precision, recall and F1 metrics with macro averaging for all evaluated systems, and also per class evaluation metrics for the system with best overall performance. Accuracy is also computed per class, considering examples of other classes as the negative class, which disregards the differences between other classes.
For STS, as in the Semeval edition that employs the English SICK corpus [35], we report Pearson and Spearman correlations, and the mean squared error (MSE), all of which are suitable to measure the performance of a system that outputs a single unbounded and real valued prediction.
To compute the MSE, the difference between each prediction and its true value is squared, so that all differences are positive numbers, and the average of all such values is the MSE. Hence, the lowest possible MSE value is 0 and there is no upper bound.
The Pearson correlation coefficient measures the strength and direction of the linear relation between predictions and true values, and corresponds to a continuous value from −1 to 1, where 0 indicates no linear relationship. Visually, a prediction and its true value is represented as a point in a bi-dimensional space, and there is a linear relationship between predictions and true values if all points are near a single line/path. The sign of the Pearson coefficient is the same as the slope for such line, and its value indicates the proximity of points to the line. For instance, a Pearson value near −1 indicates that predictions and true values have distant magnitudes, but vary proportionally on most examples.
The Spearman correlation coefficient is defined as s Pearson that instead considers predictions and true values as ranks, and not their actual values. Namely, the Spearman coefficient corresponds to the Pearson applied to such ranks.
A lower MSE is better, while for the remaining metrics, both for NLI and STS, a higher value is better. All metrics for NLI produce values in the 0 to 1 range; hence we report such results in percentages.
5. Results
In the following, we report the results of our systems in the NLI and STS tasks on Portuguese corpora, where for each corpus we provide a table with results from various systems, ours and others, followed by a table with per class results for an ensemble of the five instances of the fine tuned ptBERT-Large model, obtained by averaging their predictions, since this is the most complex system and achieves the best results on most evaluation metrics. In the former table, the best results for each metric, considering all systems, are highlighted with boldface. For fine tuned models, we report the mean and standard deviation of the evaluation metrics on the five instances of each model. Supporting each table of systems, we also frame or describe results from systems that we computed which did not achieved competitive results; hence these are not shown in the tables.
Results for other systems were obtained from the original publications, according to the therein addressed tasks, corpora and evaluation metrics. For each corpus, we report results for all other systems, to the best of our knowledge, that achieve competitive performances. Some systems report results on multiple corpora, and not all of the evaluation metrics we report for our systems are reported in the original publications of other systems. Moreover, some of the other systems were trained with additional data or combine multiple corpora, while our systems are trained per corpus and only with the data in such s corpus.
Our systems are grouped by type of feature; systems based on BERT are identified by the name of the BERT model followed by the learning algorithm employed to build the model of such system. Learning algorithms are abbreviated as lsvc for linear SVM, rf for random forests, poly and rbf for SVM with such kernels and voting for the ensemble of all non-deep-learning models. Systems based only on lexical features are identified only by the name of the involved learning algorithm. Results for decision trees are not shown, since the performance of said model was not competitive.
5.1. ASSIN in European Portuguese
A selection of results for the ASSIN-PTPT corpus is shown in Table 1, and the per class results of the fine tuned ptBERT-Large model are shown in Table 2. Considering the remaining results, linear SVM is the machine learning method with the best performance in most experiments, while decision trees correspond to the overall worst performance. However, the MSE of the linear SVM model based on ptBERT-Large embeddings and lexical features is higher than 1, unlike all other models based on this feature set. For all other experiments in ASSIN-PTPT, the MSE value is only higher than 1 when using decision trees. The best MSE value for a model based on ptBERT-Large and lexical features was obtained with a random forest, which is the only machine learning method that considers feature selection. However, for this feature set, using random forests in other models does not result in greater performance than linear SVM, which suggests that the MSE’s instability with Large embeddings is due to the greater complexity inherent to their greater size.
For models with only BERT embeddings as feature vectors, results for non linear SVMs are similar to or worse than those of linear SVM. Additionally, the MSE for all such models based on ptBERT and decision trees was 1.03, while the MSE for the model based on mBERT and decision trees was 0.94, although we expected the Portuguese-only model to always be superior to the multilingual model.
5.2. ASSIN in Brazilian Portuguese
A selection of results for the ASSIN-PTBR corpus is shown in Table 3, and the per class results of the fine tuned ptBERT-Large model are shown in Table 4.
In ASSIN-PTBR, all models based on feature vectors with only BERT embeddings of any BERT model performed similarly, except for models based on decision trees and random forests (also composed of decision trees) which had lower performances.
For BERT embeddings with lexical features, performance was similar in all models and for both tasks, except for random forests with ptBERT-Large embeddings where all evaluation metrics were at least 10% lower than in other models.
For traditional models in ASSIN-PTBR, lexical features achieved the best accuracy, using a linear SVM, and BERT-Base embeddings combined with lexical features achieved the best F1 (mBERT), MSE and Pearson (ptBERT)—all in models based on the voting strategy. Such results are competitive or better than those obtained with the fine tuned mBERT-Base model.
5.3. ASSIN in European and Brazilian Portuguese
A selection of results for the full ASSIN corpus is shown in Table 5, and the per class results of the fine tuned ptBERT-Large model are shown in Table 6.
For the full ASSIN corpus, using BERT embeddings as features resulted in competitive performance in both tasks from all deep learning algorithms and BERT models, with SVM-based models achieving similar results and the worst performance corresponding to decision trees. Using feature vectors of BERT embeddings combined with lexical features, all deep learning algorithms and BERT models failed both tasks, particularly in F1 and MSE scores; e.g., for SVM-based models, most F1 scores were below 50% and most MSE scores were above 1. Results from using only lexical features are competitive with any results obtained with feature vectors that included BERT embeddings.
5.4. ASSIN2
A selection of results for the ASSIN2 corpus is shown in Table 7, and the per class results of the fine tuned ptBERT-Large model are shown in Table 8.
In ASSIN2, when using only BERT embeddings as features, all combinations of BERT models and learning algorithms resulted in similar performances, except with decision trees (performance not competitive). In such a setting, the voting algorithm produced the best results for all BERT models.
With feature vectors of ptBERT embeddings, both base and large, combined with lexical features, only random forests and the voting algorithm produced a MSE result below 1, while the results for other evaluation metrics are competitive and approximate in all models. For ptBERT-Base, we further note that in all models except those of decision trees and SVM with RBF kernel, the better a model performs in the NLI task, the worst its MSE value, although other metrics of the STS task remain competitive and consistent with the NLI task. With the mBERT-Base model, all results are similarly competitive, except in all decision trees results and the MSE values from SVM of any kernel.
As in the most experiments in ASSIN2, the voting algorithm also produces the best performance when applied to feature vectors with only lexical features, for all metrics and tasks.
5.5. The Brazilian SICK Corpus
A selection of results for the SICK-BR corpus is shown in Table 9, and the per class results of the fine tuned ptBERT-Large model are shown in Table 10.
In SICK-BR, using feature vectors with only BERT embeddings resulted in approximate performances for all evaluated models, except for those of decision trees and random forests, which were up to 10% worse than the best model. In such a setting, the best performance is obtained with models based on SVM with a RBF kernel, for all BERT models, as shown in Table 9. For models based on feature vectors where BERT embeddings are combined with lexical features, using ptBERT-Large embeddings results in values of MSE greater than 1, for SVM with linear and polynomial kernels. For models based on ptBERT, both base and large, the only competitive results in both tasks are achieved with the voting algorithm, while for mBERT-Base the best results are similar in the two models, both voting and SVM with RBF kernel. With feature vectors of lexical features only, all models produced approximate results, except decision trees, which are up to 10% worse than the best model. To the best of our knowledge, no other system reports results on the SICK-BR corpus.
6. Discussion
In models based on neural networks, we measured statistical significance between the values returned by each pair of models, using a t-test (five runs for each model) for all metrics. Considering p = 0.05, there are statistically significant differences between models ptBERT-Base and mBERT-Base, and also between models ptBERT-Large and mBERT-Base, for most evaluation metrics and corpora. Exceptions include, for instance, the accuracy metric in the ASSIN-PTPT corpus, for the former pair of models, and most evaluation metrics in the SICK-BR corpus, for the latter pair of models. Regarding the differences between models ptBERT-Base and ptBERT-Large, results varied, since we found statistically significant differences for some metrics, but not for others, on all corpora.
Fine tuned models achieved better results than traditional models in most of the evaluated corpora and tasks. Particularly, the ptBERT-Large fine tuned model achieved the best results in most corpora and tasks, compared to our other setups and to other systems. However, for instance, in ASSIN-PTBR it did not achieve the best precision, recall and F1, and in ASSIN (PTPT + PTBR) it failed to achieve the best F1 and MSE. In the following we further investigate this model.
Regarding the STS task, the results of the ptBERT-Large fine tuned model for Pearson and Spearman correlation coefficients are near 0.9 in most evaluated corpora, which reveals a strong correlation between predictions and true values, indicating that the predictions for most examples are distant from their true values in approximately the same magnitude.
However, with the ASSIN2 corpus this model achieved an MSE worse than one of the state-of-the-art systems, and also worse than some of our traditional models.
To further study the performance of the ptBERT-Large fine tuned model, we employed the ensemble for the five instances of this model, wherein the predictions from each instance were averaged, and the MSE was computed on said average. The ptBERT-Large fine tuned model mentioned in the following corresponds to said ensemble.
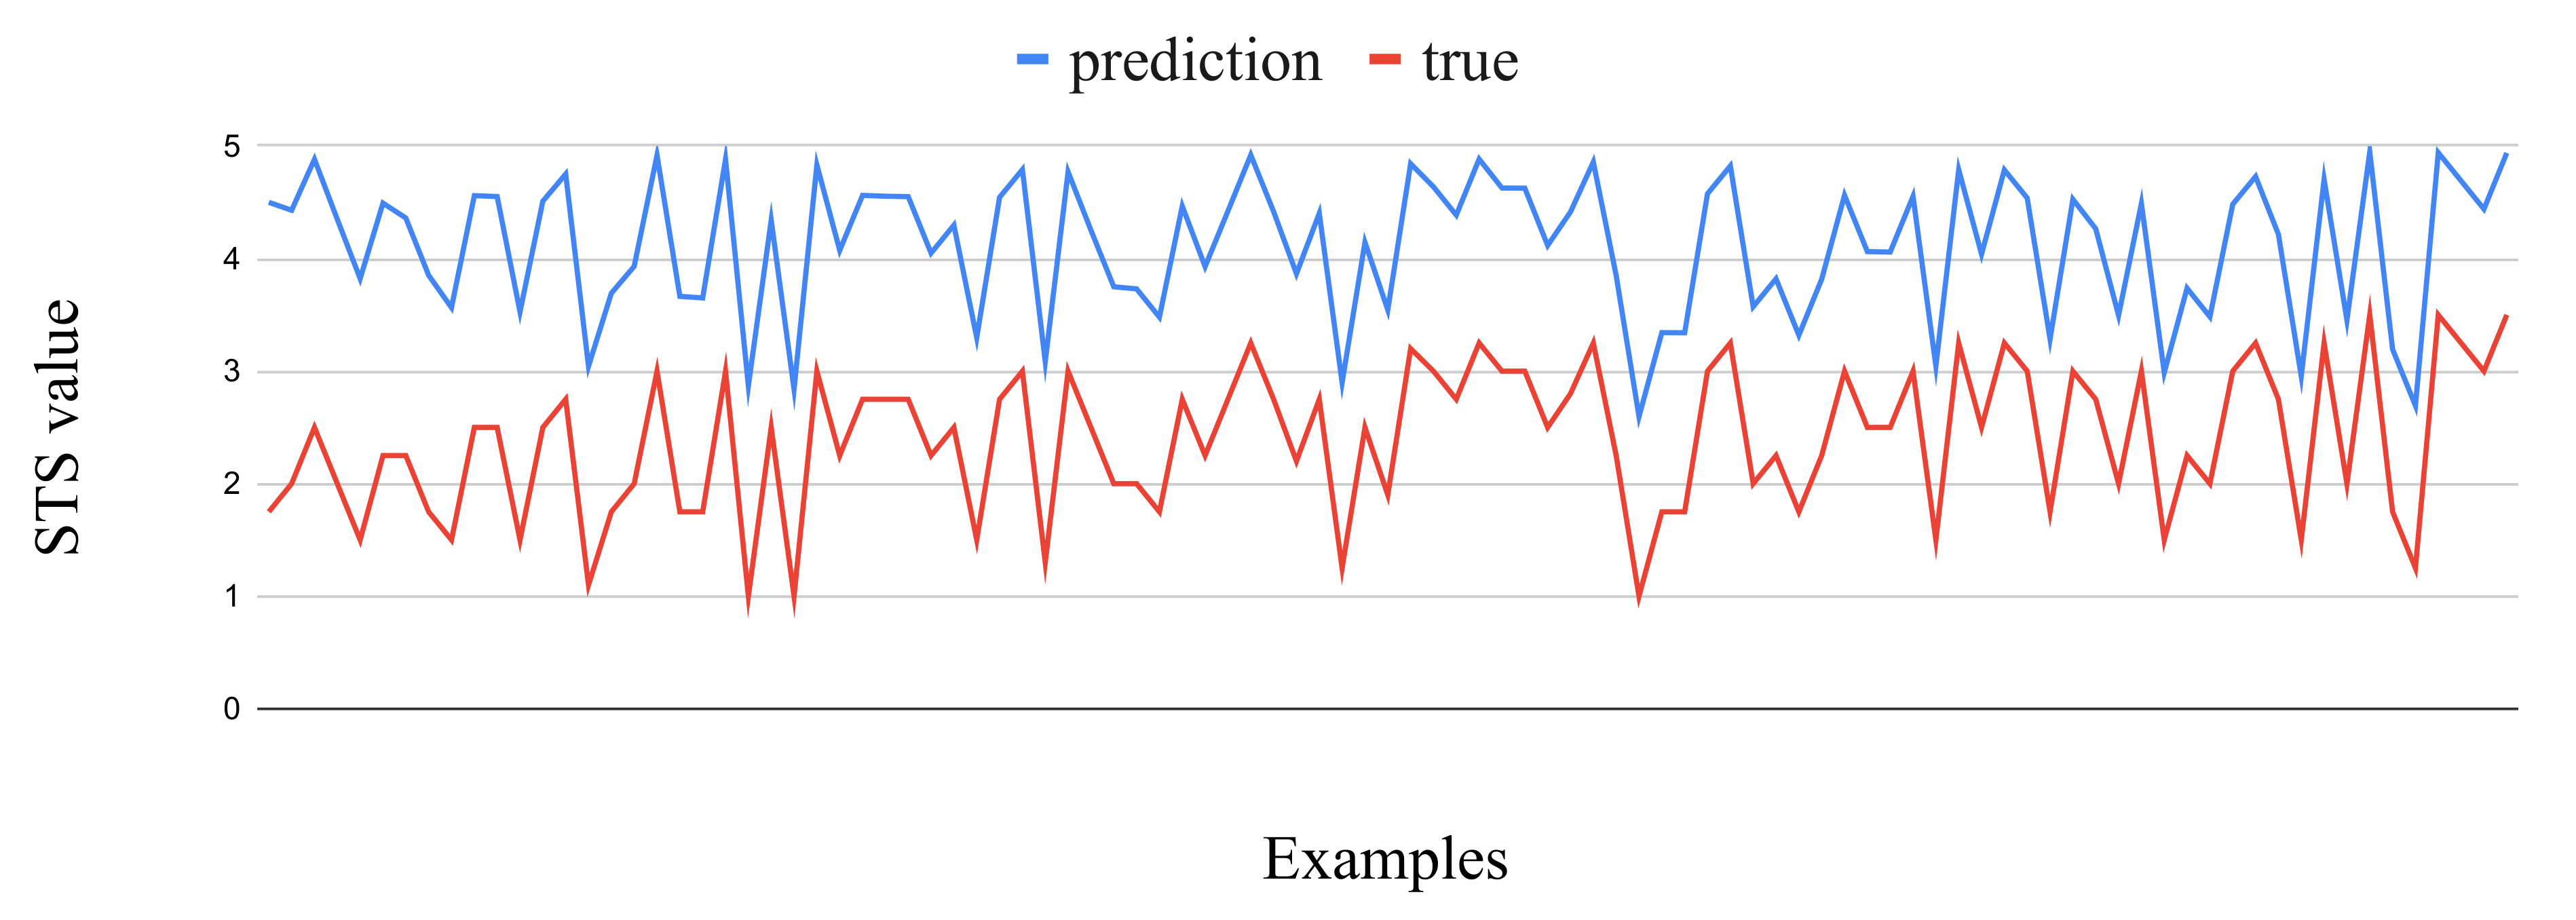
Interestingly, in examples with greater distance between predictions and true values, this difference is almost constant, as shown in Figure 1, and the predictions are greater than the true values, suggesting that the STS predictions of ptBERT-Large fine tuned model are overly confident. As such, we did an experiment subtracting a constant value whenever the difference between prediction and true was greater than a certain value. The best results were obtained by subtracting 0.9 from the prediction, when the difference between the prediction and the true value was greater than 0.5. The resulting MSE was 0.11, as opposed to the 0.47 originally obtained, and the prediction was subtracted in 1014 of the 2448 test examples. As this condition implies knowing the true value, we also experimented with subtracting 0.9 on all predictions, which resulted in a MSE of 0.43.
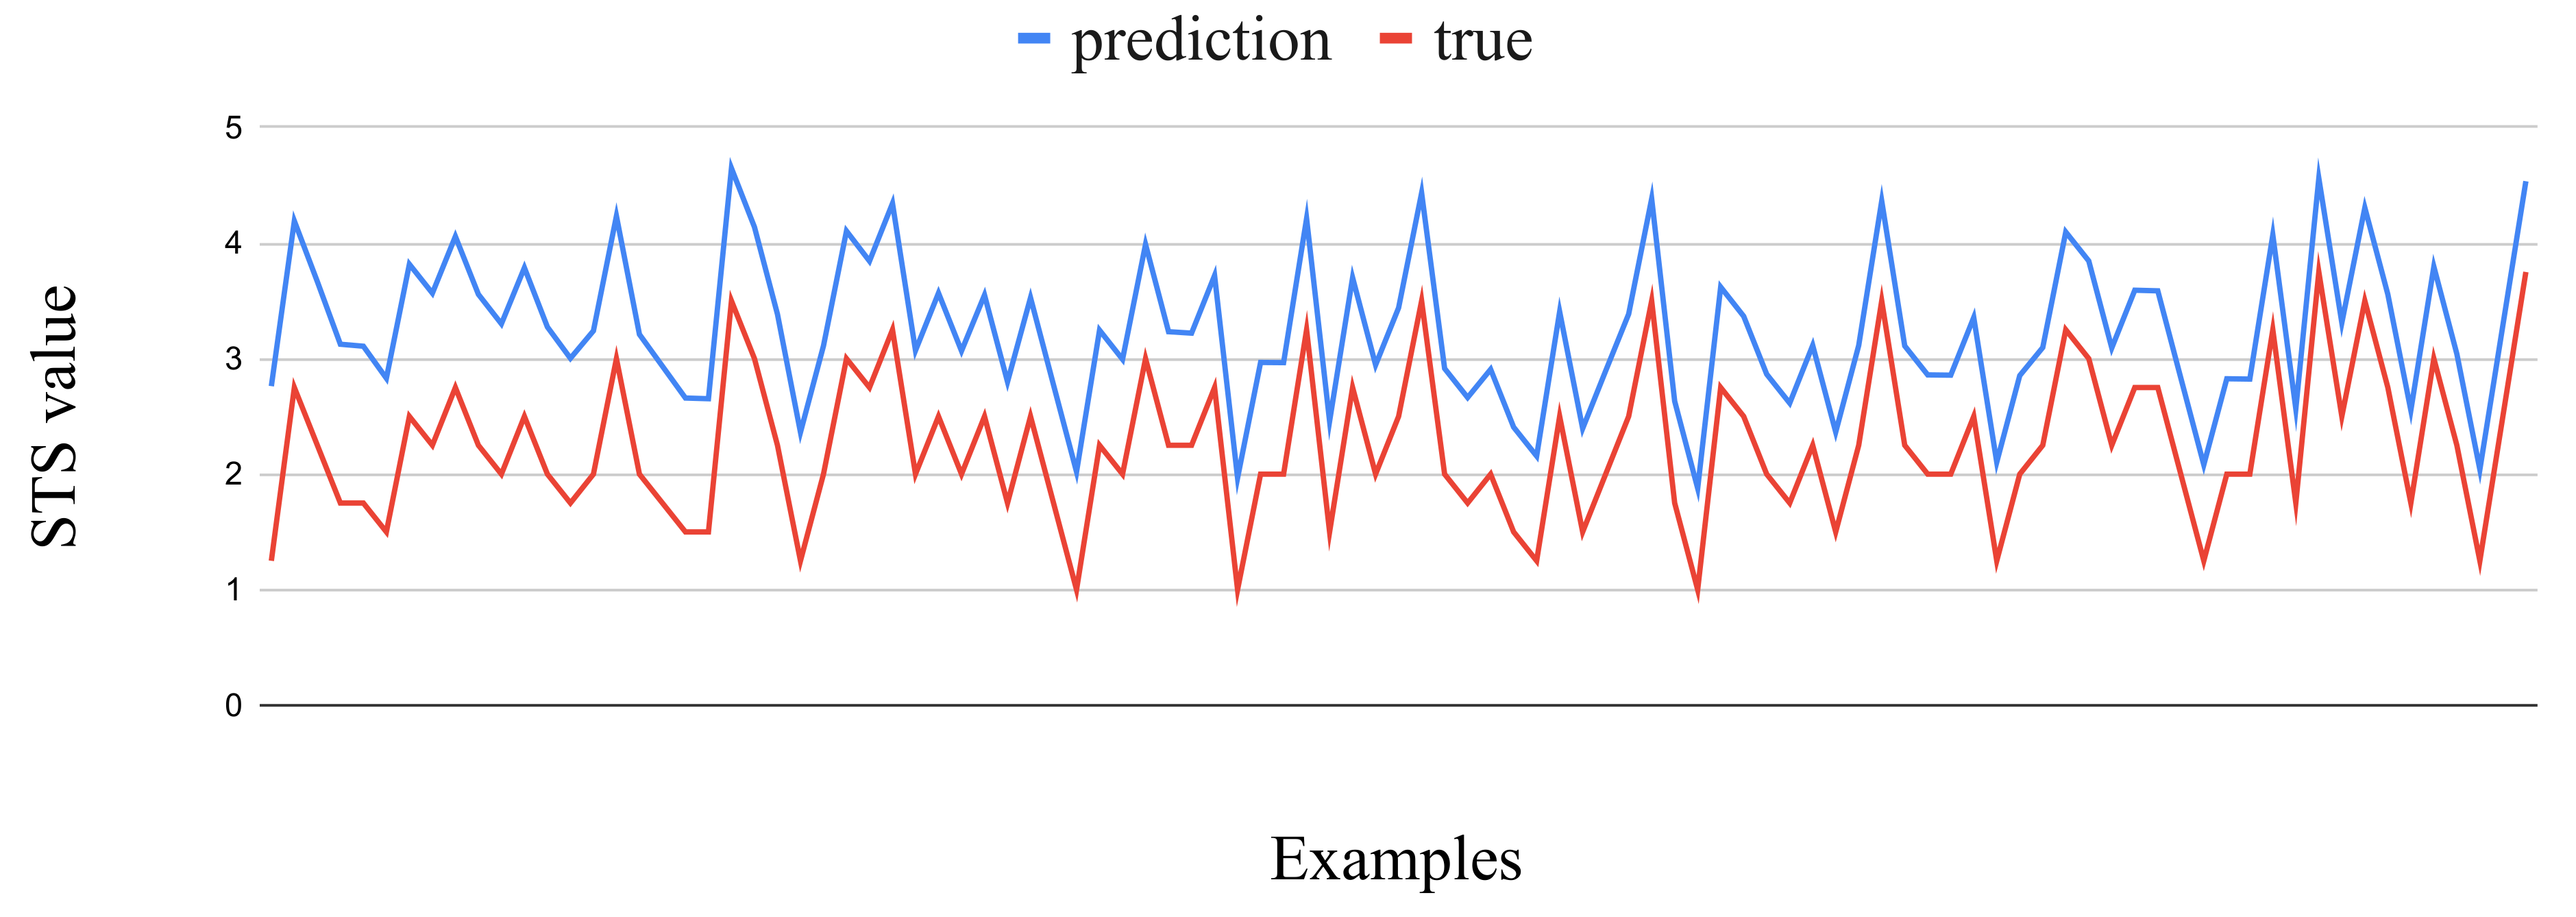
We also performed the same analysis for the ASSIN-PTBR corpus, wherein the ptBERT-Large fine tuned model achieved the best MSE value of all corpora. Here, the distance between predictions and true values is also approximately constant, as shown in Figure 2. Again, we experimented with the previously mentioned conditional subtraction, but here the best MSE was obtained by subtracting 0.8 from the predicted value whenever the distance between original prediction and true value was greater than 0.5. The resulting MSE was 0.12, instead of the original 0.21, and the condition complied with 285 of the 2000 test examples. Subtracting 0.8 from all predictions resulted in a MSE of 0.8, which is worse than the original result, since only approximately 10% of the test examples complied with the condition for subtraction.
Moreover, we inspected individual examples where the ptBERT-Large fine tuned model failed to identify the NLI class. We did not find particular differences between the language employed in such cases and that of successful classification cases. As embeddings are not interpretable, and hence do not provide an explanation from their features, we were not able to reason about the language in misclassifications. However, it was possible to observe that some examples from the corpora are difficult to understand. For instance, in ASSIN2, sentences Um peixe está sendo cortado por um cara and Um cara está fatiando um peixe are not considered as entailment, but A comida nas bandejas está sendo comida pelos filhotes de gato and Poucos filhotes de gato estão comendo are considered as entailment. However, it is out of the scope of this paper to discuss the quality of the corpora, although issues with NLI corpora can be found in [40], particularly regarding the development guidelines of the SICK corpus [10], on which our evaluated ASSIN2 and SICK-BR corpora were based.
7. Conclusions
We employed two distinct forms of features for NLI and STS in Portuguese, namely, lexical features and BERT embeddings. We presented several supervised modules for NLI and STS tasks, which deal with both European and Brazilian Portuguese variants; news and caption based text styles; and the semantic relations of entailment, paraphrase and contradiction.
As a modern model, BERT reaches better results than lexical features. Our best result was most frequently obtained by fine tuning the BERT model to a particular corpus, such that the resulting BERT embeddings were relevant to the NLI and STS tasks, as described in the training set of such corpus. Particularly, the best result was obtained with a large BERT model pre-trained only in Portuguese texts. Regarding base models, using a BERT model pre-trained only in Portuguese texts achieved better results than the multilingual model originally developed by the BERT authors.
Using generic BERT models to compose feature vectors, and employing these in traditional machine learning models, is not able to compete with fine tuned models, particularly when combined with lexical features, which produced the worst results. However, the difference between results was smaller in the ASSIN corpus, which is based on news sources. Additionally, in the ASSIN corpus, using only lexical features achieved competitive results to models based on features vectors that include BERT embeddings.
Future work includes exploring other sources of features already available for Portuguese, such as from syntactic analysis, searching optimal parameters for models based on neural networks, further exploring ensembles of fine tuned models and analyzing language usage in examples. Particularly, the quality of Portuguese corpora for NLI or STS tasks requires further investigation, as it is relevant to understand the different average results we obtained in each corpus, and to the best of our knowledge this has not yet been addressed.
Author Contributions
Conceptualization, P.F., L.C. and P.Q.; methodology, P.F., L.C. and P.Q.; software, P.F.; validation, P.F., L.C. and P.Q.; formal analysis, P.F., L.C. and P.Q.; investigation, P.F., L.C. and P.Q.; resources, P.F.; data curation, P.F., L.C. and P.Q.; writing—original draft preparation, P.F., L.C. and P.Q.; writing—review and editing, P.F., L.C. and P.Q.; visualization, P.F., L.C. and P.Q.; supervision, L.C. and P.Q.; project administration, L.C.; funding acquisition, L.C. All authors have read and agreed to the published version of the manuscript.
Funding
This work was supported by national funds through FCT, Fundação para a Ciência e Tecnologia, under project UIDB/50021/2020 and by FCT’s INCoDe 2030 initiative, in the scope of the demonstration project AIA, “Apoio Inteligente a empreendedores (chatbots)”, which also supports the scholarship of Pedro Fialho.
Conflicts of Interest
The authors declare no conflict of interest.
References
- Dagan, I.; Dolan, B.; Magnini, B.; Roth, D. Recognizing textual entailment: Rational, evaluation and approaches. Nat. Lang. Eng. 2009, 15, i–xvii. [Google Scholar] [CrossRef]
- Devlin, J.; Chang, M.W.; Lee, K.; Toutanova, K. BERT: Pre-training of Deep Bidirectional Transformers for Language Understanding. In Proceedings of the 2019 Conference of the North American Chapter of the Association for Computational Linguistics: Human Language Technologies, Volume 1 (Long and Short Papers), New Orleans, LA, USA, 1–6 June 2018; Association for Computational Linguistics: Minneapolis, MN, USA, 2019; pp. 4171–4186. [Google Scholar] [CrossRef]
- Rodrigues, R.; Couto, P.; Rodrigues, I. IPR: The Semantic Textual Similarity and Recognizing Textual Entailment Systems. 2019. Available online: http://ceur-ws.org/Vol-2583/4_IPR.pdf (accessed on 1 October 2020).
- Cabezudo, M.A.S.; Inácio, M.; Rodrigues, A.C.; Casanova, E.; de Sousa, R.F. NILC at ASSIN 2: Exploring Multilingual Approaches. 2019. Available online: http://ceur-ws.org/Vol-2583/5_NILC.pdf (accessed on 1 October 2020).
- Pires, T.; Schlinger, E.; Garrette, D. How Multilingual is Multilingual BERT? In Proceedings of the 57th Annual Meeting of the Association for Computational Linguistics, Florence, Italy, 28 July–2 August 2019; pp. 4996–5001. [Google Scholar] [CrossRef] [Green Version]
- Bar-Haim, R.; Dagan, I.; Szpektor, I. Benchmarking Applied Semantic Inference: The PASCAL Recognising Textual Entailment Challenges. In Language, Culture, Computation. Computing—Theory and Technology—Essays Dedicated to Yaacov Choueka on the Occasion of His 75th Birthday, Part I; Dershowitz, N., Nissan, E., Eds.; Springer: Berlin/Heidelberg, Germany, 2014; Volume 8001, pp. 409–424. [Google Scholar] [CrossRef]
- Agirre, E.; Diab, M.; Cer, D.; Gonzalez-Agirre, A. SemEval-2012 Task 6: A Pilot on Semantic Textual Similarity. In Proceedings of the First Joint Conference on Lexical and Computational Semantics—Volume 1: Proceedings of the Main Conference and the Shared Task, and Volume 2: Proceedings of the Sixth International Workshop on Semantic Evaluation, Montréal, QC, Canada, 7–8 June 2012; pp. 385–393. [Google Scholar]
- Cer, D.; Diab, M.; Agirre, E.; Lopez-Gazpio, I.; Specia, L. SemEval-2017 Task 1: Semantic Textual Similarity Multilingual and Crosslingual Focused Evaluation. In Proceedings of the 11th International Workshop on Semantic Evaluation (SemEval-2017), Vancouver, BC, Canada, 3–4 August 2017; Association for Computational Linguistics: Vancouver, BC, Canada, 2017; pp. 1–14. [Google Scholar] [CrossRef]
- Fonseca, E.; Borges dos Santos, L.; Criscuolo, M.; Aluísio, S. Visão Geral da Avaliação de Similaridade Semântica e Inferência Textual. Linguamática 2016, 8, 3–13. [Google Scholar]
- Marelli, M.; Menini, S.; Baroni, M.; Bentivogli, L.; Bernardi, R.; Zamparelli, R. A SICK cure for the evaluation of compositional distributional semantic models. In Proceedings of the Ninth International Conference on Language Resources and Evaluation (LREC-2014), Reykjavik, Iceland, 26–31 May 2014; European Languages Resources Association (ELRA): Reykjavik, Iceland, 2014; pp. 216–223. [Google Scholar]
- Real, L.; Rodrigues, A.; Vieira e Silva, A.; Albiero, B.; Thalenberg, B.; Guide, B.; Silva, C.; de Oliveira Lima, G.; Câmara, I.C.S.; Stanojević, M.; et al. SICK-BR: A Portuguese Corpus for Inference. In Computational Processing of the Portuguese Language; Villavicencio, A., Moreira, V., Abad, A., Caseli, H., Gamallo, P., Ramisch, C., Gonçalo Oliveira, H., Paetzold, G.H., Eds.; Springer International Publishing: Cham, Switzerland, 2018; pp. 303–312. [Google Scholar]
- Real, L.; Fonseca, E.; Gonçalo Oliveira, H. The ASSIN 2 Shared Task: A Quick Overview. In Computational Processing of the Portuguese Language; Quaresma, P., Vieira, R., Aluísio, S., Moniz, H., Batista, F., Gonçalves, T., Eds.; Springer International Publishing: Cham, Switzerland, 2020; pp. 406–412. [Google Scholar]
- Fialho, P.; Marques, R.; Martins, B.; Coheur, L.; Quaresma, P. INESC-ID@ASSIN: Medição de Similaridade Semântica e Reconhecimento de Inferência Textual. Linguamática 2016, 8, 33–42. [Google Scholar]
- Mikolov, T.; Sutskever, I.; Chen, K.; Corrado, G.S.; Dean, J. Distributed Representations of Words and Phrases and their Compositionality. In Advances in Neural Information Processing Systems 26; Burges, C.J.C., Bottou, L., Welling, M., Ghahramani, Z., Weinberger, K.Q., Eds.; Curran Associates: Red Hook, NY, USA, 2013; pp. 3111–3119. [Google Scholar]
- Barbosa, L.; Cavalin, P.; Guimarães, V.; Kormaksson, M. Blue Man Group no ASSIN: Usando Representações Distribuídas para Similaridade Semântica e Inferência Textual. Linguamática 2016, 8, 15–22. [Google Scholar]
- Hartmann, N. Solo Queue at ASSIN: Combinando Abordagens Tradicionais e Emergentes. Linguamática 2016, 8, 59–64. [Google Scholar]
- Oliveira Alves, A.; Rodrigues, R.; Gonçalo Oliveira, H. ASAPP: Alinhamento Semântico Automático de Palavras aplicado ao Português. Linguamática 2016, 8, 43–58. [Google Scholar]
- Freire, J.; Pinheiro, V.; Feitosa, D. FlexSTS: Um Framework para Similaridade Semântica Textual. Linguamática 2016, 8, 23–31. [Google Scholar]
- Pinheiro, A.; Ferreira, R.; Ferreira, M.A.D.; Rolim, V.B.; Tenório, J.V.S. Statistical and Semantic Features to Measure Sentence Similarity in Portuguese. In Proceedings of the 2017 Brazilian Conference on Intelligent Systems (BRACIS), Uberlândia, Brazil, 2–5 October 2017; pp. 342–347. [Google Scholar]
- Rocha, G.; Cardoso, H.L. Recognizing Textual Entailment: Challenges in the Portuguese Language. Information 2018, 9, 76. [Google Scholar] [CrossRef] [Green Version]
- Alves, A.; Oliveira, H.G.; Rodrigues, R.; Encarnação, R. ASAPP 2.0: Advancing the state-of-the-art of semantic textual similarity for Portuguese. In Proceedings of the 7th Symposium on Languages, Applications and Technologies (SLATE 2018), Guimaraes, Portugal, 21–22 June 2018; Henriques, P.R., Leal, J.P., Leitão, A.M., Guinovart, X.G., Eds.; Schloss Dagstuhl–Leibniz-Zentrum fuer Informatik: Dagstuhl, Germany, 2018; Volume 62, pp. 12:1–12:17. [Google Scholar] [CrossRef]
- Wang, A.; Singh, A.; Michael, J.; Hill, F.; Levy, O.; Bowman, S. GLUE: A Multi-Task Benchmark and Analysis Platform for Natural Language Understanding. In Proceedings of the 2018 EMNLP Workshop BlackboxNLP: Analyzing and Interpreting Neural Networks for NLP, Brussels, Belgium, 1 November 2018; pp. 353–355. [Google Scholar] [CrossRef] [Green Version]
- Vaswani, A.; Shazeer, N.; Parmar, N.; Uszkoreit, J.; Jones, L.; Gomez, A.N.; Kaiser, L.u.; Polosukhin, I. Attention is All you Need. In Advances in Neural Information Processing Systems 30; Guyon, I., Luxburg, U.V., Bengio, S., Wallach, H., Fergus, R., Vishwanathan, S., Garnett, R., Eds.; Curran Associates: Red Hook, NY, USA, 2017; pp. 5998–6008. [Google Scholar]
- Rodrigues, R.C.; da Silva, J.R.; de Castro, P.V.Q.; da Silva, N.F.F.; da Silva Soares, A. Multilingual Transformer Ensembles for Portuguese Natural Language Tasks. Available online: http://ceur-ws.org/Vol-2583/3_DLB.pdf (accessed on 10 October 2020).
- Papineni, K.; Roukos, S.; Ward, T.; Zhu, W.J. Bleu: A Method for Automatic Evaluation of Machine Translation. In Proceedings of the 40th Annual Meeting of the Association for Computational Linguistics, Philadelphia, PA, USA, 7–12 July 2002; Association for Computational Linguistics: Philadelphia, PA, USA, 2002; pp. 311–318. [Google Scholar] [CrossRef] [Green Version]
- De Paiva, V.; Rademaker, A.; de Melo, G. OpenWordNet-PT: An Open Brazilian Wordnet for Reasoning. In Proceedings of the COLING 2012: Demonstration Papers, Mumbai, India, 8–15 December 2012; The COLING 2012 Organizing Committee: Mumbai, India, 2012; pp. 353–360. [Google Scholar]
- Jawahar, G.; Sagot, B.; Seddah, D. What Does BERT Learn about the Structure of Language? In Proceedings of the 57th Annual Meeting of the Association for Computational Linguistics, Florence, Italy, 28 July–2 August 2019; Association for Computational Linguistics: Florence, Italy, 2019; pp. 3651–3657. [Google Scholar] [CrossRef] [Green Version]
- Tenney, I.; Das, D.; Pavlick, E. BERT Rediscovers the Classical NLP Pipeline. In Proceedings of the 57th Annual Meeting of the Association for Computational Linguistics, Florence, Italy, 28 July–2 August 2019; Association for Computational Linguistics: Florence, Italy, 2019; pp. 4593–4601. [Google Scholar] [CrossRef] [Green Version]
- Liu, N.F.; Gardner, M.; Belinkov, Y.; Peters, M.E.; Smith, N.A. Linguistic Knowledge and Transferability of Contextual Representations. In Proceedings of the 2019 Conference of the North American Chapter of the Association for Computational Linguistics: Human Language Technologies, Volume 1 (Long and Short Papers), New Orleans, LA, USA, 1–6 June 2018; Association for Computational Linguistics: Minneapolis, MN, USA, 2019; pp. 1073–1094. [Google Scholar] [CrossRef]
- Jaccard, P. THE DISTRIBUTION OF THE FLORA IN THE ALPINE ZONE.1. New Phytol. 1912, 11, 37–50. [Google Scholar] [CrossRef]
- Kingma, D.P.; Ba, J. Adam: A Method for Stochastic Optimization. In Proceedings of the 3rd International Conference on Learning Representations, ICLR 2015, San Diego, CA, USA, 7–9 May 2015. [Google Scholar]
- Pedregosa, F.; Varoquaux, G.; Gramfort, A.; Michel, V.; Thirion, B.; Grisel, O.; Blondel, M.; Prettenhofer, P.; Weiss, R.; Dubourg, V.; et al. Scikit-learn: Machine Learning in Python. J. Mach. Learn. Res. 2011, 12, 2825–2830. [Google Scholar]
- Zadrozny, B.; Elkan, C. Transforming Classifier Scores into Accurate Multiclass Probability Estimates. In Proceedings of the Eighth ACM SIGKDD International Conference on Knowledge Discovery and Data Mining, Edmonton, AB, Canada, 23–26 July 2002; Association for Computing Machinery: New York, NY, USA, 2002; pp. 694–699. [Google Scholar] [CrossRef]
- Platt, J. Probabilistic outputs for support vector machines and comparison to regularize likelihood methods. In Advances in Large Margin Classifiers; Smola, A., Bartlett, P., Schoelkopf, B., Schuurmans, D., Eds.; MIT Press: Cambridge, MA, USA, 2000; pp. 61–74. [Google Scholar]
- Marelli, M.; Bentivogli, L.; Baroni, M.; Bernardi, R.; Menini, S.; Zamparelli, R. SemEval-2014 Task 1: Evaluation of Compositional Distributional Semantic Models on Full Sentences through Semantic Relatedness and Textual Entailment. In Proceedings of the 8th International Workshop on Semantic Evaluation (SemEval 2014), Dublin, Ireland, 23–24 August 2014; pp. 1–8. [Google Scholar] [CrossRef]
- De Souza, J.V.A.; e Oliveira, L.E.S.; Gumiel, Y.B.; Carvalho, D.R.; Moro, C.M.C. Incorporating Multiple Feature Groups to a Siamese Neural Network for Semantic Textual Similarity Task in Portuguese Texts. 2019. Available online: http://ceur-ws.org/Vol-2583/6_PUCPR.pdf (accessed on 1 October 2020).
- Santos, J.; Alves, A.; Oliveira, H.G. ASAPPpy: A Python Framework for Portuguese STS. 2019. Available online: http://ceur-ws.org/Vol-2583/2_ASAPPpy.pdf (accessed on 1 October 2020).
- Silva, A.d.B.; Rigo, S.J. Enhancing Brazilian Portuguese Textual Entailment Recognition with a Hybrid Approach. J. Comput. Sci. 2018, 14, 945–956. [Google Scholar] [CrossRef] [Green Version]
- Fonseca, E.; Alvarenga, J.P.R. Multilingual Transformer Ensembles for Portuguese Natural Language Tasks. In Proceedings of the ASSIN 2 Shared Task: Evaluating Semantic Textual Similarity and Textual Entailment in Portuguese Co-Located with XII Symposium in Information and Human Language Technology (STIL 2019), Salvador, Brazil, 15 October 2019; Volume 2583, pp. 68–77. [Google Scholar]
- Kalouli, A.L.; Buis, A.; Real, L.; Palmer, M.; de Paiva, V. Explaining Simple Natural Language Inference. In Proceedings of the 13th Linguistic Annotation Workshop, Florence, Italy, 1 August 2019; Association for Computational Linguistics: Florence, Italy, 2019; pp. 132–143. [Google Scholar] [CrossRef]
Figure 1.
Top 100 examples of ASSIN2 with greater distance between predicted and true values of the STS task, where such distance is greater than 0.5.
Figure 1.
Top 100 examples of ASSIN2 with greater distance between predicted and true values of the STS task, where such distance is greater than 0.5.

Figure 2.
Top 100 examples of ASSIN-PTBR with greater distance between the prediction and true values of the STS task, where such distance is greater than 0.5
Figure 2.
Top 100 examples of ASSIN-PTBR with greater distance between the prediction and true values of the STS task, where such distance is greater than 0.5


Table 1.
ASSIN-PTPT NLI and STS results.
| System | Accuracy | Precision | Recall | F1 | MSE | Pearson | Spearman |
|---|---|---|---|---|---|---|---|
| # Other systems | |||||||
| de Souza et al. [36] | 0.64 | 0.66 | |||||
| Freire et al. [18] | 0.72 | 0.64 | |||||
| Hartmann [16] | 0.66 | 0.70 | |||||
| Alves et al. [21] | 0.43 | 0.78 | |||||
| Santos et al. [37] | 0.63 | 0.72 | |||||
| Rocha and Cardoso [20] | 0.84 | 0.73 | |||||
| Pinheiro et al. [19] | 0.83 | 0.82 | 0.57 | 0.70 | |||
| Barbosa et al. [15] | 0.78 | 0.61 | 0.72 | 0.64 | |||
| Oliveira Alves et al. [17] | 0.79 | 0.58 | 0.70 | 0.68 | |||
| # BERT fine tuned | |||||||
| ptBERT-Large | 0.91 ± 0.00 | 0.87 ± 0.01 | 0.81 ± 0.01 | 0.84 ± 0.00 | 0.40 ± 0.01 | 0.85 ± 0.01 | 0.83 ± 0.01 |
| ptBERT-Base | 0.90 ± 0.01 | 0.86 ± 0.03 | 0.76 ± 0.03 | 0.80 ± 0.02 | 0.47 ± 0.10 | 0.85 ± 0.00 | 0.83 ± 0.00 |
| mBERT-Base | 0.87 ± 0.01 | 0.77 ± 0.03 | 0.79 ± 0.02 | 0.76 ± 0.04 | 0.53 ± 0.04 | 0.83 ± 0.01 | 0.81 ± 0.01 |
| # BERT as features | |||||||
| ptBERT-Large (lsvc) | 0.83 | 0.69 | 0.63 | 0.65 | 0.56 | 0.77 | 0.77 |
| ptBERT-Base (lsvc) | 0.83 | 0.70 | 0.67 | 0.68 | 0.56 | 0.76 | 0.76 |
| mBERT-Base (lsvc) | 0.85 | 0.72 | 0.69 | 0.70 | 0.54 | 0.78 | 0.77 |
| # BERT as features + LEX | |||||||
| ptBERT-Large (lsvc) | 0.84 | 0.69 | 0.64 | 0.65 | 1.23 | 0.77 | 0.77 |
| ptBERT-Large (rf) | 0.74 | 0.59 | 0.43 | 0.43 | 0.65 | 0.74 | 0.73 |
| ptBERT-Base (lsvc) | 0.85 | 0.72 | 0.72 | 0.72 | 0.50 | 0.76 | 0.76 |
| mBERT-Base (lsvc) | 0.85 | 0.71 | 0.73 | 0.72 | 0.43 | 0.79 | 0.78 |
| # LEX | |||||||
| lsvc | 0.86 | 0.76 | 0.74 | 0.75 | 0.61 | 0.74 | 0.73 |
Table 2.
ASSIN-PTPT NLI results per class, for the fine tuned ptBERT-Large model.
| Label | Accuracy | Precision | Recall | F1 | Examples from Total |
|---|---|---|---|---|---|
| neutral | 0.94 | 0.93 | 0.98 | 0.96 | 0.69 |
| entailment | 0.93 | 0.90 | 0.81 | 0.85 | 0.24 |
| paraphrase | 0.97 | 0.82 | 0.66 | 0.73 | 0.67 |
Table 3.
ASSIN-PTBR NLI and STS results.
| System | Accuracy | Precision | Recall | F1 | MSE | Pearson | Spearman |
|---|---|---|---|---|---|---|---|
| # Other systems | |||||||
| de Souza et al. [36] | 0.45 | 0.64 | |||||
| Santos et al. [37] | 0.37 | 0.71 | |||||
| Freire et al. [18] | 0.47 | 0.62 | |||||
| Silva and Rigo [38] | 0.43 | 0.66 | |||||
| Hartmann [16] | 0.38 | 0.70 | |||||
| Alves et al. [21] | 0.34 | 0.74 | |||||
| Barbosa et al. [15] | 0.82 | 0.52 | 0.44 | 0.65 | |||
| Oliveira Alves et al. [17] | 0.82 | 0.47 | 0.44 | 0.65 | |||
| Pinheiro et al. [19] | 0.85 | 0.81 | 0.37 | 0.71 | |||
| # BERT fine tuned | |||||||
| ptBERT-Large | 0.90 ± 0.01 | 0.82 ± 0.05 | 0.67 ± 0.05 | 0.70 ± 0.06 | 0.23 ± 0.01 | 0.84 ± 0.01 | 0.83 ± 0.01 |
| ptBERT-Base | 0.90 ± 0.00 | 0.83 ± 0.01 | 0.70 ± 0.03 | 0.75 ± 0.02 | 0.25 ± 0.01 | 0.83 ± 0.00 | 0.82 ± 0.00 |
| mBERT-Base | 0.86 ± 0.00 | 0.59 ± 0.15 | 0.53 ± 0.02 | 0.52 ± 0.01 | 0.32 ± 0.02 | 0.78 ± 0.01 | 0.77 ± 0.01 |
| # BERT as features | |||||||
| ptBERT-Large (lsvc) | 0.84 | 0.66 | 0.57 | 0.59 | 0.30 | 0.78 | 0.78 |
| ptBERT-Base (lsvc) | 0.84 | 0.66 | 0.57 | 0.59 | 0.29 | 0.78 | 0.78 |
| ptBERT-Base (poly) | 0.84 | 0.68 | 0.61 | 0.63 | 0.30 | 0.78 | 0.77 |
| mBERT-Base (lsvc) | 0.85 | 0.66 | 0.59 | 0.62 | 0.31 | 0.77 | 0.76 |
| # BERT as features + LEX | |||||||
| ptBERT-Large (lsvc) | 0.84 | 0.68 | 0.62 | 0.62 | 0.72 | 0.79 | 0.78 |
| ptBERT-Large (voting) | 0.79 | 0.63 | 0.62 | 0.60 | 0.34 | 0.80 | 0.79 |
| ptBERT-Base (voting) | 0.82 | 0.63 | 0.66 | 0.64 | 0.28 | 0.80 | 0.79 |
| mBERT-Base (voting) | 0.85 | 0.68 | 0.65 | 0.67 | 0.30 | 0.79 | 0.77 |
| # LEX | |||||||
| lsvc | 0.86 | 0.70 | 0.59 | 0.63 | 0.35 | 0.74 | 0.72 |
Table 4.
ASSIN-PTBR NLI results per class, for the fine tuned ptBERT-Large model.
| Label | Accuracy | Precision | Recall | F1 | Examples from Total |
|---|---|---|---|---|---|
| neutral | 0.94 | 0.94 | 0.98 | 0.96 | 0.78 |
| entailment | 0.91 | 0.72 | 0.75 | 0.73 | 0.17 |
| paraphrase | 0.96 | 0.95 | 0.33 | 0.49 | 0.53 |
Table 5.
ASSIN (PTPT + PTBR) NLI and STS results.
| System | Accuracy | Precision | Recall | F1 | MSE | Pearson | Spearman |
|---|---|---|---|---|---|---|---|
| # Other systems | |||||||
| de Souza et al. [36] | 0.56 | 0.66 | |||||
| Freire et al. [18] | 0.59 | 0.62 | |||||
| Hartmann [16] | 0.52 | 0.68 | |||||
| Barbosa et al. [15] | 0.80 | 0.58 | 0.59 | 0.63 | |||
| Oliveira Alves et al. [17] | 0.80 | 0.54 | 0.57 | 0.65 | |||
| Pinheiro et al. [19] | 0.83 | 0.83 | 0.47 | 0.70 | |||
| # BERT fine tuned | |||||||
| ptBERT-Large | 0.91 ± 0.01 | 0.84 ± 0.03 | 0.81 ± 0.05 | 0.82 ± 0.04 | 0.48 ± 0.11 | 0.82 ± 0.01 | 0.81 ± 0.01 |
| ptBERT-Base | 0.90 ± 0.01 | 0.81 ± 0.02 | 0.81 ± 0.01 | 0.81 ± 0.01 | 0.49 ± 0.03 | 0.81 ± 0.01 | 0.80 ± 0.01 |
| mBERT-Base | 0.90 ± 0.01 | 0.83 ± 0.02 | 0.78 ± 0.02 | 0.80 ± 0.01 | 0.43 ± 0.04 | 0.80 ± 0.01 | 0.79 ± 0.01 |
| # BERT as features | |||||||
| ptBERT-Large (lsvc) | 0.85 | 0.70 | 0.63 | 0.66 | 0.43 | 0.76 | 0.76 |
| ptBERT-Base (lsvc) | 0.86 | 0.72 | 0.68 | 0.70 | 0.42 | 0.76 | 0.76 |
| mBERT-Base (lsvc) | 0.86 | 0.73 | 0.67 | 0.69 | 0.42 | 0.77 | 0.76 |
| mBERT-Base (rbf) | 0.86 | 0.73 | 0.70 | 0.71 | 0.41 | 0.77 | 0.76 |
| # BERT as features + LEX | |||||||
| ptBERT-Large (voting) | 0.71 | 0.45 | 0.45 | 0.41 | 0.90 | 0.55 | 0.57 |
| ptBERT-Base (voting) | 0.74 | 0.42 | 0.35 | 0.31 | 0.67 | 0.64 | 0.66 |
| mBERT-Base (voting) | 0.75 | 0.54 | 0.52 | 0.50 | 0.58 | 0.70 | 0.70 |
| # LEX | |||||||
| lsvc | 0.86 | 0.75 | 0.68 | 0.71 | 0.48 | 0.72 | 0.71 |
Table 6.
ASSIN (PTPT + PTBR) NLI results per class, for the fine tuned ptBERT-Large model.
| Label | Accuracy | Precision | Recall | F1 | Examples from Total |
|---|---|---|---|---|---|
| neutral | 0.94 | 0.97 | 0.95 | 0.96 | 0.74 |
| entailment | 0.93 | 0.79 | 0.89 | 0.84 | 0.21 |
| paraphrase | 0.97 | 0.85 | 0.66 | 0.74 | 0.60 |
Table 7.
ASSIN2 NLI and STS results.
| System | Accuracy | Precision | Recall | F1 | MSE | Pearson | Spearman |
|---|---|---|---|---|---|---|---|
| # Other systems | |||||||
| de Souza et al. [36] | 0.60 | 0.72 | |||||
| Santos et al. [37] | 0.67 | 0.66 | 0.58 | 0.73 | |||
| Cabezudo et al. [4] | 0.87 | 0.87 | 0.64 | 0.73 | |||
| Fonseca and Alvarenga [39] | 0.87 | 0.87 | 0.39 | 0.80 | |||
| Rodrigues et al. [3] | 0.88 | 0.88 | 0.52 | 0.83 | |||
| Rodrigues et al. [24] | 0.88 | 0.88 | 0.59 | 0.79 | |||
| # BERT fine tuned | |||||||
| ptBERT-Large | 0.89 ± 0.00 | 0.90 ± 0.00 | 0.89 ± 0.00 | 0.89 ± 0.00 | 0.50 ± 0.09 | 0.84 ± 0.01 | 0.81 ± 0.01 |
| ptBERT-Base | 0.90 ± 0.01 | 0.90 ± 0.00 | 0.90 ± 0.01 | 0.90 ± 0.01 | 0.43 ± 0.03 | 0.84 ± 0.01 | 0.80 ± 0.01 |
| mBERT-Base | 0.88 ± 0.01 | 0.88 ± 0.01 | 0.88 ± 0.01 | 0.88 ± 0.01) | 0.49 ± 0.04 | 0.82 ± 0.01 | 0.79 ± 0.00 |
| # BERT as features | |||||||
| ptBERT-Large (voting) | 0.81 | 0.82 | 0.81 | 0.81 | 0.49 | 0.80 | 0.76 |
| ptBERT-Base (voting) | 0.80 | 0.81 | 0.80 | 0.79 | 0.50 | 0.81 | 0.76 |
| mBERT-Base (voting) | 0.79 | 0.80 | 0.79 | 0.78 | 0.56 | 0.76 | 0.72 |
| # BERT as features + LEX | |||||||
| ptBERT-Large (lsvc) | 0.83 | 0.83 | 0.83 | 0.83 | 5.17 | 0.75 | 0.69 |
| ptBERT-Large (rf) | 0.52 | 0.53 | 0.52 | 0.51 | 0.52 | 0.72 | 0.67 |
| ptBERT-Base (poly) | 0.78 | 0.81 | 0.78 | 0.78 | 4.26 | 0.75 | 0.68 |
| ptBERT-Base (voting) | 0.77 | 0.81 | 0.77 | 0.76 | 0.91 | 0.79 | 0.72 |
| ptBERT-Base (rf) | 0.74 | 0.77 | 0.74 | 0.74 | 0.49 | 0.75 | 0.72 |
| mBERT-Base (lsvc) | 0.79 | 0.80 | 0.79 | 0.78 | 0.87 | 0.70 | 0.64 |
| mBERT-Base (voting) | 0.79 | 0.81 | 0.79 | 0.79 | 0.45 | 0.76 | 0.71 |
| # LEX | |||||||
| voting | 0.76 | 0.76 | 0.76 | 0.76 | 0.62 | 0.70 | 0.68 |
Table 8.
ASSIN2 NLI results per class, for the fine tuned ptBERT-Large model.
| Label | Precision | Recall | F1 |
|---|---|---|---|
| NOT entailment | 0.93 | 0.86 | 0.90 |
| entailment | 0.87 | 0.94 | 0.90 |
Table 9.
SICK-BR NLI and STS results.
| System | Accuracy | Precision | Recall | F1 | MSE | Pearson | Spearman |
|---|---|---|---|---|---|---|---|
| # BERT fine tuned | |||||||
| ptBERT-Large | 0.80 ± 0.13 | 0.72 ± 0.30 | 0.76 ± 0.24 | 0.74 ± 0.28 | 0.47 ± 0.42 | 0.70 ± 0.39 | 0.66 ± 0.37 |
| ptBERT-Base | 0.86 ± 0.01 | 0.86 ± 0.01 | 0.85 ± 0.01 | 0.85 ± 0.00 | 0.30 ± 0.02 | 0.86 ± 0.01 | 0.80 ± 0.01 |
| mBERT-Base | 0.84 ± 0.01 | 0.83 ± 0.01 | 0.84 ± 0.00 | 0.84 ± 0.01 | 0.37 ± 0.02 | 0.85 ± 0.00 | 0.79 ± 0.00 |
| # BERT as features | |||||||
| ptBERT-Large (rbf) | 0.82 | 0.83 | 0.80 | 0.81 | 0.28 | 0.85 | 0.79 |
| ptBERT-Base (rbf) | 0.81 | 0.82 | 0.79 | 0.81 | 0.30 | 0.84 | 0.77 |
| mBERT-Base (rbf) | 0.81 | 0.82 | 0.78 | 0.80 | 0.33 | 0.82 | 0.75 |
| # BERT as features + LEX | |||||||
| ptBERT-Large (lsvc) | 0.82 | 0.83 | 0.80 | 0.82 | 2.33 | 0.83 | 0.76 |
| ptBERT-Large (voting) | 0.80 | 0.81 | 0.81 | 0.81 | 0.54 | 0.85 | 0.78 |
| ptBERT-Base (voting) | 0.80 | 0.82 | 0.78 | 0.79 | 0.37 | 0.82 | 0.74 |
| mBERT-Base (voting) | 0.81 | 0.82 | 0.78 | 0.80 | 0.34 | 0.82 | 0.76 |
| # LEX | |||||||
| voting | 0.78 | 0.79 | 0.72 | 0.75 | 0.45 | 0.75 | 0.69 |
Table 10.
SICK-BR NLI results per class, for the fine tuned ptBERT-Large model.
| Label | Accuracy | Precision | Recall | F1 | Examples from Total |
|---|---|---|---|---|---|
| neutral | 0.87 | 0.92 | 0.85 | 0.89 | 0.57 |
| entailment | 0.90 | 0.78 | 0.91 | 0.84 | 0.29 |
| contradiction | 0.97 | 0.90 | 0.86 | 0.88 | 0.15 |
Publisher’s Note: MDPI stays neutral with regard to jurisdictional claims in published maps and institutional affiliations. |
© 2020 by the authors. Licensee MDPI, Basel, Switzerland. This article is an open access article distributed under the terms and conditions of the Creative Commons Attribution (CC BY) license (http://creativecommons.org/licenses/by/4.0/).
Share and Cite
MDPI and ACS Style
Fialho, P.; Coheur, L.; Quaresma, P. Benchmarking Natural Language Inference and Semantic Textual Similarity for Portuguese. Information 2020, 11, 484. https://0-doi-org.brum.beds.ac.uk/10.3390/info11100484
AMA Style
Fialho P, Coheur L, Quaresma P. Benchmarking Natural Language Inference and Semantic Textual Similarity for Portuguese. Information. 2020; 11(10):484. https://0-doi-org.brum.beds.ac.uk/10.3390/info11100484
Chicago/Turabian StyleFialho, Pedro, Luísa Coheur, and Paulo Quaresma. 2020. "Benchmarking Natural Language Inference and Semantic Textual Similarity for Portuguese" Information 11, no. 10: 484. https://0-doi-org.brum.beds.ac.uk/10.3390/info11100484
Note that from the first issue of 2016, this journal uses article numbers instead of page numbers. See further details here.