An Attempt to Identify Meaningful Descriptors of Handgrip Strength Using a Novel Prototype: Preliminary Study

 , , , and
Abstract
:1. Introduction
2. Materials and Methods
2.1. Procedure
2.2. Sample
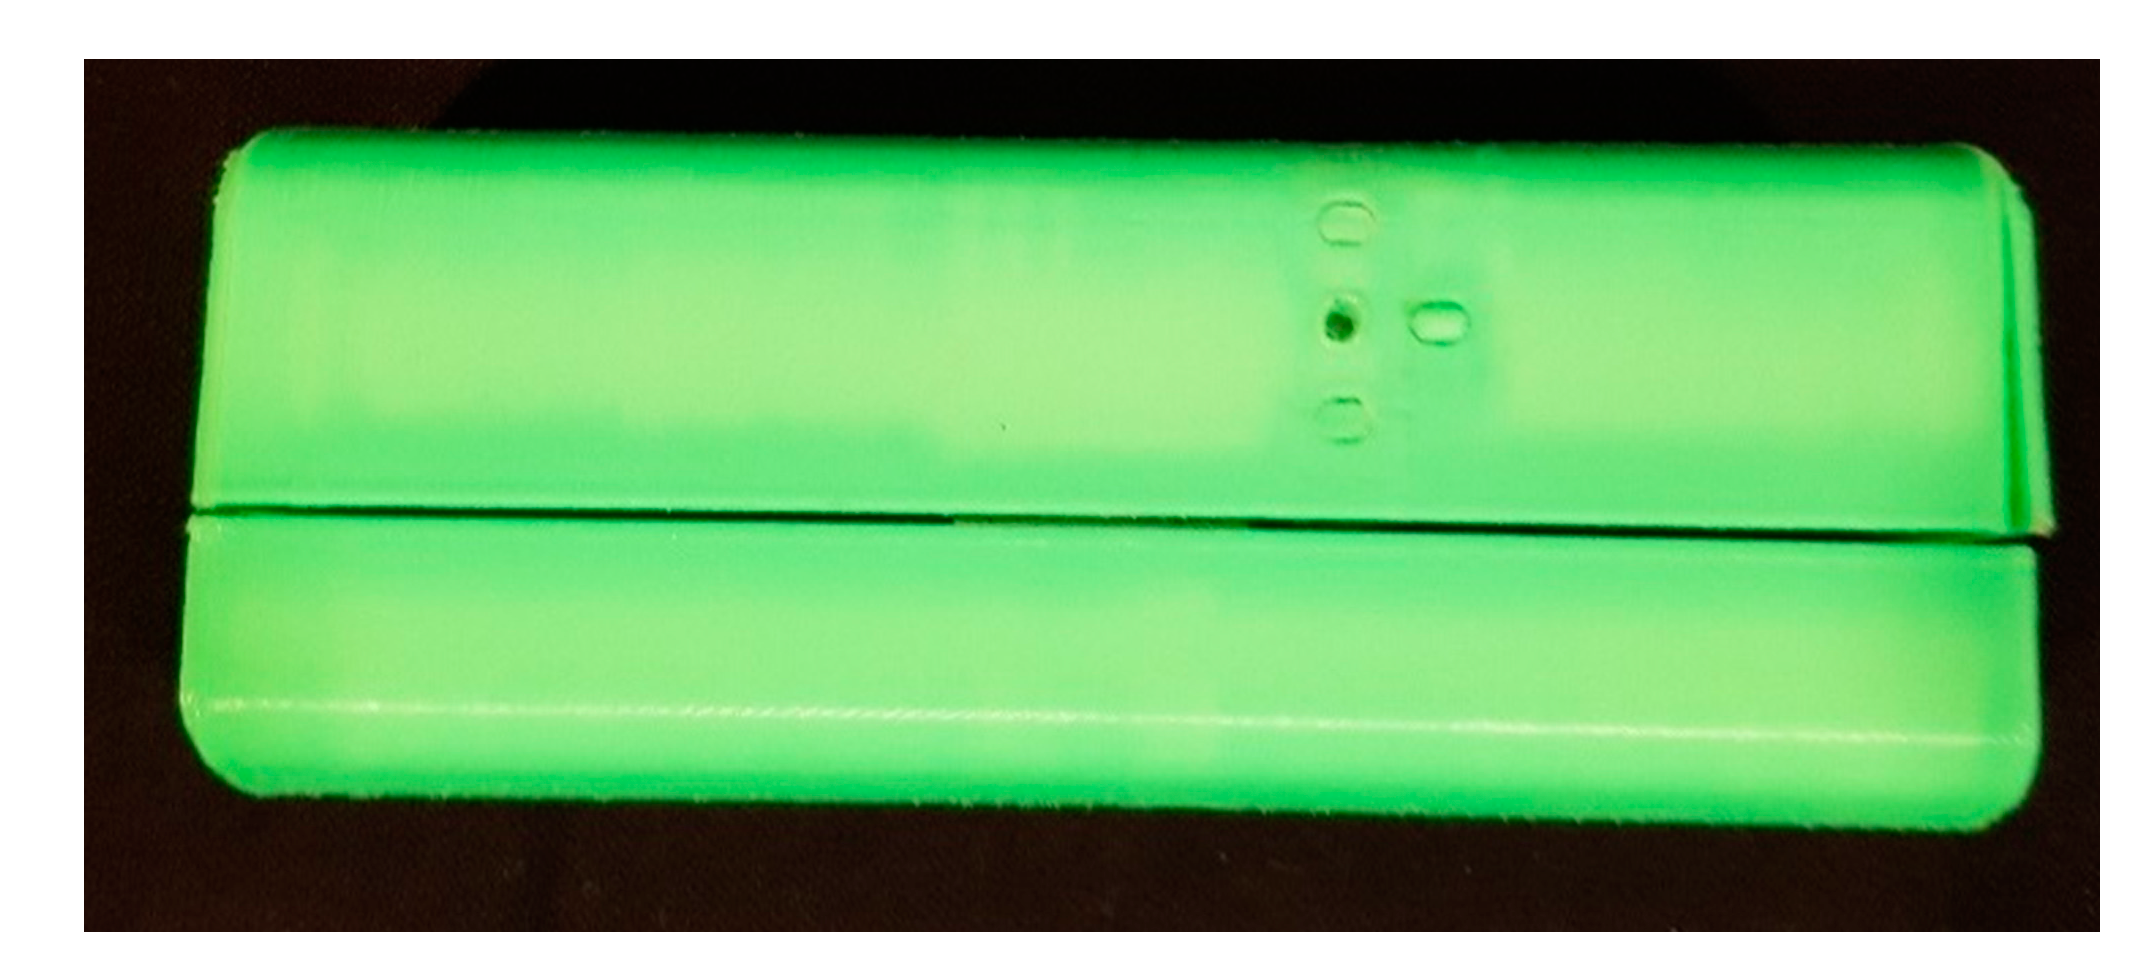
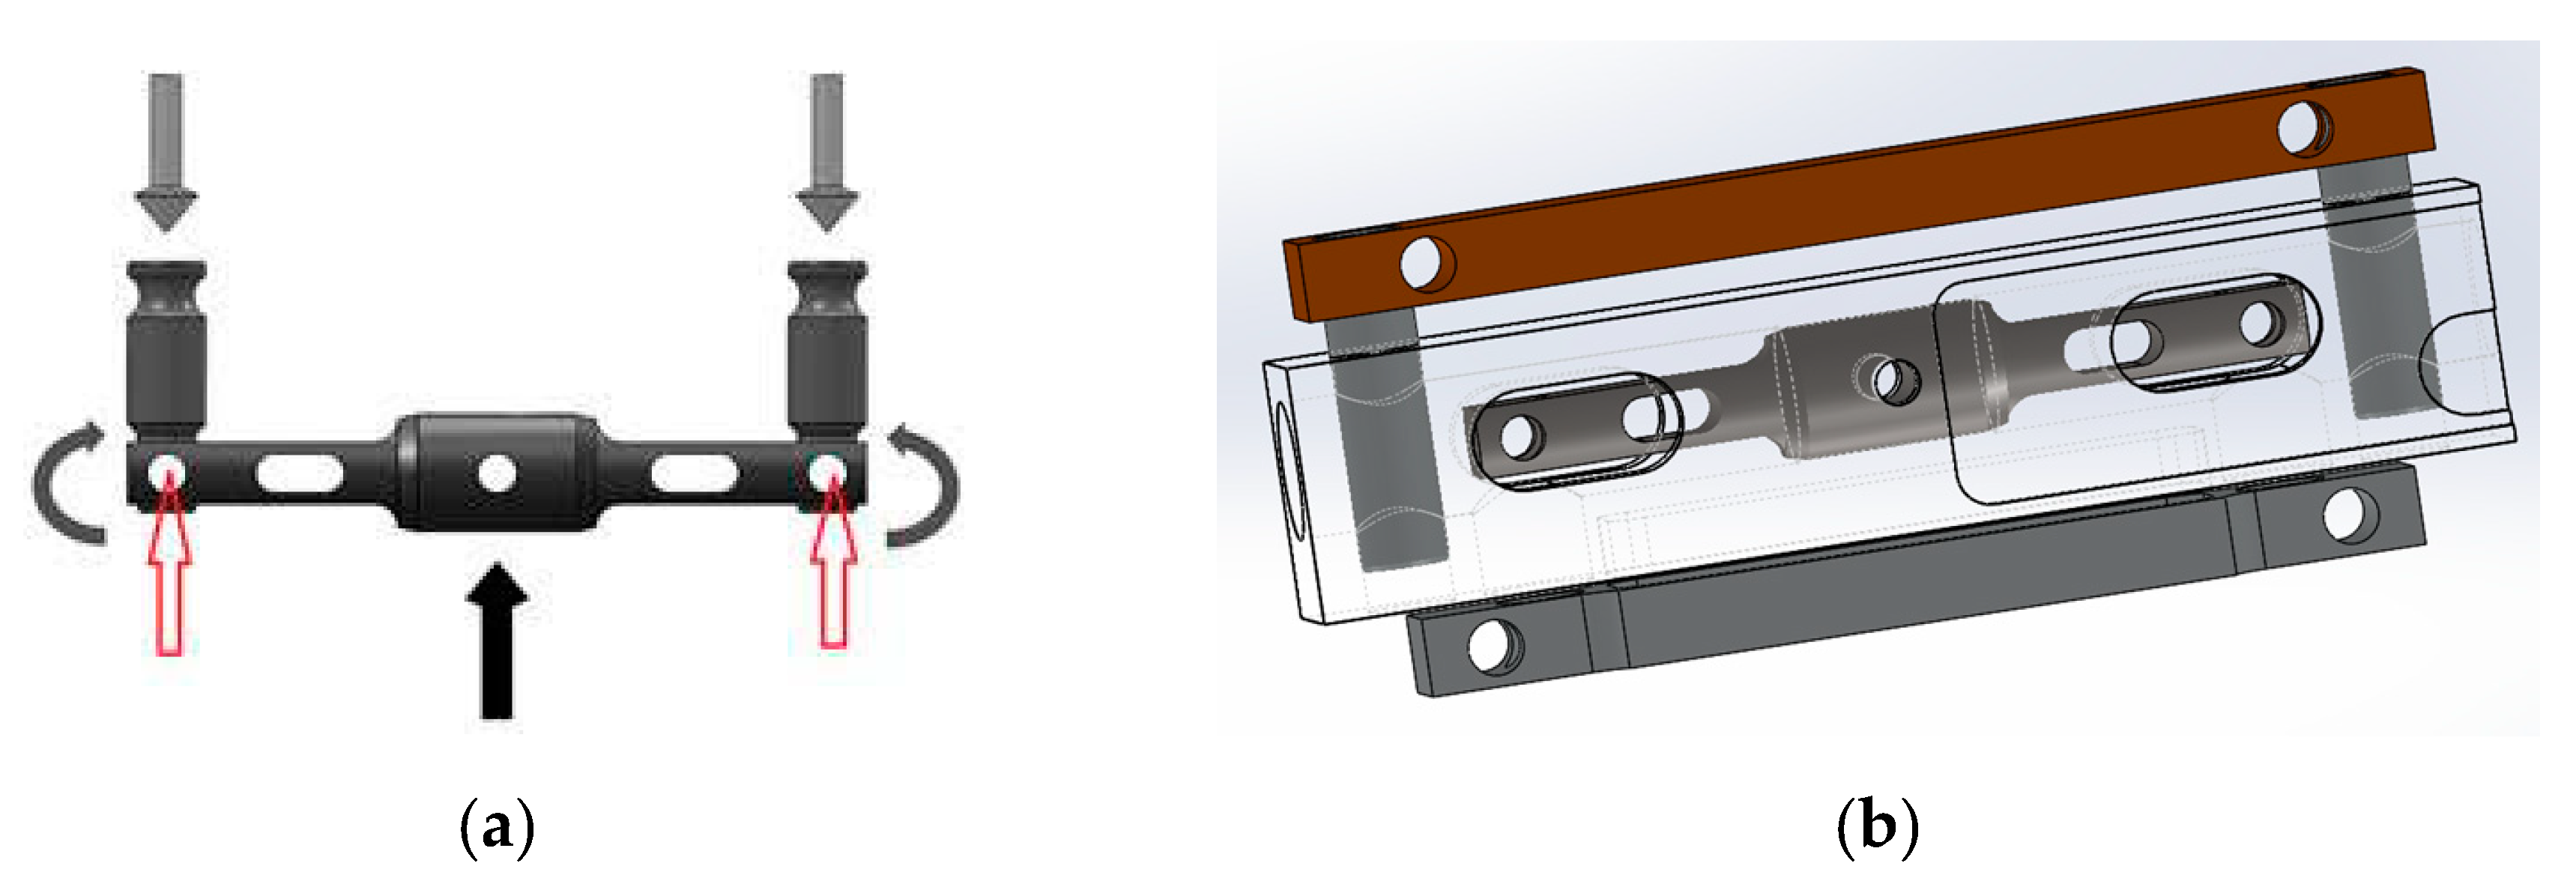
2.3. The BodyGrip Prototype
2.4. Data Analysis
- (1)
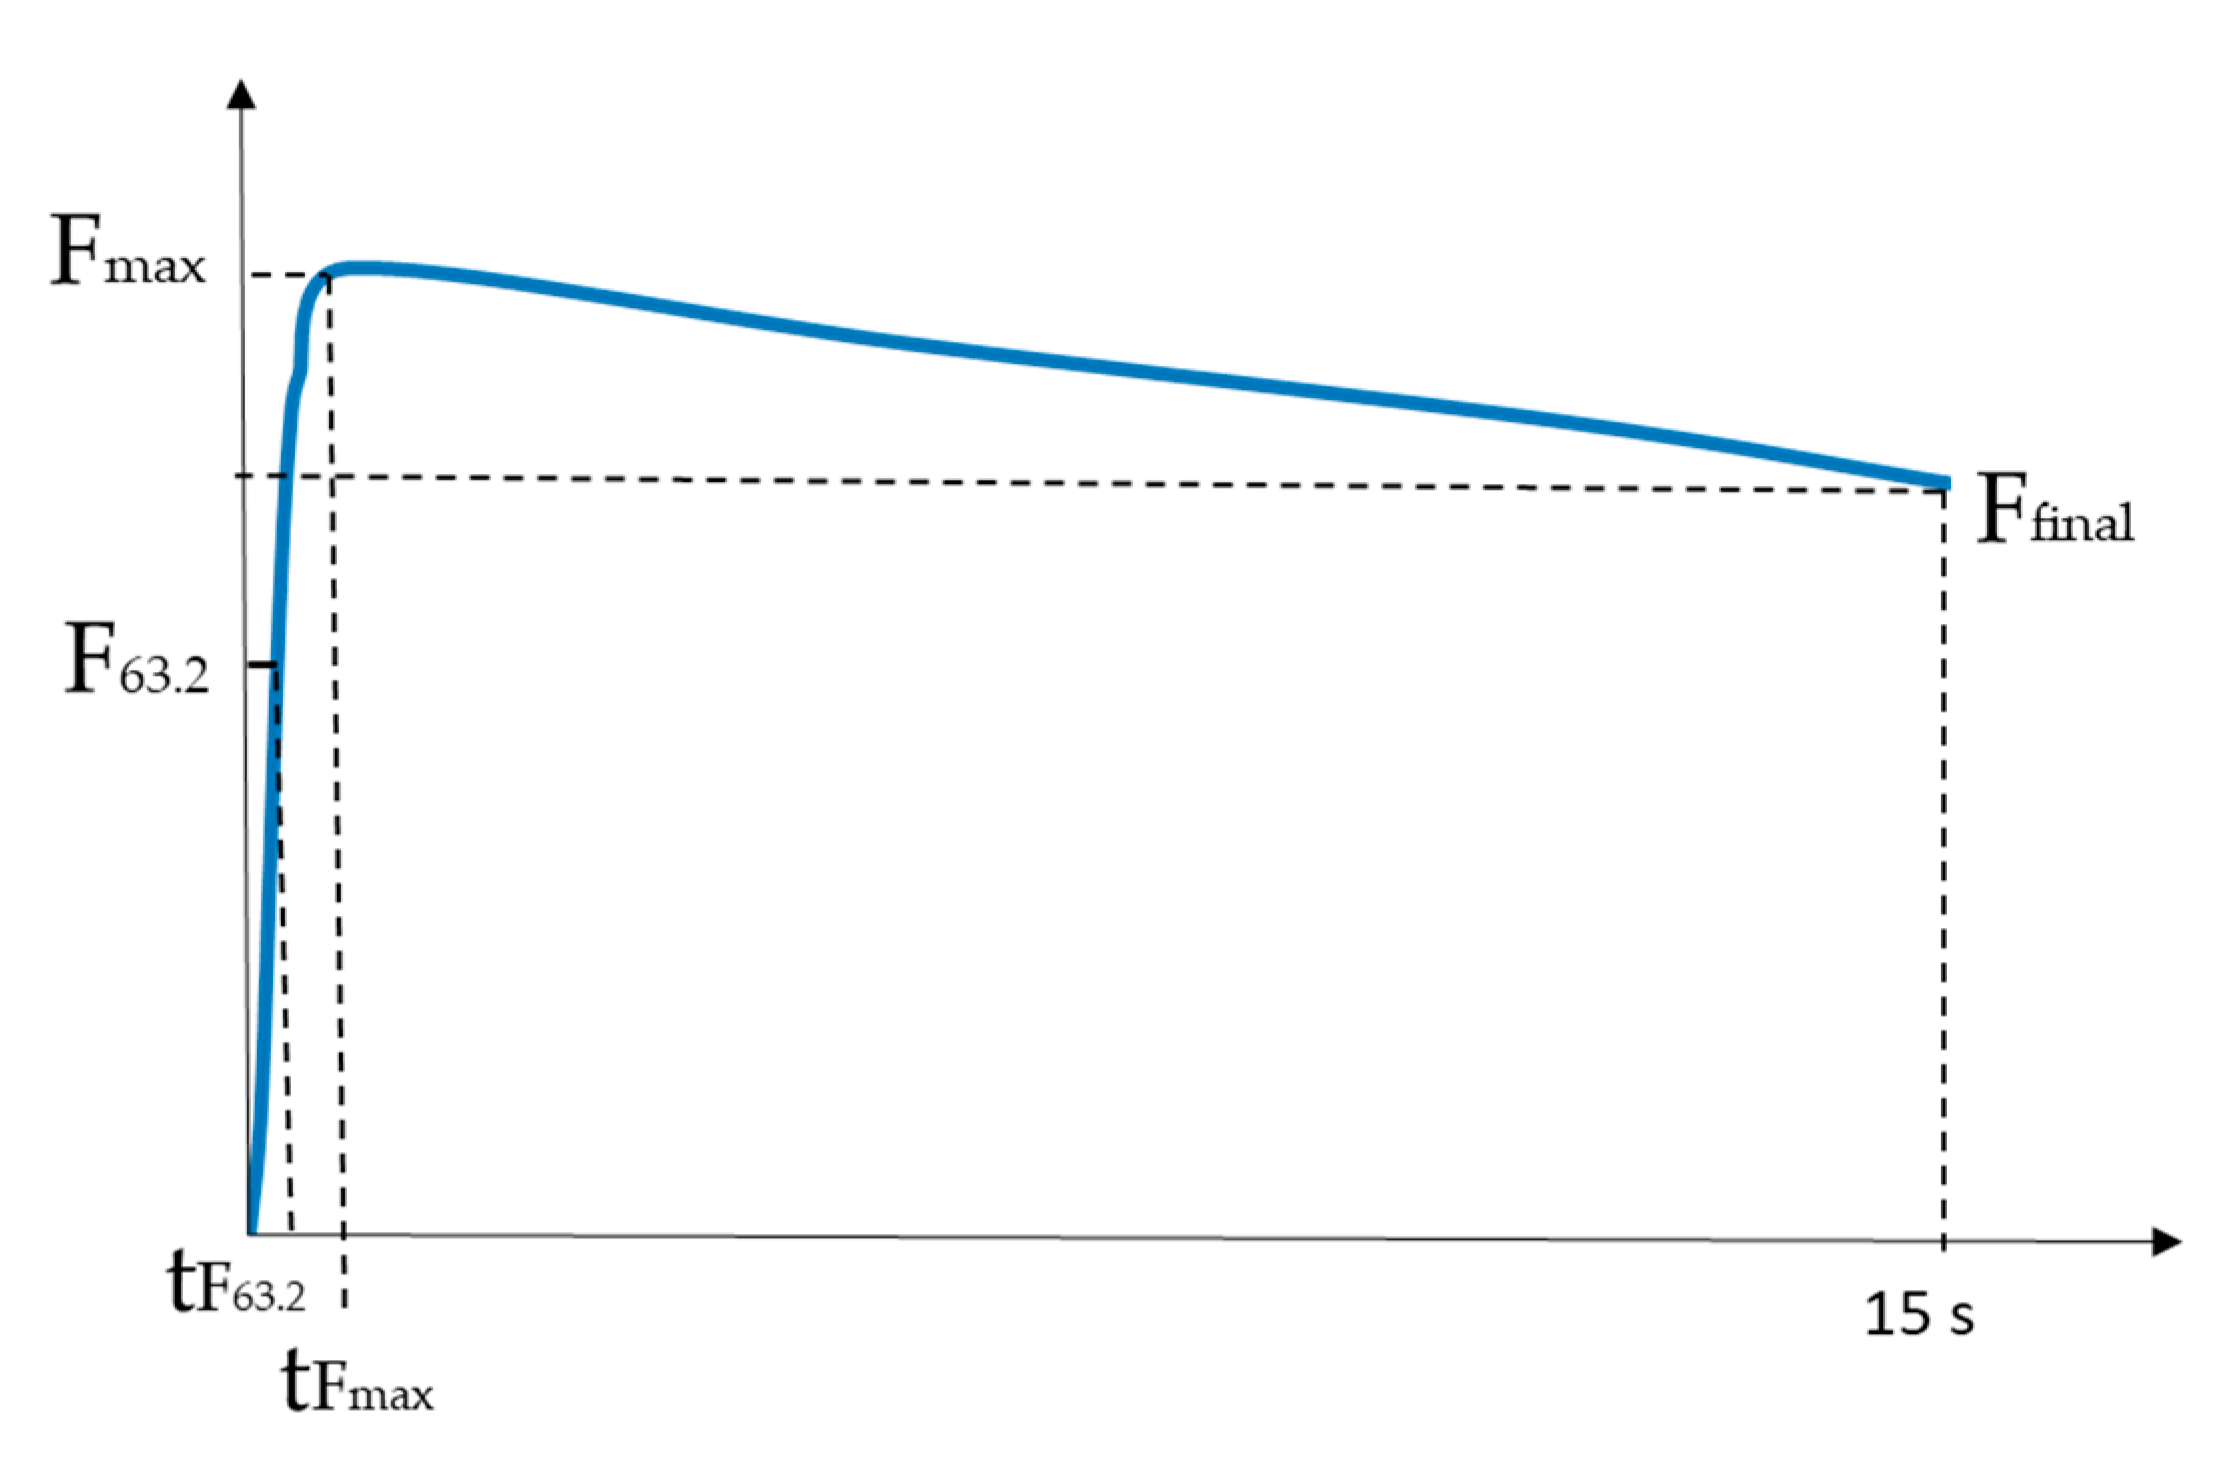
- The maximum force attained in the 15 s test—Fmax.
- (2)
- The time it takes to reach the maximum force—tFmax.
- (3)
- Handgrip strength at 63.2% of its maximum value—F63.2. This choice stems from the fact that the force profile follows a typical response of a first order system.
- (4)
- The time it takes to reach F63.2—tF63.2
- (5)
- HGS at the end of the 15 s test—Ffinal.
- (6)
- The arithmetic average of the HGS points in the 15 s test—Fav.
- (a)
- pFav—average force during 15 s test expressed in percentage of Fmax.
- (b)
- pRate1 = (F63.2/tF63.2)/Fmax—rate of change of force up to tF63.2 expressed in percentage of Fmax.
- (c)
- pRate2 = (Fmax − F63.2)/(Fmax * (tFmax − tF63.2))—the rate of change of force from tF63.2 to tFmax, expressed in percentage of Fmax.
- (d)
- pRate3 = (Ffinal − Fmax)/(Fmax * (15 − tFmax))—the rate of change of force from the time of maximum force until the end of the test, in percentage of Fmax.
- Friedman non-parametric statistical test to detect differences in descriptors’ means across the multiple time trials. This test revealed no statistical significant differences (for instance, the tests yields χ2(2) = 0.391, p = 0.822 for Fmax). Therefore, averaged values (of the three trials) were considered for each individual;
- Gender comparisons of the anthropometric data and of the descriptors;
- Spearman two tailed correlations calculated between:
- ○
- Anthropometric data;
- ○
- Anthropometric data and the descriptors;
- ○
- Referred descriptors of the HGS vs. time curve.
- Relevant relationships were further analyzed via linear regression.
3. Results
4. Discussion
Author Contributions
Funding
Acknowledgments
Conflicts of Interest
References
- Cruz-Jentoft, A.J.; Bahat, G.; Bauer, J.; Boirie, Y.; Bruyere, O.; Cederholm, T.; Cooper, C.; Landi, F.; Rolland, Y.; Sayer, A.A.; et al. Sarcopenia: Revised European consensus on definition and diagnosis. Age Ageing 2019, 48, 601. [Google Scholar] [CrossRef] [PubMed] [Green Version]
- Rantanen, T.; Volpato, S.; Ferrucci, L.; Heikkinen, E.; Fried, L.P.; Guralnik, J.M. Handgrip strength and cause-specific and total mortality in older disabled women: Exploring the mechanism. J. Am. Geriatr. Soc. 2003, 51, 636–641. [Google Scholar] [CrossRef] [PubMed]
- Bohannon, R.W. Grip Strength: An indispensable biomarker for older adults. Clin. Interv. Aging 2019, 14, 1681–1691. [Google Scholar] [CrossRef] [PubMed] [Green Version]
- Guerra, R.S.; Fonseca, I.; Pichel, F.; Restivo, M.T.; Amaral, T.F. Handgrip strength and associated factors in hospitalized patients. JPEN J. Parenter. Enter. Nutr. 2015, 39, 322–330. [Google Scholar] [CrossRef]
- Mendes, J.; Santos, A.; Borges, N.; Afonso, C.; Moreira, P.; Padrao, P.; Negrao, R.; Amaral, T.F. Vitamin D status and functional parameters: A cross-sectional study in an older population. PLoS ONE 2018, 13, e0201840. [Google Scholar] [CrossRef] [Green Version]
- McGrath, R.; Vincent, B.M.; Peterson, M.D.; Jurivich, D.A.; Dahl, L.J.; Hackney, K.J.; Clark, B.C. Weakness may have a causal association with early mortality in older Americans: A matched cohort analysis. J. Am. Med. Dir. Assoc. 2020, 21, 621–626. [Google Scholar] [CrossRef]
- Lopes, J.; Russell, D.M.; Whitwell, J.; Jeejeebhoy, K.N. Skeletal muscle function in malnutrition. Am. J. Clin. Nutr. 1982, 36, 602–610. [Google Scholar] [CrossRef]
- Bohannon, R.W. Parallel comparison of grip strength measures obtained with a MicroFET 4 and a Jamar dynamometer. Percept. Mot. Ski. 2005, 100, 795–798. [Google Scholar] [CrossRef]
- Aagaard, P.; Simonsen, E.B.; Andersen, J.L.; Magnusson, P.; Dyhre-Poulsen, P. Increased rate of force development and neural drive of human skeletal muscle following resistance training. J. Appl. Physiol. 2002, 93, 1318–1326. [Google Scholar] [CrossRef]
- Stock, R.; Thrane, G.; Askim, T.; Anke, A.; Mork, P.J. Development of grip strength during the first year after stroke. J. Rehabil. Med. 2019, 51, 248–256. [Google Scholar] [CrossRef] [Green Version]
- Hester, G.M.; Ha, P.L.; Dalton, B.E.; VanDusseldorp, T.A.; Olmos, A.A.; Stratton, M.T.; Bailly, A.R.; Vroman, T.M. Rate of force development as a predictor of mobility in older adults. J. Geriatr. Phys. 2020, 2001. [Google Scholar] [CrossRef]
- Watanabe, K.; Tsubota, S.; Chin, G.; Aoki, M. Differences in parameters of the explosive grip force test between young and older women. J. Gerontol. A Biol. 2011, 66, 554–558. [Google Scholar] [CrossRef] [PubMed] [Green Version]
- Haff, G.G.; Carlock, J.M.; Hartman, M.J.; Kilgore, J.L.; Kawamori, N.; Jackson, J.R.; Morris, R.T.; Sands, W.A.; Stone, M.H. Force-time curve characteristics of dynamic and isometric muscle actions of elite women olympic weightlifters. J. Strength Cond. Res. 2005, 19, 741–748. [Google Scholar] [CrossRef] [Green Version]
- Nakada, M.; Demura, S. The characteristics of laterality of explosive force exertion of hand grip and toe grip. Adv. Phys. Educ. 2014, 4, 6. [Google Scholar] [CrossRef] [Green Version]
- Demura, S.; Yamaji, S.; Nagasawa, Y.; Minami, M.; Kita, I. Examination of force-production properties during static explosive grip based on force-time curve parameters. Percept. Mot. Ski. 2000, 91, 1209–1220. [Google Scholar] [CrossRef] [PubMed]
- Ikemoto, Y.; Demura, S.; Yamaji, S.; Minami, M.; Nakada, M.; Uchyiama, M. Force-time parameters during explosive isometric grip correlate with muscle power. Sport Sci. Health 2007, 2, 64–70. [Google Scholar] [CrossRef] [Green Version]
- Yamaji, S.; Demura, S.; Nagasawa, Y.; Nakada, M.; Kitabayashi, T. The effect of measurement time when evaluating static muscle endurance during sustained static maximal gripping. J. Physiol. Anthr. Appl. Hum. Sci. 2002, 21, 151–158. [Google Scholar] [CrossRef] [Green Version]
- Dias, J.J.; Singh, H.P.; Taub, N.; Thompson, J. Grip strength characteristics using force-time curves in rheumatoid hands. J. Hand Surg. Eur. Vol. 2013, 38, 170–177. [Google Scholar] [CrossRef]
- Borges, L.S.; Fernandes, M.H.; Schettino, L.; da Coqueiro, R.S.; Pereira, R. Handgrip explosive force is correlated with mobility in the elderly women. Acta Bioeng. Biomech. 2015, 17, 145–149. [Google Scholar]
- Househam, E.; McAuley, J.; Charles, T.; Lightfoot, T.; Swash, M. Analysis of force profile during a maximum voluntary isometric contraction task. Muscle Nerve 2004, 29, 401–408. [Google Scholar] [CrossRef]
- Leyk, D.; Gorges, W.; Ridder, D.; Wunderlich, M.; Rüther, T.; Sievert, A.; Essfeld, D. Hand-grip strength of young men, women and highly trained female athletes. Eur. J. Appl. Physiol. 2007, 99, 415–421. [Google Scholar] [CrossRef] [PubMed]
- Roberts, H.C.; Denison, H.J.; Martin, H.J.; Patel, H.P.; Syddall, H.; Cooper, C.; Sayer, A.A. A review of the measurement of grip strength in clinical and epidemiological studies: Towards a standardised approach. Age Ageing 2011, 40, 423–429. [Google Scholar] [CrossRef] [PubMed] [Green Version]
- Zaccagni, L.; Toselli, S.; Bramanti, B.; Gualdi-Russo, E.; Mongillo, J.; Rinaldo, N. Handgrip strength in young adults: Association with anthropometric variables and laterality. Int. J. Environ. Res. Public Health 2020, 17, 4273. [Google Scholar] [CrossRef] [PubMed]
- Stewart, A.; Marfell-Jones, M.; Olds, T.; Ridder, H. International Standards for Anthropometric Assessment, 2011th ed.; International Society for the Advancement of Kinanthropometry: Lower Hutt, New Zealand, 2011. [Google Scholar]
- Guerra, R.S.; Amaral, T.F.; Sousa, A.S.; Fonseca, I.; Pichel, F.; Restivo, M.T. Comparison of Jamar and bodygrip dynamometers for handgrip strength measurement. J. Strength Cond. Res. 2017, 31, 1931–1940. [Google Scholar] [CrossRef] [PubMed]
- Restivo, M.T.; Quintas, M.; da Silva, C.; Andrade, T.; Santos, B. Device for Measuring Strength and Energy, Application 15759.939. U.S. Patent 10856795, 8 December 2020. [Google Scholar]
- Vardasca, R.; Abreu, P.; Mendes, J.; Restivo, M.T. Handgrip Evaluation: Endurance and Handedness Dominance. In Smart Industry & Smart Education, REV 2018, Lecture Notes in Networks and Systems; Auer, M., Langmann, R., Eds.; Springer: Cham, Switzerland, 2019; Volume 47, pp. 507–516. [Google Scholar]


| Gender | Significance | ||
|---|---|---|---|
| Female N = 73 (76.7%) | Male N = 21 (22.3%) | p | |
| Median Age (Min − Max) | 20 (19–37) | 22 (19–38) | 0.009 |
| Weight (kg) Mean ± SD | 61.1 ± 11.8 | 72.5 ± 11.8 | <0.001 |
| Height (m) Mean ± SD | 1.64 ± 0.07 | 1.74 ± 0.10 | <0.0001 |
| LengthDH (cm) Mean ± SD | 17.9 ± 0.07 | 19.3 ± 1.7 | <0.0001 |
| Descriptor (Unit) Mean ± SD | Gender | Significance | |
|---|---|---|---|
| Female N = 73 (76.7%) | Male N = 21 (22.3%) | p | |
| Fmax [N] | 201 ± 61 | 368 ± 120 | <0.001 |
| tFmax [s] | 1.89 ± 0.84 | 1.96 ± 1.08 | 0.765 |
| F63.2 [N] | 125 ± 38 | 227 ± 75 | <0.001 |
| tF63.2 [s] | 0.67 ± 0.40 | 0.75 ± 0.42 | 0.452 |
| Ffinal [N] | 139 ± 51 | 255 ± 97 | <0.001 |
| Fav [N] | 154 ± 52 | 287 ± 101 | <0.001 |
| pFav | 77 ± 6.7 | 77 ± 6.9 | 0.582 |
| pRate1 [1/s] | 60 ± 7 | 63 ± 14 | 0.789 |
| pRate2 [1/s] | 42 ± 25 | 51 ± 42 | 0.207 |
| pRate3 [1/s] | −2.42 ± 0.72 | −2.36 ± 0.92 | 0.763 |
| Spearman Correlation Coefficients between Descriptors and Anthropometric Data | |||
|---|---|---|---|
| Descriptor | Weight | Height | LDH |
| Fmax | 0.531 ** | 0.462 ** | 0.537 ** |
| tFmax | −0.027 | 0.134 | 0.260 * |
| F63.2 | 0.523 ** | 0.462 ** | 0.546 ** |
| tF63.2 | 0.059 | 0.138 | 0.201 |
| Ffinal | 0.424 ** | 0.408** | 0.519** |
| Fav | 0.486 ** | 0.427 ** | 0.513 ** |
| pFav | −0.014 | −0.037 | 0.076 |
| pRate1 | −0.018 | −0.107 | −0.161 |
| pRate2 | 0.0148 | −0.110 | −0.206 * |
| pRate3 | −0.085 | −0.069 | 0.074 |
| Spearman Correlation Coefficients between Descriptors | ||||||||||
|---|---|---|---|---|---|---|---|---|---|---|
| Fmax | tFmax | F63.2 | tF63.2 | Ffinal | Fav | pFav | pRate1 | pRate2 | pRate3 | |
| Fmax | 1.000 | |||||||||
| tFmax | 0.191 | 1.000 | ||||||||
| F63.2 | 0.996 ** | 0.130 | 1.000 | |||||||
| tF63.2 | 0.109 | 0.518 ** | 0.130 | 1.000 | ||||||
| Ffinal | 0.922 ** | 0.312 * | 0.927 ** | 0.195 | 1.000 | |||||
| Fav | 0.975 ** | 0.248 * | 0.974 ** | 0.096 | 0.965 ** | 1.000 | ||||
| pFav | 0.316 * | 0.291 * | 0.330 ** | 0.018 | 0.566 ** | 0.032 | 1.000 | |||
| pRate1 | −0.07 | −0.513 ** | −0.078 | −0.962 ** | −0.156 | −0.055 | 0.032 | 1.000 | ||
| pRate2 | −0.181 | −0.915 ** | −0.200 | −0.236 * | −0.293 * | −0.256 * | 0.361 ** | 0.203 * | 1.000 | |
| pRate3 | 0.200 | 0.207 * | 0.216 * | 0.172 | −0.516 ** | 0.347 ** | 0.815 ** | −0.138 | −0.188 | 1.000 |
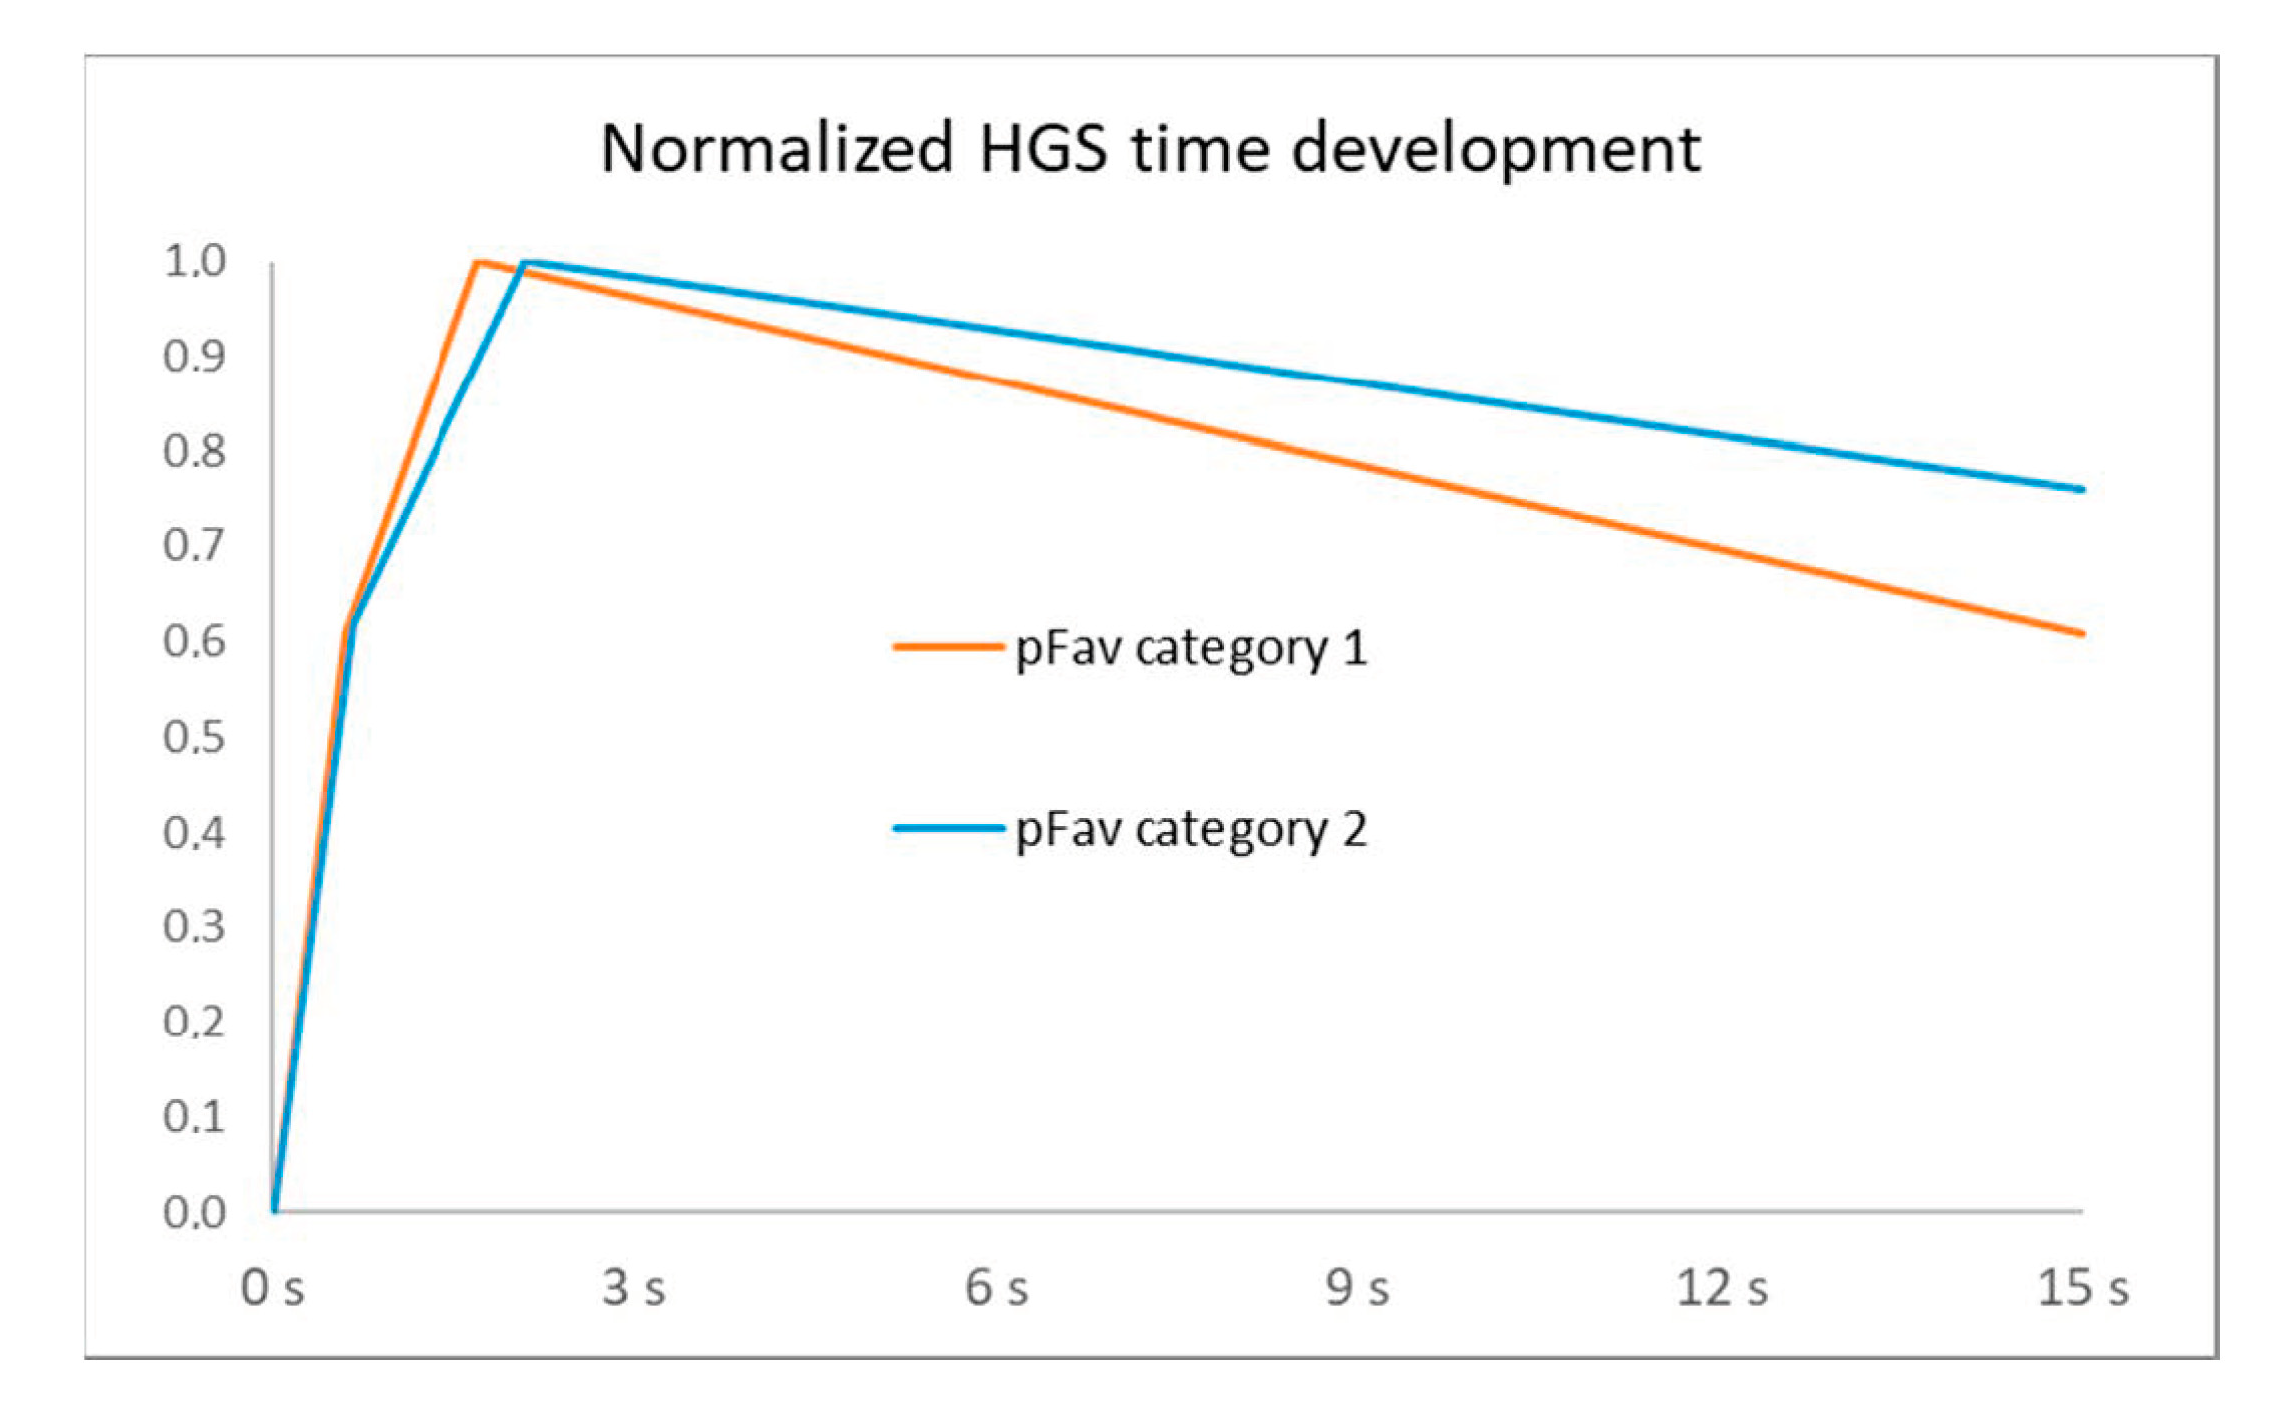
| Descriptor (Unit) Mean ± SD | Cat 1 (N = 47) | Cat 2 (N = 47) | p |
|---|---|---|---|
| pFav | 70.8 ± 4.2 | 82.1 ± 3.7 | <0.001 |
| pRate2 (1/s) | 51.7 ± 33.7 | 38.5 ± 23.6 | 0.003 |
| pRate3 (1/s) | −2.93 ± 0.49 | −1.88 ± 0.61 | <0.001 |
Publisher’s Note: MDPI stays neutral with regard to jurisdictional claims in published maps and institutional affiliations. |
© 2020 by the authors. Licensee MDPI, Basel, Switzerland. This article is an open access article distributed under the terms and conditions of the Creative Commons Attribution (CC BY) license (http://creativecommons.org/licenses/by/4.0/).
Share and Cite
Urbano, D.; Restivo, M.T.; Amaral, T.F.; Abreu, P.; Chousal, M.d.F. An Attempt to Identify Meaningful Descriptors of Handgrip Strength Using a Novel Prototype: Preliminary Study. Information 2020, 11, 546. https://0-doi-org.brum.beds.ac.uk/10.3390/info11120546
Urbano D, Restivo MT, Amaral TF, Abreu P, Chousal MdF. An Attempt to Identify Meaningful Descriptors of Handgrip Strength Using a Novel Prototype: Preliminary Study. Information. 2020; 11(12):546. https://0-doi-org.brum.beds.ac.uk/10.3390/info11120546
Chicago/Turabian StyleUrbano, Diana, Maria Teresa Restivo, Teresa F. Amaral, Paulo Abreu, and Maria de Fátima Chousal. 2020. "An Attempt to Identify Meaningful Descriptors of Handgrip Strength Using a Novel Prototype: Preliminary Study" Information 11, no. 12: 546. https://0-doi-org.brum.beds.ac.uk/10.3390/info11120546