Vehicle Pedestrian Detection Method Based on Spatial Pyramid Pooling and Attention Mechanism


1
School of Computer, Nanjing University of Posts and Telecommunications, Nanjing 210023, China
2
Jiangsu Key Laboratory of Wireless Sensor Network High Technology Research, Nanjing 210003, China
*
Author to whom correspondence should be addressed.
†
Current address: Nanjing University of Posts and Telecommunications, 9 Wenyuan Road, Xianlin Street, Qixia District, Nanjing 210023, China.
‡
These authors contributed equally to this work.
Information 2020, 11(12), 583; https://0-doi-org.brum.beds.ac.uk/10.3390/info11120583
Submission received: 6 November 2020
/
Revised: 24 November 2020
/
Accepted: 3 December 2020
/
Published: 16 December 2020
Abstract
:Object detection for vehicles and pedestrians is extremely difficult to achieve in autopilot applications for the Internet of vehicles, and it is a task that requires the ability to locate and identify smaller targets even in complex environments. This paper proposes a single-stage object detection network (YOLOv3-promote) for the detection of vehicles and pedestrians in complex environments in cities, which improves on the traditional You Only Look Once version 3 (YOLOv3). First, spatial pyramid pooling is used to fuse local and global features in an image to better enrich the expression ability of the feature map and to more effectively detect targets with large size differences in the image; second, an attention mechanism is added to the feature map to weight each channel, thereby enhancing key features and removing redundant features, which allows for strengthening the ability of the feature network to discriminate between target objects and backgrounds; lastly, the anchor box derived from the K-means clustering algorithm is fitted to the final prediction box to complete the positioning and identification of target vehicles and pedestrians. The experimental results show that the proposed method achieved 91.4 mAP (mean average precision), 83.2 F1 score, and 43.7 frames per second (FPS) on the KITTI (Karlsruhe Institute of Technology and Toyota Technological Institute) dataset, and the detection performance was superior to the conventional YOLOv3 algorithm in terms of both accuracy and speed.
1. Introduction
Currently, the development of the Internet of vehicles in China is gaining increasing attention. The Internet of vehicles integrates the Internet of Things, intelligent transportation, and cloud computing. The most well-known and vigorously developed Internet of vehicles application is autonomous driving, involving a driver assistance system. The system uses cameras, lasers, and radars to collect information outside the car in real time and make judgments to remind the driver of abnormal conditions around. This allows the driver to promptly identify hidden dangers, thereby improving driving safety. The rapid detection of targets such as vehicles and pedestrians is an important task for driving assistance systems. In recent years, object detection methods based on deep learning have stood out among many detection algorithms, attracting the attention and use of professionals and scholars in the industry. Driver assistance systems not only require an extremely high accuracy of object detection but also cannot miss small targets that are difficult to detect in complex scenes.
The computational aspect of deep learning is roughly divided into target classification [1,2,3,4], object detection, semantic segmentation [5], and instance segmentation [6]. Object detection is improved on the basis of various basic networks of target classification to realize the recognition of objects in pictures or videos. Accordingly, object detection is the basis of subsequent semantic segmentation, and instance segmentation, finding target objects for both tasks. Therefore, the pros and cons of object detection algorithms are particularly important.
2. Theory of Related Methods
2.1. Current Background in the Field of Object Detection
Current object detection methods can be roughly divided into two categories. The first involves two-stage methods, which are region-based detection methods, including R-CNN(regions with convolution features) [7], SPP-Net(Spatial Pyramid Pooling Net) [8], fast R-CNN(fast regions with convolution features) [9] and Faster R-CNN (faster regions with convolution features) [10]. R-CNN can be regarded as the pioneering work of deep learning target detection. Its proposal improved upon previous traditional detection algorithms. R-CNN uses the selective search (SS) algorithm [11] to select a candidate frame (region proposal) and a neural network to extract the features of the image before finally sending the obtained features to the classifier and regressor. However, a drawback of R-CNN is that the size of the input picture must be fixed, and the repeated calculation of a candidate frame in the CNN increases the computational complexity and seriously affects the test speed [12]. SPP-Net abandons R-CNN’s repeated calculation of candidate regions. Instead, it proposes the spatial pyramid pooling structure, whereby the entire target image is passed to the CNN to obtain a feature map of the entire image; then, according to the principle of the receptive field, the feature map is directly mapped corresponding to the candidate frame to obtain the feature vector before finally using the SPP layer to perform a unified size transformation on the feature vector. Because SPP-Net has disadvantages such as the entire process being carried out in stages, the feature vector needing to be written to disk, and the CNN parameters being unable to be backpropagated during training, fast R-CNN proposes replacing the SPP layer with the region of interest (ROI) layer, thereby reducing the amount of calculation. The ROI layer integrates convolutional networks, fully connected layers, support vector machines (SVMs), and bounding box regression [13], no longer storing features to disk, and the ROI layer has the function of backpropagation, whereby CNN parameters can be updated while training SVMs and bounding box regression. However, fast R-CNN still uses the selective search method to select candidate frames, preventing it from achieving real-time performance as well as from truly implementing end-to-end training and testing. Therefore, Faster R-CNN was proposed, which combines feature extraction, candidate box selection, classification, and bounding box regression into one framework. The whole framework is divided into two modules, the region proposal network (RPN) and fast R-CNN. Compared with fast R-CNN, it has improved accuracy and speed, and it allows realizing end-to-end target detection; however, it is still far away from real-time target detection.
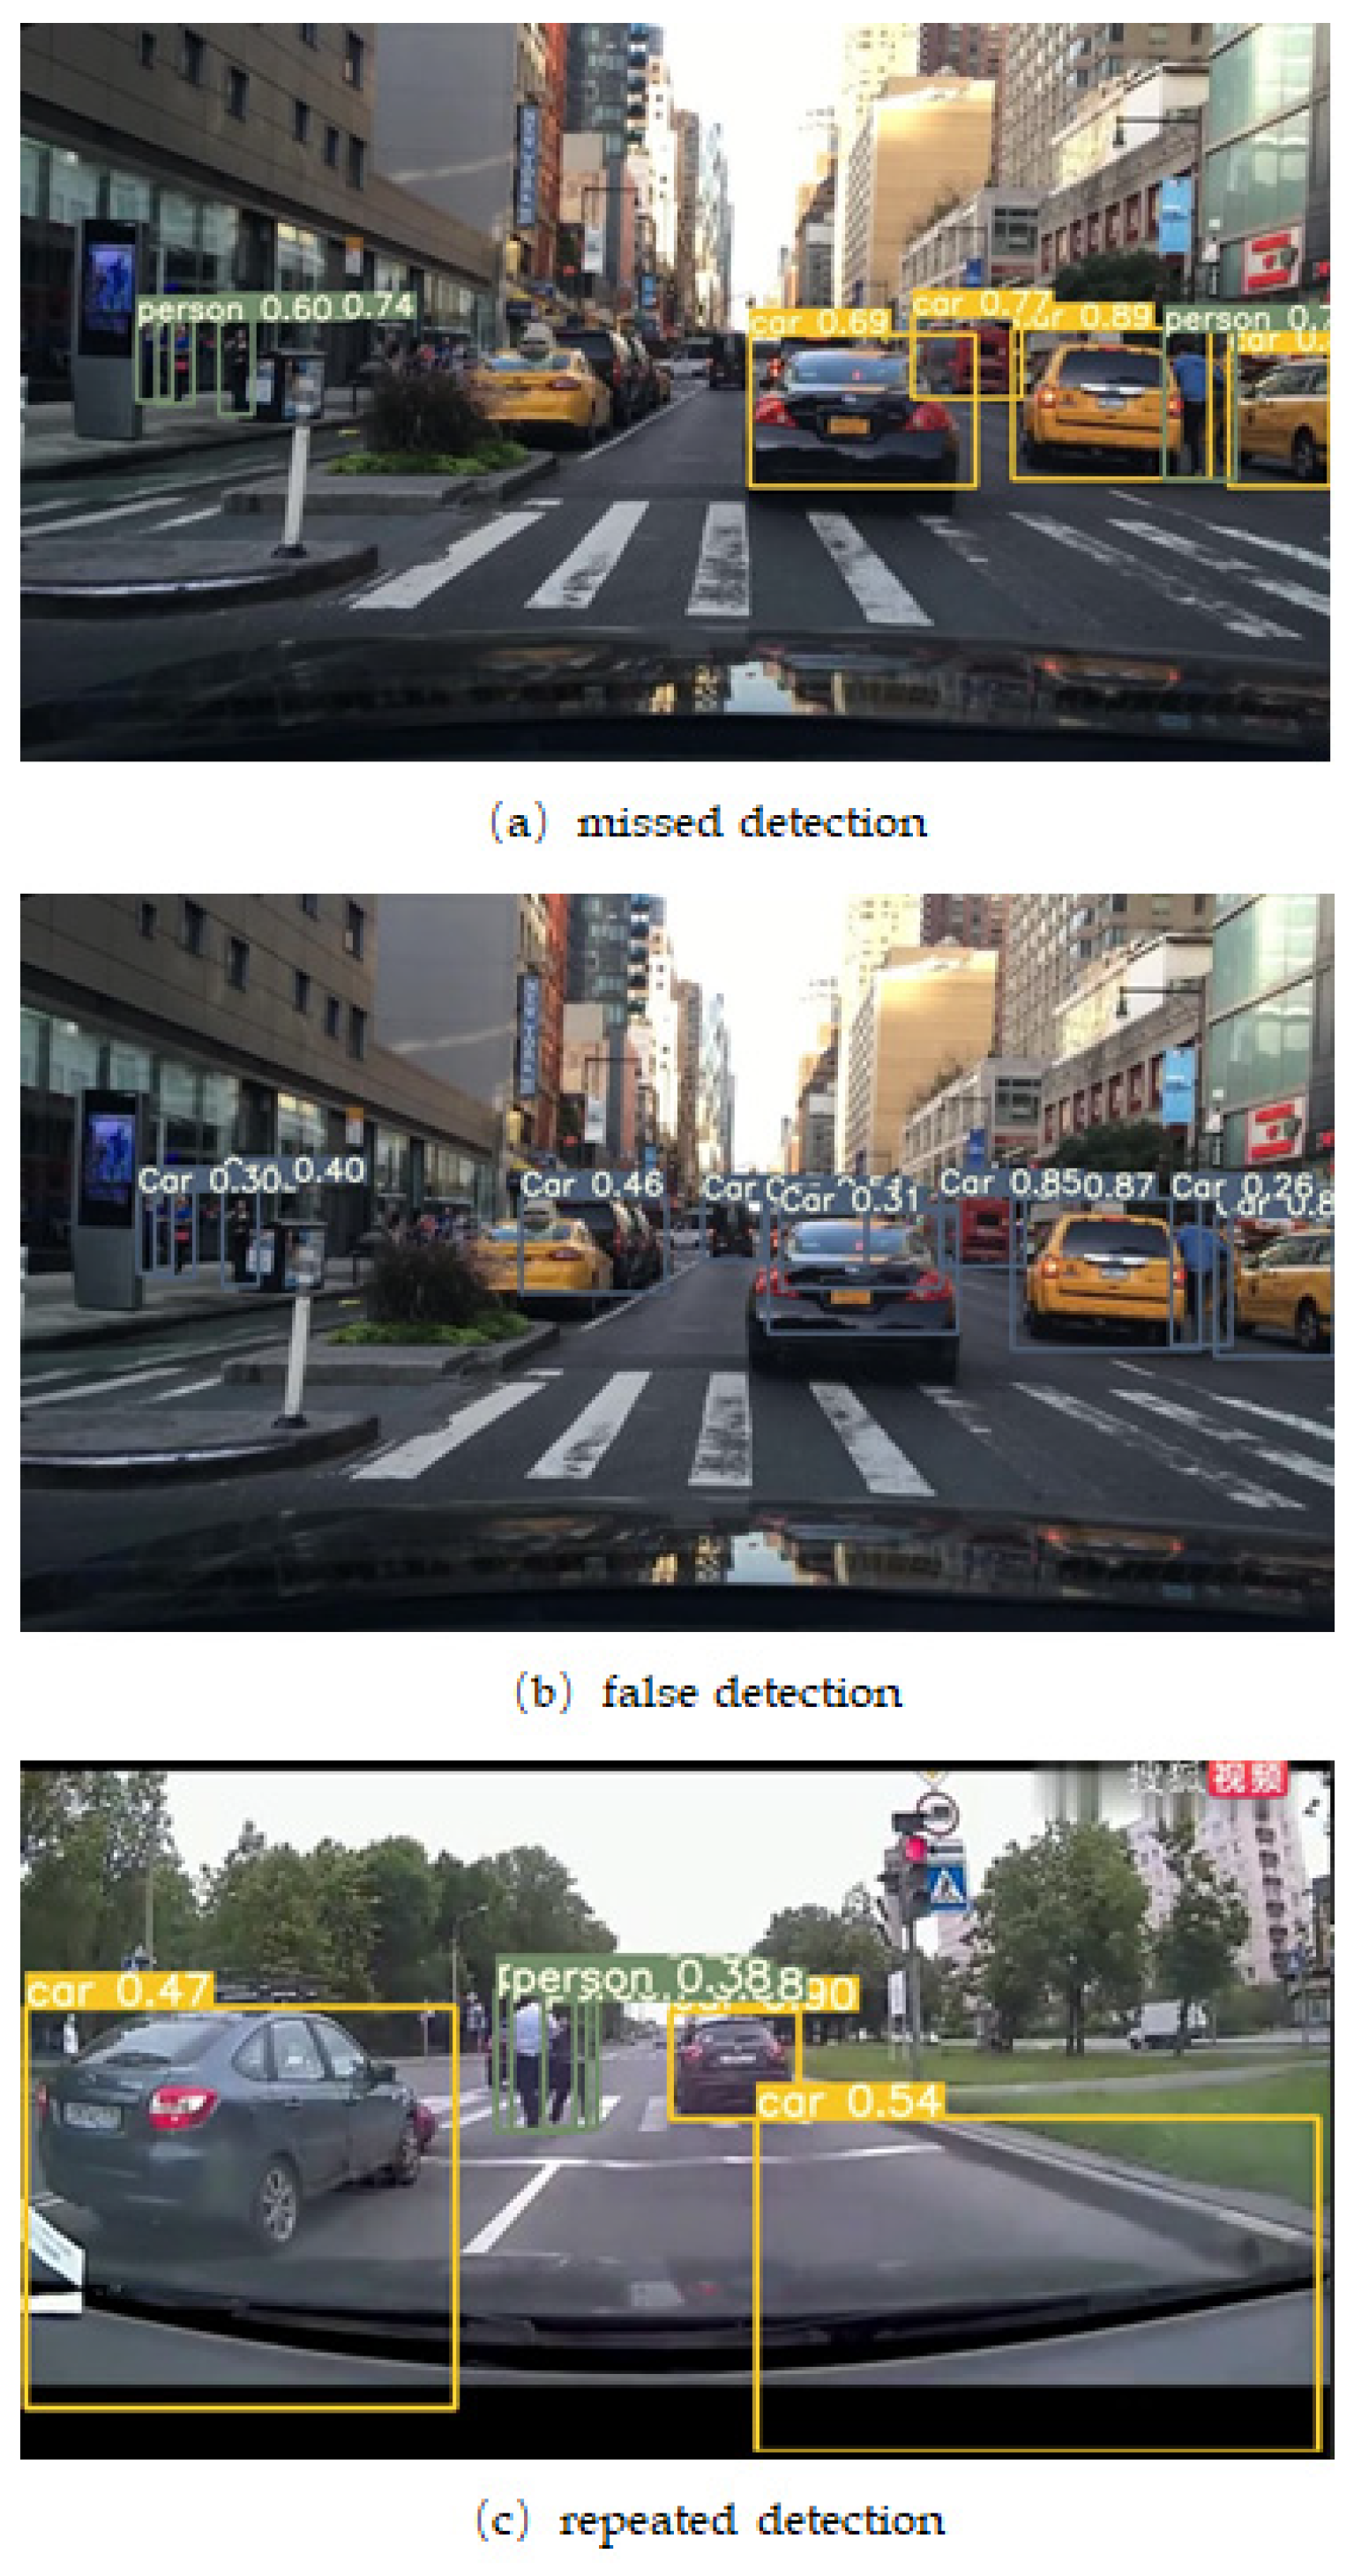
In order to solve the trade-off between real-time detection and accuracy, a one-stage method was proposed, i.e., object detection based on regression. This type of method directly obtains the object’s bounding box position and classification score (object score) through regression. Examples include single shot multibox detector (SSD) [14,15,16,17,18] methods and you only look once (YOLO) [19,20,21] methods. YOLO enabled solving the object detection as a regression problem for the first time, with a detection speed of 45 frames per second (FPS); however, compared with Faster R-CNN, there were serious positioning errors. YOLOv2 improved on the original YOLO by increasing the accuracy while maintaining the advantages of the original speed. YOLOv2 proposes a method for simultaneous training of target classification and detection, which achieves improvements in three aspects: accuracy, speed, and robustness. Furthermore, YOLOv3 was developed, presenting a deep residual network able to extract image features by referring to the residual network structure of ResNet, thereby obtaining the best detection speed and accuracy. Although YOLOv3 has the ability to detect small targets, it is not applicable for long-distance small targets in complex situations, where missed detection, false detection, and repeated detection can occur, as shown in Figure 1.
2.2. Spatial Pyramid Pooling
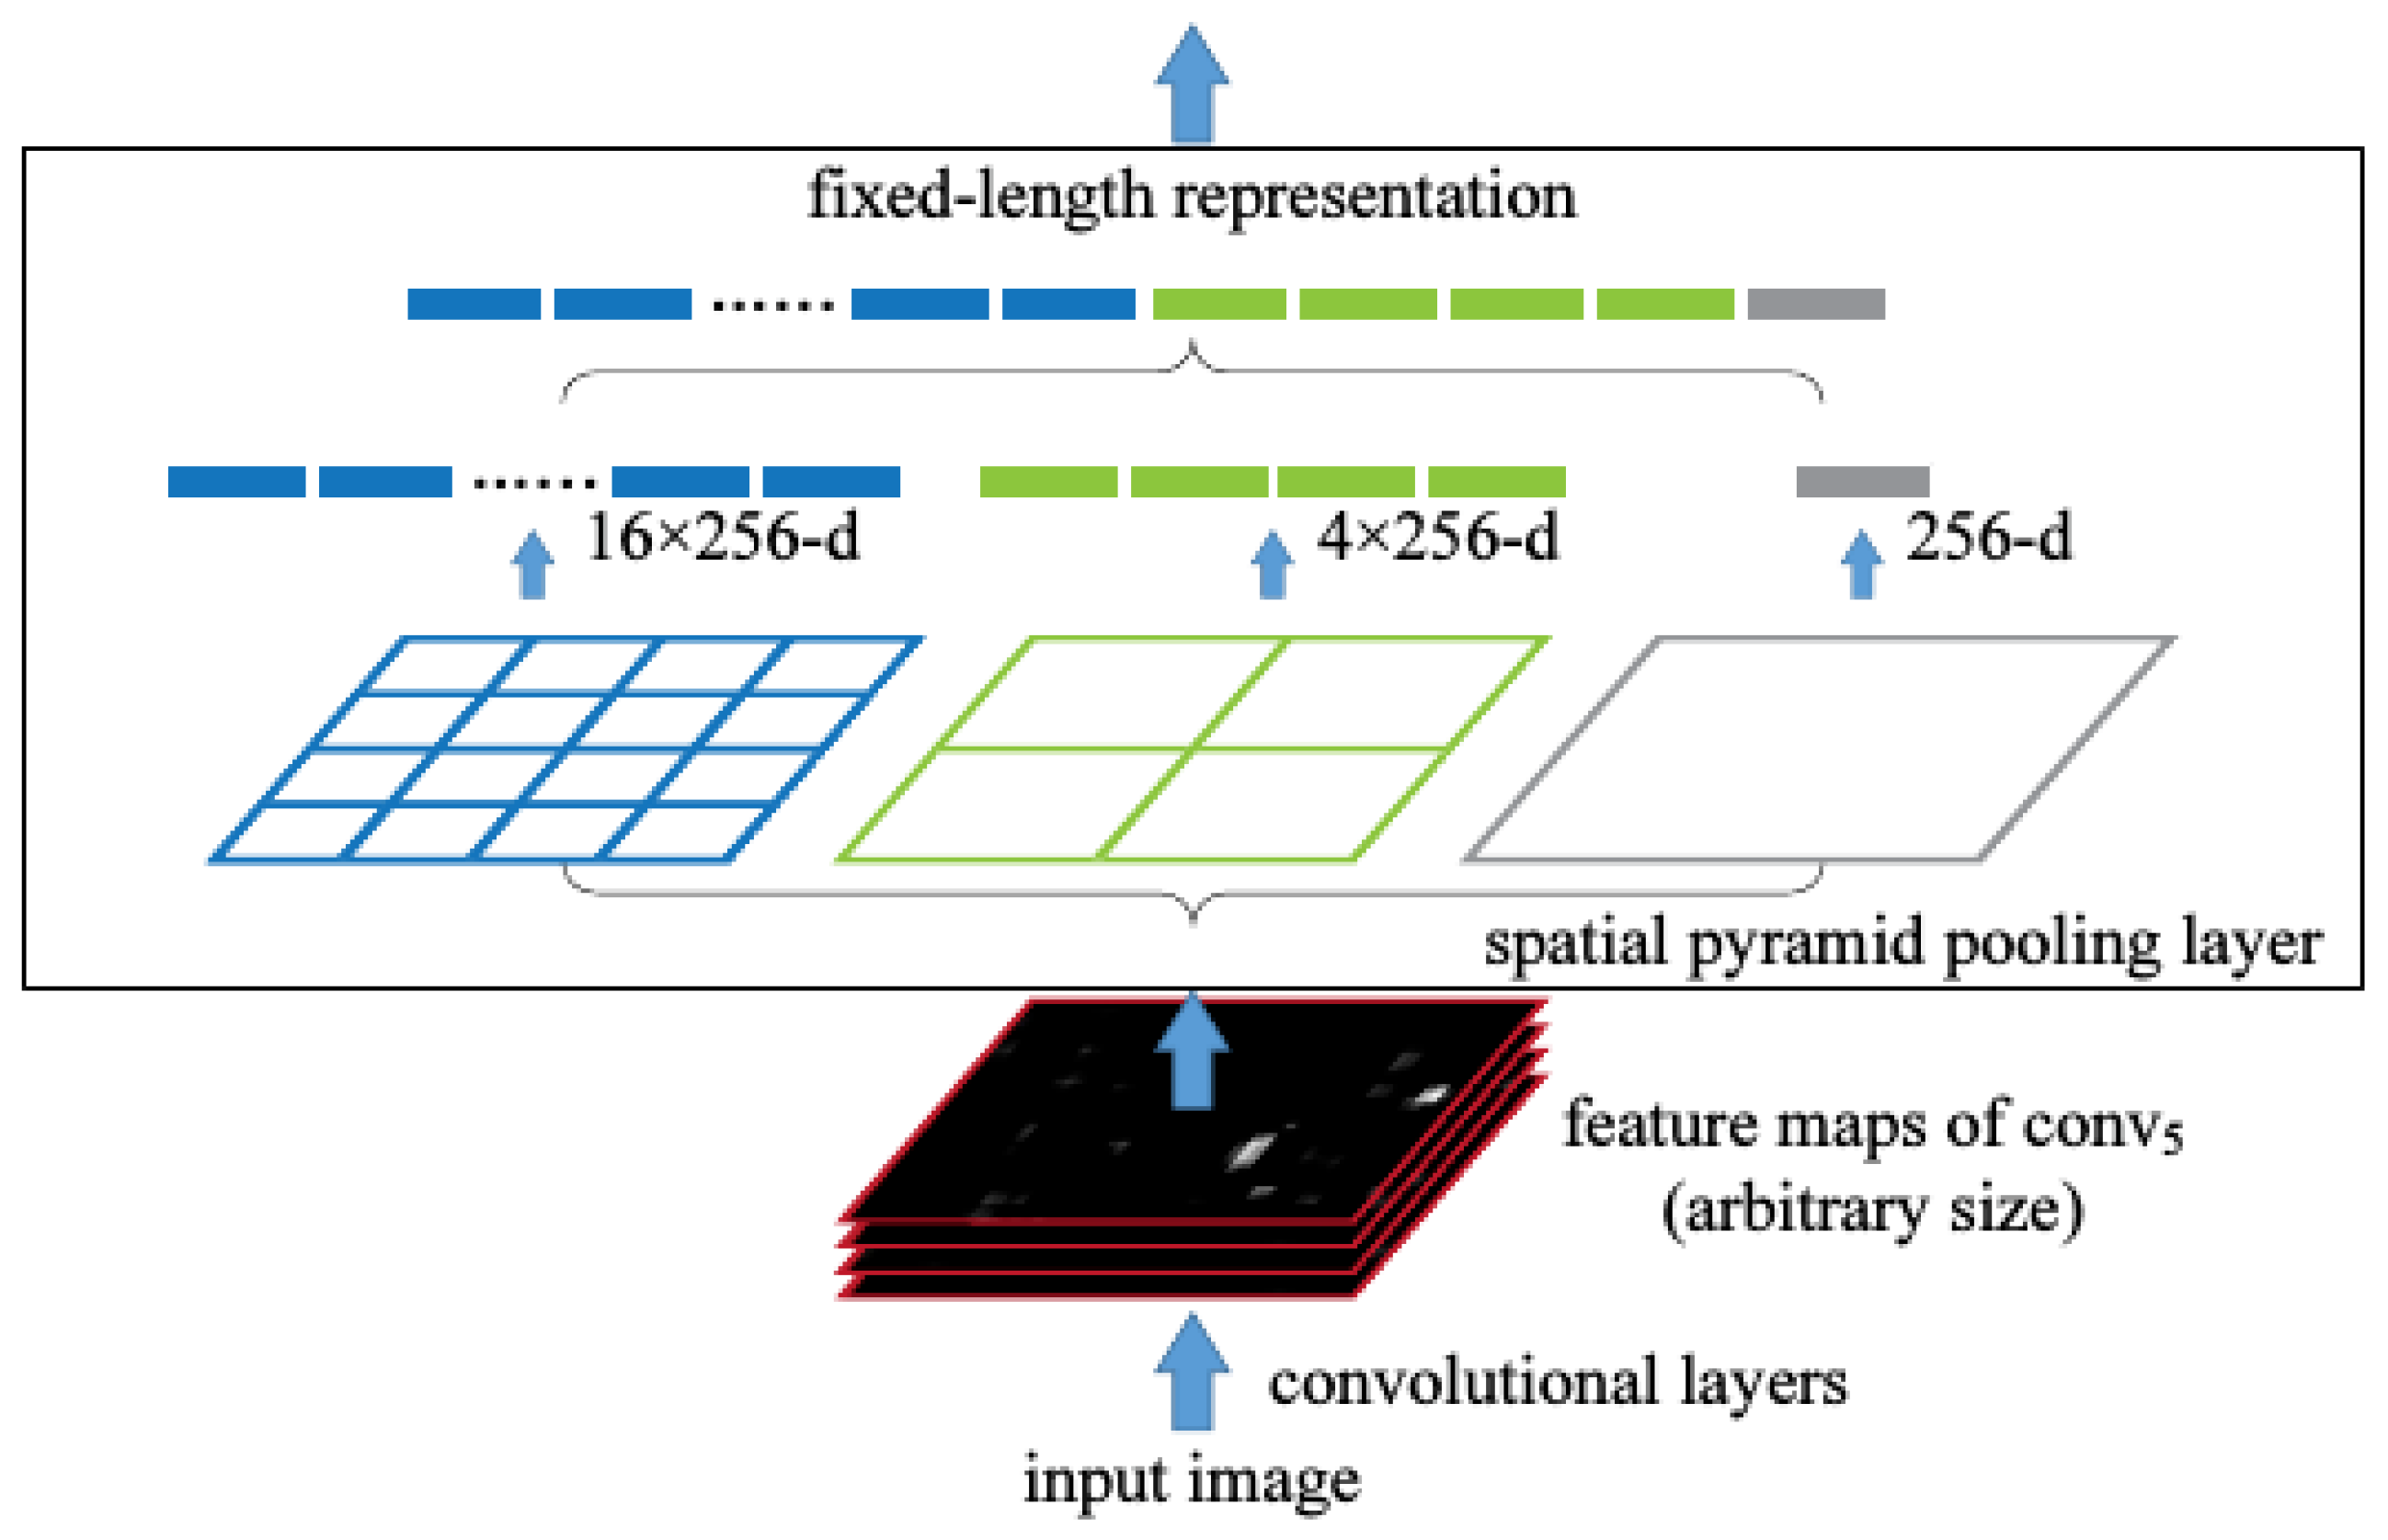
In this paper, Yolov3-promote refers to the idea of space pyramid pooling in SPP-Net. In reality, the image size is varied. The fully connected layer only accepts fixed-size feature maps, which will cause those large images to be cropped or stretched before being transmitted to the network. These operations will cause the original image to lose important target information or image distortion and other issues, thus reducing the accuracy of the model. Therefore, adding spatial pyramid pooling to SPP-Net will remedy the defect whereby the fully connected layer can only receive fixed-size feature maps. The principle is shown in Figure 2.
As shown in Figure 2, the input feature maps are obtained through multiple pooling windows (the blue, green, and gray windows in the above figure have 16 × 256-d, 4 × 256-d and 1 × 256-d feature maps, respectively). Then, merging them will provide a fixed-length output. This is the spatial pyramid pooling described above. It can remedy the defect whereby the fully connected layer can only receive fixed-size feature maps. Regardless of the size of the input, the SPP can always produce a fixed-size output.
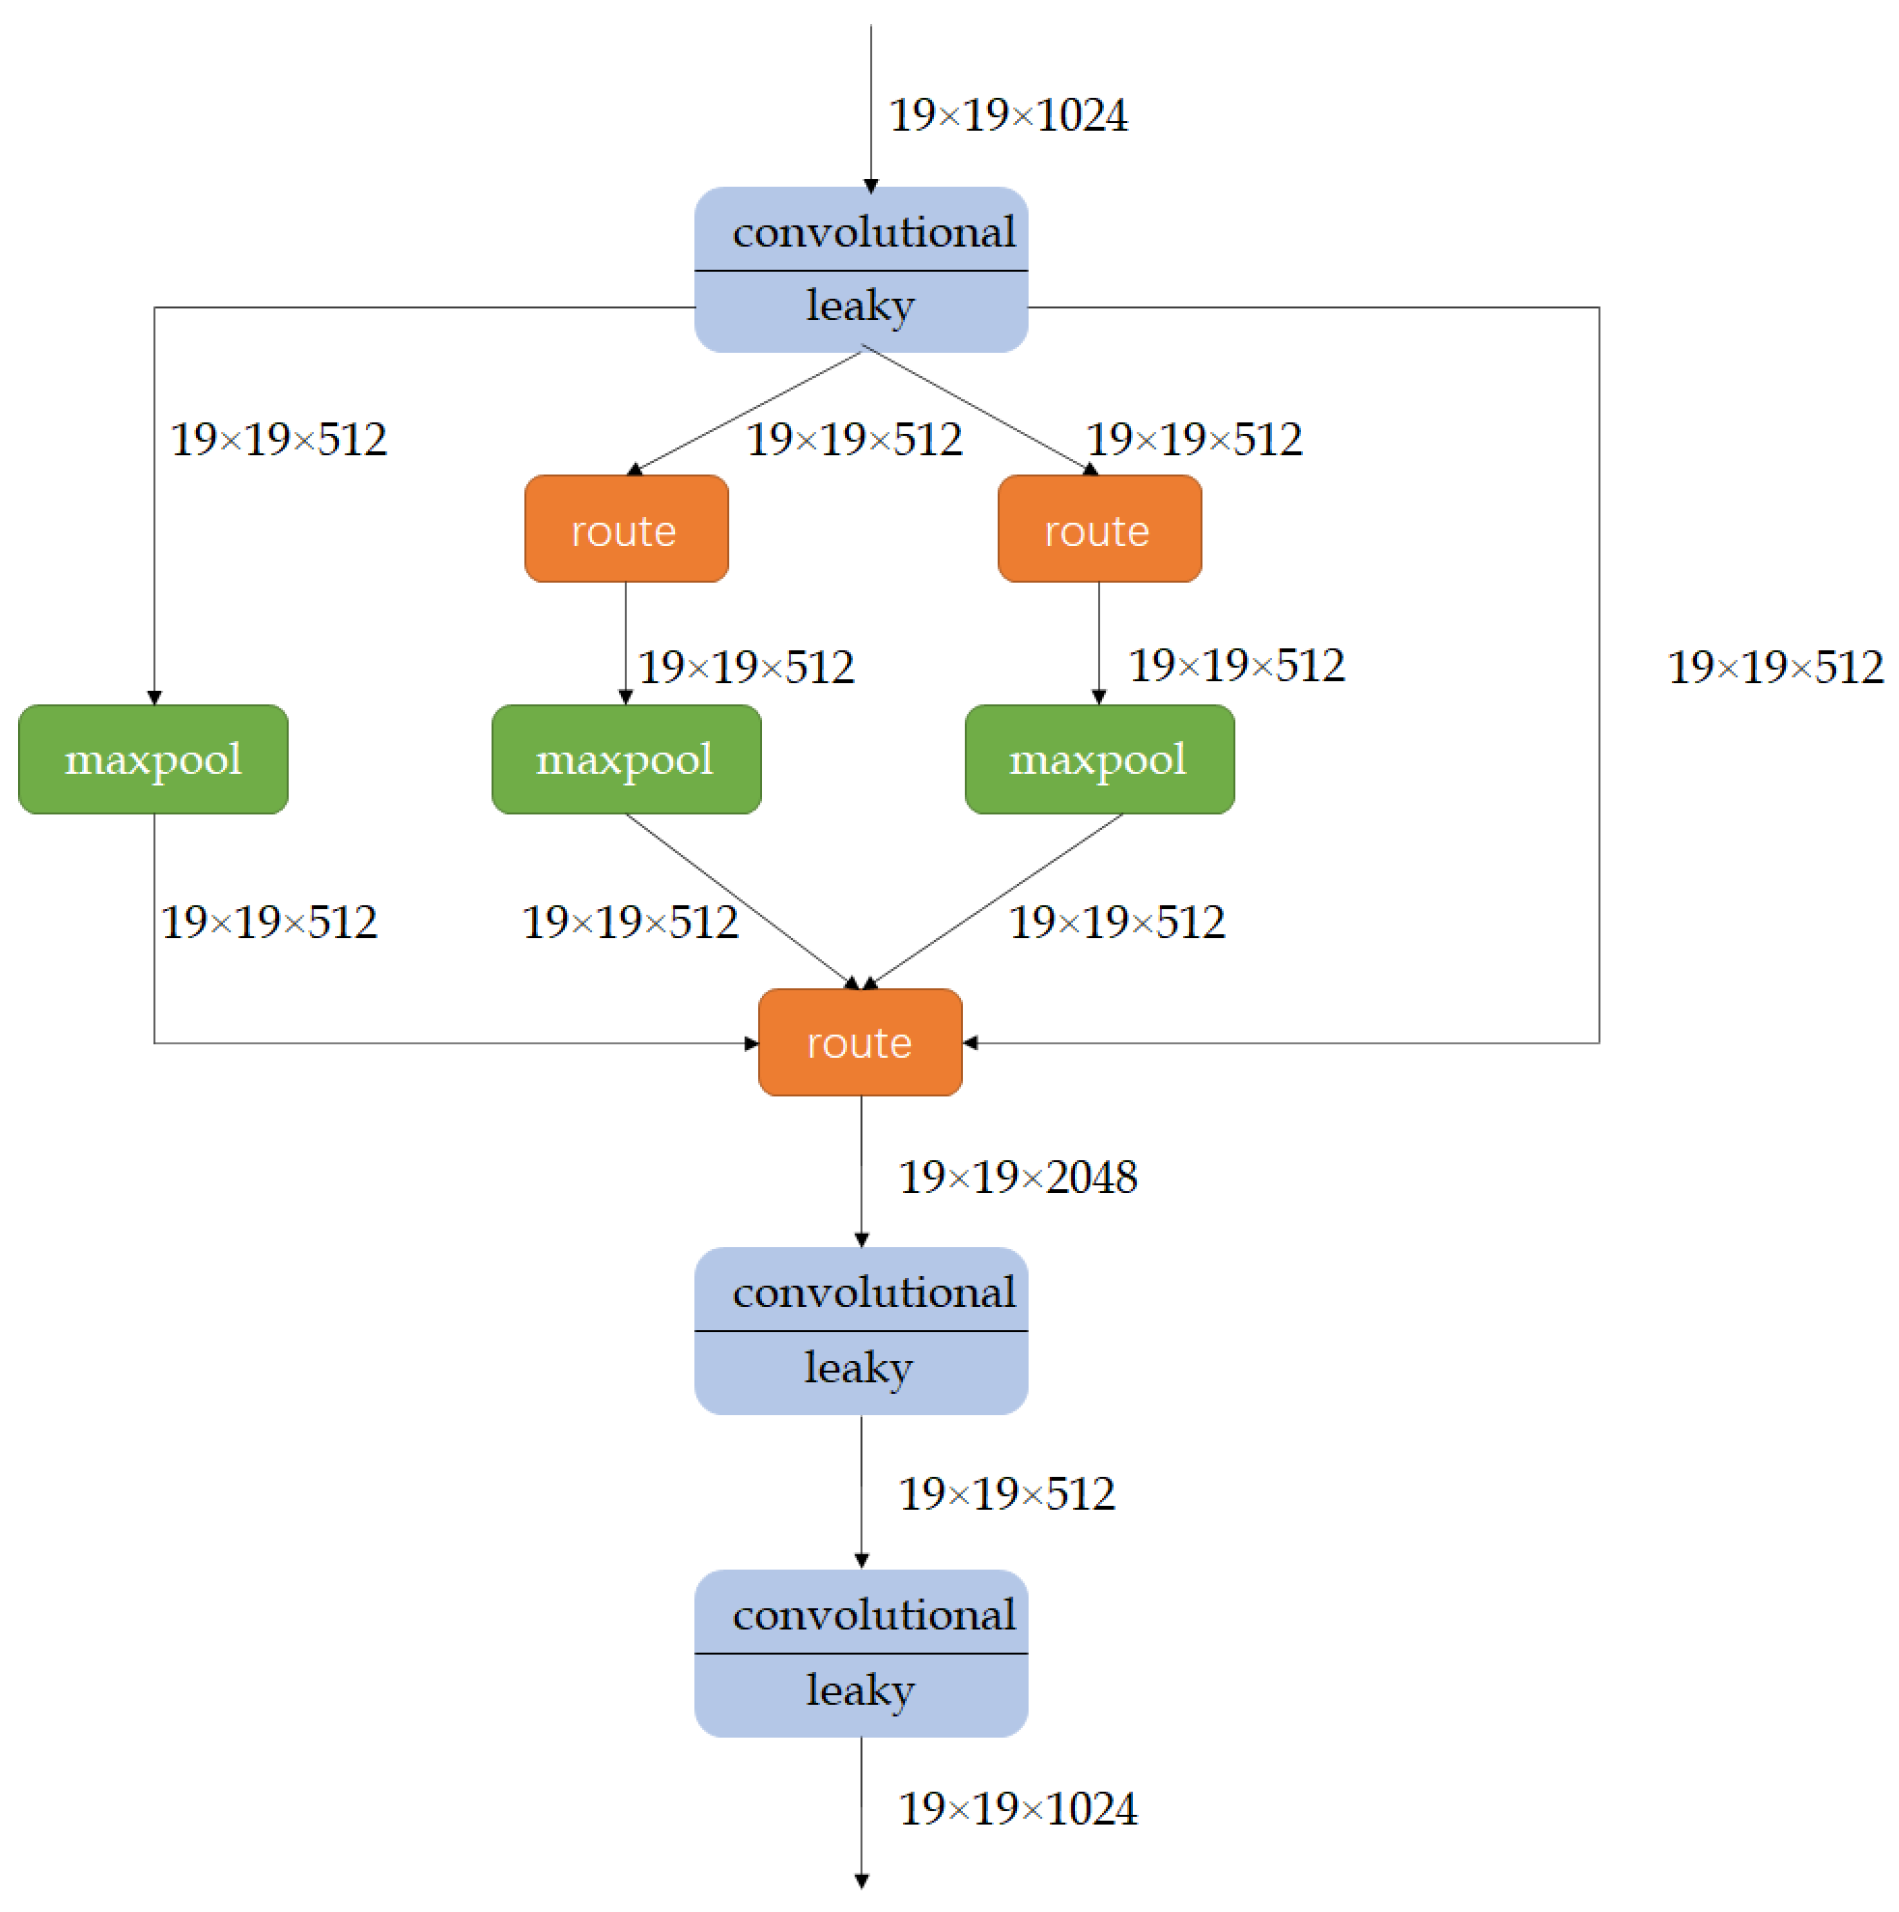
However, the SPP idea used in the YOLOv3-promote model proposed in this paper is not for the above purpose. In this paper, the pooling operations involved in spatial pyramid pooling are combined into one SPP Module, as shown in Figure 3.
First, the SPP Module receives the output from the previous layer of convolution, which is the 19 × 19 × 512 feature map in Figure 3. The SPP Module is divided into four parallel branches, which are the maximum pooling of convolution kernel sizes of 5 × 5, 9 × 9, and 13 × 13, and the rightmost shortcut branch. The route layer in Figure 3 is to locate the output of the previous convolutional layer and then pass the output to the second and third largest pooling layers. After the feature map passes through the three pools of the SPP Module, the three resulting feature maps are fused and finally passed to the YOLO detection layer. This paper draws on the idea of spatial pyramid pooling, mainly in order to obtain the global and local features of the feature map, using the largest pooling kernel in the SPP Module to be close to or equal to the size of the feature map that needs to be pooled; to better fit the global features of the feature map, use a smaller pooling kernel, such as 5 × 5, to fit the local features of the feature map, and then, through the final stitching, the fusion of the local and global features can be obtained, which can better enrich the feature map. The expressive ability can detect targets with large size differences in images more effectively and improve the detection accuracy of the network.
2.3. Attention Mechanism
In recent years, the attention mechanism [22] has been widely used in the fields of natural language processing and computer vision. The visual attention mechanism is obtained through the response of the human brain. Humans obtain important target information by quickly viewing images. This important target information is the so-called attention point [23]. The attention mechanism in computer vision is similar to the attention mechanism of the human brain [24,25,26], and in essence, it also selects the most important information currently needed from various target information. Attention mechanisms are now divided into two categories: one is soft attention, and the other is hard attention. The soft attention mechanism can focus on channel and region information and it is differentiable. As such, the attention weights of channels and regions can be assigned through back-propagation of the neural network so that the channels or regions corresponding to important targets in the image receive more weight. Strong attention is not differentiable, and it is generally used in reinforcement learning.
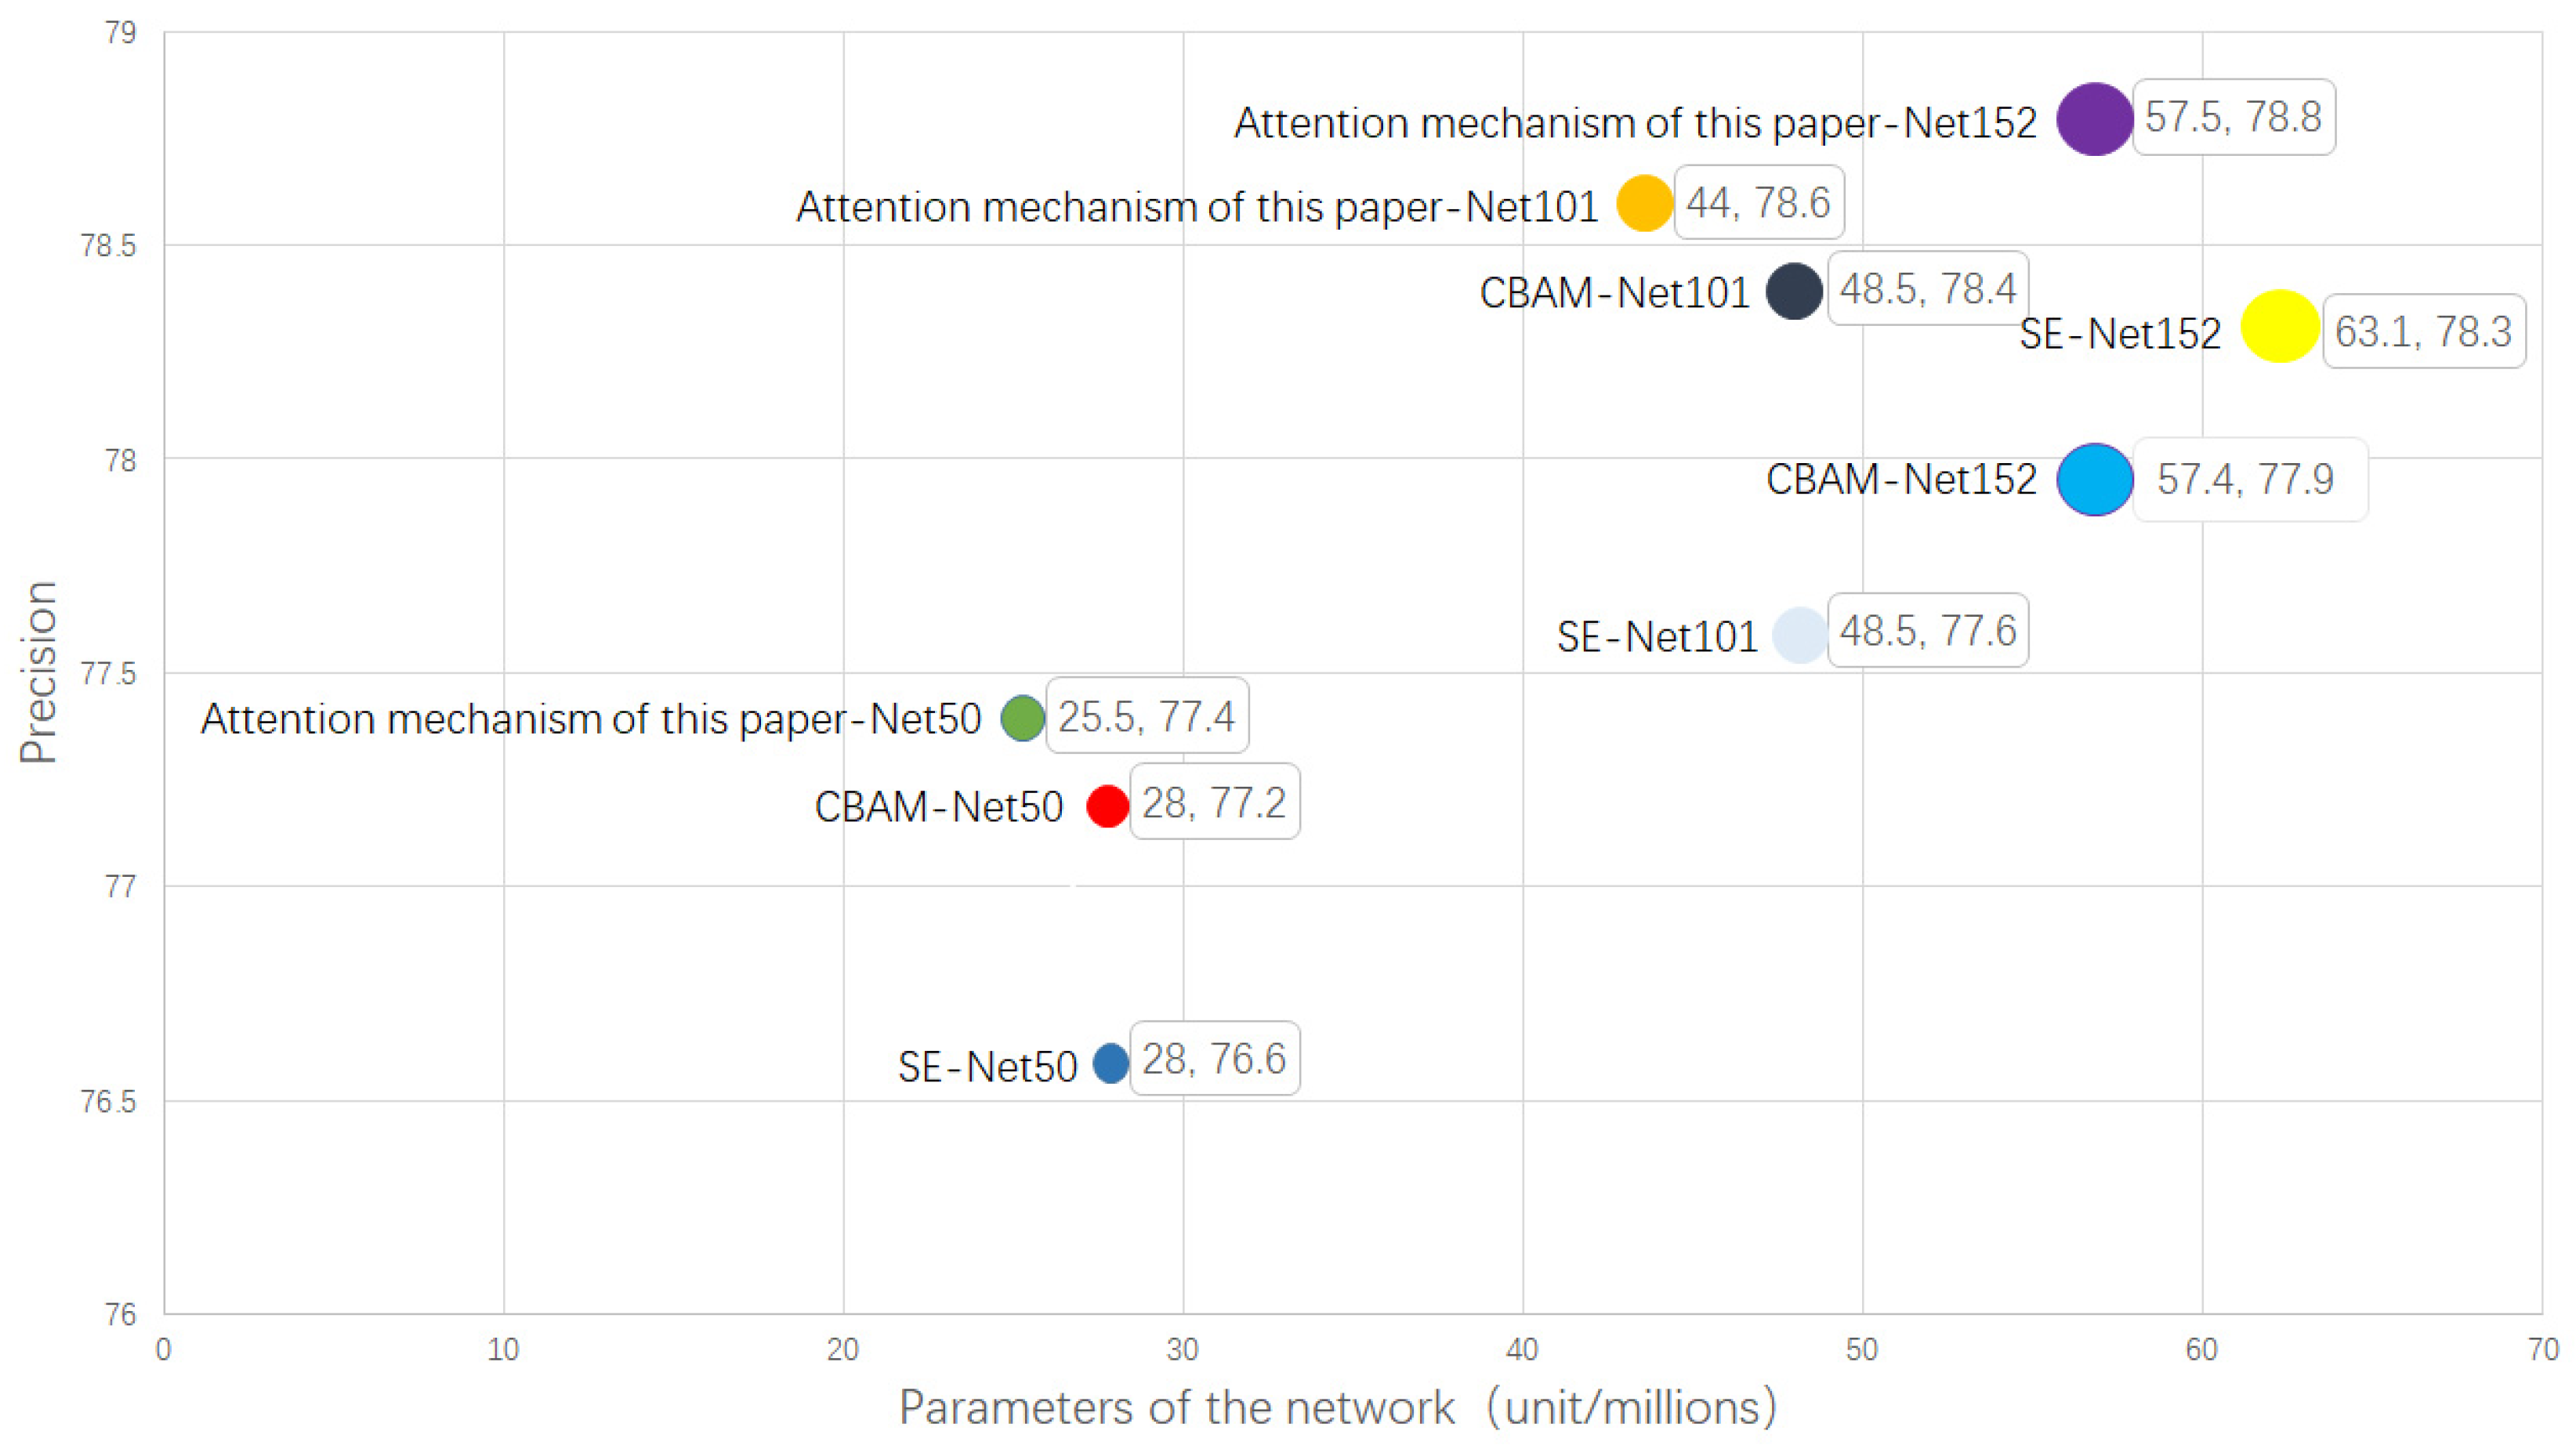
This paper proposes an efficient attention mechanism and then adds the SE Net attention mechanism [27], the convolutional block attention module (CBAM) attention mechanism [28], and the attention mechanism proposed in this paper to the backbone networks of ResNet50, ResNet101, and ResNet152. We then compared their advantages and disadvantages in terms of parameter quantity and accuracy. After many experiments, it was concluded that the attention mechanism proposed in this paper has the advantages of fewer parameters and higher accuracy, as shown in Figure 4.
Although the SE module uses two fully connected layers to weight the channels, the dimensionality reduction operation of the first full connection layer reduces the correlation between the channels. Therefore, the attention mechanism used in this paper abandons the dimension reduction and captures cross-channel interaction in an effective way, as shown in Figure 5.
The channel attention mechanism used in this paper uses global pooling to aggregate the spatial characteristics of the feature map. Unlike the SE module, the attention module in this paper generates channel weights quickly by using K one-dimensional convolutions, where K represents the coverage of local cross-channel interaction; that is, there are K neighbors participating in the attention prediction of a channel. In order to avoid manual tuning of K by cross-validation, the value of K is adjusted adaptively through channel dimension mapping. Since the purpose of the attention mechanism in this paper is to capture the local cross-channel interaction, the key is to determine the interaction coverage (i.e., the kernel size K of 1D convolution). Although the interaction coverage of convolution blocks with different channel numbers can be manually tuned, manual tuning of cross-validation requires a lot of computing resources. Group convolutions have been successfully used to improve the CNN architecture, where high-dimensional channels involve convolution of a given number of groups over a long distance. By analogy, the coverage ratio of the interaction (i.e., the kernel size k of 1D convolution) should be proportional to the channel dimension C; that is, there is a mapping between K and C:
C = φ(K)
The mapping is unknown. Generally, the simplest linear function can be expressed as C = y ∗ k + B. However, from the above analysis, K and C are in nonlinear proportion, and channel C is generally the exponential power of 2. Therefore, we introduced a possible solution to convert the linear function C = y ∗ k + B into the exponential form of nonlinear function:
C = φ(K) = 2(y+k+b)
Then, given the size of channel dimension C, the kernel size K can be solved by the following formula:
The odd in Formula (3) denotes the odd number nearest to each other. In this paper, y and b are taken as 2 and 1, respectively. Because y and b are determined, K is only related to c. The larger the value of c, the larger the value of K; that is, through mapping , the high-dimensional channel has a longer interaction range and vice versa.
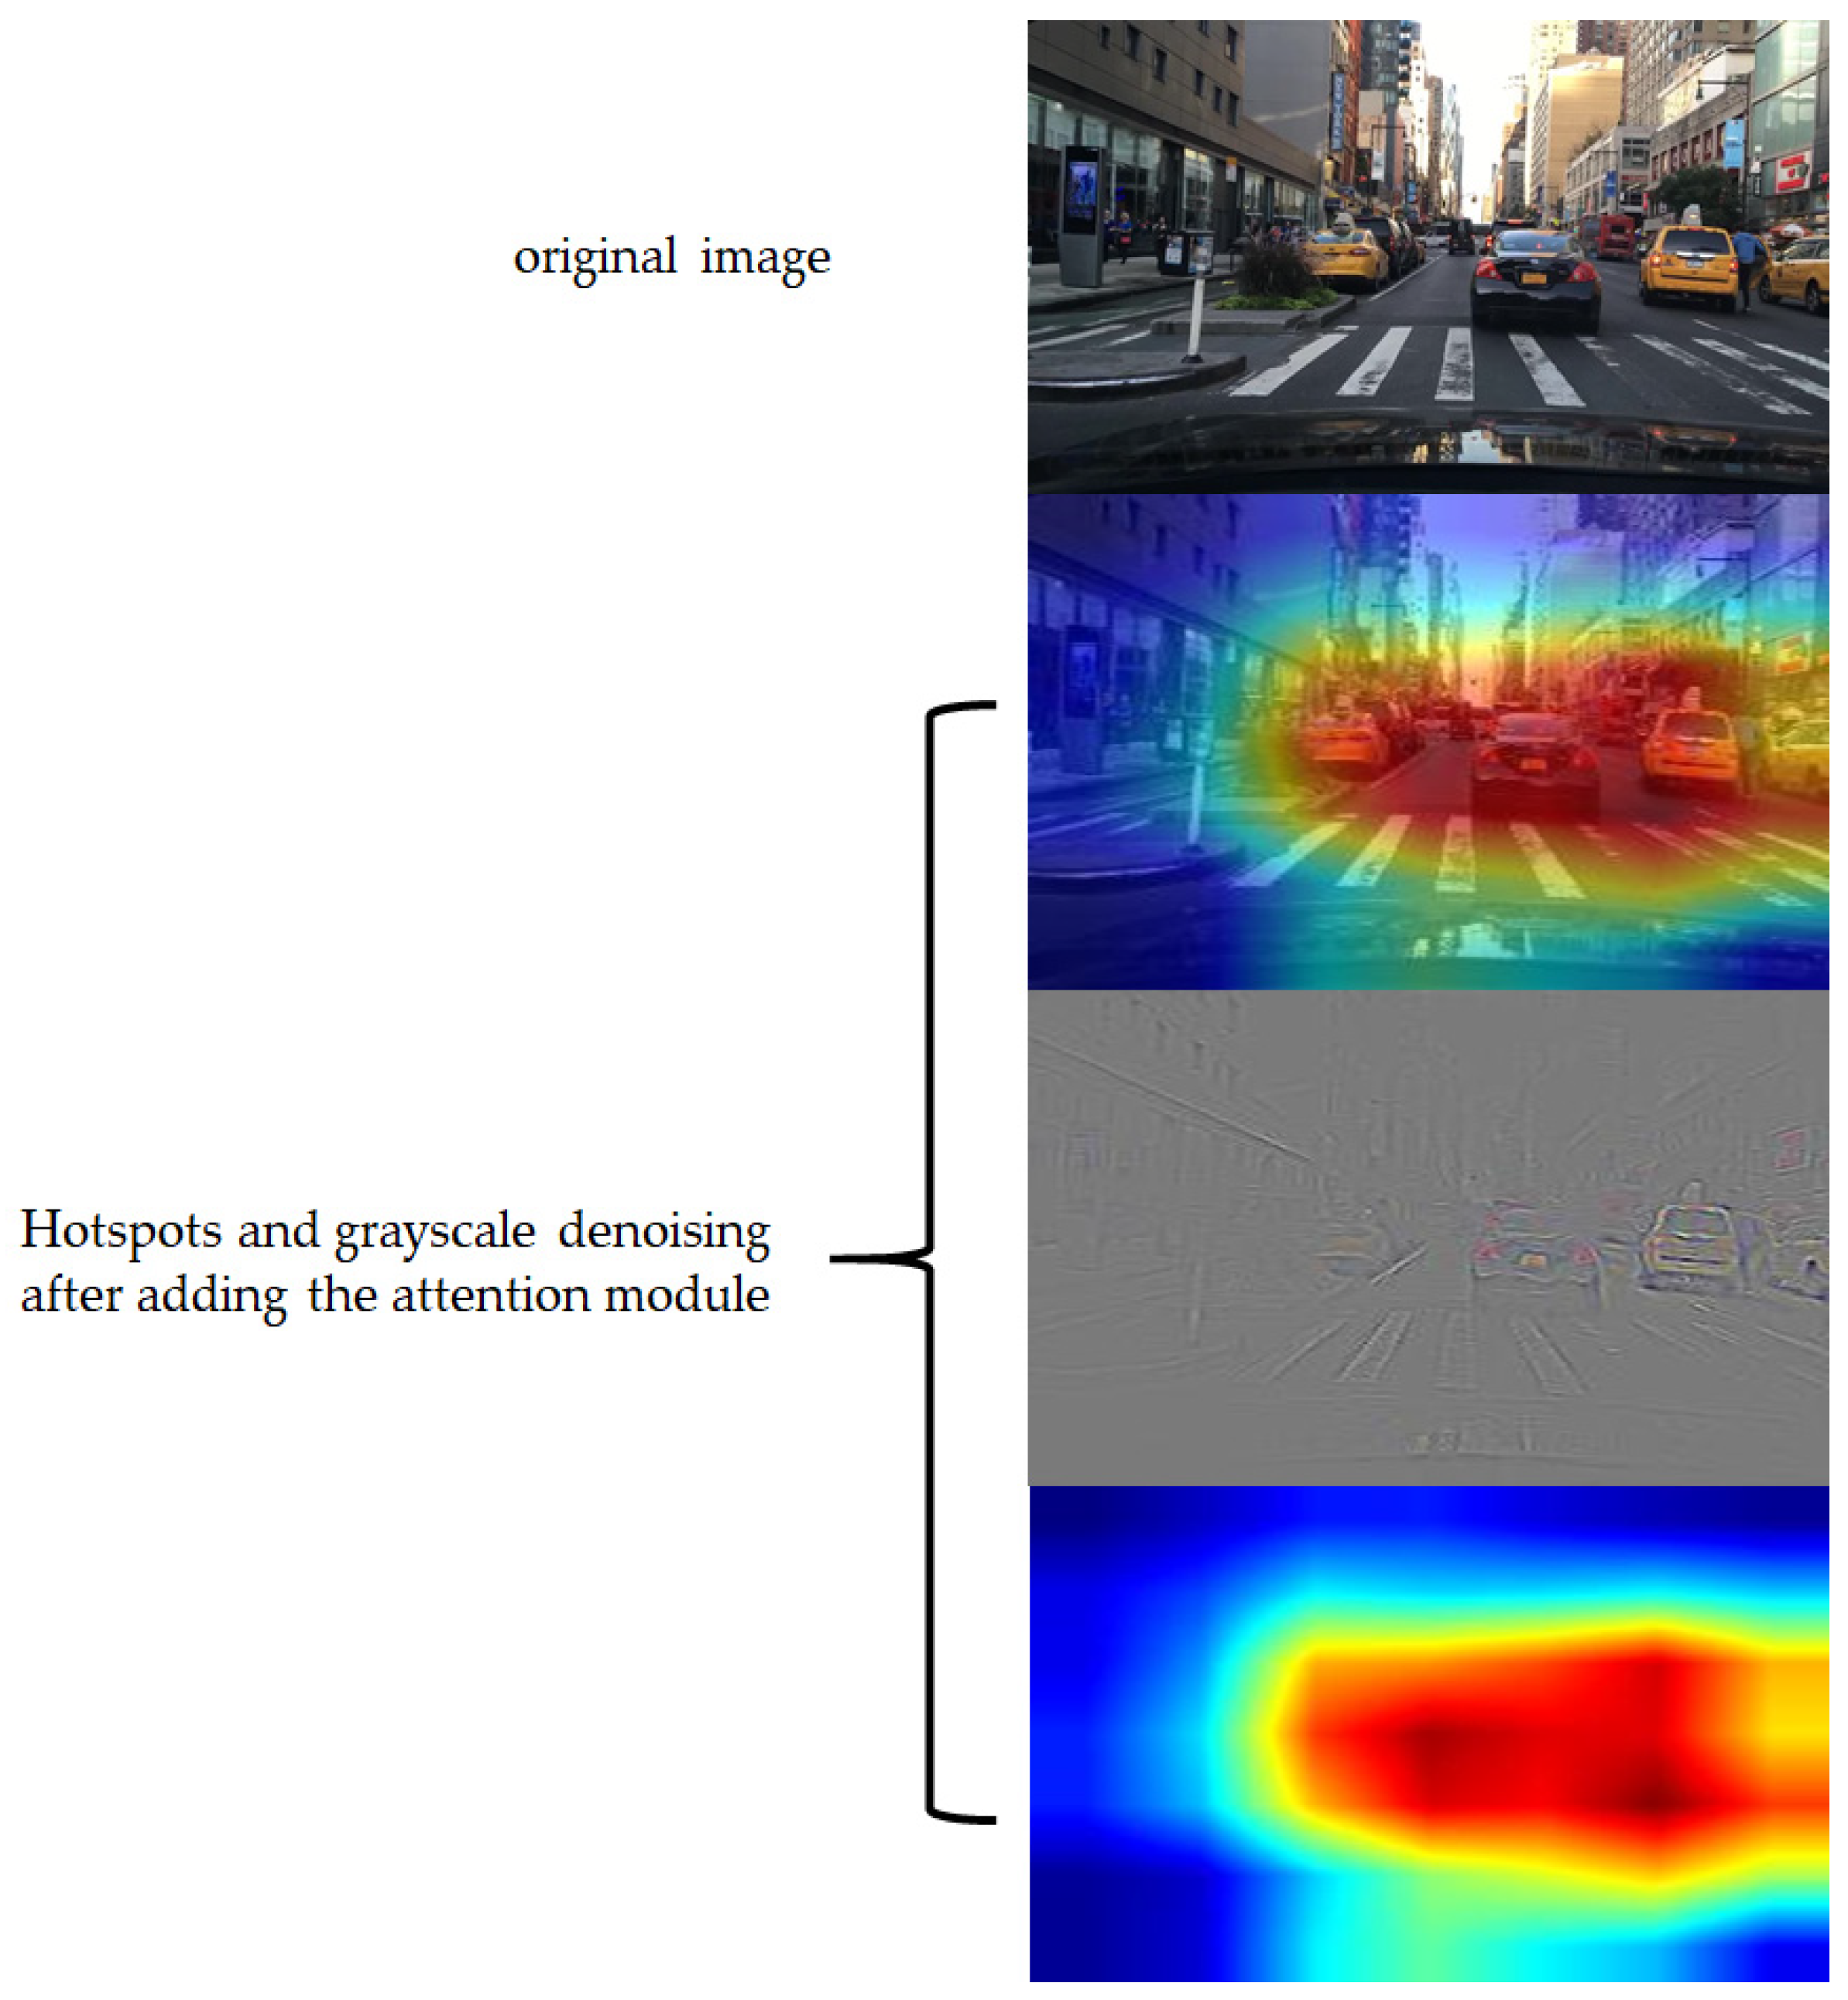
Figure 6 shows the effect of adding an attention module. After the feature map passes through the first SPP layer, the target with higher confidence is selected to map to the original image. The red part in Figure 6 is the place with high confidence. It can be seen that the attention module proposed in this paper can make the image focus more on the part of the target object and pay less attention to the background. This shows that adding an attention mechanism can effectively enhance the important features of the image, suppress the redundant features, and improve the network’s ability to recognize foreground and background.
2.4. Obtaining Anchor Points by K-Means Clustering
The anchor mechanism was first proposed by Faster R-CNN and used as the reference of the object boundary box in the prediction image, namely the anchor box and prior box. Through the anchor mechanism, the convolution network does not need to use the sliding box method and then go to each pixel to find the target box in turn, which not only improves the running speed of the model but also reduces the complexity so that the accuracy of the model is improved. The SSD and YOLO series are inspired by using the anchor mechanism through Faster R-CNN, and they also use the anchor mechanism one after another and have achieved good results. In this paper, an anchor mechanism is used to generate prior boxes for the KITTI (Karlsruhe Institute of Technology and Toyota Technological Institute) dataset (Currently the world’s largest algorithm evaluation data set in autonomous driving scenarios); that is, the image is divided into N × N grid cells, and each cell is allocated with three anchors. Therefore, each image will generate N × N × 3 prior boxes, which can significantly improve the accuracy and efficiency of prediction.
The application of the anchor mechanism in Faster R-CNN and SSD series is relatively traditional. Faster R-CNN generates nine anchors by sliding on the feature map according to the frame size and aspect ratio, which is similar to the sliding box. Similarly, the SSD algorithm generates six different size anchors. The above methods are more traditional, and obtaining the anchor information manually will inevitably cause errors. Therefore, this paper uses the K-means clustering [29] method to cluster the marked ground truth box in the KITTI dataset and then selects the appropriate box as the anchor box, which has a better effect on the subsequent vehicle and pedestrian object detection, which can make the model quickly converge and save training time. Because the use of traditional Euclidean distance will cause more errors in the large bounding box than in the small one, the distance formula in K-means clustering method is defined as follows:
In this paper, by predicting the relative position relative to the grid cell, the bounding box coordinates of the target vehicle and pedestrian are obtained. Each bounding box has four coordinates, which are. They are defined as follows:
Among them, and are the x and y distance between the grid cell and the origin of the upper left corner, respectively, and and are the width and height of the anchor box, respectively.
2.5. Loss Function
Interest over Union (IoU), i.e., the intersection and union ratio—in the target detection task, the bounding box is generally used to represent it. IoU calculates the ratio of the intersection and union of the predicted bounding box and the real bounding box. IoU is calculated as follows:
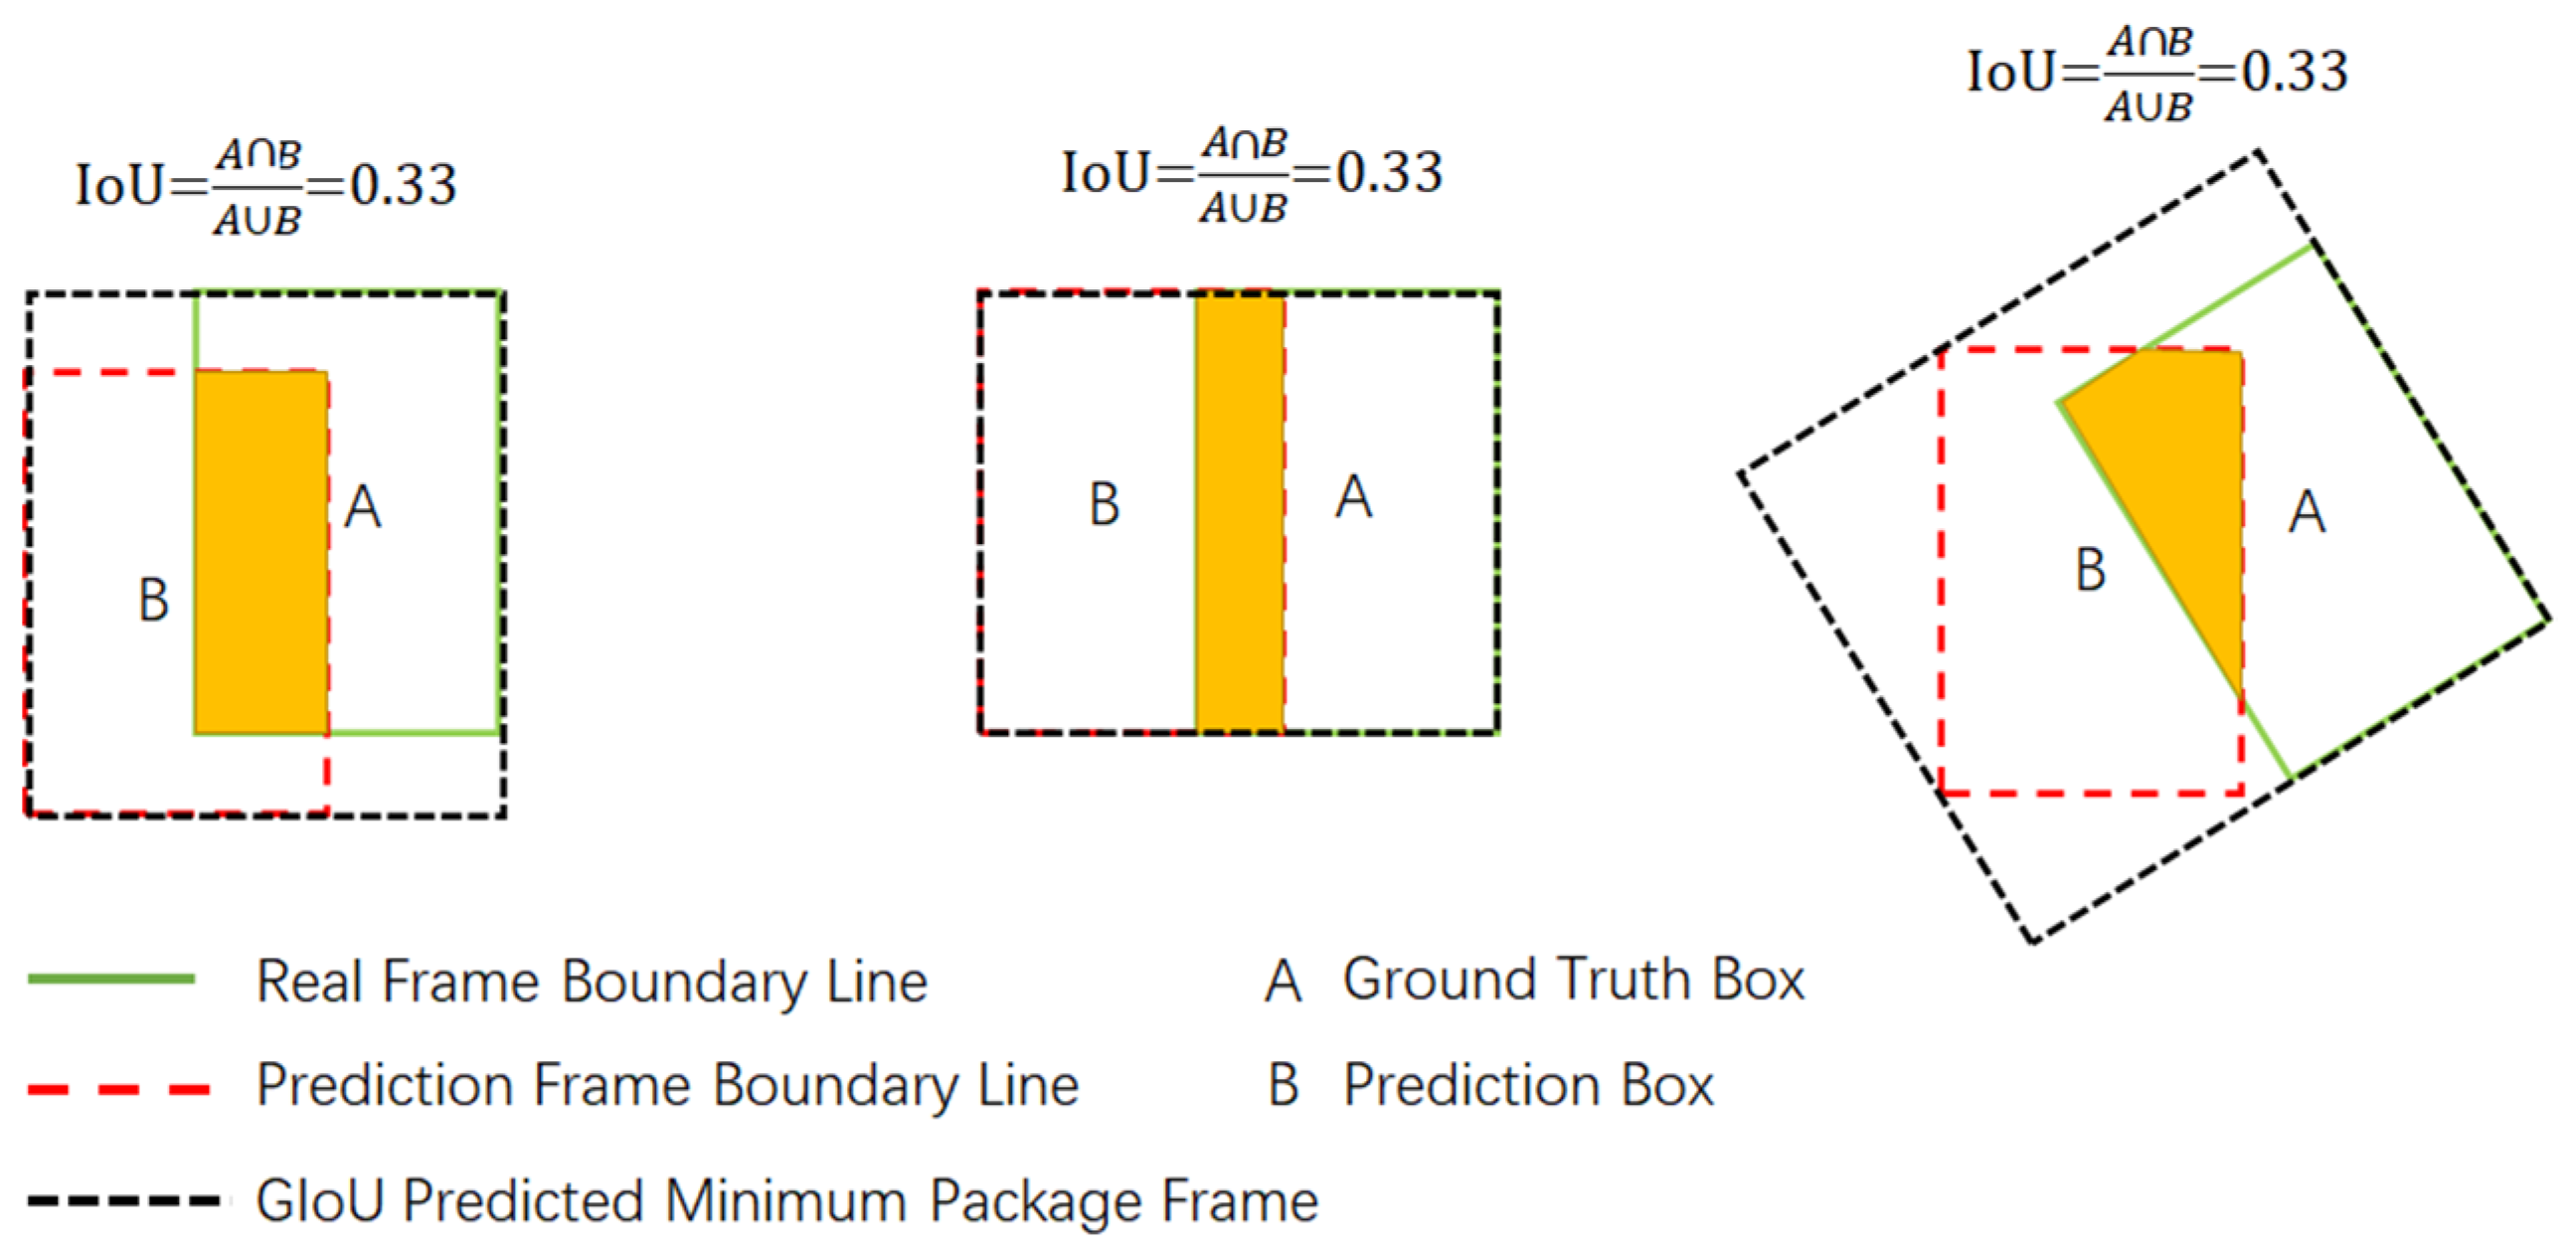
When IoU is used to measure the loss of positioning, Loss (IoU) = 1 - IoU. However, there are two problems with IoU. One is that if there is no intersection between the prediction box and the real box, i.e., IoU = 0, the distance between the two frames cannot be reflected, and there is no gradient in the loss function at this time, so it is impossible to adjust the network parameters by back-propagation, which will produce certain errors. Second, when the calculated IoU values are the same in several cases, the positioning of the prediction frame is not the same, as shown in Figure 7.
As can be seen from Figure 7, although the IoU is the same, the coincidence degree of the real box and the prediction box is completely different. Therefore, this paper uses GIoU(generalized intersection over union) Loss as the loss function, which is defined as follows:
where C represents the smallest box that wraps A and B. As shown in Figure 7, their GIoU values are 0.24, 0.33, and −0.1, respectively. The regression effect in the middle of Figure 7 is the best. When the real box and the prediction box overlap, namely , GIoU = 1 can be calculated by the formula. When the real box and prediction box do not overlap, when A and B are far apart, GIoU tends to −1; that is, the range of GIoU is between −1 and 1. When the real box and the prediction box do not overlap, IoU is always equal to 0, and the distance between the two boxes cannot be displayed.
To sum up, IoU only focuses on different overlapping regions, while GIoU not only focuses on overlapping regions but also focuses on the situation without overlapping, which can better reflect the overlapping degree of prediction box and real box.
3. Results
In this paper, we propose the YOLOv3-promote method on the open dataset KITTI. The experiment was based on the deep learning framework of Pytorch. The hardware configuration of the experiment was as follows: the processor was an Intel (R) core (TM) i9-9900k CPU @ 3.60 GHz; the memory size was 16.0 GB; the video card was single 2080ti, and the video memory size was 11 GB. The configuration environment of the software was Windows 10, CUDA 10.2, CUDNN 7.6.5, and the programming language was Python 3.7.
3.1. Dataset Description
The KITTI dataset [30,31] was co-founded by the Karlsruhe Institute of Technology in Germany and the Toyota American Institute of Technology. It is the largest computer vision algorithm evaluation dataset in the automatic driving scene in the world. KITTI contains a variety of real-scene image data, such as urban, rural, and highway areas, and each image contains vehicles and pedestrians as well as various shadows, different illuminations, occlusions, and truncations, which provides an effective reference for the robustness of the algorithm. The labels of the KITTI original dataset are divided into eight categories: Car, Van, Truck, Pedestrian, Pedestrian (sitting), Cyclist, Tram, and Misc. However, since the primary goal of automatic driving in the application of Internet of vehicles is to detect the targets of vehicles and pedestrians, this paper changes the original eight categories of labels into three categories, classifying Van, Truck, and Tram into Car, Pedestrian and Pedestrian (sitting) as Person, and removes the Misc category. The final three categories are Car, Person, and Cyclist. This paper selected 7481 images in the dataset as the experimental data and allocated one-tenth of the dataset as the verification set.
3.2. Execution Details
The system presented in this article was trained and tested on images of the same size, and we compared YOLOv3 as a baseline with the YOLOv3-promote proposed in this article. The input image was zoomed to 608 × 608 pixels. Through the darknet53 network, SPP, and attention modules, the information of the target vehicle and pedestrian in the image was extracted, and three feature maps with different scales were used to predict the target location and type. For anchor box selection, this paper used the K-means algorithm to generate a total of nine anchor points for the labeled images in KITTI dataset: (7,66), (9,23), (13,34), (19,54), (22,161), (24,36), (35,65), (57,107), and (96,196). Figure 8 shows the distribution of the nine anchors in all real frames.
In the whole training process, the backbone network used the model parameters of Darknet53.conv.74. YOLOv3-promote has carried out a total of 2000 epochs. The batch size was set to 64, and the number of subdivisions was 16. The momentum parameter and weight decay regularization term were set to 0.9 and 0.0005, respectively, and the learning rate parameter was set to 0.001. When iterating to 7000 times and 10,000 times, the learning rate decreased to one-tenth of the previous. In addition, this paper also used data enhancement to generate more training samples. By setting the saturation parameter equal to 1.5, exposure amount equal to 1.5, hue equal to 0.1, and data jitter and horizontal flipping, the robustness was increased and the accuracy of the model and the generalization of various real environments were improved.
3.3. The Method of the Network Design
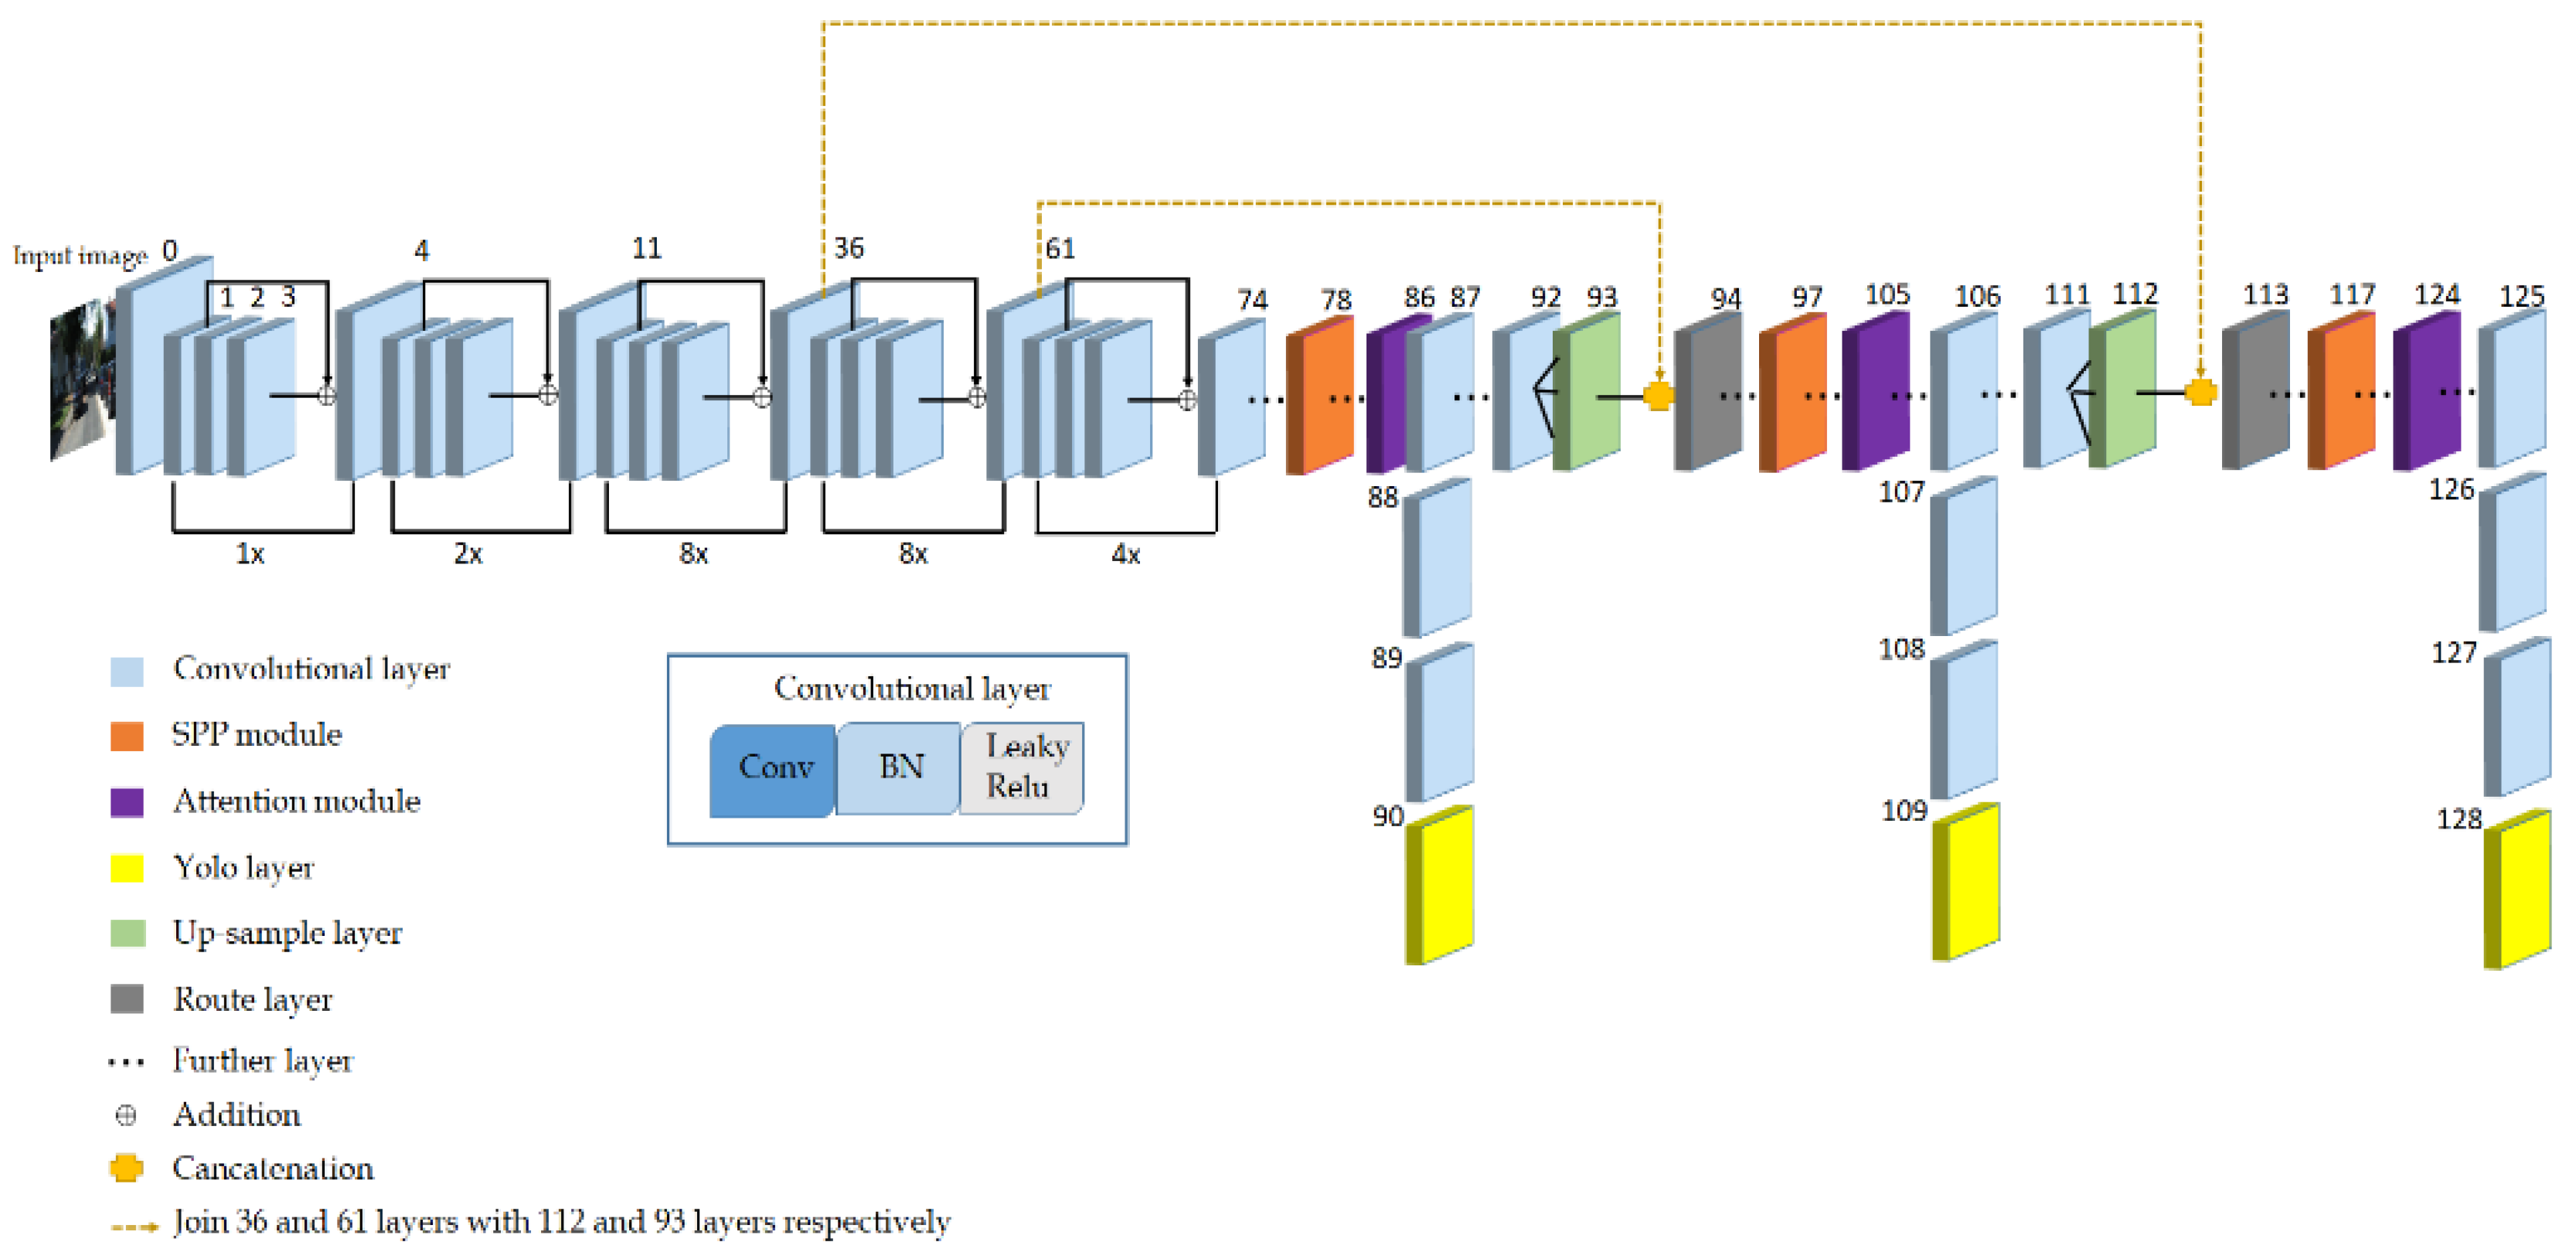
Based on YOLOv3, this paper added a spatial pyramid pooling. Through the SPP module, the local feature information and global feature information in the feature map are fused to further enrich the information expression ability of the feature map and improve the detection ability of multiple targets. In addition, this paper added an attention mechanism to YOLOv3 through a local cross-channel, non-dimensionality reduction channel interaction method, which autonomously learns the weight of each channel, thereby eliminating redundant features and enhancing features containing key information. The network structure of YOLOv3-promote based on spatial pyramid pooling and attention mechanism is shown in Figure 9. The orange and purple parts in Figure 9 are the spatial pyramid pooling module and the attention module, respectively.
The backbone of YOLOv3-promote is Darknet53. The network refers to the residual structure proposed by ResNet. A total of 23 residual modules were used in the backbone to avoid the risk of overfitting caused by increasing the network depth. At the same time, YOLOv3-promote uses convolution with a stride of two to achieve down-sampling [32], abandoning the pooling layer used in many networks. The purpose of this was to further reduce the negative effect of gradients caused by pooling and improve the accuracy of the network. The Convolutional layer in Figure 9 is composed of three components, namely Conv2d, Batch Normalization, and Leaky Relu. In order to enhance the accuracy of the network for small object detection, YOLOv3-promote uses up-sample and fusion (here called Concatenation) methods similar to feature pyramid networks (FPN) [33] to construct a convolutional layer containing three different scales in the feature pyramid, namely: 19 × 19, 38 × 38, and 76 × 76 resolution. In Figure 9, the size of the feature map is increased through the 93rd and 112th up-sampling layers, and the route layer of the 94th and 113th layers in Figure 9 is obtained by Concatenation with the shallow feature maps. For example, the 112th layer up-samples the 38 × 38 × 128 feature map into a 76 × 76 × 128 feature map and then cascades it with the 76 × 76 × 256 feature map of the 36th layer to obtain a 76 × 76 × 384 Route layer feature.
The 90th, 109th, and 128th layers in Figure 9 are the YOLO layers, that is, the detection layers. The sizes of the three detection layers are 19 × 19 × 24, 38 × 38 × 24, and 76 × 76 × 24. Since the smaller the size of the feature map, the larger the receptive field, the 19 × 19 × 24 detection layer is used to detect large targets, and the 38 × 38 × 24 detection layer is used to detect medium-sized targets, and the 76 × 76 × 24 detection layer tends to detect some small targets. Because each grid cell is assigned three anchor boxes, the predicted vector length of each cell is 3 × (3 + 4 + 1) = 24, where 3 corresponds to the three types of Car, Cyclist, and Person in the modified KITTI dataset in this article, 4 represents the coordinate information (x, y, w, h) corresponding to the detection frame, and 1 represents the object score.
3.4. Detection Result
In this paper, we use mean average precision (mAP), F1 Score, namely the number of floating-point operations per second, FPS(frames per second), and parameters as the evaluation criteria.
Table 1 lists the comparison between the method proposed in this paper and the traditional YOLOv3 method. It can be seen that although the method proposed in this paper increases the number of model parameters by 3.7%, the mAP for target object detection is much higher than that of traditional YOLOv3, which makes many targets that could not be detected before now able to be detected; the F1 score of this method is 83.2. Since F1 is the average of precision and recall, and the precision and recall of YOLOv3-promote are higher than the original YOLOv3, the value of F1 is naturally higher than that of the traditional YOLOv3 system. Under the same image input size, because the parameter amount of the YOLOv3-promote model is 2 MB higher than the traditional YOLOv3, the amount of calculation is a little more than the original, so the FPS is slightly reduced, but overall, the improved YOLOv3-promote FPS is basically the same as YOLOv3. Figure 10 shows the mAP diagram of the YOLOv3-promote method proposed in this article after 500 epochs.
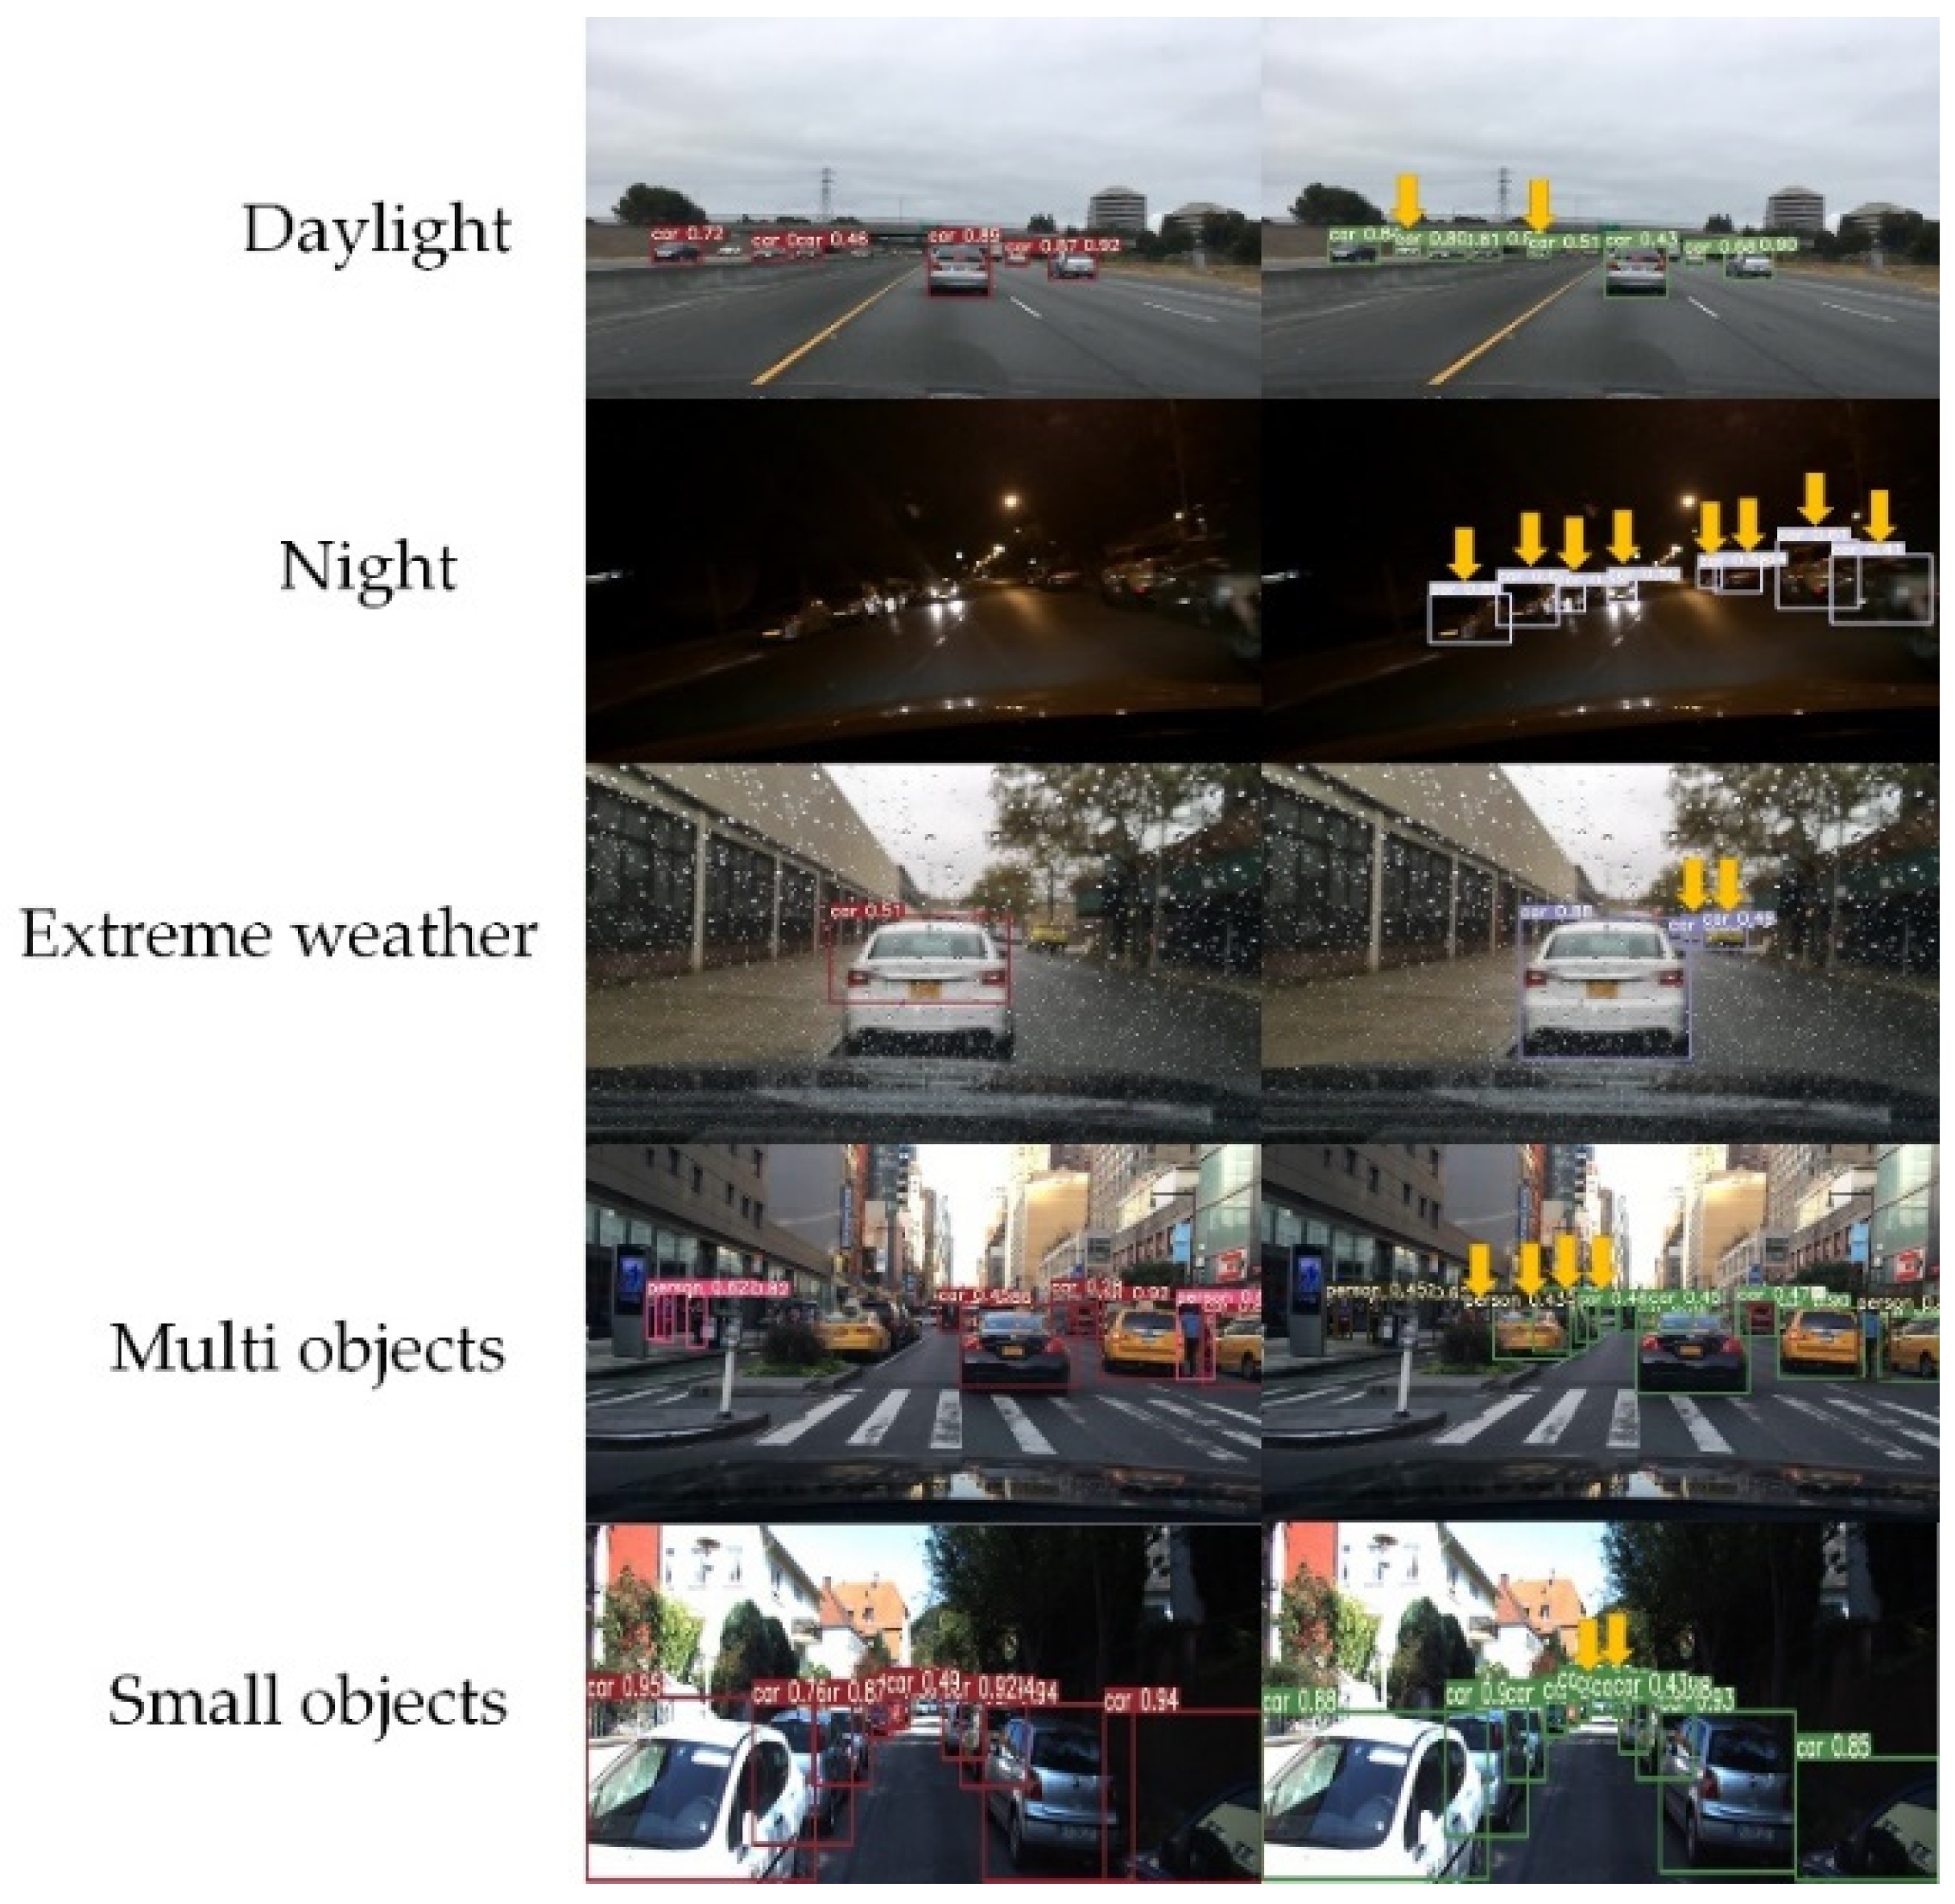
The model where the maximum mAP is 91.4 was selected as the optimal model and compared with the optimal model of YOLOv3. The comparison chart is shown in Figure 11, which is classified by day, night, extreme weather, multi-target, and small targets.
As can be seen from Figure 11, in the daylight, the effect gap between the two algorithms is the smallest, but YOLOv3 still misses several small target vehicles (the missed detection vehicles have been marked with yellow arrows in Figure 11), and all of them are detected in this paper; as for the night, the difference between the two algorithms is particularly obvious, and YOLOv3 faces more difficulties with correct identification due to the lack of attention mechanism. In extreme weather, YOLOv3 does not detect small targets in the distance due to the interference of water mist in the window; in the case of multi-target and small targets, the difference between YOLOv3 and the proposed YOLOv3-promote is reflected in the small target detection in the distance. Because the spatial pyramid pooling proposed in this paper can effectively combine the local features and global features of the feature map, both large and small targets can be detected accurately.
4. Conclusions
By adding spatial pyramid pooling and an attention mechanism, the improved network structure of YOLOv3-promote not only integrates the local and global features of the image, but also improves the generalization of the model for various environmental targets and makes each channel of the feature map learn their respective weights, which makes the network more sensitive to the target objects in the image. Whether it is during the day, night, or extreme weather conditions, the detection effect for multiple targets and small targets is better than the previous YOLOv3. Although the traditional YOLOv3 has the ability to detect small targets, it is not obvious for long-distance small targets in the above complex situations, and it is easy to miss detection, false detection, and repeated detection. The method proposed in this paper perfectly solves the above problems. The K-means clustering method is used to automatically generate an anchor that conforms to the data set, which further speeds up the model convergence. Using GIoU as a new loss function, extra attention is paid to the situation when there is no overlap, which better reflects the degree of overlap between the predicted frame and the real frame. Experiments on the KITTI dataset show that YOLOv3-promote can achieve real-time performance and is superior to the current YOLOv3 detection algorithms in vehicle and pedestrian target detection. In the automatic driving of the Internet of vehicles applications, more lightweight models are needed for real deployment to reduce the requirements of various hardware. Therefore, further research will be conducted on how to compress the model size and increase the accuracy slightly in the future.
Author Contributions
Conceptualization, M.G., D.X., P.L. and H.X.; methodology, M.G.; software, M.G.; validation, M.G. and D.X.; formal analysis, M.G.; investigation, M.G.; writing—original draft preparation, M.G.; writing—review and editing, M.G. and H.X.; visualization, M.G.; supervision, H.X.; project administration, P.L. All authors have read and agreed to the published version of the manuscript.
Funding
This work was supported by the National Key R & D Program of China (No. 2019YFB2103003), the National Natural Science Foundation of P. R. China (No. 61672296, No. 61872196, No. 61872194 and No. 61902196), Scientific and Technological Support Project of Jiangsu Province (No. BE2017166, and No. BE2019740), Major Natural Science Research Projects in Colleges and Universities of Jiangsu Province (No. 18KJA520008), Six Talent Peaks Project of Jiangsu Province (RJFW-111), Postgraduate Research and Practice Innovation Program of Jiangsu Province under Grant KYCX19_0973, and the 1311 Talent Plan of the Nanjing University of Posts and Telecommunications (NUPT).
Acknowledgments
The authors would like to thank Yi Lu and Jiajie Sun for their suggestions to improve the manuscript.
Conflicts of Interest
The authors declare no conflict of interests.
References
- Simonyan, K.; Zisserman, A. Very deep convolutional networks for large-scale image recognition. arXiv 2014, arXiv:1409.1556. [Google Scholar]
- Szegedy, C.; Liu, W.; Jia, Y.; Sermanet, P.; Reed, S.; Anguelov, D.; Erhan, D.; Vanhoucke, V.; Rabinovich, A. Going deeper with convolutions. In Proceedings of the IEEE Computer Society Conference on Computer Vision and Pattern Recognition, Boston, MA, USA, 7–12 June 2015; pp. 1–9. [Google Scholar]
- He, K.; Zhang, X.; Ren, S.; Sun, J. Deep residual learning for image recognition. In Proceedings of the IEEE Conference on Computer Vision and Pattern Recognition, Las Vegas, NV, USA, 27–30 June 2016; pp. 770–778. [Google Scholar]
- Howard, A.G.; Zhu, M.; Chen, B.; Kalenichenko, D.; Wang, W.; Weyand, T.; Andreetto, M.; Adam, H. Mobilenets: Efficient convolutional neural networks for mobile vision applications. arXiv 2017, arXiv:1704.04861. [Google Scholar]
- Sultana, F.; Sufian, A.; Dutta, P. Evolution of Image Segmentation using Deep Convolutional Neural Network: A Survey. Knowledge-Based Syst. 2020, 201–202, 106062. [Google Scholar] [CrossRef]
- He, K.; Gkioxari, G.; Dollár, P.; Girshick, R. Mask r-cnn. In Proceedings of the IEEE International Conference on Computer Vision, Venice, Italy, 22–29 October 2017; pp. 2961–2969. [Google Scholar]
- Girshick, R.; Donahue, J.; Darrell, T.; Malik, J. Rich Feature Hierarchies for Accurate Object Detection and Semantic Segmentation. In Proceedings of the 2014 IEEE Conference on Computer Vision and Pattern Recognition, Columbus, OH, USA, 23–28 June 2014; pp. 580–587. [Google Scholar]
- He, K.; Zhang, X.; Ren, S.; Sun, J. Spatial pyramid pooling in deep convolutional networks for visual recognition. IEEE Trans. Pattern Anal. Mach. Intell. 2015, 37, 1904–1916. [Google Scholar] [CrossRef] [PubMed] [Green Version]
- Girshick, R. Fast R-CNN. In Proceedings of the 2015 IEEE International Conference on Computer Vision (ICCV), Santiago, Chile, 7–13 December 2015; pp. 1440–1448. [Google Scholar]
- Ren, S.; He, K.; Girshick, R.; Sun, J. Faster r-cnn: Towards real-time object detection with region proposal networks. Adv. Neural Inf. Process. Syst. 2019, 39, 1137–1149. [Google Scholar] [CrossRef] [PubMed] [Green Version]
- Uijlings, J.R.R.; Van De Sande, K.E.A.; Gevers, T.; Smeulders, A.W.M. Selective Search for Object Recognition. Int. J. Comput. Vis. 2013, 104, 154–171. [Google Scholar] [CrossRef] [Green Version]
- Zhang, F.; Yang, F.; Li, C. Fast vehicle detection method based on improved YOLOv3. Comput. Eng. Appl. 2019, 55, 12–20. [Google Scholar]
- Rezatofighi, H.; Tsoi, N.; Gwak, J.; Sadeghian, A.; Reid, I.; Savarese, S. Generalized Intersection Over Union: A Metric and a Loss for Bounding Box Regression. In Proceedings of the 2019 IEEE/CVF Conference on Computer Vision and Pattern Recognition (CVPR), Long Beach, CA, USA, 15–20 June 2019; pp. 658–666. [Google Scholar]
- Liu, W.; Anguelov, D.; Erhan, D.; Szegedy, C.; Reed, S.; Fu, C.Y.; Berg, A.C. Ssd: Single shot multibox detector. In European Conference on Computer Vision; Springer: Berlin/Heidelberg, Germany, 2016; pp. 21–37. [Google Scholar]
- Liu, S.; Huang, D. Receptive field block net for accurate and fast object detection. In Proceedings of the European Conference on Computer Vision (ECCV), Munich, Germany, 8–14 September 2018; pp. 385–400. [Google Scholar]
- Zhang, S.; Wen, L.; Bian, X.; Lei, Z.; Li, S.Z. Single-Shot Refinement Neural Network for Object Detection. In Proceedings of the 2018 IEEE/CVF Conference on Computer Vision and Pattern Recognition, Salt Lake City, UT, USA, 18–23 June 2018; pp. 4203–4212. [Google Scholar]
- Ren, J.; Chen, X.; Liu, J.; Sun, W.; Pang, J.; Yan, Q.; Tai, Y.W.; Xu, L. Accurate single stage detector using recurrent rolling convolution. In Proceedings of the IEEE Conference on Computer Vision and Pattern Recognition, Honolulu, HI, USA, 21–26 July 2017; pp. 5420–5428. [Google Scholar]
- Li, Z.; Zhou, F. FSSD: Feature fusion single shot multibox detector. arXiv 2017, arXiv:1712.00960. [Google Scholar]
- Redmon, J.; Divvala, S.; Girshick, R.; Farhadi, A. You only look once: Unified, real-time object detection. In Proceedings of the 2016 IEEE Conference on Computer Vision and Pattern Recognition, Las Vegas, NV, USA, 27–30 June 2016; pp. 779–788. [Google Scholar]
- Redmon, J.; Farhadi, A. YOLO9000: Better, Faster, Stronger. In Proceedings of the 30th IEEE Conference on Computer Vision and Pattern Recognition, Honolulu, HI, USA, 21–26 July 2017; pp. 6517–6525. [Google Scholar]
- Redmon, J.; Farhadi, A. Yolov3: An incremental improvement. arXiv 2018, arXiv:1804.02767. [Google Scholar]
- Vinyals, O.; Toshev, A.; Bengio, S.; Erhan, D. Show and tell: A neural image caption generator. In Proceedings of the 2015 IEEE Conference on Computer Vision and Pattern Recognition (CVPR), Boston, MA, USA, 7–12 June 2015; pp. 3156–3164. [Google Scholar]
- Liu, D.; Wu, Y. Gaussian-yolov3 target detection with embedded attention and feature interleaving module. Comput. Appl. 2020, 40, 2225–2230. [Google Scholar]
- Zhao, B.; Wu, X.; Feng, J.; Peng, Q.; Yan, S. Diversified Visual Attention Networks for Fine-Grained Object Classification. IEEE Trans. Multimed. 2017, 19, 1245–1256. [Google Scholar] [CrossRef] [Green Version]
- Xiao, T.; Xu, Y.; Yang, K.; Zhang, J.; Peng, Y.; Zhang, Z. The application of two-level attention models in deep convolutional neural network for fine-grained image classification. In Proceedings of the 2015 IEEE Conference on Computer Vision and Pattern Recognition (CVPR), Boston, MA, USA, 7–12 June 2015; pp. 842–850. [Google Scholar]
- Stollenga, M.F.; Masci, J.; Gomez, F.; Schmidhuber, J. Deep networks with internal selective attention through feedback connections. In Proceedings of the Advances in Neural Information Processing Systems, Washington, DC, USA, 10–12 June 2014; pp. 3545–3553. [Google Scholar]
- Hu, J.; Shen, L.; Sun, G. Squeeze-and-excitation networks. In Proceedings of the IEEE Conference on Computer Vision and Pattern Recognition, Las Vegas, NV, USA, 27–30 June 2018; pp. 7132–7141. [Google Scholar]
- Woo, S.; Park, J.; Lee, J.-Y.; Kweon, I.S. CBAM: Convolutional Block Attention Module. In Proceedings of the Lecture Notes in Computer Science, Munich, Germany, 8–11 September 2018; pp. 3–19. [Google Scholar]
- Hartigan, J.A.; Wong, M.A. Algorithm AS 136: A K-Means Clustering Algorithm. J. R. Stat. Soc. Ser. C Appl. Stat. 1979, 28, 100. [Google Scholar] [CrossRef]
- Geiger, A.; Lenz, P.; Urtasun, R. Are we ready for autonomous driving? The KITTI vision benchmark suite. In Proceedings of the 2012 IEEE Conference on Computer Vision and Pattern Recognition, Providence, RI, USA, 16–21 June 2012. [Google Scholar]
- Geiger, A.; Lenz, P.; Stiller, C.; Urtasun, R. Vision meets robotics: The KITTI dataset. Int. J. Robot. Res. 2013, 32, 1231–1237. [Google Scholar] [CrossRef] [Green Version]
- Wang, Q.; Wu, B.; Zhu, P.; Li, P.; Zuo, W.; Hu, Q. ECA-Net: Efficient Channel Attention for Deep Convolutional Neural Networks. In Proceedings of the 2020 IEEE/CVF Conference on Computer Vision and Pattern Recognition (CVPR), Seattle, WA, USA, 14–19 June 2020; pp. 11531–11539. [Google Scholar]
- Lin, T.Y.; Dollár, P.; Girshick, R.; He, K.; Hariharan, B.; Belongie, S. Feature pyramid networks for object detection. In Proceedings of the IEEE Conference on Computer Vision and Pattern Recognition, Honolulu, HI, USA, 21–26 July 2017; pp. 2117–2125. [Google Scholar]
Figure 1.
You Only Look Once version 3 (YOLOv3)’s detection effect on pictures and videos.

Figure 2.
Principle of spatial pyramid pooling.

Figure 3.
Spatial Pyramid Pooling Module.

Figure 4.
The contrast of attention mechanisms.

Figure 5.
Channel attention module.

Figure 6.
Effect of attention module.

Figure 7.
The Interest over Union (IoU) is the same, but the coincidence degree is different.

Figure 8.
Anchor distribution.

Figure 9.
Overall network structure.

Figure 10.
Mean average precision (mAP).

Figure 11.
Example comparison.


Table 1.
Performance comparison of algorithms.
| Method | Input | mAP | F1 | FPS | Parameter |
|---|---|---|---|---|---|
| YOLOv3 | 608*608 | 86.1% | 73.9 | 45.1 | 61.5 M |
| YOLOv3-promote | 608*608 | 91.4% | 83.2 | 43.7 | 63.8 M |
Publisher’s Note: MDPI stays neutral with regard to jurisdictional claims in published maps and institutional affiliations. |
© 2020 by the authors. Licensee MDPI, Basel, Switzerland. This article is an open access article distributed under the terms and conditions of the Creative Commons Attribution (CC BY) license (http://creativecommons.org/licenses/by/4.0/).
Share and Cite
MDPI and ACS Style
Guo, M.; Xue, D.; Li, P.; Xu, H. Vehicle Pedestrian Detection Method Based on Spatial Pyramid Pooling and Attention Mechanism. Information 2020, 11, 583. https://0-doi-org.brum.beds.ac.uk/10.3390/info11120583
AMA Style
Guo M, Xue D, Li P, Xu H. Vehicle Pedestrian Detection Method Based on Spatial Pyramid Pooling and Attention Mechanism. Information. 2020; 11(12):583. https://0-doi-org.brum.beds.ac.uk/10.3390/info11120583
Chicago/Turabian StyleGuo, Mingtao, Donghui Xue, Peng Li, and He Xu. 2020. "Vehicle Pedestrian Detection Method Based on Spatial Pyramid Pooling and Attention Mechanism" Information 11, no. 12: 583. https://0-doi-org.brum.beds.ac.uk/10.3390/info11120583
Note that from the first issue of 2016, this journal uses article numbers instead of page numbers. See further details here.