Article

Grade Setting of a Timber Logistics Center Based on a Complex Network: A Case Study of 47 Timber Trading Markets in China

1
College of Automobile and Traffic Engineering, Nanjing Forestry University, Longpan Road 159#, Nanjing 210037, China
2
College of Civil Engineering, Nanjing Forestry University, Longpan Road 159#, Nanjing 210037, China
3
Collaborative Innovation Center of steel Technology, University of Science and Technology Beijing, Xueyuan Road 30#, Beijing 100083, China
*
Author to whom correspondence should be addressed.
Submission received: 14 January 2020 / Revised: 11 February 2020 / Accepted: 14 February 2020 / Published: 16 February 2020
(This article belongs to the Special Issue New Frontiers for Optimal Control Applications)

Abstract

:
The location and grade setting of a timber logistics center is an important link in the optimization of the timber logistics system, the rationality of which can effectively improve the efficiency of the timber logistics supply chain. There is a long distance between the main forested areas in China, and more than 55% of the timber demand depends on imports. Research and practice of systematically planning timber logistics centers in the whole country have not been well carried out, which reduces the efficiency of timber logistics. In this paper, 47 timber trading markets with a certain scale in China are selected as the basis for logistics center selection. Based on their transportation network relationship and the number of enterprises in the market, combined with the complex network theory and data analysis method, the network characteristics of three different transportation networks are measured. After determining the transportation capacity indicator, the logistics capacity coefficient is measured based on the freight volume of each node. Then, the important nodes are identified, and each node is graded to systematically set up the timber logistics center.

1. Introduction

The nodes in the supply chain of timber products include forestry enterprises, timber processing enterprises, furniture enterprises, timber distribution enterprises, etc. For all participants in the supply chain, the efficiency and cost of the logistics system are the key factors that affect the efficiency of the enterprise. As important parts of the whole timber logistics system, reasonable location selection and grade setting can effectively promote the optimal allocation of timber flow in the process of timber production and consumption, are directly related to the cost and expense level of logistics businesses and, more importantly, can provide customers with high-quality and efficient logistics services. In view of the distribution of timber resources and customers, the supply and demand of timber, the transportation network, land price level and natural conditions, the distribution of import and export ports and other factors which lead to the establishment of timber logistics centers in different places, the economic benefits of the whole timber logistics system and the impact of the operation process of the system on the environment are different. At present, there is a lack of systematic and standard timber logistics center planning and grade setting, so it is necessary to study this topic.
Scholars used the method of combining qualitative and quantitative analyses for choosing a logistics center. Sun et al. (2008) [1] proposed a bilevel programming model based on a heuristic algorithm. The upper-level model is to determine the optimal location by minimizing the planners’ cost, and the lower gives an equilibrium demand distribution by minimizing the customers’ cost, so as to find the best location for a logistics distribution center. Marković et al. (2013) [2] considered the significance of selecting and ranking different locations. It is necessary to compare, as objectively as possible, the influences of various criteria and reduce them to a common function, i.e., present the methodology for solving complex problems associated with the ranking of alternatives. Önden et al. (2016) [3] determined that 19 logistics centers in Turkey are developing a systematic approach and integrating different transport modes to improve logistics performance. To reach suitability levels, seven decision criteria were considered with their priority levels. Zhang et al. (2017) [4] proposed a rural logistics center location model based on the theory of intuitionistic fuzzy TOPSIS. On the basis of the evaluation indicator system, the information is integrated according to the experts’ score. The entropy weight method is used to determine the weight of each evaluation indicator. The results are sorted by intuitionistic fuzzy TOPSIS. Vanessa et al. (2017) [5] noted that the logistics integration center (LIC) has become an attractive option to realize efficient intermodal transport. The mixed integer linear programming model is applied to the soybean flow in Brazil, which can be used to evaluate whether the transportation cost will be reduced if there are LICs. Zhao (2018) [6] noted that when deciding medicine logistics center location with financial results in mind, market size, growth and demand creation must be the primary considerations. Mousavi et al. (2019) [7] presented a new MCGDM model that applied the concept of a compromise solution under uncertainty. Then, a new Collective Indicator was developed that simultaneously regards the distances of cross-docking centers as candidates from the IVIF-ideal points.
There has been a certain research focus on the use of complex network theory to study the importance of transportation network nodes and network characteristics. Xia et al. (2010) [8] used an iterative algorithm to optimize the allocation of node capacity considering the uneven transportation generation rate of different nodes. Cardillo et al. (2013) [9] used real data from the European Air Transport Composite Network to analyze the structural characteristics of an essentially multilayer real network. Couto et al. (2015) [10] analyzed the complex network characteristics of the Brazilian air transport network and confirmed that the network had small-world characteristics, while the national connection network followed a power law distribution. Sun et al. (2016) [11] found that most of Dublin’s important nodes and transportation hubs were located in the city center, i.e., most bus lines often intersect with the city center. Ducruet et al. (2017) [12] confirmed that the development of the network is mainly concentrated around large hubs and that the transportation distribution depends on the location of important nodes that have been established. Yu et al. (2019) [13] focused on the change of space structure of the Nanjing Metro network combined with the concept of node degree in a complex network to conclude that line connection tends to occur at important nodes. Zhang et al. (2019) [14] used the complex network method to characterize freight transport, which showed that the city-scale network at the prefecture and county levels had obvious small-world network characteristics.
Research on the grade setting and evaluation of a logistics center is not enough. Shi et al. (2011) [15] established the evaluation indicator system of a logistics green level for a coal distribution center. By using the fuzzy analytic hierarchy process (AHP) evaluation method, the evaluation vector of an alternative power plant and port logistics green level was obtained, which is decisive for the final site selection. Yang et al. (2015) [16] proposed the support vector machine, which can promote generalization through structural risk minimization, thus solving practical problems, such as small sample data sets, nonlinearity, high dimensions and local minima, which play significant roles in evaluating the ability of a military logistics distribution center. Wu (2016) [17] proposed a multiattribute group decision-making (MAGDM) framework to facilitate such evaluations. The MAGDM framework was applied to the lean practice evaluation of the logistics distribution center of a commercial tobacco company. Chen (2017) [18] described the function of an urban logistics center and put forward the location principle and construction model for one. The final evaluation indicator system was composed of six first-level indicators and four second-level indicators. Liu et al. (2019) [19] proposed a method for selecting the location of a pharmaceutical logistics center based on combined weight and cumulative prospect theory. The comprehensive evaluation model of pharmaceutical logistics was established, which solves the comprehensive prospect value of each pharmaceutical logistics center and determines the competitiveness sequence. Li et al. (2019) [20] proposed the use of AHP to select four indicators as the evaluation and judgment basis to evaluate the operation system of the logistics distribution center of steel enterprises.
Scholars have performed relatively little research on timber logistics transportation and related networks. Lin et al. (2016) [21] used an improved K-means clustering analysis algorithm and achieved recognition of vehicle type and timber transportation volume in the process of timber transportation using neural network technology. Long et al. (2016) [22] constructed an international trade network of woody forest products with countries as nodes and trade relations as links based on the complex network theory and analyzed the characteristics of the network. Lin et al. (2017) [23] analyzed and designed a timber logistics network system using Web GIS technology, database technology and component integration technology. Sarrazin et al. (2019) [24] proposed a profit maximization model that considers the interaction between forest logistics centers and complex forest networks and reduces sorting and transportation costs. Long et al. (2019) [25] used global timber and forest products trade data from 2004 to 2016 to construct a global unweighted and weighted forest products competition network from the perspective of import and introduced five indicators to study its spatial distribution.
Until now, scholars have mainly focused on studying the logistics center location based on the quantitative method supplemented by the qualitative method. Most quantitative studies have considered the use of complex mathematical models and obtained the optimal solution for a logistics center. However, the calculation results are often unsatisfactory because they involve the construction cost of the logistics center, the surrounding transportation, the economic benefits and other factors. In addition, the analytic hierarchy process (AHP), expert scoring and fuzzy analysis was used for qualitative research; some views are relatively subjective, and were also slightly inadequate. There are many studies that combine the two, but the final results may change due to the actual environment and conditions, which will make the research results have no practical significance.
The development of timber logistics is limited by the characteristics of timber. Compared with other goods, timber occupies more space and has irregular shapes, which leads to problems in stacking. In regard to the choice of the transportation mode, it is not as random as that used for other goods. General timber transportation uses highway transportation, followed by railway transportation, and air transportation is used relatively less frequently. The construction of a timber logistics center is the carrier of timber logistics and is also an important way to develop regional logistics. Therefore, it is necessary to fully consider the differences in the functions of regional logistics centers when building timber logistics centers in various regions to correctly set the grade of the logistics centers.
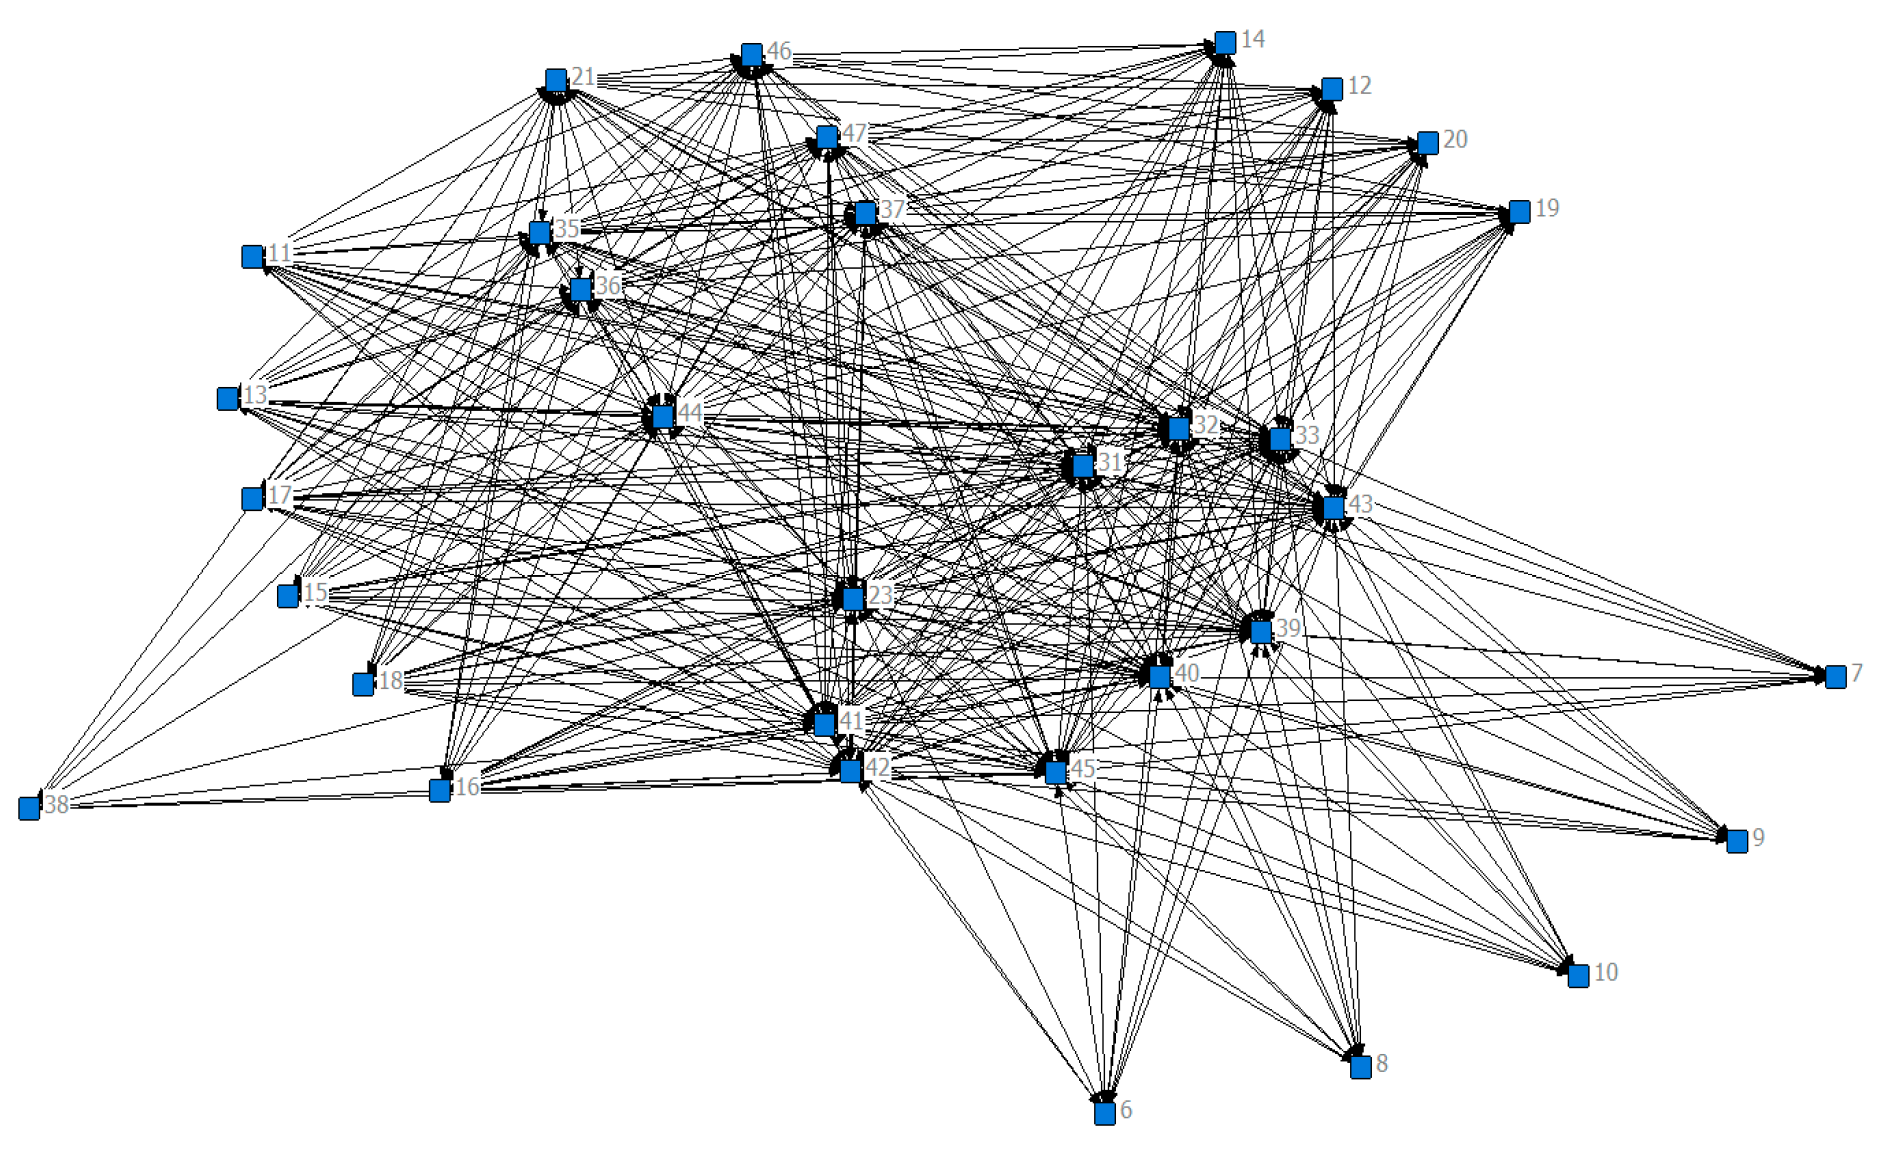
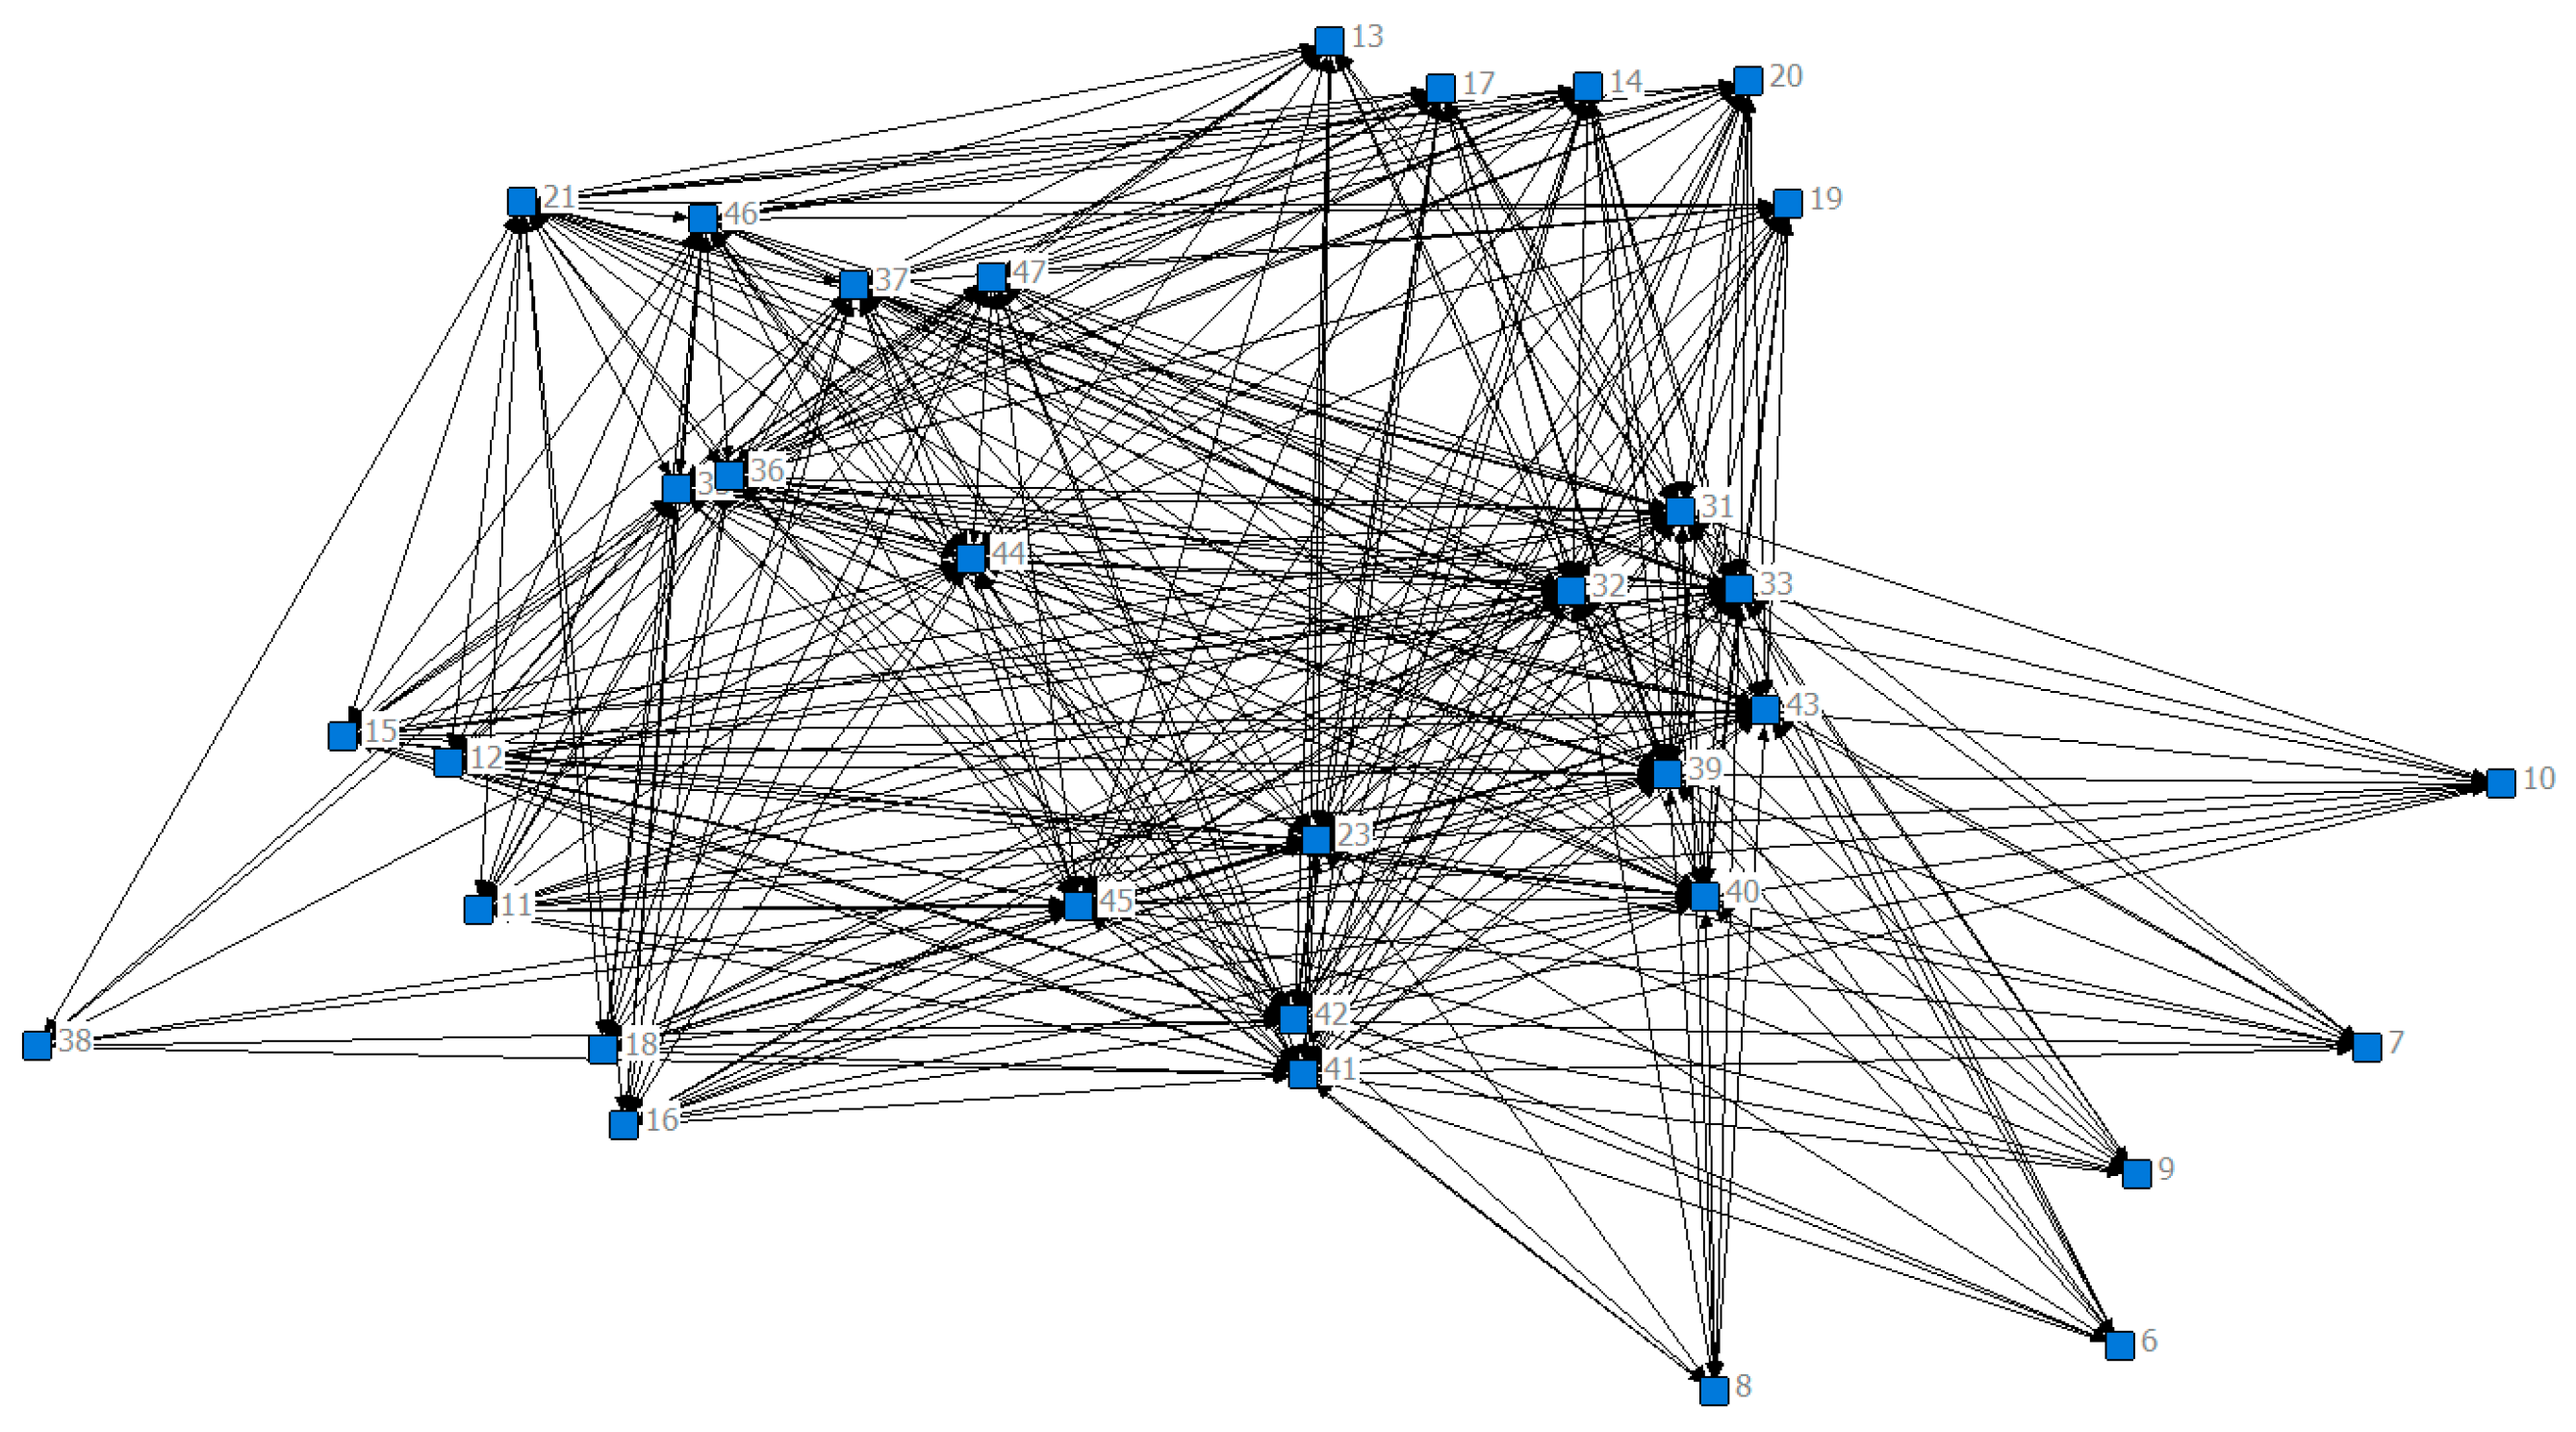
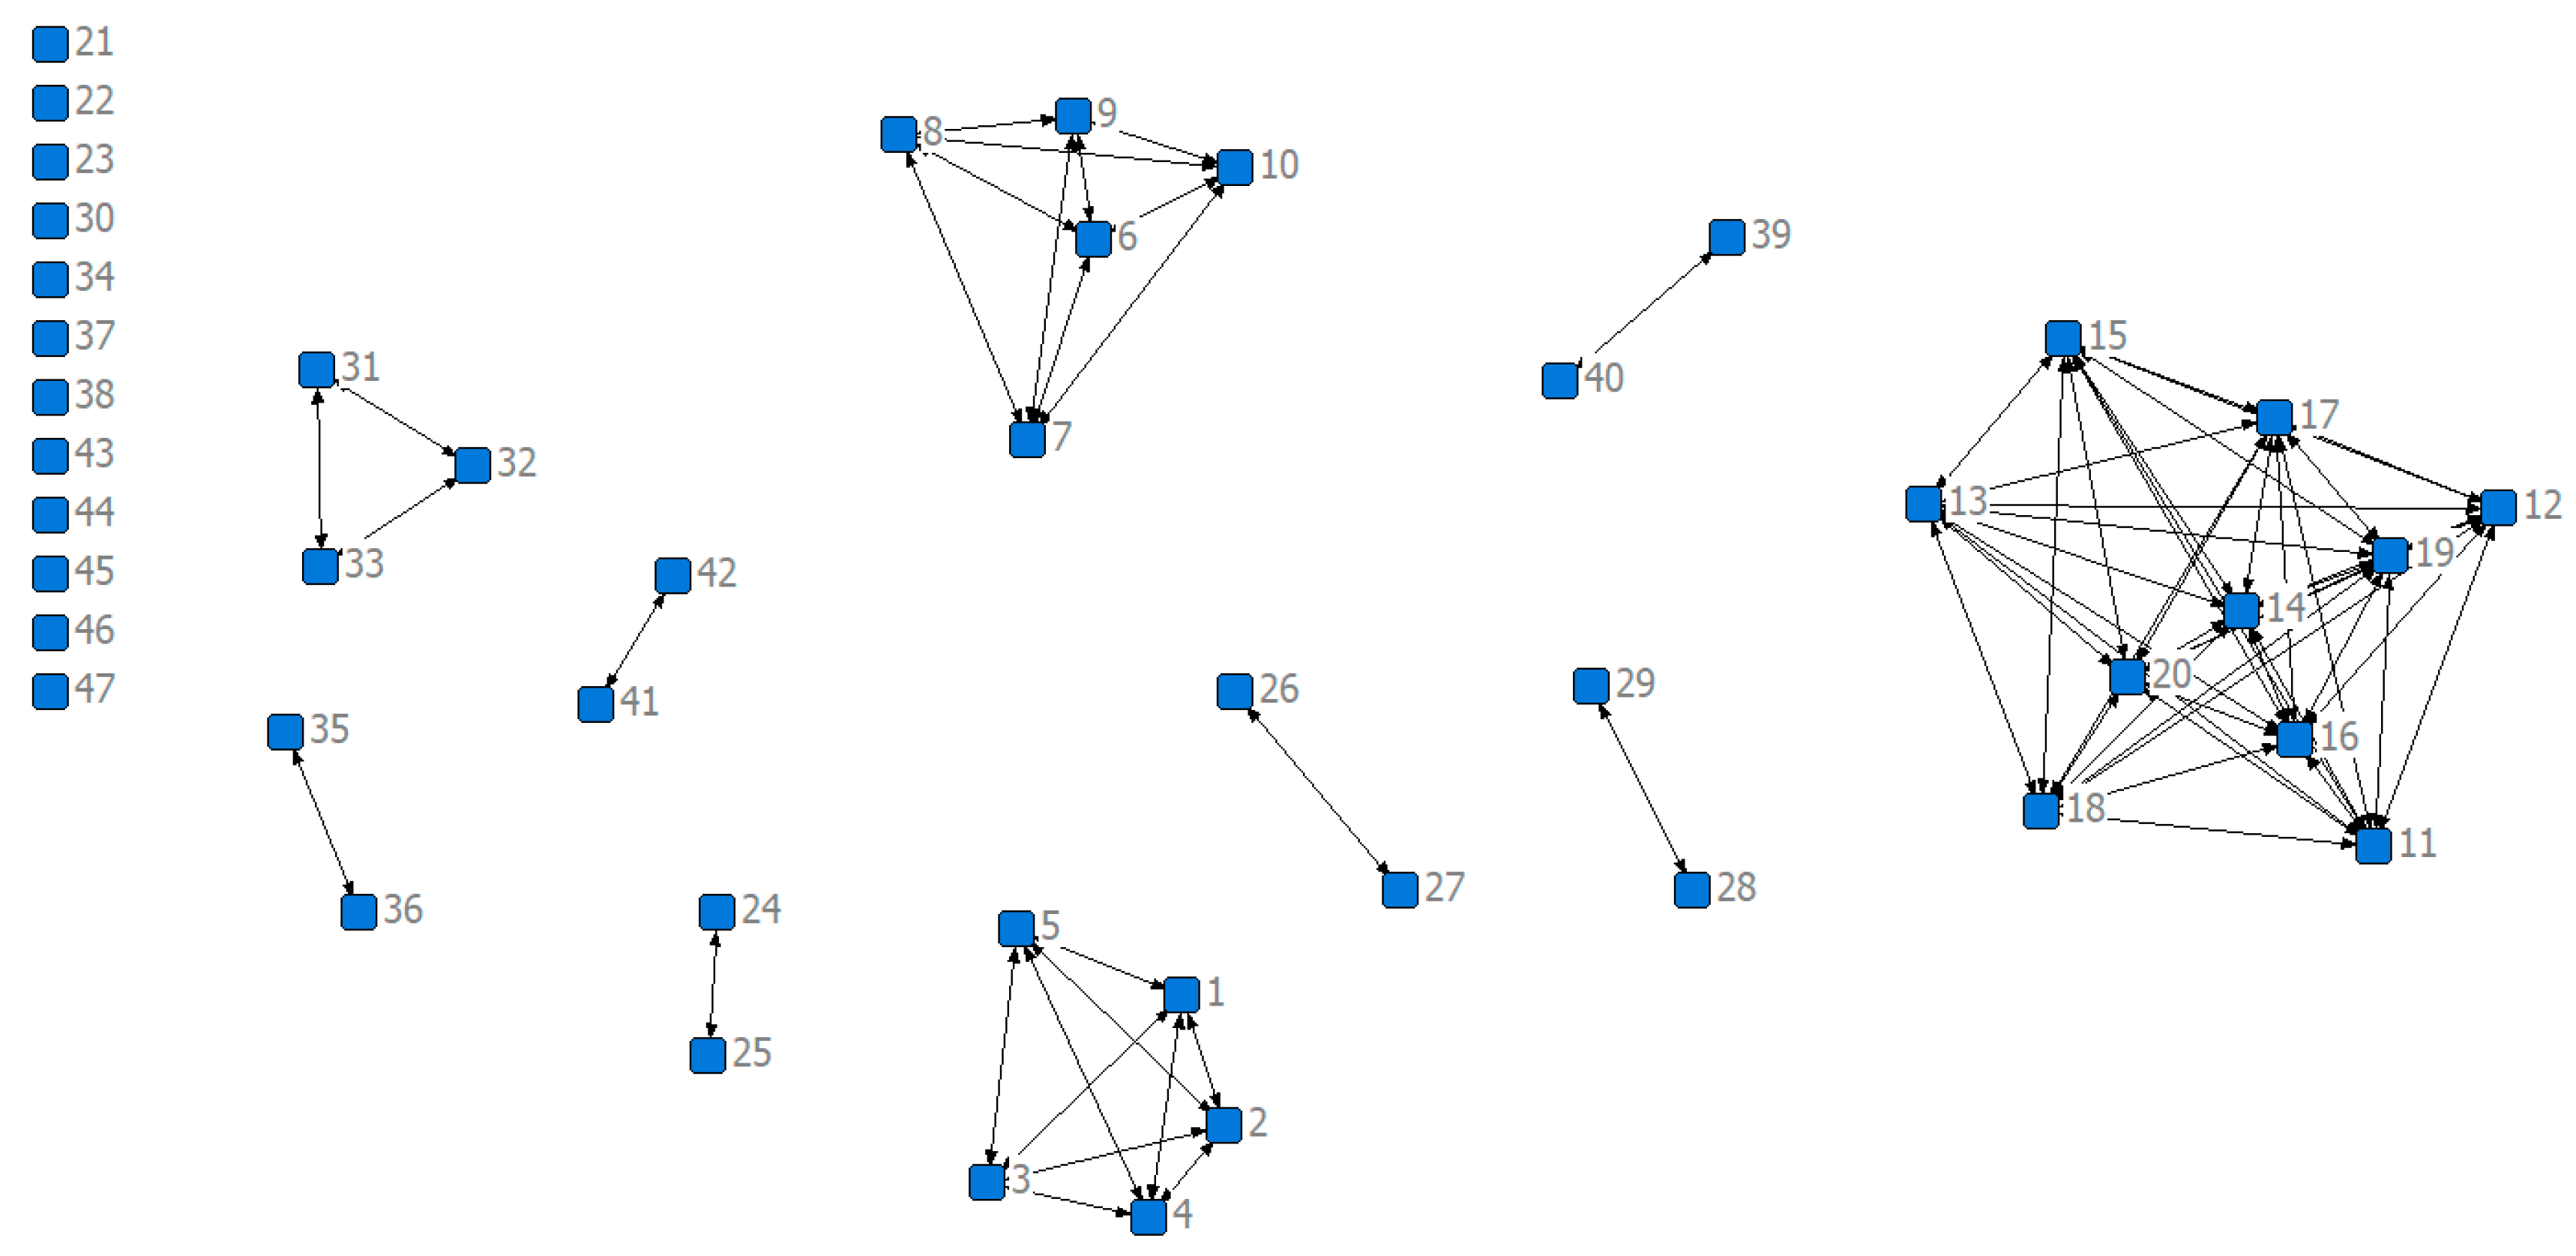
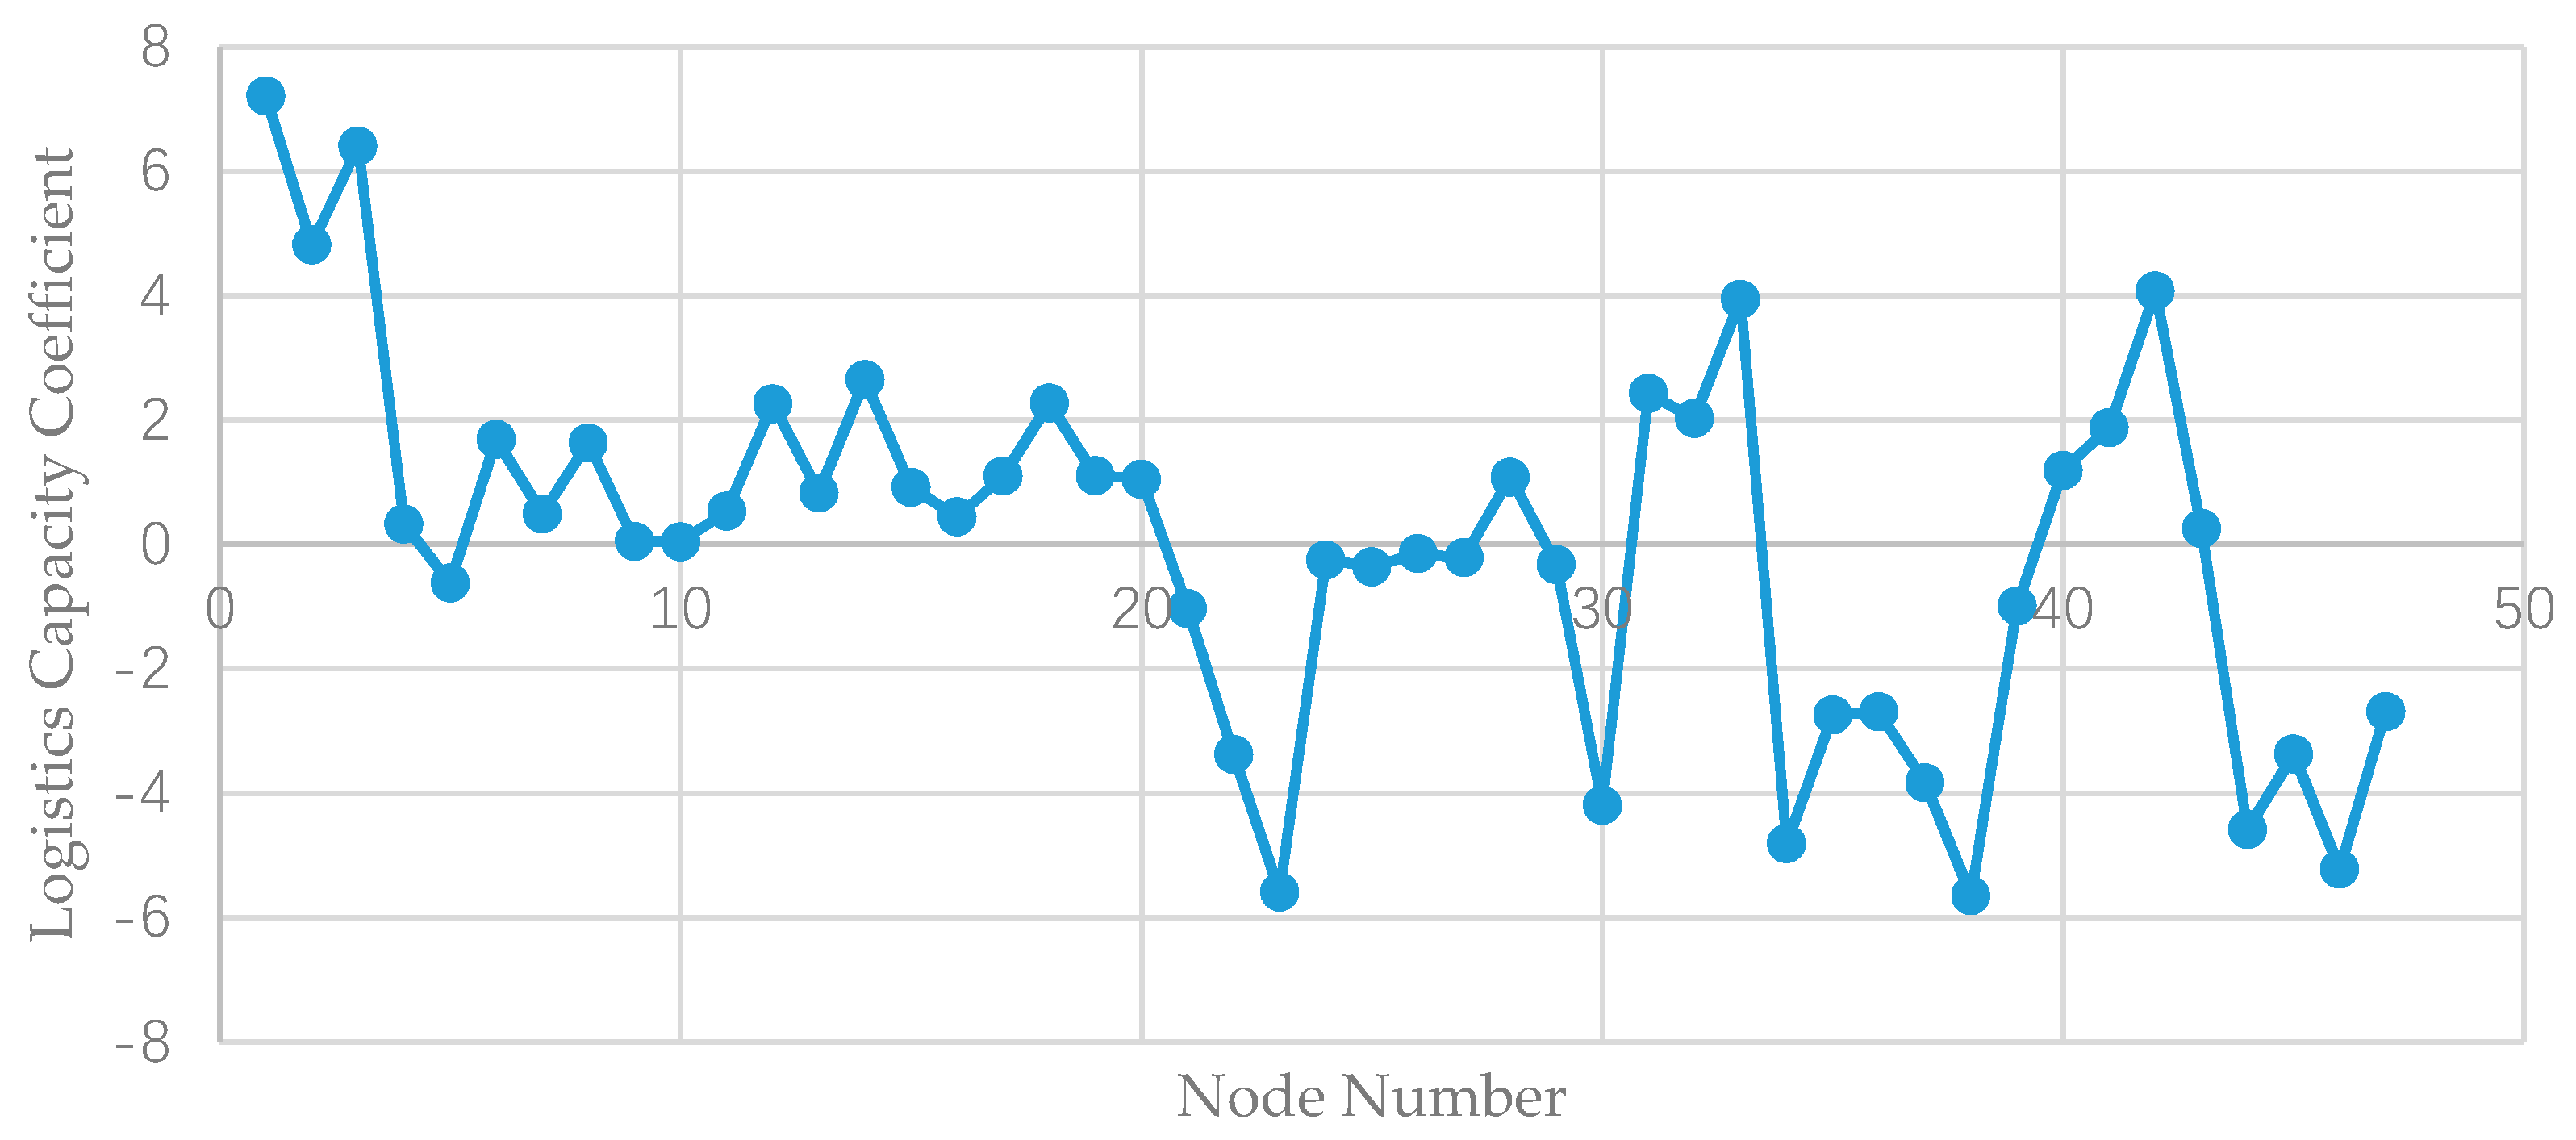
This paper mainly studies the characteristics of the transportation network, which is composed of the timber trading markets. On this basis, a reasonable method for determining the location and grade setting of the timber logistics center is proposed, which is also based on the transportation capacity and freight volume indicator. The research object is an alternative logistics center composed of 47 timber trading markets with a certain scale in China.

2. Methods

2.1. Basic Types of Networks

Networks can basically be divided into unweighted networks and weighted networks. The difference between the two types of networks is that the definition of the relationship between nodes is inconsistent, and the network uses the lines between nodes to express the relationship between them. The unweighted network divides the relationship between nodes into “yes” and “no”, corresponding to the numbers “1” and “0”, respectively, while the weighted network weights the distance between nodes as the relationship value.
The unweighted network is generally expressed as G ( V , E ) , where the V set represents the node, the node represents the distribution node in the distribution network and E represents the relationship set between the nodes. The weighted network is generally expressed as F ( V , W ) ; the element w i j in the relational matrix represents the weight added between nodes v i and v j , and w i j is greater than or equal to 0.

2.2. Basic Characteristics of Networks

Complex networks are abstract representations of real systems. To further analyze and optimize networks, it is necessary to measure and analyze their basic characteristics. The network studied in this paper is an undirected graph.
(1) Centrality
Centrality is the most basic indicator, which is generally recorded as Ki and includes relative centrality and absolute centrality. The centrality of node P is the number of other nodes directly connected with node P. The higher the centrality of a node, the more edges the node has with many nodes. The higher the centrality of a node in the transportation network, the better the transportation accessibility of that node in the network.
(2) Betweenness
Complex networks have betweenness of edges and nodes. The edge betweenness of edge ei refers to the number of shortest paths passing through the edge in a network. The betweenness of node vi refers to the number of shortest paths passing through node i in the network. If a certain node in the transportation network has a larger node number, then the hub type and betweenness of the node in the network are better. Similarly, the edge-to-edge number can reflect the importance of edges in the network and help distinguish between the advantages and disadvantages of paths. The edge-to-edge number is generally expressed by Bi.
(3) Node strength
Node strength is the concept of betweenness in weighted networks. The node strength of node P is the sum of the weights between other nodes directly connected with node P. The number of nodes adjacent to the node and the weights between adjacent nodes are considered, reflecting the comprehensive connection of the node. Generally, node strength is expressed as Si, and the connection of weighted networks is recorded. The join matrix is W, Ni denotes the node matrix edged with node i, and the formula for node strength is as follows.
S i = j N i W i j  
(4) Unit weight
Based on node strength and betweenness, the concept of unit weight is introduced, which is denoted as Ui, and is the ratio of node strength to betweenness. The formula used to reflect the comprehensive information of nodes and their adjacent nodes and to describe the connection relationship and weight of nodes in more detail is shown below. The unit weight indicator reflects the distance coefficient between nodes and other nodes in the transportation network. The larger the unit weight, the better the transportation performance of the nodes.
U i = S i K i
(5) Node difference
To distinguish between nodes with the same betweenness, node strength and unit weight, the concept of edge weight difference is proposed. By measuring the weights of each edge in the network, we can determine whether the neighboring edges of the node have the same edge weights or whether only a few edges have larger edge weights. Generally expressed as Yi, the formula is as follows. In the formula, Ni is combined with nodes with edge connections with node i. The indicator reflects the difference of the weights between nodes. The greater the difference of nodes, the better the transportation accessibility.
Y i = j N i ( W i j S i ) 2

2.3. Analysis Method for the Timber Logistics Transportation Network Based on a Complex Network

Problem Description

The timber logistics transportation network includes the routes between transportation nodes and nodes. The following assumptions are proposed before establishing the model:
(1)
The freight volume and transportation capacity of nodes are the main factors that affect the accessibility of the logistics transportation network.
(2)
The distance, route and time between nodes are based on the existing transportation network.
(3)
Intercity freight transportation mainly adopts the multimodal transportation of air and railway transportation, while highway transportation is used in the same city.
(4)
The freight capacity of each node (market) settled enterprise is equivalent, so the number of enterprises in the market is used as the indicator for measuring its freight capacity.
(5)
The direction of transportation is not considered in the course of transportation.

2.4. Transportation Network Models

The model in this paper has no objective or constraint conditions. The model is only a problem description and analysis method that uses a complex network to measure the characteristics of the network and express its transportation accessibility and freight demand.

2.4.1. Data Acquisition

Data mining technology in the era of big data is often based on computer frontier theories, such as machine learning and artificial intelligence. Common methods include classification models, regression analysis, clustering analysis, association rule analysis and web data mining.
Since the transportation analysis data in this paper include air, railway and highway transportation relationships among nodes, the relationship data, mileage and transportation time exist on many websites, including China Railway 12306, Variflight route map and others. To obtain data between nodes quickly, some of the data in this paper are obtained using the Python multiprocess crawler program.
The data in this paper are based on 47 nodes in three modes of transportation, namely, air, railway and highway transportation; their weighted and unweighted relation matrix; and the freight demand of each node. The initial data settings contains six 47 by 47 matrices, and combined with UCINET analysis, four transportation capacity indicators, freight demand indicators and the logistics capacity coefficients under three modes of transportation are obtained.

2.4.2. Complex Transportation Network Model

Based on the above assumptions, quantitative indicators should be introduced to analyze the transportation capacity, namely, the transportation accessibility between nodes, node centrality, unit distance between nodes and distance difference between nodes. These four indicators are determined by the degree of nodes, betweenness, unit weight and difference of nodes in complex networks.
The edge-connection relationship of nodes is transformed into an adjacency matrix, which is imported to Ucinet. The node degree and betweenness centrality for nodes of unweighted networks are measured with MATLAB. The transportation accessibility and node centrality of each node are calculated to provide data support for the measurement of weighted networks.
There is a long distance between the markets using air and railway transportation analysis, which is across provinces and cities; the transportation distance is directly proportional to the transportation cost. It is feasible to use the transportation distance and time as the relation matrix. However, the charging rules are simple between nodes in the same city, so it is easier to understand that the transportation cost is directly proportional to the transportation time.
In addition, to unify the indicator, the value of Wij adopts a similar weight, i.e., the larger the value of Wij, the closer the relationship between nodes. For the distance and time of transportation, reciprocal processing is carried out to obtain the F(V, W) matrix. Note that since there is not an obvious difference in speed between air transportation and highway transportation, the transportation distance is chosen as the original weight. The choice of railway transportation is diverse, and the speeds of ordinary trains and high-speed trains are quite different, so the transportation time is chosen as the original weight.
After processing, the relationship matrix is imported into Ucinet and combined with the characteristics of the unweighted network measurement. Matrix processing software is used to measure the indicator of the unit distance between nodes and the difference of the distance between nodes.

2.4.3. Freight Volume Analysis and Indicator Processing

Considering that the freight volume of each node is also an important factor that affects the logistics performance of the node, the freight volume is described by the number of enterprises in each market. Thus far, we can obtain the freight volume indicator and four transportation capacity indicators; namely, the transportation accessibility between nodes, the betweenness of nodes, the unit distance between nodes and the difference between nodes are obtained.
Since the characteristic value units of measurement are different, which is not conducive to direct operation, the data are required to be dimensionless. The specific indicator processing methods are as follows:
(1)
The four transportation indicators and freight volume indicators measured by Ucinet are processed by the Z-score to make them dimensionless.
(2)
The four indicators under the three modes of transportation are summed to obtain the corresponding transportation capacity value. Then, the comprehensive transportation capacity of each node is calculated by weighting the transportation capacities of railway and air and adding the transportation capacity of highway. Combined with the freight volume indicator, the logistics capacity coefficient of each node is obtained.
(3)
The city is selected as the unit to formulate the rules of network construction. The first 10% of cities are scored as the highest level, the second 20% of cities are scored as the second level, the next 30% of cities are scored as the third level and the last 40% of cities are scored as the fourth level. The node with the highest score is selected as the logistics center in each city.

3. Empirical Study of the Complex Structural Characteristics of the Timber Transportation Network

3.1. Problem Description

From the “China Timber Network”, 47 timber markets nationwide are used to build a timber logistics transportation network, which includes a total of 10 provinces, 19 prefectural-level cities and 3 municipalities. Among them, Guangzhou has the largest number of timber markets, at 20. The timber market numbers and details are shown in Table 1 below.
The transportation mode varies according to the timber product type. Based on the transportation network constructed using the 47 timber markets, this paper chooses three modes of transportation to analyze the transportation capacity of each node: highway, railway and air.

3.2. Analysis of the Complex Transportation Network Model

3.2.1. Analysis of the Air Transportation Network

Since there are a small number of rare timber products, including ebony, aloes, rosewood, yellow pear wood, etc., the safety of timber in the transportation process must be ensured. Therefore, air transportation is generally used. According to the specific location of each timber market and the scope of the city, it is necessary to determine whether there are air transportation resources. According to statistics, the air transportation conditions of the timber market are shown in Table 2 below (enumeration):
(1) Analysis of the Air Transportation Network
Based on domestic flights, the relationship between airports is transformed into an adjacent matrix G a , which is analyzed using Ucinet. The matrix diagram is shown in Figure 1. From the diagram, the timber markets in Dongguan and Jiaxing are not connected with other markets in terms of air transportation, which is because there is no air freight transportation condition in the cities where these timber markets are located. However, Shanghai, Wenzhou, Tianjin, Qingdao and other timber markets are located in the middle of the figure, which shows that there are many edge connections between these markets and other markets in terms of air freight transportation.
Through centrality and weighted measurement analysis, the node degree and betweenness centrality for each node of the air transportation network are determined. The characteristics are detailed in Table 3 (with the top 10 listed). In the table, Degree refers to the node degree of each node, nDegree refers to the relative node degree, Betweenness refers to the betweenness centrality of the node and nBetweenness refers to the relative betweenness centrality of the node.
(2) Analysis of Air transportation Distance Analysis
To ensure the indicator changes in the same direction, the reciprocal distance is taken. Since nearly all of the reciprocal data are decimals less than 1, they are multiplied by 10,000, which is convenient for calculation and observation, and the corresponding adjacency matrix G a is obtained. Some air transportation distance relationships are listed in Table 4.
By importing G a into Ucinet, the weighted network diagram of air transportation is obtained, as shown in Figure 2, which adds distance as the edge weight on the basis of Figure 1.
Through centrality and weighted measurement analyses, the node strength of the air transportation network is determined to calculate the unit weight of the nodes and the difference of the nodes. The characteristic details are shown in Table 5 (enumeration). In the table, Degree refers to the node strength of each node, nDegree refers to the relative node strength, Unit Weight refers to the unit weight of each node and Node Difference refers to the weight difference of each node edge.
(3) Analysis of the Node Integrated Air transportation Capability
The above analysis can be used to obtain four indicators: transportation accessibility, node centrality, unit distance between nodes and the difference between nodes in the air transportation network. The original data are standardized, and the values are weighted to determine the comprehensive ability score.
The dimensionless data are detailed in Table 6 (retaining the four decimal places and ranking them in descending order according to the comprehensive weight, listing the top ten).

3.2.2. Analysis of the Railway Transportation Network

Most of timber transportation does not use air transportation, except for a few rare varieties; it mainly uses railway, highway and waterway (only three markets including timber port are involved in this paper, which lacks certain practical significance, so waterway transportation is temporarily not considered). According to statistics, the railway conditions of 47 timber markets are shown in Table 7.
(1) Analysis of Railway Transportation Network
Using the network crawler technology, the domestic railway shift situation is obtained, and the relationship between shifts is transformed into the adjacent matrix G r . The matrix diagram is obtained by Ucinet software analysis, and the node degree and betweenness centrality for each node are calculated.
(2) Analysis of Railway Transportation Distance
To ensure the indicator changes in the same direction, the reciprocal of time is taken and transformed into the corresponding adjacency matrix G r . Ucinet is used to calculate the unit weight of nodes and the differences of nodes.
The detailed data after dimensionless processing are shown in Table 8 (retaining the last four decimal places and listing the top 10 in descending order of comprehensive weight).

3.2.3. Highway Transportation Network Analysis

For different timber markets in the same city, because the distance is relatively close, highway transportation is used. The highway transportation indicators analyzed are used to measure the advantages and disadvantages of the timber market under the jurisdiction of the same city.
(1) Analysis of the Highway Transportation Network
Using the network crawler technology, the domestic highway shift is obtained, and the relationship between shifts is transformed into the adjacency matrix G h . The matrix diagram is obtained by Ucinet software analysis, as shown in Figure 3. The node degree and betweenness centrality for each node are calculated.
(2) Analysis of Highway transportation Distance
To ensure the indicator changes in the same direction, the reciprocal distance is taken and transformed into the corresponding adjacency matrix G h ′. Ucinet is used to calculate the unit weight of nodes and the difference of nodes.
The measured characteristic data are shown in Table 9 (the top 10 enumeration numbers). Since the betweenness values are all equal to 0, they are not listed. Among them, K i ,   S i ,   U i   a n d   Y i represent the difference of centrality, node strength, unit weight and edge weight, respectively; K, U, Y and T represent centrality, unit weight, edge weight difference and comprehensive weights, respectively, after standardization.

3.3. Analysis of the Logistics Capacity Coefficient Combined with the Freight Volume

It is difficult to obtain data for timber turnover because the information level of the timber market is low. According to research, the market scale and timber turnover of enterprises in each market are similar and the number of enterprises in the market is proportional to the freight volume in a sense, so it is relatively feasible to replace the freight volume of each market with the number of enterprises in the market.
The number of enterprises stationed in each market is shown in Table 10. As an indicator to measure the freight volume in each market, P is the value after standardization of the number of enterprises located in each market.
The comprehensive weights of the three modes of transportation are obtained through the above calculation and analysis. Weighted for railway and air transportation, according to the data from the official website of the National Bureau of Statistics in 2018, the railway freight volume is 4.03 billion tons and the air freight volume is 7.39 million tons, i.e., railway transportation accounts for 99.82% and air transportation accounts for 0.18%. Therefore, the comprehensive weights of air and railway transportation combined with the comprehensive weight of highway transportation are used to analyze the comprehensive transportation indicators of each timber market. It is reflected by the transportation capability coefficient.
The final determination of the logistics capacity coefficient is obtained by weighting the transportation capacity indicator and the freight volume indicator. Logistics capacity coefficients of different timber centers in the same city, which are obtained according to the ranking of highway comprehensive weights, are shown in Table 11 (listing the top ten).
A scatter plot of the logistics capacity coefficient of each node is shown in Figure 4.

3.4. Grade Setting of the Timber Logistics Center

Node is the 47 timber trading markets discussed in this paper, covering 22 cities. The number of prefecture-level or municipality directly under the central government and the number of each market are shown in Table 12.
The logistics capacity is measured for each city. The logistics capacity coefficient is the average value of the logistics capacity coefficients of all timber trading markets in the city. The data are shown in Table 13 below.
The rules for network construction are formulated. The first 10% of cities have the highest grade, the second 20% of cities have the second grade, the third 30% of cities have the third grade and the last 40% of cities have the fourth grade. The nodes with the highest score are selected as logistics centers in each city.
According to Table 13, Dongguan and Shanghai are established as first-level logistics center cities. According to the logistics capacity coefficients of different nodes in the city, No. 1 node, Dongguan Houjie·Xingye Timber Market, is set as the timber logistics center of Dongguan City and the No. 42 node, Shanghai Baoshan Furen Timber Market, is set as the timber logistics center of Shanghai. Similarly, Tianjin, Guangzhou, Foshan, Suzhou and Beijing are established as secondary logistics center cities. The logistics centers are: 33 Tianjin Beichen District Hanjiashu Timber Market, 14 Guangdong Guangzhou Yuzhu International Timber Market, 6 Foshan Shunde ShuiTeng Timber Market, 28 Zhangjiagang Timber Exchange Market and 43 Beijing Dongba Imported Timber Market. Then, Shijiazhuang, Huzhou, Jiaxing, Hangzhou, Nanchang, Qingdao and Hulunbuir are established as third-tier logistics center cities, whose logistics centers are 40 Shijiazhuang City Timber Trading Market, 26 Huzhou Nanxun Building Materials Market, 24 Jiaxing Jiashan International Timber Market, 21 Hangzhou Timber Trading Market and 47 Jiangxi Jinxian Wengang Wild Chicken Cage Timber Market, 36 Qingdao Licang District Wantou First Timber Market and 45 Inner Mongolia Manzhouli City Timber Market. Finally, Shaoxing, Changsha, Zhenjiang, Mudanjiang, Dezhou, Fuyang, Wenzhou and Yueyang are established as fourth-tier logistics center cities, and their logistics centers are 22 Shaoxing Tashan Timber Market and 37 Hunan Changsha Zhongnan Timber Market, 30 Zhenjiang Yangzhong Venus Timber Market, 44 Heilongjiang Suifenhe Imported Timber market, 34 Shandong Dezhou Timber Market, 46 Anhui Jieshou Lvzhai Timber Market, 23 Wenzhou Timber Exchange Market and 38 Yueyang City Sun Bridge Building Materials Market.
This paper constructs a timber logistics network with Dongguan and Shanghai as the first-level logistics centers; Tianjin, Guangzhou, Foshan, Suzhou, Beijing as the second-level logistics centers, Shijiazhuang; Huzhou as the third level logistics center and the remaining eight cities as the fourth level logistics centers.
The functions of the logistics center mainly include concentrating freight, distribution processing, circulation processing, transportation, storage, transfer, information service, etc. The first-level logistics centers should have all these functions, while the second-level logistics centers contain at least four functions, the third level logistics center has more than two functions and the fourth level logistics centers contain at least one function. Through the organic connection between the logistics center and the corresponding timber market, the circulation speed of timber logistics can be accelerated, the circulation time can be shortened and the circulation cost can be reduced. In addition, according to the needs of the appropriate processing, rational use of the source of goods can improve economic efficiency.
As the first and second logistics centers, seven cities have high logistics capacity coefficients. These cities are mainly concentrated in the Yangtze River Delta, Pearl River Delta and Bohai rim, among which Shanghai, Dongguan and Suzhou are all members of China’s superior timber market. These areas are the regions undergoing rapid development of the timber processing industry in China. Their economic development is very active, and private and foreign enterprises are concentrated in these regions. These areas are the first choice for foreign enterprises to set up factories in China. The region has a strong economic strength and a good economic foundation. The total production and consumption of timber processing and its products are among the best in the country. This region is an important production base for wood-based panels as well as wood and wood bamboo flooring products in China. These areas easily form industrial clusters, which is helpful to promote the growth of the regional economy. In addition, more than 55% of China’s timber consumption is dependent on foreign countries. These cities are located in the main port for imported timber and the areas surrounding the port. Imported timber forms a large timber trading market, log processing and timber logistics gathering area nearby. In the future, advanced technologies such as big data can be used to reasonably analyze the fluctuation of the domestic market, which also can adopt the operation mode of cross-border e-commerce according to market demand. On one hand, it can reduce the trade cycle of timber purchasing and transportation. On the other hand, it can reduce the storage cost according to market demand. It is of great significance to set up timber logistics centers in these locations, which can play an effective role in linking the market together.
As the third level logistics centers, seven cities are distributed in Hebei, Zhejiang, Jiangxi, Shandong, Neimenggu and other regions. The timber processing industry in these regions is relatively developed. As the main cities in Eastern China, the timber processing industry shows strong development potential. There is a certain distance from the main timber import port; it can be used as a powerful supplement to the first and second logistics centers to promote the development of the timber market.
In addition, as transitional cities between the East and the West, eight level four logistics centers have begun to transfer the manufacturing industry to these regions in recent years. Due to the rising comprehensive costs of land, labor and raw materials, environmental protection requirements, such as industrial transfer, can not only promote the local economic development but also facilitate the use of processing and manufacturing space in the central and western regions. All of these make this area have the advantages of low labor costs and close-to-plantation resources, which is a powerful guarantee for the development of the timber industry.

4. Comparative Analysis with Other Methods

In this paper, the complex network method is used to analyze and weight three kinds of timber transportation modes, so that we can get the transportation capability coefficient, and know the initial location of the timber logistics center. Then, with the comprehensive weighted analysis of freight volume, we can get the method of setting the level of logistics center. The main methods of the logistics center location and the application research results of complex network method in location selection are compared with the previous research methods, which are shown in Table 14 below:
Compared with previous studies, this method avoids the location results caused by subjective qualitative analysis or quantitative calculation, which may be unreasonable in practice. On the basis of the existing position of the timber trading market, this paper uses the complex network theory to evaluate the importance of transportation network nodes, which is of great practical significance. The method can greatly reduce the cost and risk of initial research when selecting the location of the logistics center, and the location is close to the timber demand market. In this way, we can use a reasonable transportation mode to carry out logistics transportation and other related businesses. Due to the particularity of timber itself, the location of timber supply is concentrated in some regions of the country, but the demand location is relatively scattered. Therefore, we need to make full use of the role of different levels of logistics centers in the regional logistics network. In addition, with the help of modern technology such as big data, it can be applied to the node characteristics of complex networks, which makes data analysis more reliable. For the first- and second-level logistics centers, we should increase investment and focus on management, so that their services can reach the third and fourth level logistics centers as much as possible, and gradually form a point axis system to promote the development of regional and even national timber logistics.

5. Conclusions

This paper put forward the analysis model and the method of the timber transportation network based on 47 timber trading markets in China, from data acquisition, data processing and data visualization, to analyze transportation network characteristics and establish indicators based on the complex network. Through comprehensive consideration of the transportation network and freight volume, the logistics capacity coefficient of each node is set, and finally, the logistics transportation network center node is determined to realize the grade setting of the logistics center, which provides a new idea for the location of the timber logistics center.
The model and analysis methods proposed in this paper are not only suitable for the reasonable layout of the transportation network and logistics center nodes of timber logistics enterprises but also helpful for the government to consider timber logistics policies, which can save resources and promote the sustainable development of society. Of course, in practice, these analyses should be combined with the specific geographical location of the timber trading market, changes in the surrounding economic environment, national and local government policies and macro development planning to establish the level and scale of the timber logistics center.
In practice, due to the lack of data in a certain field or the difficulty of statistics, it is not easy to obtain theoretical verification of the centrality and grade evaluation of the relevant transportation network nodes. With the help of the connectivity of each transportation mode between nodes in the existing transportation network, as well as the actual or equivalent transportation volume of the corresponding market between nodes, reasonable explorations and assumptions can be performed comprehensively. In this way, useful references for the transportation network of people or freight in the same city and inter-city can be provided in terms of finding the central node and corresponding level setting.
In addition, for the selection of indicators in transportation network analysis, the weighting methods of railway and air transportation and the selection of timber transportation nodes, we hope to have more appropriate methods to obtain relevant information in the future.

Author Contributions

X.H. is responsible for data collection and co-ordination. L.X. provided an interpretation of the results and wrote the majority of the paper. Y.W. collects data and completes the calculation and collation of some data. X.Y. contributed to the paper review and editing. Y.Z. contributed to the paper review and editing. All authors have read and agreed to the published version of the manuscript.

Funding

This research was funded by National Natural Science Foundation of China (grant no. 71701099) and Basic Research Program of Science and Technology Commission Foundation of Jiangsu Province (grant no. BK20180775).

Acknowledgments

The authors would like to express their sincere thanks to the anonymous reviewers for their constructive comments on an earlier version of this manuscript.

Conflicts of Interest

The authors declare no conflicts of interest.

References

  1. Sun, H.; Gao, Z.; Wu, J. A bi-level programming model and solution algorithm for the location of logistics distribution centers. Appl. Math. Model. 2008, 32, 610–616. [Google Scholar] [CrossRef]
  2. Marković, G.; Gašić, M.; Kolarević, M.; Savković, M.; Marinković, Z. Application of the MODIPROM method to the final solution of logistics centre location. Transport 2013, 28, 341–351. [Google Scholar] [CrossRef]
  3. Önden, İ.; Acar, A.Z.; Eldemir, F. Evaluation of the logistics center locations using a multi-criteria spatial approach. Transport 2016, 33, 322–334. [Google Scholar] [CrossRef] [Green Version]
  4. Zhang, Y.; Zhang, Y.; Li, Y.; Liu, S.; Yang, J. A Study of Rural Logistics Center Location Based on Intuitionistic Fuzzy TOPSIS. Available online: https://www.hindawi.com/journals/mpe/2017/2323057/ (accessed on 16 February 2020).
  5. Guimaraes, V.D.; Ribeiro, G.M.; do Forte, V.L.; Lucena, A. A location-allocation model for Logistics Integration Centers. Int. J. Transp. Econ. 2017, 44, 273–292. [Google Scholar]
  6. Zhao, S.X. A study on the Location Determinants and Performance of Pharmaceutical industry’s Logistics Center. J. Korea Res. Assoc. Int. Commer. 2018, 18, 145–166. [Google Scholar]
  7. Mousavi, S.M.; Antuchevičienė, J.; Zavadskas, E.K.; Vahdani, B.; Hashemi, H. A new decision model for cross-docking center location in logistics networks under interval-valued intuitionistic fuzzy uncertainty. Transport 2019, 34, 30–40. [Google Scholar] [CrossRef] [Green Version]
  8. Xia, Y.; Hill, D. Optimal capacity distribution on complex networks. Epl (Europhys. Lett.) 2010, 89, 58004. [Google Scholar] [CrossRef]
  9. Cardillo, A.; Gómez-Gardeñes, J.; Zanin, M.; Romance, M.; Papo, D.; Del Pozo, F.; Boccaletti, S. Emergence of network features from multiplexity. Sci. Rep. 2013, 3, 1344–1349. [Google Scholar] [CrossRef] [PubMed] [Green Version]
  10. Couto, G.S.; Silva, A.P.; Ruiz, L.B.; Benevenuto, F. Structural Properties of the Brazilian Air Transportation Network. An. Da Acad. Bras. De Ciências 2015, 87, 1653–1674. [Google Scholar] [CrossRef] [PubMed] [Green Version]
  11. Sun, Y.; Mburu, L.; Wang, S. Analysis of community properties and node properties to understand the structure of the bus transport network. Phys. A Stat. Mech. Its Appl. 2016, 450, 523–530. [Google Scholar] [CrossRef]
  12. Ducruet, C. Multilayer dynamics of complex spatial networks: The case of global maritime flows (1977–2008). J. Transp. Geogr. 2017, 60, 47–58. [Google Scholar] [CrossRef] [Green Version]
  13. Yu, W.; Chen, J.; Yan, X.C. Space‒Time Evolution Analysis of the Nanjing Metro Network Based on a Complex Network. Sustainability 2019, 11, 523. [Google Scholar] [CrossRef] [Green Version]
  14. Zhang, L.; Hao, J.; Ji, X.; Liu, L. Research on the Complex Characteristics of Freight Transportation from a Multiscale Perspective Using Freight Vehicle Trip Data. Sustainability 2019, 11, 1897. [Google Scholar] [CrossRef] [Green Version]
  15. Shi, W.Y.; Zhang, K.M.; Hua, G.W. The Study on Site Selection of Coal Distribution Center based on Logistics Green Grade. In Proceedings of the 1st International Conference on Logistics, Informatics and Service Science (LISS 2011), Beijing, China, 8–11 June 2011; Insticc-inst Syst Technologies Information Control & Communication: Setubal, Portugal, 2011; pp. 28–34. [Google Scholar]
  16. Yang, F.; Zhao, Z.B.; Jiang, T.Y.; Dong, Y.C. Evaluation Research on Military Logistics Distribution Center Based on SVM. In Proceedings of the 5th International Symposium on Knowledge Acquisition and Modeling (KAM), London, England, 27–28 June 2015; Atlantis Press: Paris, France, 2015; pp. 210–212. [Google Scholar]
  17. Wu, Z.B.; Xu, J.P.; Xu, Z.S. A multiple attribute group decision making framework for the evaluation of lean practices at logistics distribution centers. Ann. Oper. Res. 2016, 247, 735–757. [Google Scholar] [CrossRef]
  18. Chen, J.H. Establishment on Evaluation Index System for Urban Logistics Center Location Scheme. In Proceedings of the 5th International Education, Economics, Social Science, Arts, Sports and Management Engineering Conference (IEESASM), Qingdao, China, 28–29 December 2017; Atlantis Press: Paris, France, 2017; pp. 555–559. [Google Scholar]
  19. Liu, B.H.; Li, J.; Zheng, S.D. Competitiveness Evaluation of Pharmaceutical Logistics Centres Based on Combined Weight and Cumulative Prospect Theory. In Proceedings of the 4th International Conference on Environmental Science and Material Application (ESMA), Xian, China, 15–16 December 2018; IOP Publishing LTD: Bristol, England, 2019. [Google Scholar]
  20. Li, X.; Wang, Y. Evaluation of the Operation System of the Sales Logistics Distribution Center in Steel Enterprises Based on AHP. In Proceedings of the 1st International Symposium on Management and Social Sciences (ISMSS), Wuhan, China, 13–14 April 2019; Atlantis Press: Paris, France, 2019; pp. 44–48. [Google Scholar]
  21. Lin, Y.H.; Chen, Q.Y.; Qiu, R.Z. Visual supervision of wood transport behavior based on K-means clustering. J. Qinghai Norm. Univ. (Nat. Sci. Ed.) 2016, 32, 54–59. [Google Scholar]
  22. Long, T.; Pan, H.X.; Ma, P.; Shi, X.L. Dynamic Analysis of International Wood Forest Products Trade Based on Complex Network. Explor. Econ. Issues 2016, 182, 170–175. [Google Scholar]
  23. Lin, Y.Y.; Qiu, R.Z. Analysis and design of wood logistics network optimization system. For. Eng. 2017, 87–91. [Google Scholar]
  24. Sarrazin, F.; LeBel, L.; Lehoux, N. Analyzing the impact of implementing a logistics center for a complex forest network. Can. J. For. Res. 2019, 49, 179–189. [Google Scholar] [CrossRef]
  25. Long, T.; Pan, H.; Dong, C.; Qin, T.; Ma, P. Exploring the competitive evolution of global wood product trade based on complex network analysis. Phys. A Stat. Mech. Its Appl. 2019, 525, 1224–1232. [Google Scholar] [CrossRef]
Figure 1. Unweighted network diagram of air transportation.
Information 11 00107 g001
Figure 2. Weighted network diagram of air transportation.
Information 11 00107 g002
Figure 3. Unweighted network diagram of highway transportation.
Information 11 00107 g003
Figure 4. Logistics capacity coefficient of each node.
Information 11 00107 g004
Table 1. Details of 47 timber markets.
Node NumberTimber Market Name
1Dongguan Houjie·Xingye Timber Market
2Dongguan Jiaye Timber Market
3Dongguan Houjie·Oriental Xingye City
4Guangdong Dongguan Jilong Timber Market
5Dongguan Chashan Fengye Timber Market
6Foshan Shunde ShuiTeng Timber Market
7Foshan Big Turn Splint Market
8Foshan Shunde Asia Pacific Timber Market
9Foshan Shunde Longshan Decorative Materials Market
10Guangdong Foshan Nanhai Bomei Market
11Guangzhou Xintang Yueshun Decoration Materials City
12Guangzhou Tianma Decoration Materials Market
13Guangzhou Panyu Wuzhou Decoration World
14Guangdong Guangzhou Yuzhu International Timber Market
15Guangzhou Yangcheng Decorative Materials Market
16Guangzhou Xilong Building Materials Market
17Guangzhou B&Q Building Materials Supermarket
18Guangzhou Tianjian Decoration Materials Market
19Guangzhou Anhua Decorative Materials Market
20Guangzhou Yiheng Timber Market
21Hangzhou Timber Trading Market
22Shaoxing Tashan Timber Market
23Wenzhou Timber Exchange Market
24Jiaxing Jiashan International Timber Market
25Jiaxing Jiashan·Oriental Xingye City
26Huzhou Nanxun Building Materials Market
27Huzhou Timber Market
28Zhangjiagang Timber Exchange Market
29Taicang City Port District Huachen Logistics Center
30Zhenjiang Yangzhong Venus Timber Market
31Tianjin Xinzhong Building Materials Trade Market
32Tianjin Bohai Bay Timber Market
33Tianjin Beichen District Hanjiashu Timber Market
34Shandong Dezhou Timber Market
35Qingdao Jiaozhou Timber Market
36Qingdao Licang District Wantou First Timber Market
37Hunan Changsha Zhongnan Timber Market
38Yueyang City Sun Bridge Building Materials Market
39Shijiazhuang Zhengding Hengshan Plate Market
40Shijiazhuang City Timber Trading Market
41Shanghai Jiading District Donghua Global Building Materials Market
42Shanghai Baoshan Furen Timber Market
43Beijing Dongba Imported Timber Market
44Heilongjiang Suifenhe Imported Timber market
45Inner Mongolia Manzhouli City Timber Market
46Anhui Jieshou Lvzhai Timber Market
47Jiangxi Jinxian Wengang Wild Chicken Cage Timber Market
Table 2. Air transportation conditions in 47 timber markets (enumeration).
Node NumberCity NameAir Transportation ConditionsNode NumberCity NameAir Transportation Conditions
6FoshanFoshan Shadi Airport30ZhenjiangNo Airport
7FoshanFoshan Shadi Airport31TianjinTianjin Binhai Airport
10FoshanFoshan Shadi Airport34DezhouNo Airport
11GuangzhouGuangzhou Baiyun Airport35QingdaoQingdao Liuting Airport
13GuangzhouGuangzhou Baiyun Airport37ChangshaChangsha Huanghua Airport
14GuangzhouGuangzhou Baiyun Airport38YueyangYueyang Sanhe Airport
16GuangzhouGuangzhou Baiyun Airport40ShijiazhuangShijiazhuang Zhengding Airport
17GuangzhouGuangzhou Baiyun Airport41ShanghaiShanghai Hongqiao Airport
19GuangzhouGuangzhou Baiyun Airport43BeijingBeijing Capital Airport
21HangzhouHangzhou Xiaoshan Airport45Hulun BuirWestern suburbs of Manchuria
22ShaoxingNo Airport46FuyangFuyang Xiguan Airport
23WenzhouWenzhou Longwan Airport47NanchangNanchang Changbei Airport
Table 3. Node degree and betweenness centrality of the air transportation unweighted network.
Node Number Degree   ( K i ) nDegree Betweenness   ( B i ) nBetweenness
10.0000.00000
20.0000.00000
30.0000.00000
40.0000.00000
50.0000.00000
610.0000.2170.4560.044
710.0000.2170.4560.044
810.0000.2170.4560.044
910.0000.2170.4560.044
1010.0000.2170.4560.044
Table 4. Air transportation distance relationships (Unit: km).
DistanceNode Number
62021233335
Node Number600094719090
20001099101519101867
2101099001133792
2394710150015451102
3319091910113315450477
350186779211024770
Table 5. Node strength, unit weight and node difference of the air transportation weighted network.
Node Number Degree   ( S i ) nDegree Unit   Weight   ( U i ) Node   Difference   ( Y i )
661.1740.0516.11740.10904
16123.5460.1037.2674120.072937
220000
23315.3590.26310.511970.038922
31248.8070.2088.8859640.053532
35257.0280.21510.281120.05123
37273.9330.22911.413880.047883
3880.9440.06810.1180.141036
39246.4170.2069.1265560.054719
40246.4170.2069.1265560.054719
41284.5560.2389.48520.039101
42284.5560.2389.48520.039101
43182.1360.1527.0052310.045508
45124.4200.1044.4435710.040796
46248.8380.20811.310820.050837
47270.5480.22611.762960.049055
Table 6. Structural characteristics and comprehensive weights of the air transportation network.
Node Number Degree   ( K ) Betweenness (B) Unit   Weight   ( U ) Node   Difference   ( Y ) Comprehensive Weights (T)
231.40072.09101.1711−0.22544.4373
411.40072.19030.9198−0.22074.2901
421.40072.19030.9198−0.22074.2901
311.22081.65160.77320.15963.8052
321.22081.65160.77320.15963.8052
331.22081.65160.77320.15963.8052
391.13091.49030.83210.19083.6441
401.13091.49030.83210.19083.6441
431.04091.61340.3130−0.05192.9155
451.22082.0326−0.3137−0.17602.7637
Table 7. Railway transportation conditions in 47 timber markets.
Node NumberRailway StationNode NumberRailway StationNode NumberRailway StationNode NumberRailway Station
1Dongguan13Guangzhou South25JiaXing37Changsha West
2Dongguan14Guangzhou East26Huzhou38Yueyang East
3Dongguan15Guangzhou West27Huzhou39Shijiazhuang North
4Dongguan East16Guangzhou North28Suzhou North40Shijiazhuang North
5Dongguan17Guangzhou East29Suzhou North41Shanghai West
6Foshan18Guangzhou East30Zhenjiang42Shanghai West
7Foshan19Guangzhou31Tianjin North43Beijing East
8Foshan20Guangzhou west32Tianjin44Mudanjiang
9Foshan21Hangzhou33Tianjin West45Manzhouli
10Foshan22Shaoxing34Dezhou46Fu-Yang
11Guangzhou East23Wenzhou South35Qingdao North47Nam Cheong
12GuangZhou East24JiaXing36Qingdao North
Table 8. Structural characteristics and comprehensive weights of the railway transportation network.
Node Number Degree   ( K ) Betweenness (B) Unit   Weight   ( U ) Node   Difference   ( Y ) Comprehensive Weights (T)
331.77733.2841−0.86860.29194.4847
321.77733.2841−1.0086−0.98683.0661
311.77733.2841−0.9997−1.01383.0479
431.34671.7569−0.81470.32732.6162
211.23910.9607−0.4172−0.03071.7518
421.02380.4129−0.50160.50341.4385
411.02380.4129−0.49420.45581.3983
471.56201.1924−0.9599−1.33030.4643
150.0550−0.21400.61770.00400.4627
160.0550−0.21400.61770.00400.4627
Table 9. Structural characteristics and comprehensive weights of the highway network.
Node Number K i S i U i Y i KUYComprehensive Weights (T)
14208.94652.23650.67150.25124.09460.49394.8396
24204.78851.1970.69360.25123.99940.54334.7939
3466.916.7250.37260.25120.8443−0.17370.9218
4423.5795.89480.25310.2512−0.1469−0.4406−0.3363
5416.7334.18330.25210.2512−0.3036−0.4428−0.4951
6478.50519.62630.54070.25121.10990.20181.5628
7432.6428.16050.46570.25120.06050.03430.3460
8483.41420.85350.50550.25121.22220.12311.5966
9441.06110.26530.37460.25120.2531−0.16920.3352
10432.7968.1990.46240.25120.06400.02690.3422
Table 10. Analysis of freight volume.
Node NumberNumber of EnterprisesPNode NumberNumber of EnterprisesPNode NumberNumber of EnterprisesP
13461.95177−0.543332−0.36
226−0.401812−0.50341360.41
37715.07195−0.553537−0.32
42921.55209−0.523644−0.27
56−0.552159−0.16371020.16
666−0.112210−0.52388−0.53
769−0.082320−0.443944−0.27
854−0.192429−0.384037−0.32
910−0.522514−0.4941900.07
108−0.532633−0.35423842.23
114−0.562724−0.41431160.26
1210−0.52282241.05441400.44
1311−0.512933−0.3545830.02
142281.083030−0.374631−0.36
1510−0.523135−0.33478−0.53
167−0.543230−0.37
Table 11. Calculation and sorting of the logistics capacity coefficient.
Node NumberComprehensive Weight of Air TransportationComprehensive Weight of Railway TransportationComprehensive Weight of Highway TransportationTransportation Capability CoefficientComprehensive Weight of Freight VolumeLogistics Capacity Coefficient
1−4.6581 0.4279 4.8396 5.2583 1.9480 7.2062
3−4.6581 0.4279 0.9218 1.3405 5.0663 6.4068
2−4.6581 0.4279 4.7939 5.2125 −0.4000 4.8125
424.2901 1.4385 0.4041 1.8479 2.2268 4.0747
333.8052 4.4847 −0.1875 4.2960 −0.3559 3.9401
140.7542 0.4596 1.1079 1.5681 1.0822 2.6503
313.8052 3.0479 −0.2881 2.7612 −0.3339 2.4273
180.7542 0.4596 2.3145 2.7747 −0.5027 2.2720
120.7542 0.4596 2.3201 2.7802 −0.5174 2.2629
323.8052 3.0661 −0.6708 2.3966 −0.3706 2.0260
Table 12. Correspondence between city number and node number.
Node NumberCity NameCity NumberNode NumberCity NameCity Number
1Dongguan111Guangzhou13
2Dongguan112Guangzhou13
3Dongguan113Guangzhou13
4Dongguan114Guangzhou13
5Dongguan115Guangzhou13
6Foshan216Guangzhou13
7Foshan217Guangzhou13
8Foshan218Guangzhou13
9Foshan219Guangzhou13
10Foshan220Guangzhou13
21Hangzhou331Tianjin14
22Shaoxing432Tianjin14
23Wenzhou533Tianjin14
24Jiaxing634Dezhou15
25Jiaxing635Qingdao16
26Huzhou736Qingdao16
27Huzhou737Changsha17
28Suzhou838Yueyang18
29Suzhou839Shijiazhuang19
30Zhenjiang940Shijiazhuang19
41Shanghai1045Manzhouli20
42Shanghai1046Fuyang21
43Beijing1147Nanchang22
44Mudanjiang12
Table 13. Grade setting of the city logistics center.
City NumberGrade of Logistics CenterCity NameLogistics Capacity Coefficient
1Level 1Dongguan3.625992
10Shanghai2.976004
14Level 2Tianjin2.797807
13Guangzhou1.315718
2Foshan0.779902
8Suzhou0.381721
11Beijing0.255385
19Level 3Shijiazhuang0.100643
7Huzhou−0.18127
6Jiaxing−0.30508
3Hangzhou−1.02727
22Nanchang−2.68646
16Qingdao−2.71568
20Manzhouli−3.37272
4Level 4Shaoxing−3.3756
17Changsha−3.83059
9Zhenjiang−4.19341
12Mudanjiang−4.58568
15Dezhou−4.8129
21Fuyang−5.22204
5Wenzhou−5.5914
18Yueyang−5.65007
Table 14. Comparative analysis with previous methods.
Method Brief DescriptionAdvantagesDisadvantagesApplicability
With subjective weight assignmentAll of these methods are based on the combination of different mathematical models and subjective evaluation indicator system, so as to achieve the location of logistics center.These methods consider specific objectives, such as the lowest cost or the closest distance, and the assignment of subjective evaluation indicators.It is difficult to construct the evaluation indicator system comprehensively. The quantization method is not easy to obtain.This kind of method is suitable for long-term planning and in a small region.
No subjective weight assignmentThese methods make use of different mathematical models and algorithms to study location quantitatively.These methods mainly consider economic benefit and time benefit.Customer needs and costs will vary with time and location.This kind of method is suitable for industries with small market changes, otherwise dynamic planning should be used as an assistant.
Subjective weighting of complex networksThis kind of method is based on complex network method and subjective evaluation indicator.According to the complex network characteristics of each node, it is more objective.The subjective evaluation indicator is difficult to obtain and the accuracy needs to be improved.It is suitable for the node selection of long-term planning with small area, which constitute the nodes of complex network.
Objective weighting of complex networks (method used in this paper)The method of this paper is to use the complex network method, combined with the comprehensive weight of freight volume, which can determine the important nodes and grade settings.According to the characteristics of nodes and the weighting of main objective data, the conclusion is not interfered by subjective factors.The weighting method can be improved.This method is suitable for the initial planning of the project, the data of the research object is difficult to obtain, the research object is special, and there are alternative positions in a large area.

