1. Introduction
The Treemap is an information visualization (InfoVis) technique that uses recursive areal subdivision to visualize hierarchical data organized in tree structures [
1]. The areas are proportional to the data values: the higher the data value, the greater the area. One of the strengths of some Treemaps types is the space-filling aspect of the visualization, which uses the whole available display to convey information more efficiently than traditional tree diagrams [
2]. There are different layout subdivision algorithms to subdivide the visual space into specific shapes, such as circular [
3], rectangular [
4], polygonal [
5], squarified [
6], geographical-like [
7] and even hybrid approaches [
8].
Two issues are essential when choosing one of those algorithms: layout stability and visual data readability, and choosing a trade-off between them is a critical point in designing a Treemap algorithm. The layout stability is the ability of small changes in data reflecting small changes in the layout, and visual data readability is concerned about the quality of the data representation. The readability is better for shapes with a low aspect-ratio (e.g., rectangles closer to squares) because thin shapes make it challenging to see and compare the sizes of the items.
Despite that, Treemap still presents some challenges for data representation, such as the few options for visual data mappings and the inability to represent zero and negative values. Additionally, visualizing high dimensional data requires many hierarchies, which can impair data visualization. One possibility to overcome these issues is overlaying the Treemap with glyphs—visual representations that can depict data in its components [
9]—but there is a lack of studies proposing and testing such an approach. Thus, considering the Treemap challenges, the potential of glyphs to represent multidimensional data, and the lack of studies and evaluations about glyphs in Treemaps [
10], this work presents a prototype that adds configurable layered glyphs in visual Treemap items to mitigate the squarified Treemap challenges. With this approach, the Treemap can represent more multidimensional data, including options to encode small, zero, and negative values.
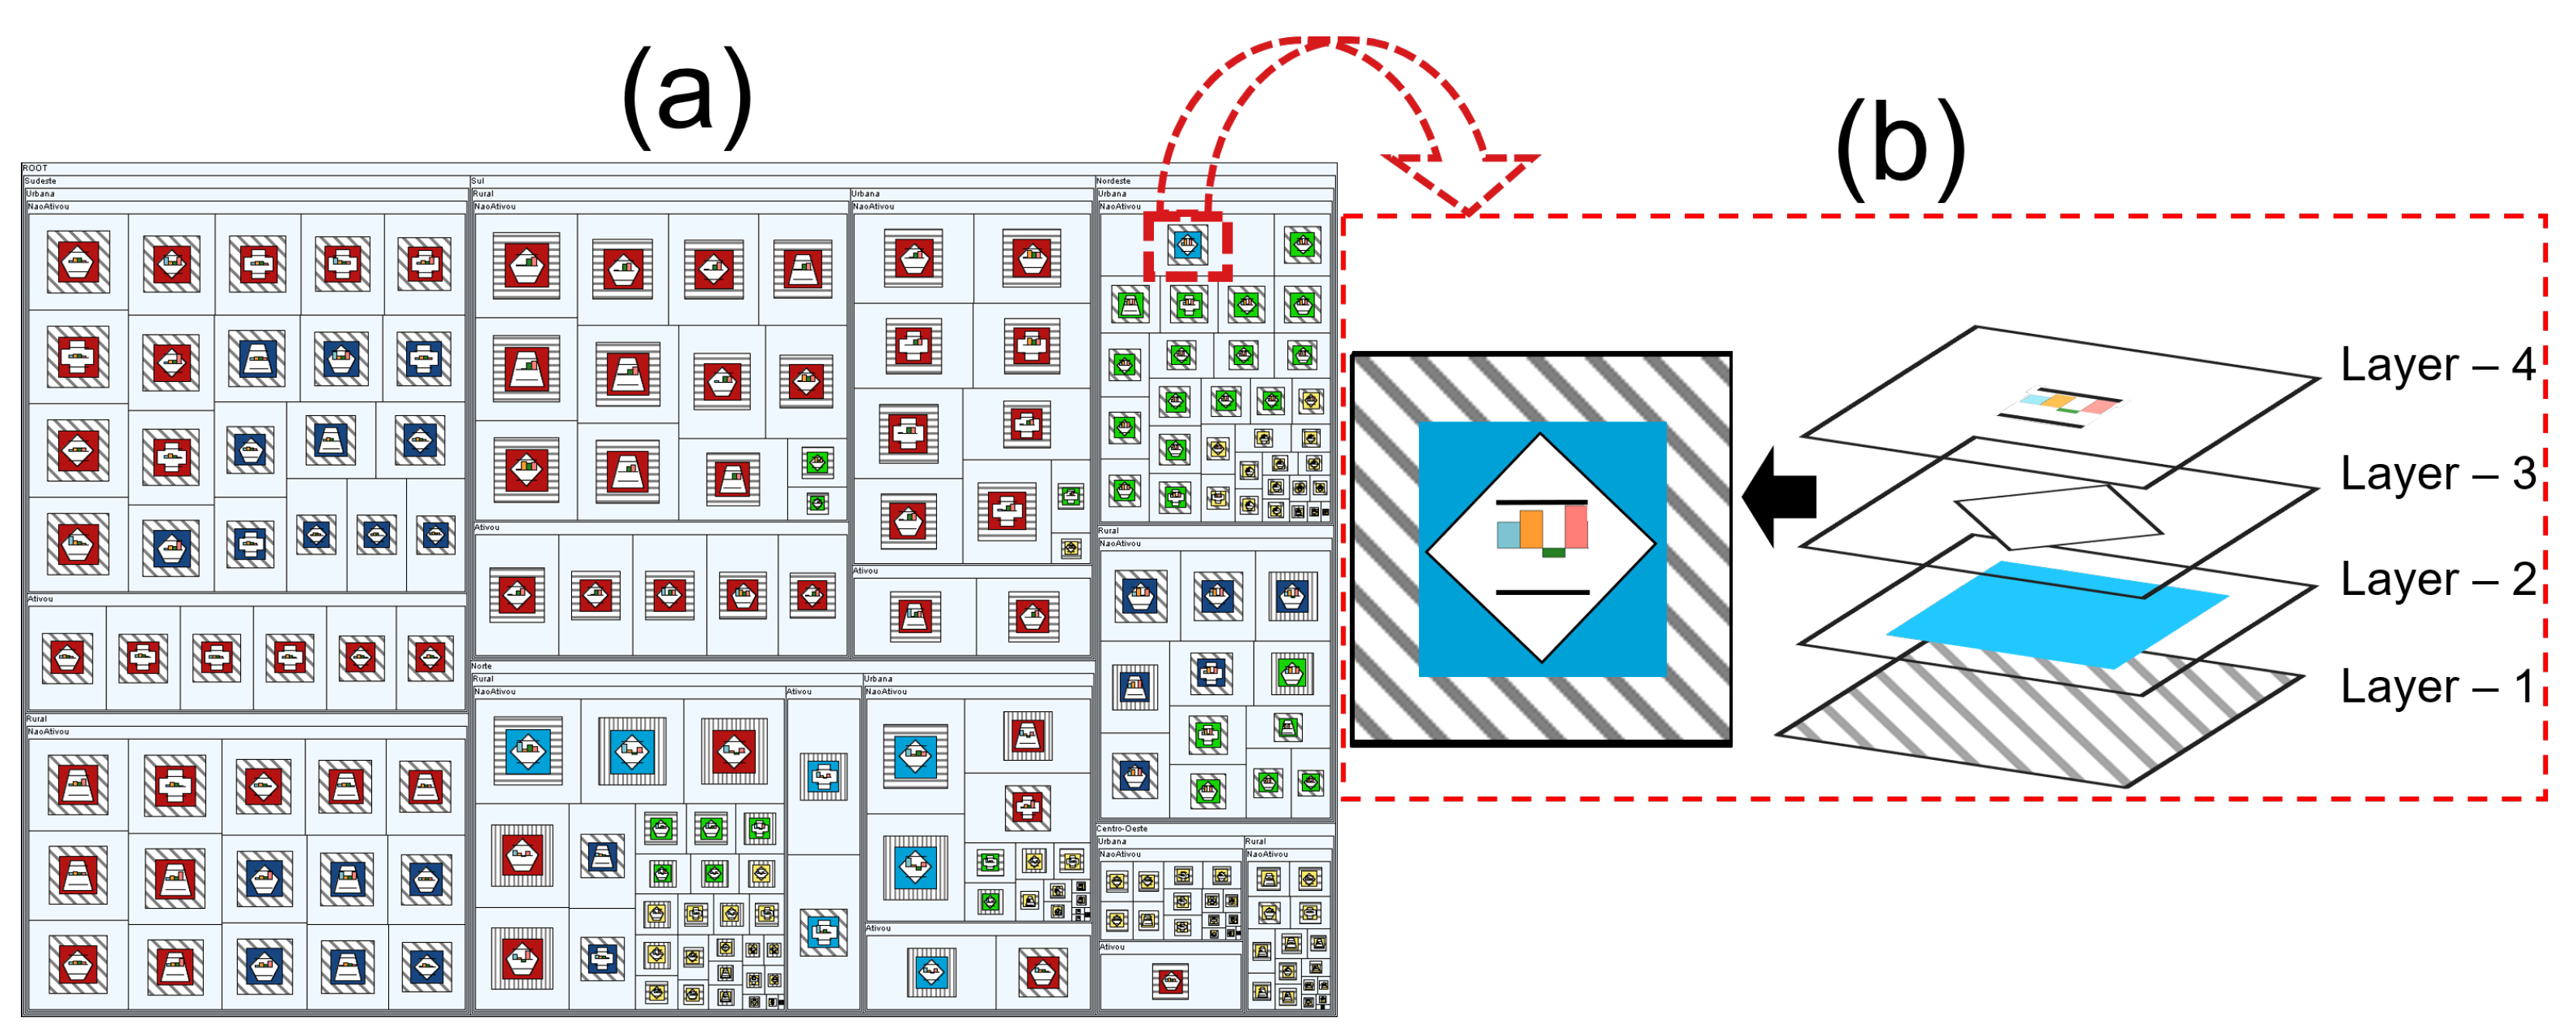
In this research, we propose layered glyphs—glyphs that use overlapped layers—where each layer encodes a visual variable that represents a single data dimension. The layers compose into multidimensional glyphs by making sure that all layers are readable, even when partially overlapped by other layers (See
Figure 1). This choice of layered glyphs and squarified Treemap is a starting point to evaluate the combination of glyphs and Treemaps since both approaches have similar aspect-ratios (close to 1). The main contributions of this work are (1) to provide an InfoVis tool that implements this combination and make it available for download and use under the MIT License and (2) to evaluate the analysis scenarios where the combination of layered glyphs and squarified Treemaps can be useful.
For the evaluation, we tested three scenarios in a comparative analysis: Treemap with glyphs and without hierarchy (G), Treemap with glyphs and hierarchy (GH), and Treemap without glyphs and with hierarchy (H). We conducted a user study with 36 volunteers to evaluate the scenarios. Each participant performed eight user tasks using only one of the three visualization scenarios. Thus, we aim to measure the effect that adding glyphs to Treemaps has on the evaluated tasks in terms of task speed and accuracy.
The paper is organized as follows.
Section 2 presents the background context, addressing topics such as information visualization, the Treemap technique, and glyphs.
Section 3 shows related works.
Section 4 presents the proposed prototype for this research.
Section 5 presents the methodology of the user study.
Section 6 shows the results. Finally,
Section 7 presents final remarks and future works.
5. User Study
We have conducted a task-based user study to investigate the effectiveness (accuracy and task completion time) of layered glyphs embedded in Treemap items. The glyphs can increase data dimensions visually represented beyond those offer by the visualization technique, without impairing the reading of information presented on it.
In a bit more detail, we aim to evaluate if adding glyphs in Treemap items increases user performance during the search and data analysis tasks. For that, we have proposed a comparison between Treemap scenarios with and without glyphs for performing the tasks. Moreover, we aim to investigate if the proposed glyphs mitigate the visual clutter that occurs when using too many hierarchies and if it is suitable for negative, null, and small values representation.
The next sections will present important information about the user study such as the computational environment, the profile of participants, the used dataset, the hypotheses which guide the experiment, examples of test scenarios, user tasks applied, and procedures.
5.7. Procedures
This section describes the procedures to conduct the tests. First of all, a set of people received an invitation to participate in the evaluation procedure by e-mail or social network. All the participants who accepted the invitation were volunteers, and they did not receive any fund compensation for that. Each participant undertook the test individually. Before the beginning of the tests, the conductor of the procedure informed the participant that the use of data collected during the tests would be anonymous. Besides that, if they wished they could stop the test at any moment, and there would not be a time limit for the execution of the tasks.
After that, the conductor showed a training video. The usage of a video was important to standardize the participants’ training. The video included the following topics:
a brief explanation of Treemap and glyph techniques;
the design of the proposed glyphs;
an overview of the used dataset;
examples of tasks, similar to those of the test, but using a different synthetic dataset;
information about how participants would provide the answers (e.g., clicking in a Treemap item).
After the training video, we presented preliminary InfoVis tasks with a different dataset. We highlight that the tests only started when the participant correctly answered at least two tasks at the preliminary step: one task containing quantitative data and another one containing quantitative and categorical data. Also, the participants had to reassure to the test conductor if they were already prepared to undertake the test.
When the user starts the test, a type of scenario (G, GH, or H) is randomly chosen, respecting the maximum of 12 participants per group without repetitions. Thus, all 36 participants formed three groups of 12, one group for each visualization scenario.
Each participant performed eight tasks—from T1 to T8—using only the visualization of the group (G, GH, or H) which the participant was associated with, i.e., no participant performed tasks in more than one scenario type. We pre-configured all visualization scenarios to guarantee the equivalency between them. Thus, participants did not need to configure the visualization scenarios, so they could focus on analyzing the visualization and finding the answer.
Since the only difference between the scenarios (i.e., the independent variable) is the presence or absence of glyphs or hierarchies, the effect can be measured. In the study, we collect data regarding time, error, and interaction, and this process is automatic in the tool. The participant only has to click on the Treemap items to answer a task, so all data is recorded. No information is collected from the training phase, as its purpose is only to make sure that participants are on the same knowledge level.
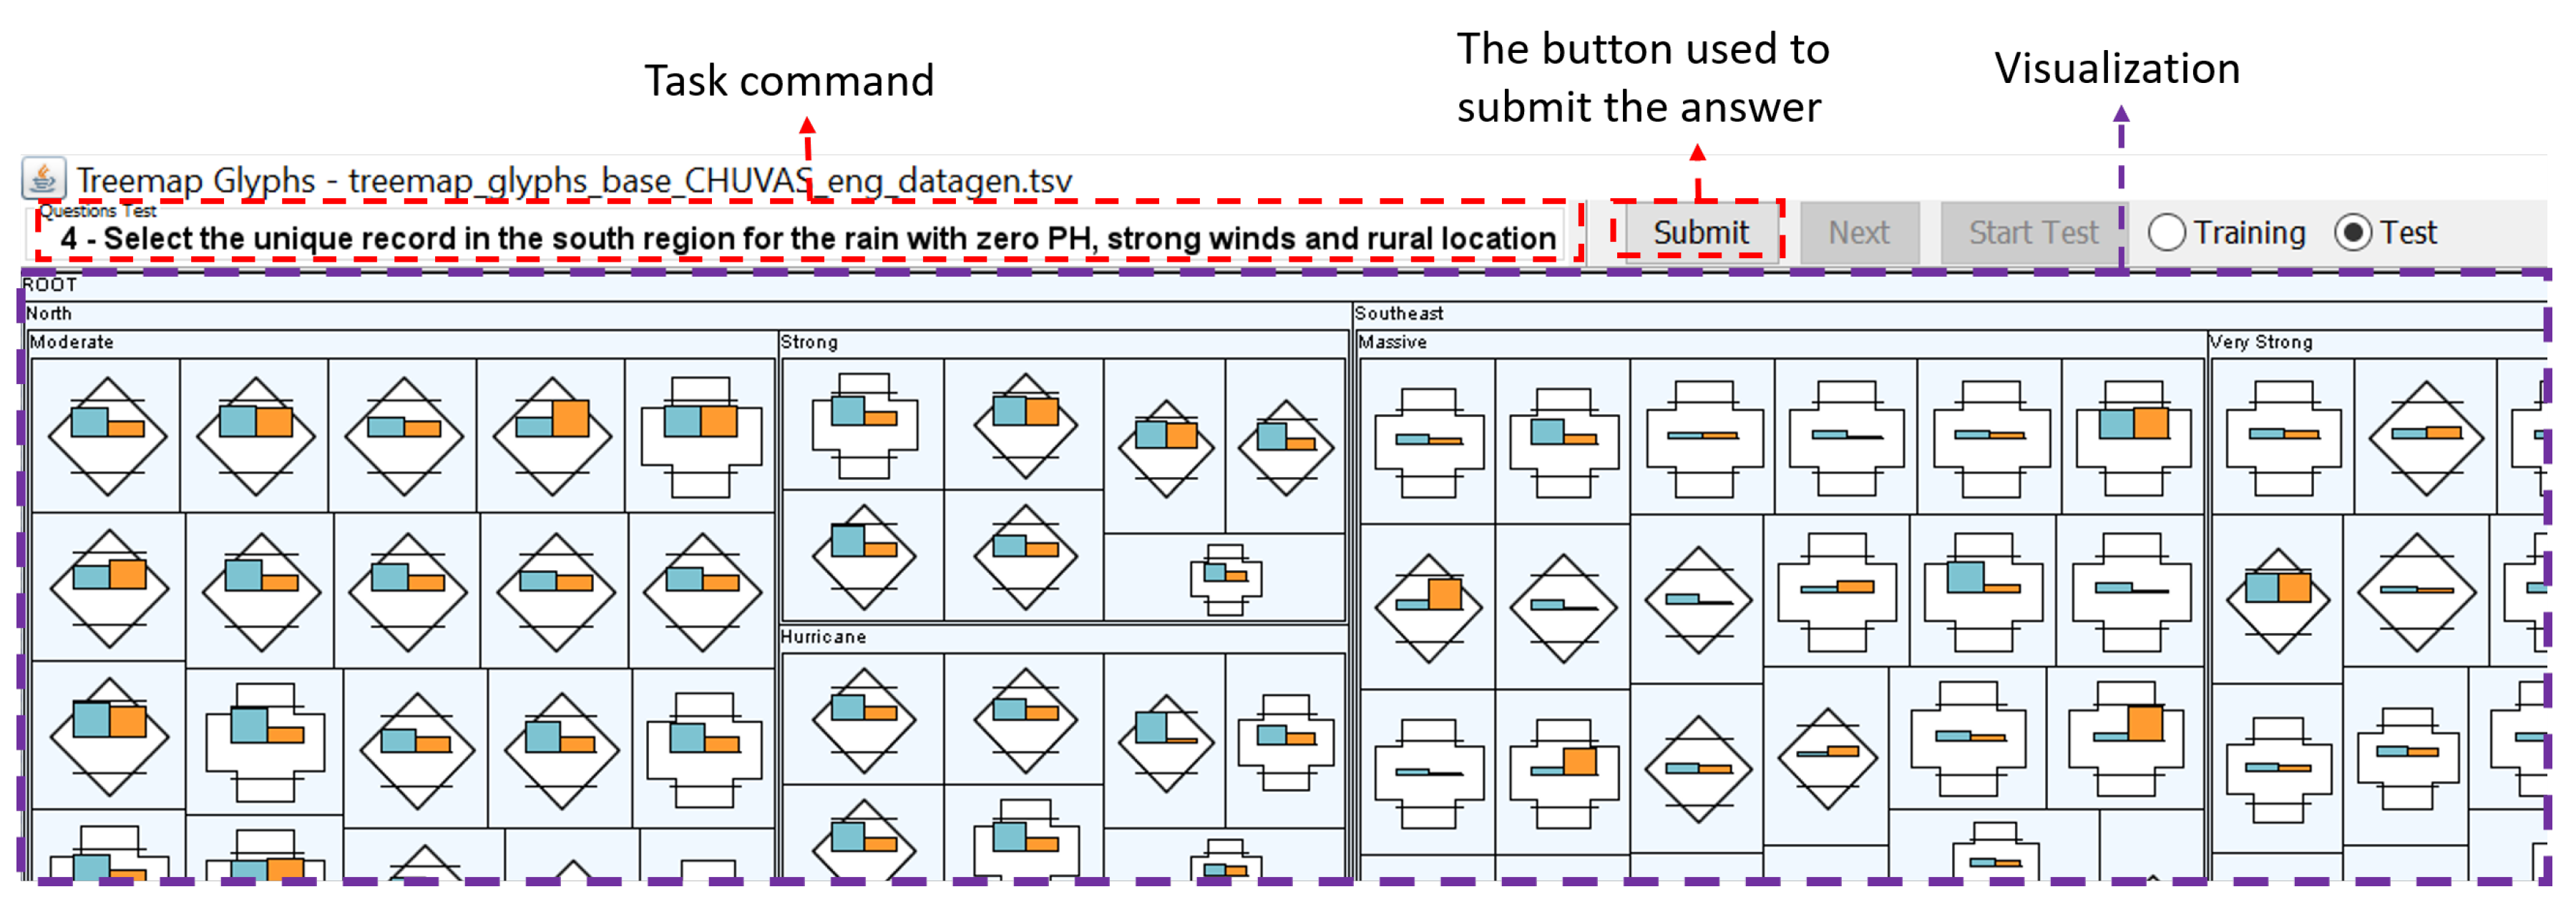
During the training and tests, only one conductor and one participant were present in the room. We shown the tasks at the top area of the user screen, immediately above the visualization (See
Figure 11).
For the test, the participants performed eight tasks in a random order. They could only move to the next task after answering the current one. A participant starts a task clicking on the start button, and read it out loud, thereby the participant is free to understand the task request and begin to analyze the visualization. After that, the participant provides an answer by clicking on the Treemap item(s) and then on a submit button. The prototype saves the time between the start and submit buttons and also the participant’s answer in a log file. After repeating this process for all the eight tasks, the test session is over.
6. Results
We analyzed three aspects of the collected data to compare the performance between the groups: the proportion of correct and wrong answers, the average response time with confidence intervals, and a pair-wise time effect size analysis [
49,
50].
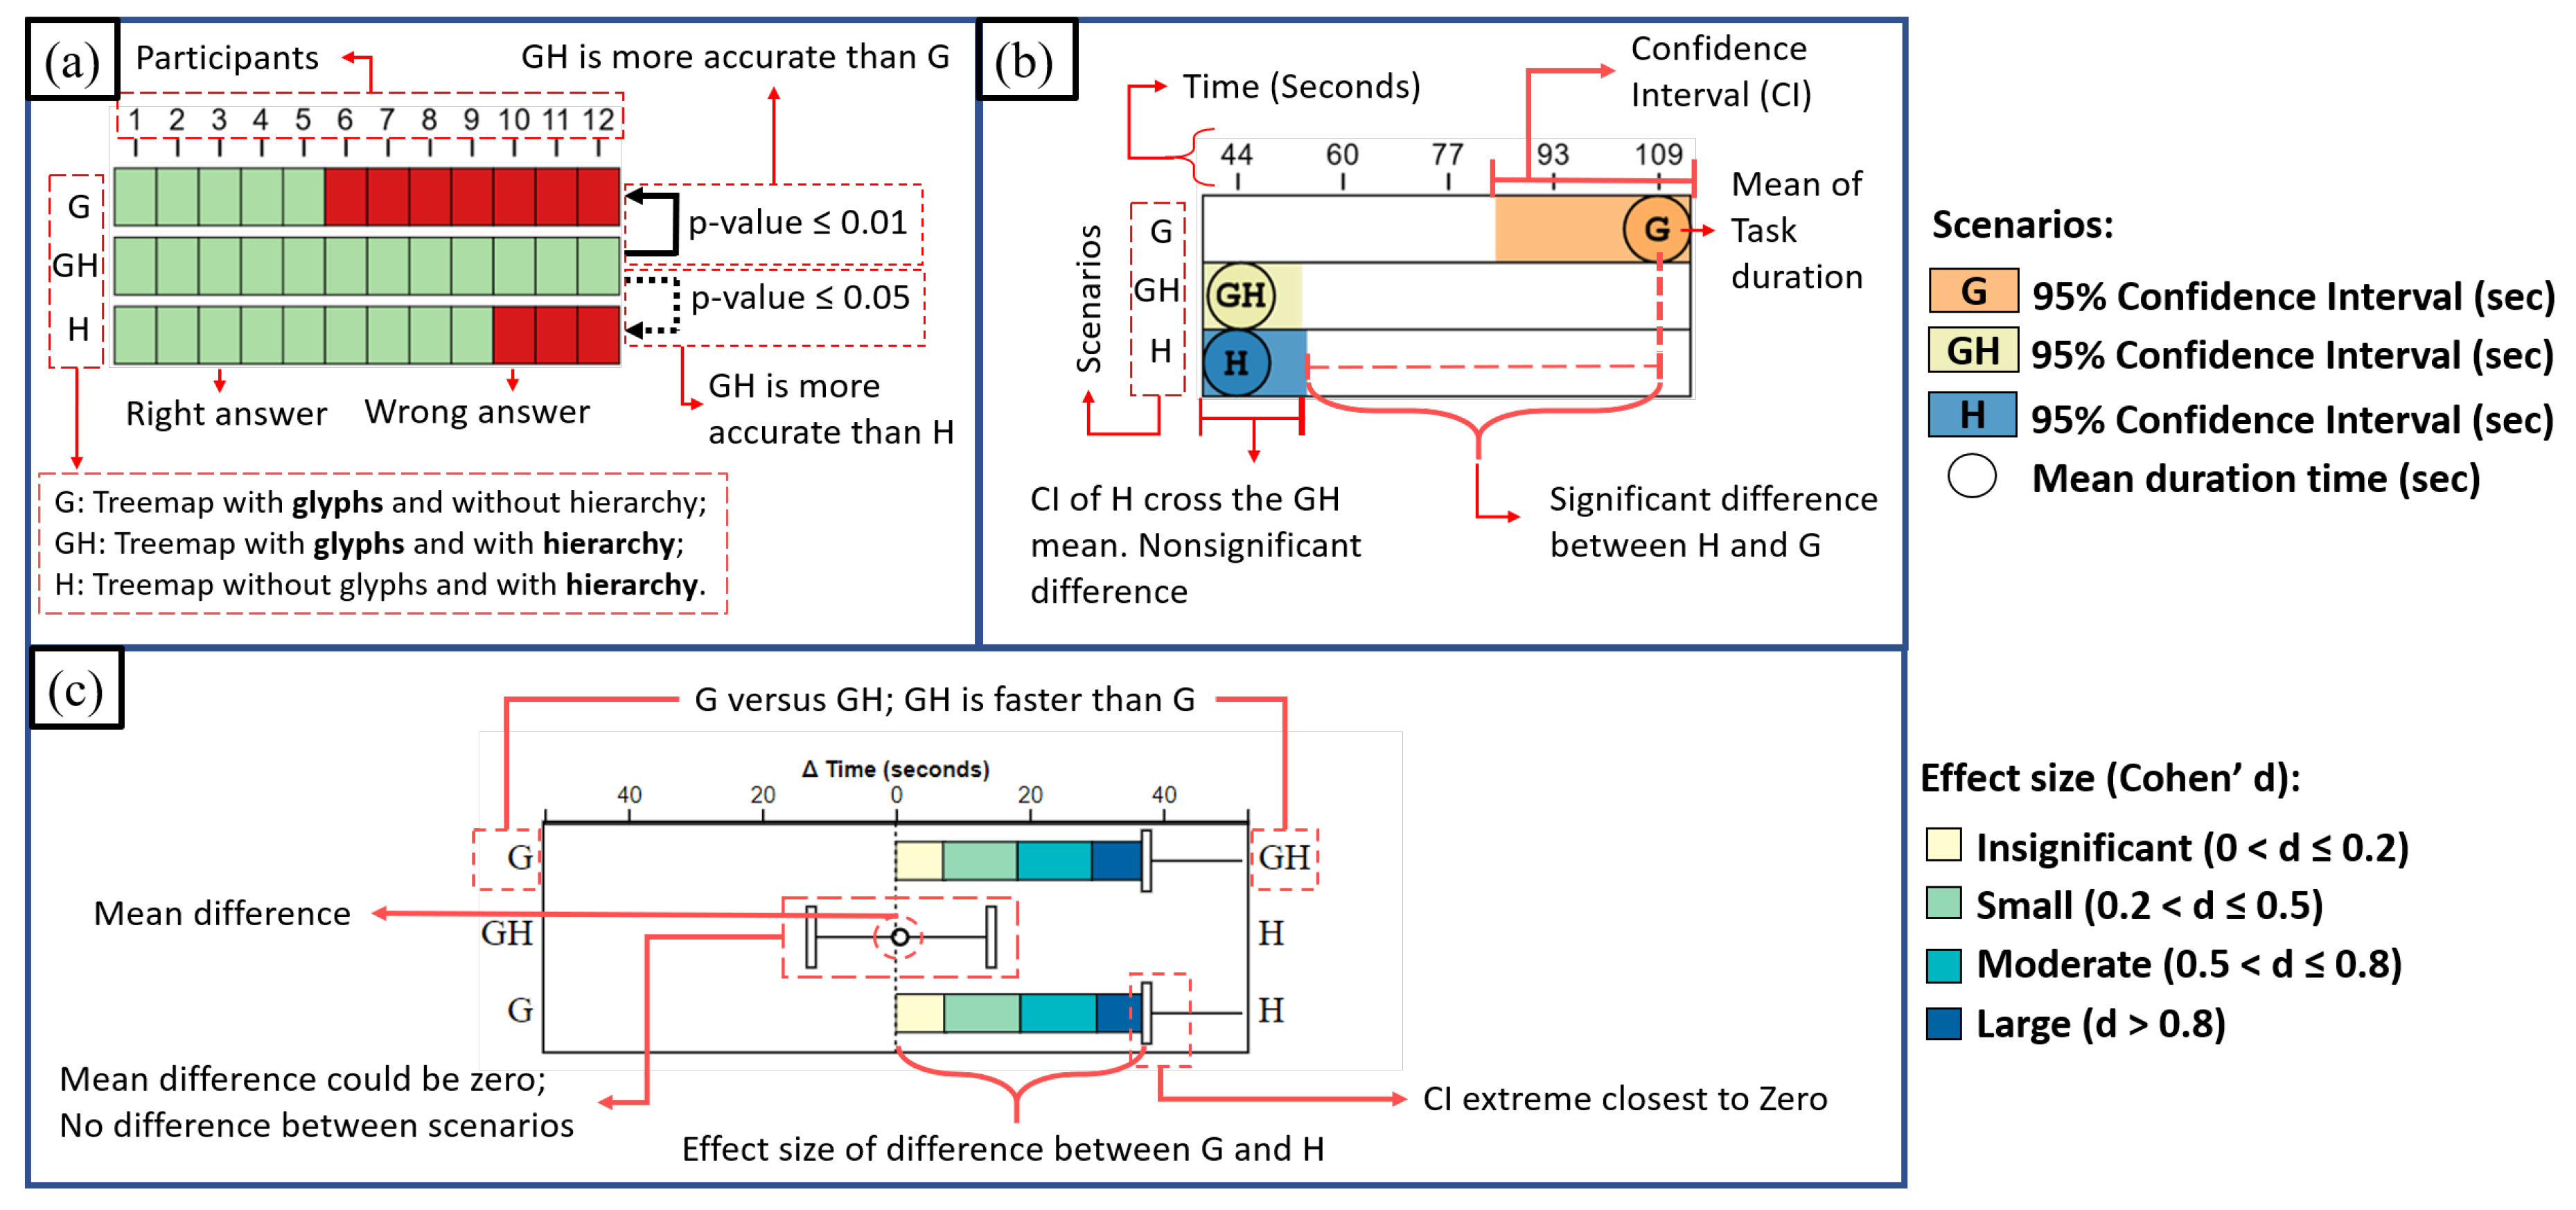
Figure 12 shows how to interpret the charts that will present such aspects in the following sections.
Figure 12a shows the amount of correct and incorrect answers of 12 participants for one task in each scenario, and a pair-wise test using bootstrapping to compute the 95% confidence interval of the difference between each pair of groups.
Figure 12b shows the mean response time of 12 participants and its 95% confidence interval, both for the same task. If the confidence intervals of the two groups are far apart, then there is a significant difference between them. For instance, in
Figure 12b, there is no significant difference between H-GH, but there is between GH-G and H-G.
The
Figure 12c shows the pair-wise time comparison between groups. We used bootstrapping [
51] to compute the 95% confidence interval of the difference between each pair of groups. If the interval crosses zero, we can not reject the (null) hypothesis that the groups are equal. If the interval does cross zero, then we can reject the null hypothesis in favor of the (alternative) hypothesis that one group is better than the other (at
). Besides,
Figure 12c shows the effect size in terms of Cohen’s d [
52] using a multi-colored bar that is positioned at the center and grows towards the faster scenario. The colors indicate the thresholds of Cohen’s d effect sizes (insignificant, small, moderate, and large effect). Thus in
Figure 12c, scenario GH is at least 38 s faster than scenario G, which is a large effect size (the 38 s mark reaches the dark-blue color).
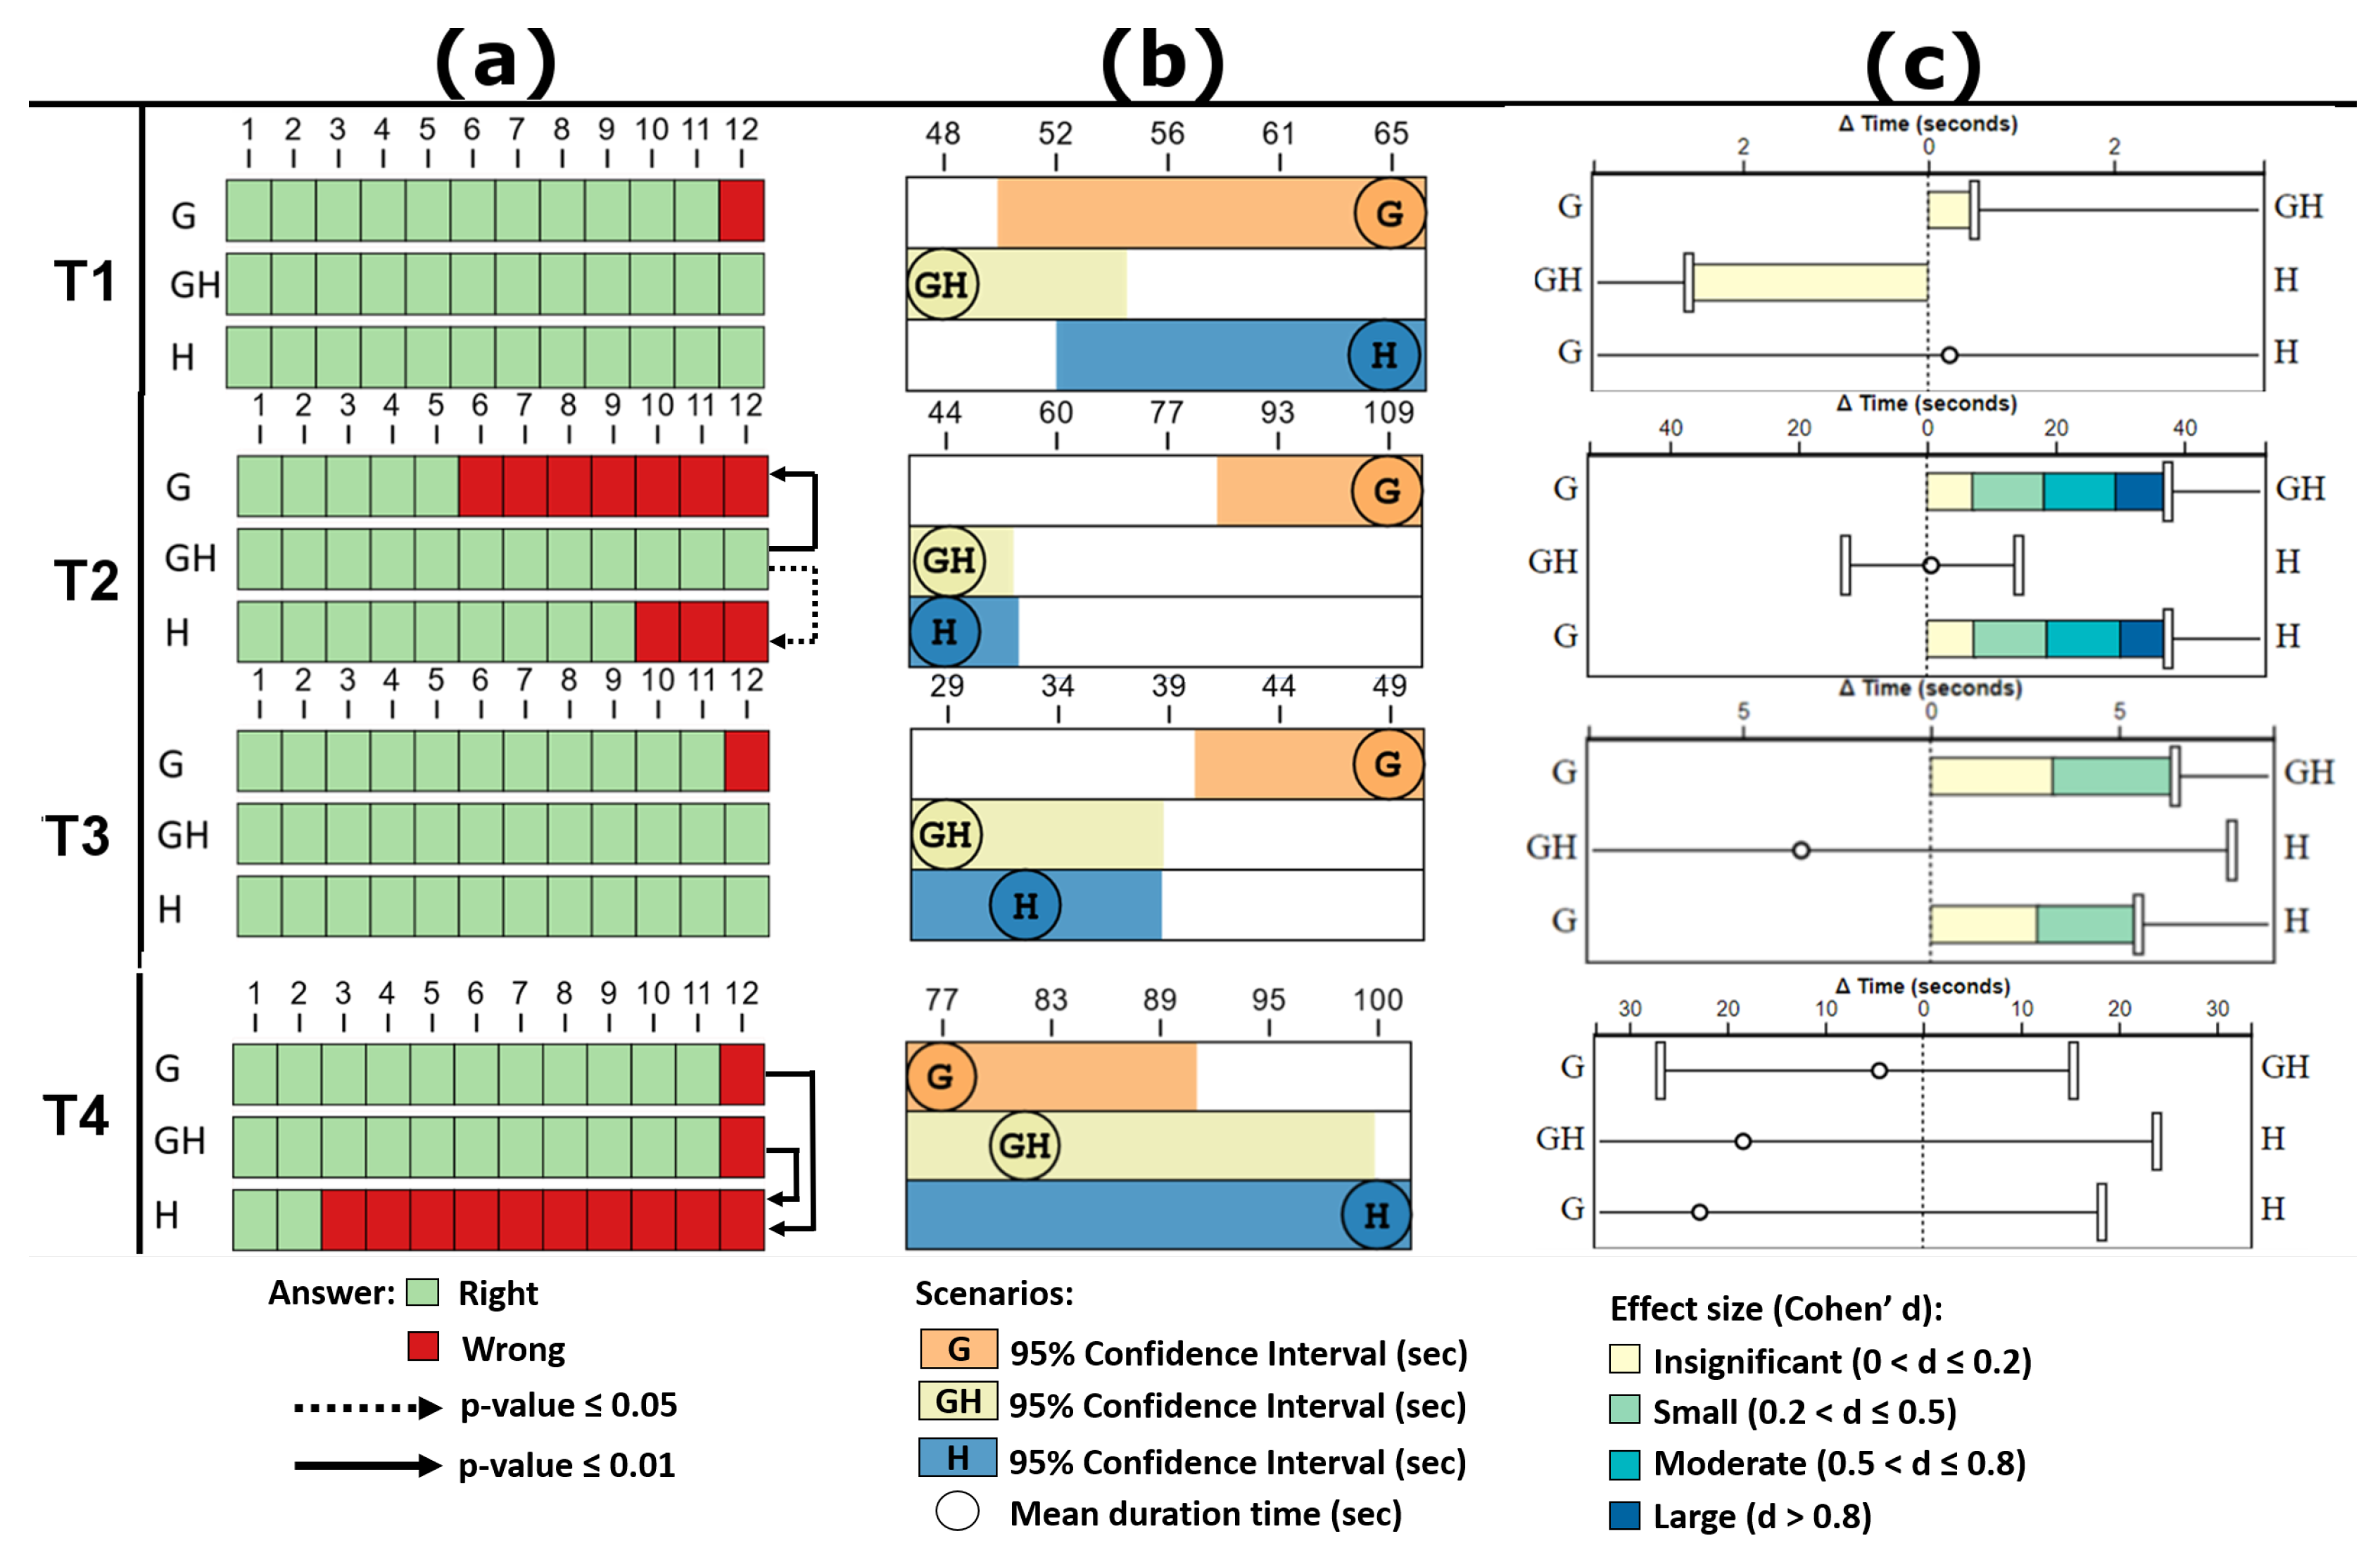
Figure 13 and
Figure 14 present the accuracy and time results of the tasks performed by all groups of participants, including the pairwise statistical analysis between groups.
The following topics will guide our analysis of the results: to replace hierarchies by layered glyphs; to locate highest, zero, negative or unique values; to compare groups; and to identify patterns. The analysis of them will support or refute or the hypotheses proposed in
Section 5.4.
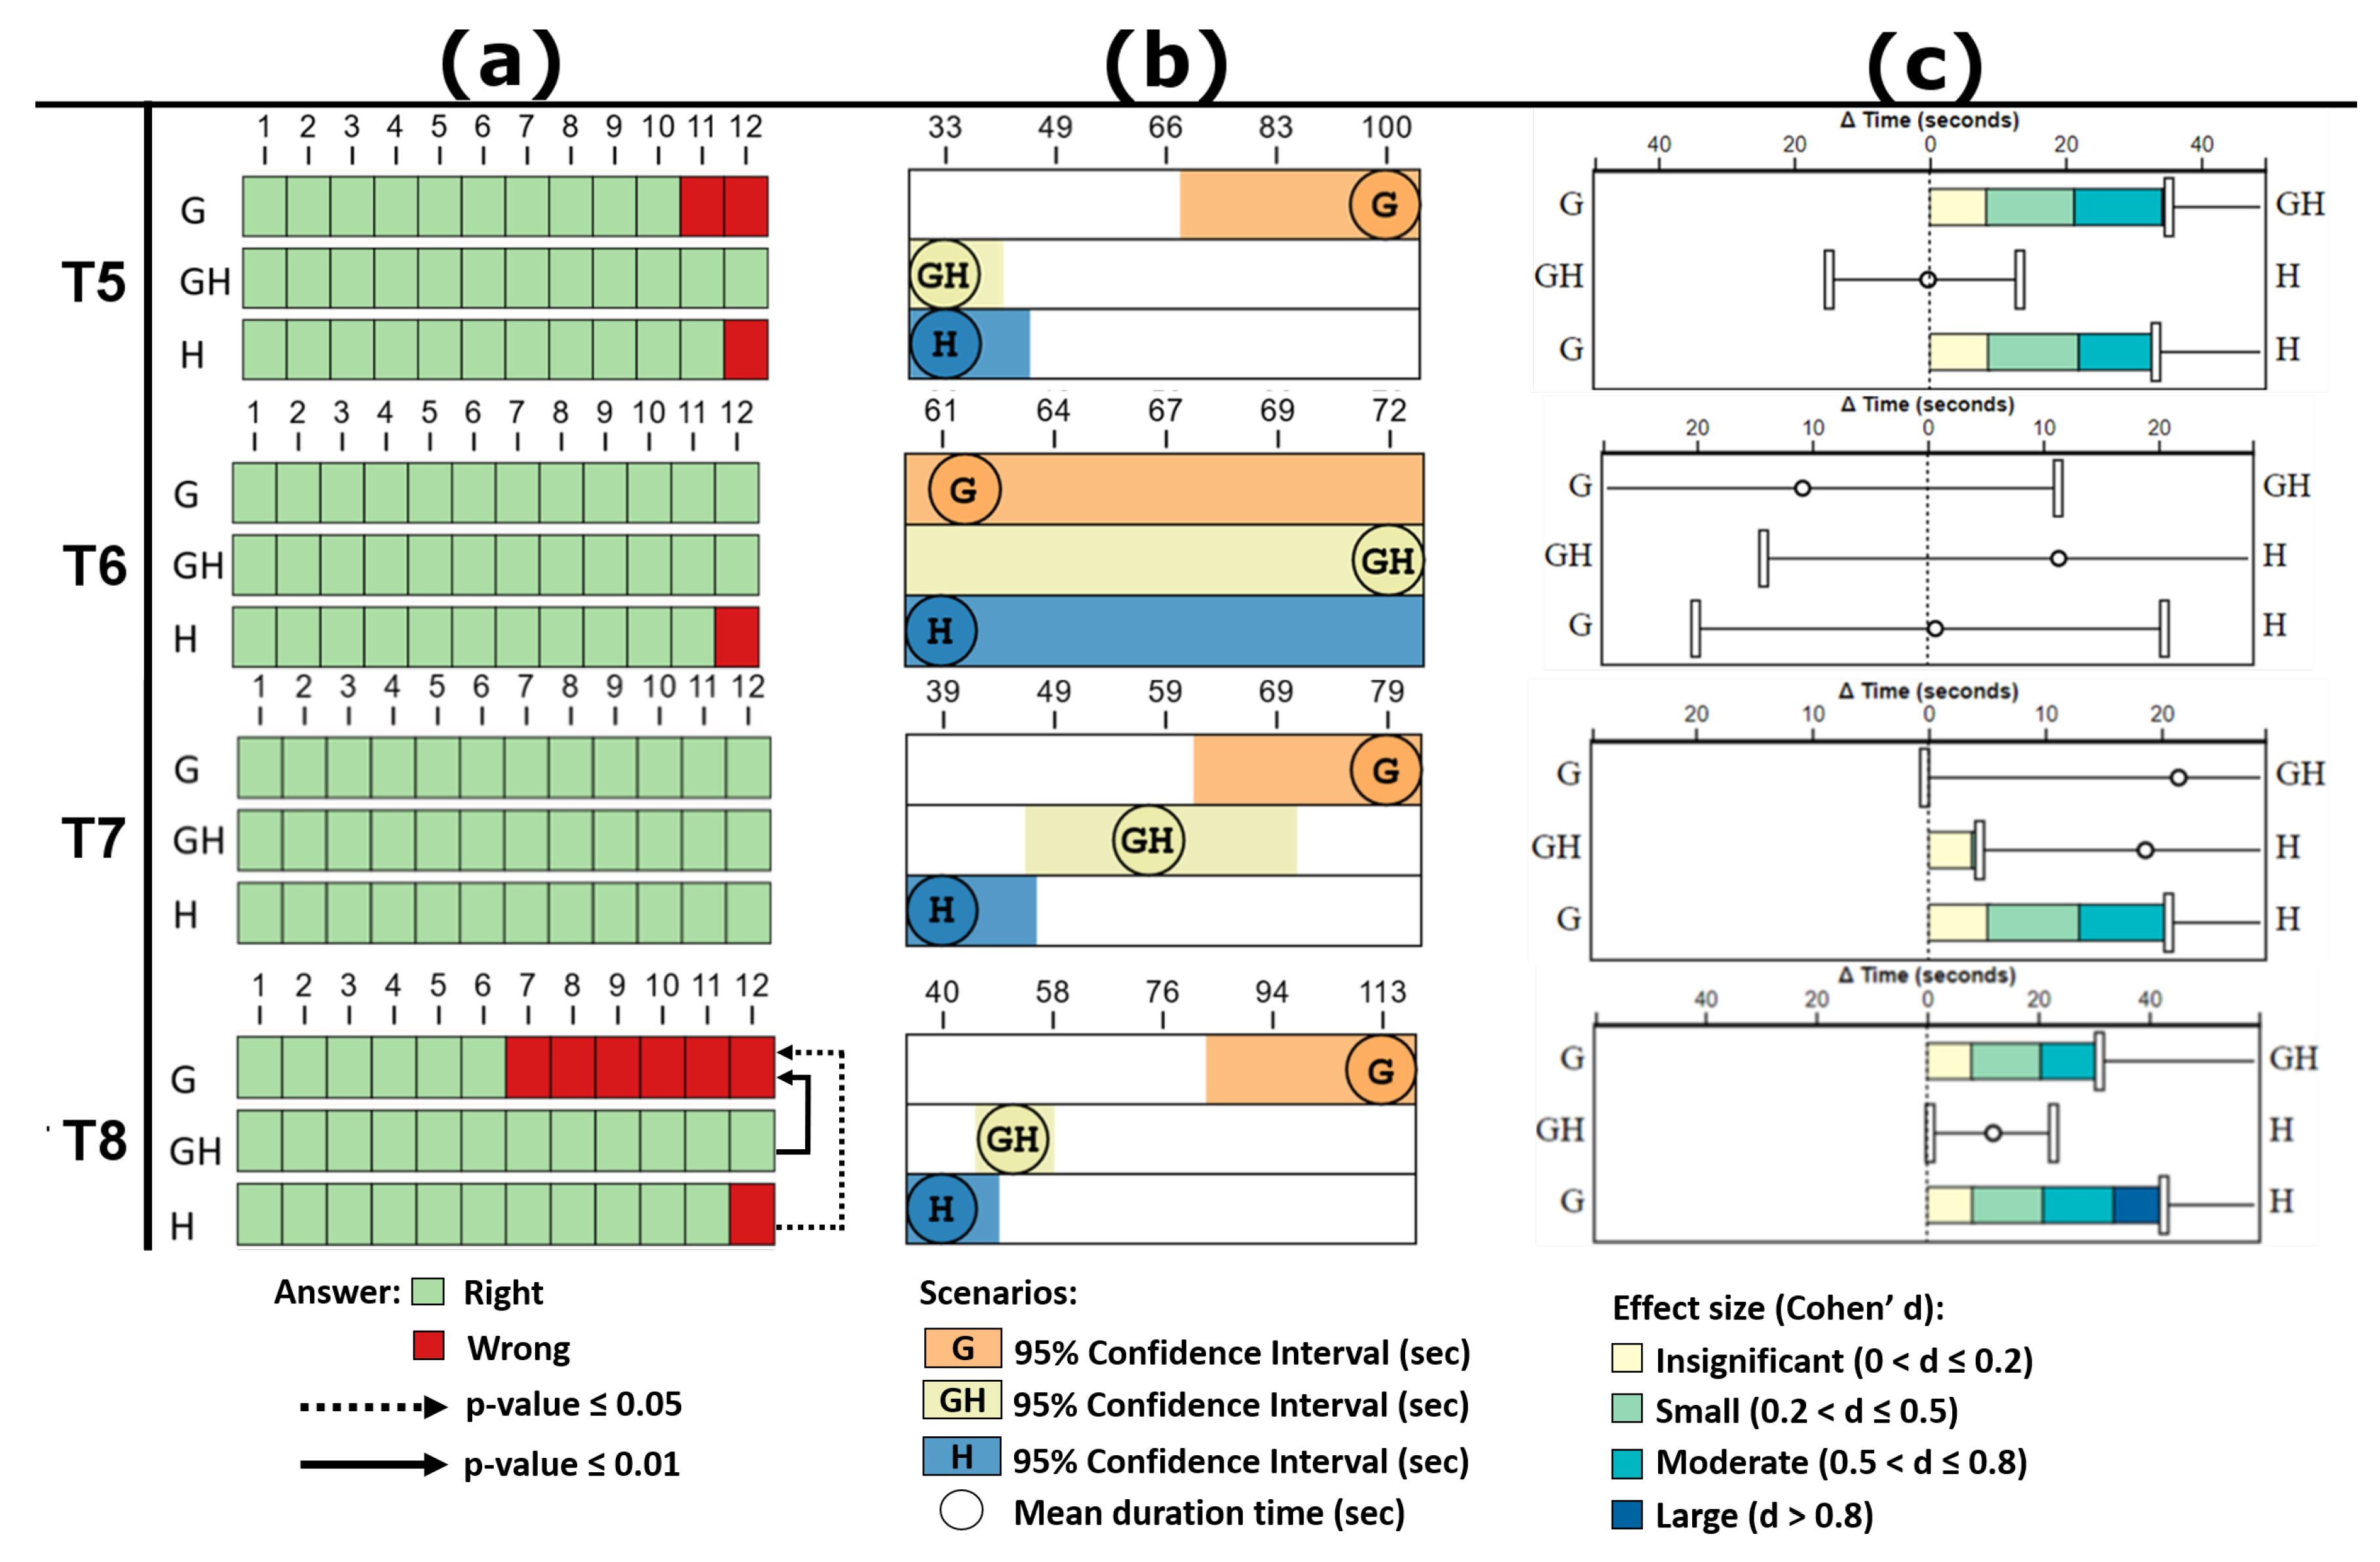
6.2. Search Tasks
The search tasks are the task types that most occurred in the test, for example, to locate the highest values (T2), unique values (T5 and T6), negative values (T3), or zero values (T4). Particularly for these last two items, the traditional Treemap presents restrictions to perform their visual representation and support the search task. Regarding the location of higher values, the GH scenario presented the task T2 with 100% correct answers. Besides, it stands out that scenario GH has significantly better accuracy results than scenario G (p-value ) and scenario H (p-value ). The average time between GH and H is similar but statistically different for G with a large effect size (d), which suggests that this scenario may not be suitable for this type of task.
As regards the location of negative values, the analysis of task T3 showed that there are no statistical differences for accuracy between the other scenarios. For this task in scenario H, a label inside the Treemap item represents the negative values. As to the average task resolution time, the GH scenario presented the best average but without statistical difference compared to H, and a statistical difference compared to G, with a small effect size ().
About the location of zero values, task T4 showed that scenarios GH and G outperforms the scenario H (both p-values ), and there was no statistically significant difference between GH-G. The average time to resolve tasks also did not show statistically significant differences between the scenarios. This task highlighted the Treemap’s difficulty in representing zero values and supporting search tasks for them.
Concerning the location of single values, T5 and T6 tasks did not show the statistical difference for accuracy between the scenarios. Still, it is noteworthy that the GH scenario obtained 100% accuracy for both tasks. The average time to resolve tasks also did not show statistically significant differences between the scenarios. However, for task T6, with more attributes for analysis, the GH average time was higher compared to H and G.
Thus, considering the analysis of correct answers and time average of the T2, T3, T4, T5 e T6 tasks, we can confirm the hypotheses H2, H3, H4, and H5, i.e., the combination of hierarchies and layered glyphs is suitable for search tasks.
7. Final Remarks and Future Works
In this paper, we proposed the addition of layered glyphs in Treemaps to improve the visual representation of multidimensional data capabilities of the technique, as well as to improve the representation of small, negative, and zero values. These representations are quite challenging to be done in the squarified treemap technique.
The proposed glyph is a multilayered square-shaped added to the Treemaps items. Its configuration is dynamic, enabling to change the order of the layers and the used visual variables for each layer. The proposed glyph design use layers to represent categorical and ordinal data and a profile glyph layer for quantitative data. While some layers can represent ordinal data (e.g., text, color brightness), others do not suit this depiction because they do not have any inherent order (e.g., color hue, shape, texture). This opens the space for future research to test new ordinal layers, (e.g., tilt and curvature layers), as well as new categorical layers (e.g., motion) [
11]. Since the focus of our study was only to evaluate the efficacy of the layers in search tasks—and the data was synthetic—we considered all variables to be categorical, even if the chosen semantics imply an ordinal relationship. Further studies might evaluate real datasets and consider ordinal data, optimizing the visual mappings to adequate types.
We developed a tool that implemented our proposal, allowing users to visualize more data through the combination of glyphs and hierarchies.
We conducted a task-based user study to compare three different Treemap scenarios: Treemaps with glyphs and hierarchies (GH), Treemaps with hierarchies and without glyphs (H), and Treemaps with glyphs and without hierarchies (G). A total of 36 volunteers performed 8 InfoVis tasks in these scenarios, 12 per each scenario.
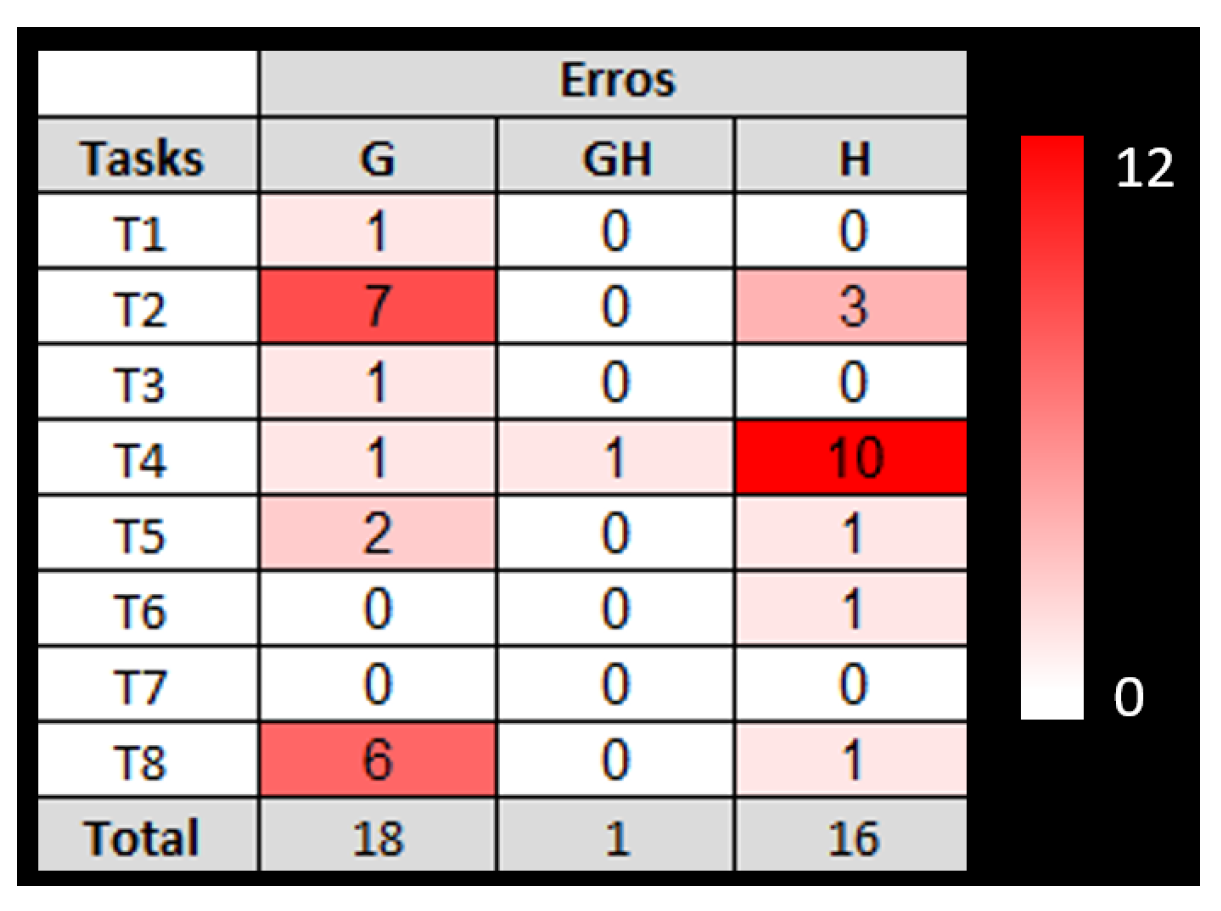
The data analysis results showed that replacing all hierarchies per glyphs is only suitable in specific cases, but the use of glyphs combined with hierarchies had consistently good accuracies and response time across different task types. We also highlight the high error rate for the scenario without glyphs in task T4, which required the user finding an item with a zero value. This finding supports the argument that the traditional Treemap has difficulties in representing the zero value.
Adding glyphs to Treemaps items did not increase the response time of tasks by more than a “small” effect size. The approach of adding glyphs to the traditional Treemaps offers considerable potential for representing many dimensions, and also for visualizing small, negative, and zero values.
As future work, we suggest the investigation of the best order, quantity, and relation between visual variables to be adopted in the glyphs of the Treemap layout. Another suggestion is the usage and evaluation of novel designs of glyphs, considering criteria like pre-attention, memorization, and visual quality for limited areas. We also intend to perform new evaluation studies examining other task types and taxonomies. Further studies could use qualitative evaluation methodologies to collect more descriptive information, such as participants’ suggestions for glyph design. Besides, there is a potential of usage expansion for the multilayered glyph in other InfoVis techniques, such as Voronoi, Bubble Tree, Sunburst, among others.
Author Contributions
Conceptualization, A.G.M.S., and B.S.M.; methodology, A.G.M.S., and B.S.M.; software, A.G.M.S., B.S.M., and C.G.R.d.S.; validation, A.G.M.S., B.S.M., R.S.d.A.D.L., and C.G.R.d.S.; data curation, A.G.M.S., B.S.M., R.S.d.A.D.L., and C.G.R.d.S.; investigation, A.G.M.S., B.S.M., and C.G.R.d.S.; writing—original draft preparation, A.G.M.S., and B.S.M.; visualization, A.G.M.S., B.S.M., E.T.C.M., R.S.d.A.D.L. and C.G.R.d.S.; supervision, B.S.M.; project administration A.G.M.S., and B.S.M. All authors have read and agree to the published version of the manuscript.
Funding
This study was financed in part by the Coordenação de Aperfeiçoamento de Pessoal de Nível Superior—Brazil (CAPES)—Finance Code 001 and the APC was funded by authors.
Conflicts of Interest
The authors declare no conflict of interest.
References
- Johnson, B.; Shneiderman, B. Tree-maps: A space-filling approach to the visualization of hierarchical information structures. In Proceedings of the Visualization 91, San Diego, CA, USA, 22–25 October 1991. [Google Scholar] [CrossRef] [Green Version]
- Kong, N.; Heer, J.; Agrawala, M. Perceptual guidelines for creating rectangular treemaps. IEEE Trans. Vis. Comput. Graph. 2010, 16, 990–998. [Google Scholar] [CrossRef] [PubMed] [Green Version]
- Zhao, H.; Lu, L. Variational circular treemaps for interactive visualization of hierarchical data. In Proceedings of the IEEE Pacific Visualization Symposium, Hangzhou, China, 14–17 April 2015; pp. 81–85. [Google Scholar] [CrossRef]
- van Ham, F.; van Wijk, J.J. Beamtrees: Compact visualization of large hierarchies. In Proceedings of the IEEE Symposium on Information Visualization, Amsterdam, The Netherlands, 29–30 May 2000; pp. 93–100. [Google Scholar] [CrossRef]
- Balzer, M.; Deussen, O. Voronoi treemaps. In Proceedings of the IEEE Symposium on Information Visualization, Minneapolis, MN, USA, 23–25 October 2005; pp. 49–56. [Google Scholar]
- Bruls, M.; Huizing, K.; van Wijk, J.J. Squarified Treemaps. In Eurographics; Springer: Vienna, Austria, 2000; pp. 33–42. [Google Scholar] [CrossRef]
- Auber, D.; Huet, C.; Lambert, A.; Renoust, B.; Sallaberry, A.; Saulnier, A. Gospermap: Using a gosper curve for laying out hierarchical data. IEEE Trans. Vis. Comput. Graph. 2013, 19, 1820–1832. [Google Scholar] [CrossRef] [PubMed]
- Hahn, S.; Döllner, J. Hybrid-treemap layouting. In Proceedings of the Eurographics/IEEE VGTC Conference on Visualization: Short Papers, Barcelona, Spain, 12–16 June 2017; pp. 79–83. [Google Scholar]
- Ware, C. Information Visualization: Perception for Design, 2nd ed.; Elsevier: San Francisco, CA, USA, 2004. [Google Scholar] [CrossRef] [Green Version]
- Fuchs, J.; Isenberg, P.; Bezerianos, A.; Keim, D. A Systematic Review of Experimental Studies on Data Glyphs. IEEE Trans. Vis. Comput. Graph. 2017, 23, 1863–1879. [Google Scholar] [CrossRef] [PubMed] [Green Version]
- Munzner, T.; Maguire, E. Visualization Analysis and Design; AK Peters visualization series; CRC Press: Boca Raton, FL, USA, 2015. [Google Scholar]
- Few, S. Now You See It; Analytics Press: El Dorado Hills, CA, USA, 2009. [Google Scholar]
- Chen, C. Information Visualization. Inf. Vis. 2002, 1, 1–4. [Google Scholar] [CrossRef]
- Mazza, R. Introduction to Information Visualization; Springer: Berlin/Heidelberg, Germany, 2009. [Google Scholar]
- Shneiderman, B. The eyes have it: A task by data type taxonomy for information visualizations. In Proceedings of the 1996 IEEE Symposium on Visual Languages, Boulder, CO, USA, 3–6 September 1996. [Google Scholar] [CrossRef] [Green Version]
- Schulz, H.J. Treevis. net: A tree visualization reference. IEEE Comput. Graph. Appl. 2011, 31, 11–15. [Google Scholar] [CrossRef] [PubMed]
- Shneiderman, B. Tree visualization with tree-maps: 2-d space-filling approach. ACM Trans. Graph. 1992, 11, 92–99. [Google Scholar] [CrossRef]
- Sondag, M.; Speckmann, B.; Verbeek, K. Stable treemaps via local moves. IEEE Trans. Vis. Comput. Graph. 2017, 24, 729–738. [Google Scholar] [CrossRef] [PubMed] [Green Version]
- Munzner, T. H3: Laying out large directed graphs in 3D hyperbolic space. In Proceedings of the Visualization Conference, Information Visualization Symposium and Parallel Rendering Symposium, Phoenix, AZ, USA, 21 October 1997. [Google Scholar] [CrossRef]
- Yost, B.; North, C. Single complex glyphs versus multiple simple glyphs. In CHI 05 Extended Abstracts on Human Factors in Computing Systems; ACM Press: New York, NY, USA, 2005. [Google Scholar] [CrossRef]
- Feng, D.; Lee, Y.; Kwock, L.; Taylor, R.M. Evaluation of glyph-based multivariate scalar volume visualization techniques. In Symposium on Applied Perception in Graphics and Visualization; ACM Press: New York, NY, USA, 2009. [Google Scholar] [CrossRef] [Green Version]
- Chlan, E.B.; Rheingans, P. Multivariate glyphs for multi-object clusters. In Proceedings of the IEEE Symposium on Information Visualization, Minneapolis, MN, USA, 23–25 October 2005. [Google Scholar] [CrossRef]
- Ward, M.O.; Grinstein, G.; Keim, D. Interactive Data Visualization—Foundations, Techniques, and Applications, 2nd ed.; A K Peters/CRC Press: Boca Raton, FL, USA, 2015. [Google Scholar] [CrossRef]
- Siegel, J.H.; Farrell, E.J.; Goldwyn, R.M.; Friedman, H.P. The surgical implications of physiologic patterns in myocardial infarction shock. In Proceedings of the Thirty-third Annual Meeting of the Society of University Surgeons, San Francisco, CA, USA, 10–12 Februray 1972; pp. 126–141. [Google Scholar]
- Pickett, R.M.; Grinstein, G.G. Iconographic Displays For Visualizing Multidimensional Data. In Proceedings of the 1988 IEEE International Conference on Systems, Man, and Cybernetics, Beijing, China, 8–12 August 1988. [Google Scholar] [CrossRef]
- Chernoff, H. The Use of Faces to Represent Points in k-Dimensional Space Graphically. J. Am. Stat. Assoc. 1973, 68, 361–368. [Google Scholar] [CrossRef]
- Kleiner, B.; Hartigan, J.A. Representing Points in Many Dimensions by Trees and Castles. J. Am. Stat. Assoc. 1981, 76, 260–269. [Google Scholar] [CrossRef]
- Hartigan, J.A. Printer graphics for clustering. J. Stat. Comput. Simul. 1975, 4, 187–213. [Google Scholar] [CrossRef]
- Wittenbrink, C.M.; Pang, A.T.; Lodha, S.K. Glyphs for visualizing uncertainty in vector fields. IEEE Trans. Vis. Comput. Graph. 1996, 2, 266–279. [Google Scholar] [CrossRef]
- Beddow, J. Shape Coding of Multidimensional Data on a Microcomputer Display. In Proceedings of the 1st Conference on Visualization ’90, San Francisco, CA, USA, 23–26 October 1990; pp. 238–246. [Google Scholar]
- Du Toit, S.H.C.; Steyn, A.G.W.; Stumpf, R.H. Graphical Exploratory Data Analysis; Springer: Berlin/Heidelberg, Germany, 1986. [Google Scholar]
- Schroeder, W.J.; Volpe, C.R.; Lorensen, W.E. The stream polygon-a technique for 3D vector field visualization. In Proceedings of the Proceeding Visualization 91, San Diego, CA, USA, 22–25 October 1991. [Google Scholar] [CrossRef]
- Zhao, S.; McGuffin, M.J.; Chignell, M.H. Elastic hierarchies: Combining treemaps and node-link diagrams. In Proceedings of the IEEE Symposium on Information Visualization, Minneapolis, MN, USA, 23–25 October 2005. [Google Scholar] [CrossRef]
- Telea, A. Combining Extended Table Lens and Treemap Techniques for Visualizing Tabular Data. In Proceedings of the Joint Eurographics/IEEE VGTC Conference on Visualization, Lisbon, Portugal, 8–10 May 2006; pp. 51–58. [Google Scholar] [CrossRef]
- Huang, M.L.; Huang, T.H.; Zhang, J. TreemapBar: Visualizing Additional Dimensions of Data in Bar Chart. In Proceedings of the 13th International Conference Information Visualisation, Barcelona, Spain, 15–17 July 2009. [Google Scholar] [CrossRef] [Green Version]
- Jern, M.; Rogstadius, J.; Åström, T. Treemaps and Choropleth Maps Applied to Regional Hierarchical Statistical Data. In Proceedings of the 13th International Conference Information Visualisation, Barcelona, Spain, 15–17 July 2009. [Google Scholar] [CrossRef]
- Borgo, R.; Kehrer, J.; Chung, D.H.S.; Maguire, E.; Laramee, R.S.; Hauser, H.; Ward, M.; Chen, M. Glyph-based Visualization: Foundations, Design Guidelines, Techniques and Applications. In Eurographics 2013—State of the Art Reports; Sbert, M., Szirmay-Kalos, L., Eds.; The Eurographics Association: Geneve, Switzerland, 2013. [Google Scholar] [CrossRef]
- Ribarsky, W.; Ayers, E.; Eble, J.; Mukherjea, S. Glyphmaker: Creating customized visualizations of complex data. Computer 1994, 27, 57–64. [Google Scholar] [CrossRef]
- Theron, R.; Santamaria, R.; Garcia, J.; Gomez, D.; Paz-Madrid, V. Overlapper: Movie analyzer. Infovis Conf. Compend. 2007, 1, 140–141. [Google Scholar]
- Maguire, E.; Rocca-Serra, P.; Sansone, S.A.; Davies, J.; Chen, M. Taxonomy-Based Glyph Design—with a Case Study on Visualizing Workflows of Biological Experiments. IEEE Trans. Vis. Comput. Graph. 2012, 18, 2603–2612. [Google Scholar] [CrossRef] [PubMed]
- Legg, P.A.; Chung, D.H.S.; Parry, M.L.; Jones, M.W.; Long, R.; Griffiths, I.W.; Chen, M. MatchPad: Interactive Glyph-Based Visualization for Real-Time Sports Performance Analysis. Comput. Graph. Forum 2012, 31, 1255–1264. [Google Scholar] [CrossRef]
- Chung, D.H.; Legg, P.A.; Parry, M.L.; Bown, R.; Griffiths, I.W.; Laramee, R.S.; Chen, M. Glyph sorting: Interactive visualization for multi-dimensional data. Inf. Vis. 2013, 14, 76–90. [Google Scholar] [CrossRef] [Green Version]
- Khan, S.; Proctor, K.J.; Walton, S.; Bañares-Alcántara, R.; Chen, M. Alcántara, R.; Chen, M. A Study on Glyph-based Visualisation with Dense Visual Context. In Computer Graphics and Visual Computing (CGVC); Borgo, R., Tang, W., Eds.; The Eurographics Association: Geneve, Switzerland, 2014. [Google Scholar] [CrossRef]
- Fischer, F.; Fuchs, J.; Mansmann, F. ClockMap: Enhancing Circular Treemaps with Temporal Glyphs for Time-Series Data. In Proceedings of the EuroVis 2012, Vienna, Austria, 5–8 June 2012. [Google Scholar] [CrossRef]
- Elmqvist, N.; Fekete, J.D. Hierarchical Aggregation for Information Visualization: Overview, Techniques, and Design Guidelines. IEEE Trans. Vis. Comput. Graph. 2010, 16, 439–454. [Google Scholar] [CrossRef] [PubMed] [Green Version]
- Soares, A.G.M.; dos Santos, D.H.; Barbosa, C.L.R.; Goncalves, A.S.; dos Santos, C.G.R.; Meiguins, B.S.; Miranda, E.T.C. Visualizing Multidimensional Data in Treemaps with Adaptive Glyphs. In Proceedings of the 22nd International Conference Information Visualisation (IV), Fisciano, Italy, 10–13 July 2018. [Google Scholar] [CrossRef]
- Valiati, E.R.A.; Pimenta, M.S.; Freitas, C.M.D.S. A taxonomy of tasks for guiding the evaluation of multidimensional visualizations. In Proceedings of the 2006 AVI workshop on BEyond time and errors novel evaluation methods for information visualization—BELIV, Venice, Italy, 23 May 2006. [Google Scholar] [CrossRef]
- Kerracher, N.; Kennedy, J. Constructing and Evaluating Visualisation Task Classifications: Process and Considerations. Comput. Graph. Forum 2017, 36, 47–59. [Google Scholar] [CrossRef] [Green Version]
- Kelley, K.; Preacher, K.J. On effect size. Psychol. Methods 2012, 17, 137–152. [Google Scholar] [CrossRef] [PubMed]
- Nakagawa, S.; Cuthill, I.C. Effect size, confidence interval and statistical significance: A practical guide for biologists. Biol. Rev. 2007, 82, 591–605. [Google Scholar] [CrossRef] [PubMed]
- Bruce, P.; Bruce, A. Practical Statistics for Data Scientists: 50 Essential Concepts; O’Reilly Media, Inc.: Sebastopol, CA, USA, 2017. [Google Scholar]
- Diener, M.J. Cohen’s d. In The Corsini Encyclopedia of Psychology; American Cancer Society: New York, NY, USA, 2010; p. 1. [Google Scholar] [CrossRef]
Figure 1.
(a) A squarified Treemap with layered glyphs and (b) The adopted design strategy for the creation of layered glyphs, using overlapping layers, with each layer encoding a visual variable. The hierarchy of the Treemap maps three categorical dimensions, while the item’s size maps a quantitative one. The layers 1, 2 and 3 map a single categorical or ordinal dimension each, and layer 4 is a profile glyph that can map up to eight quantitative dimensions.
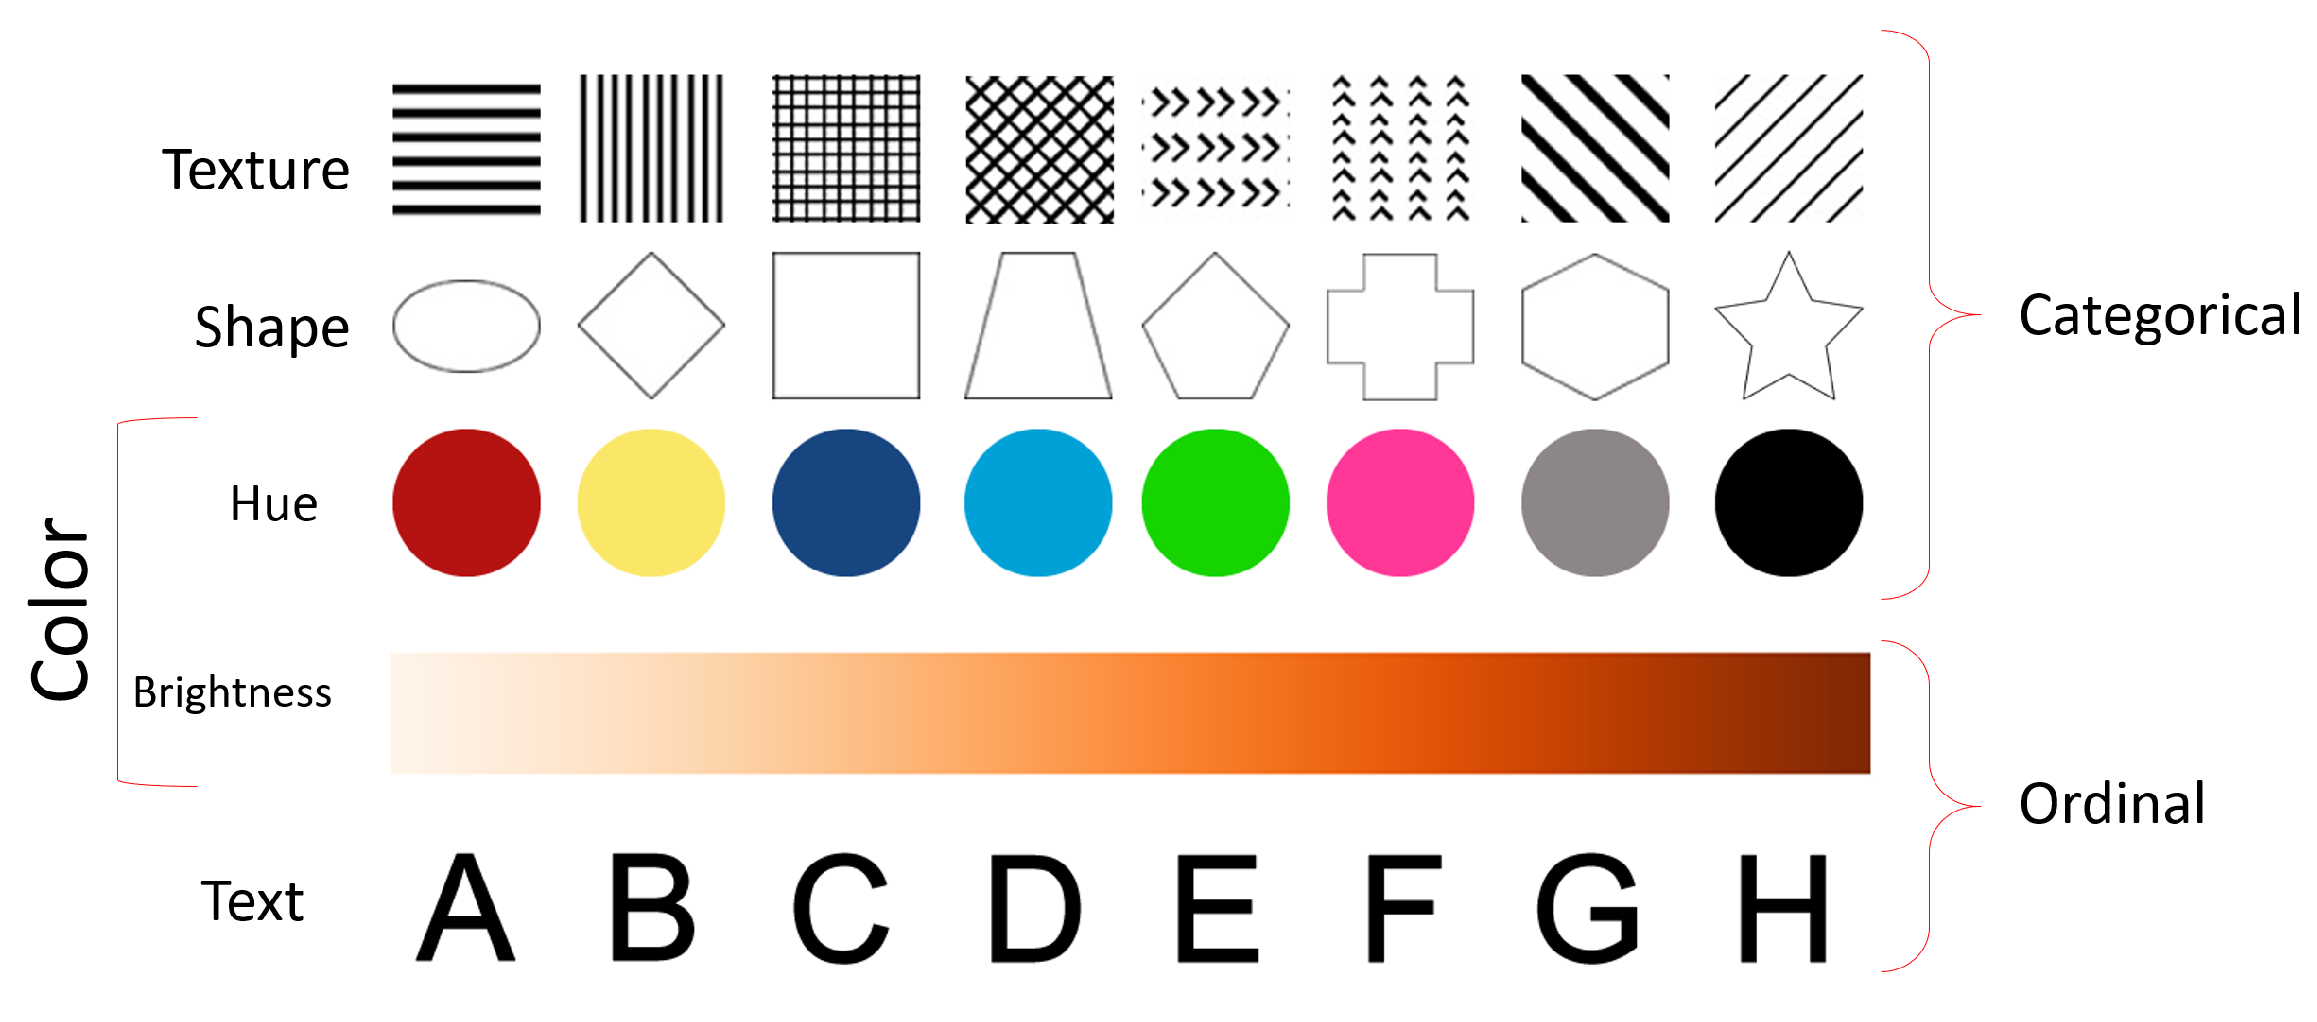
Figure 2.
The values used in this study referred to the visual variables (layers): texture, shape, color hue, color brightness and text.
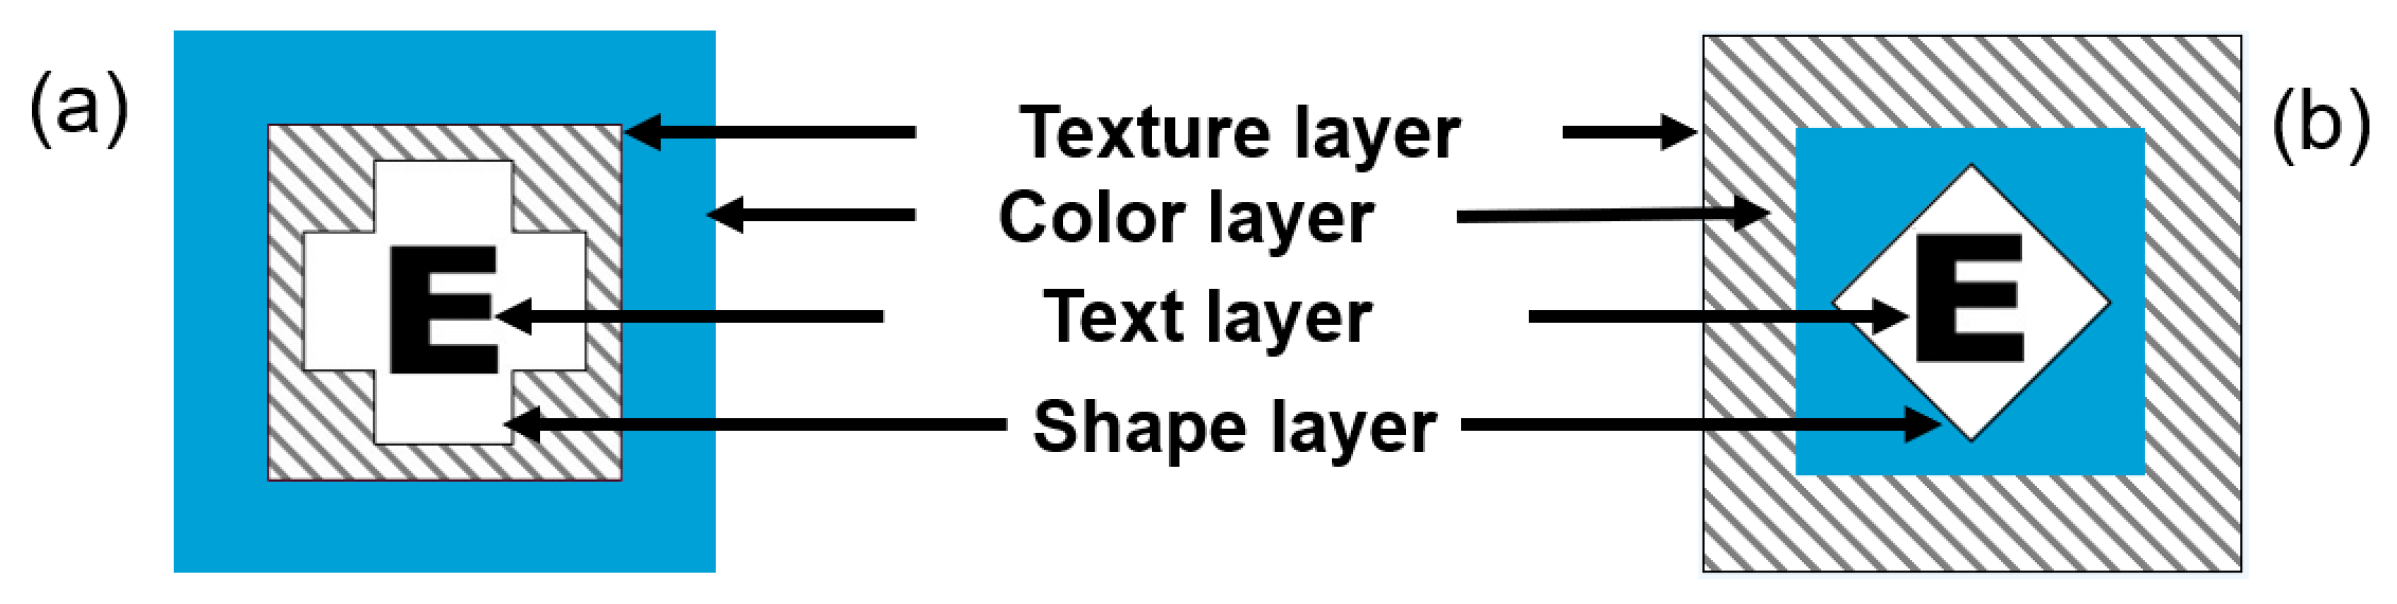
Figure 3.
Layered glyph’s design. (a)—A glyph with the visual variables: color, texture, shape, and text; (b)—In this glyph, color and texture were exchanged compared to (a).
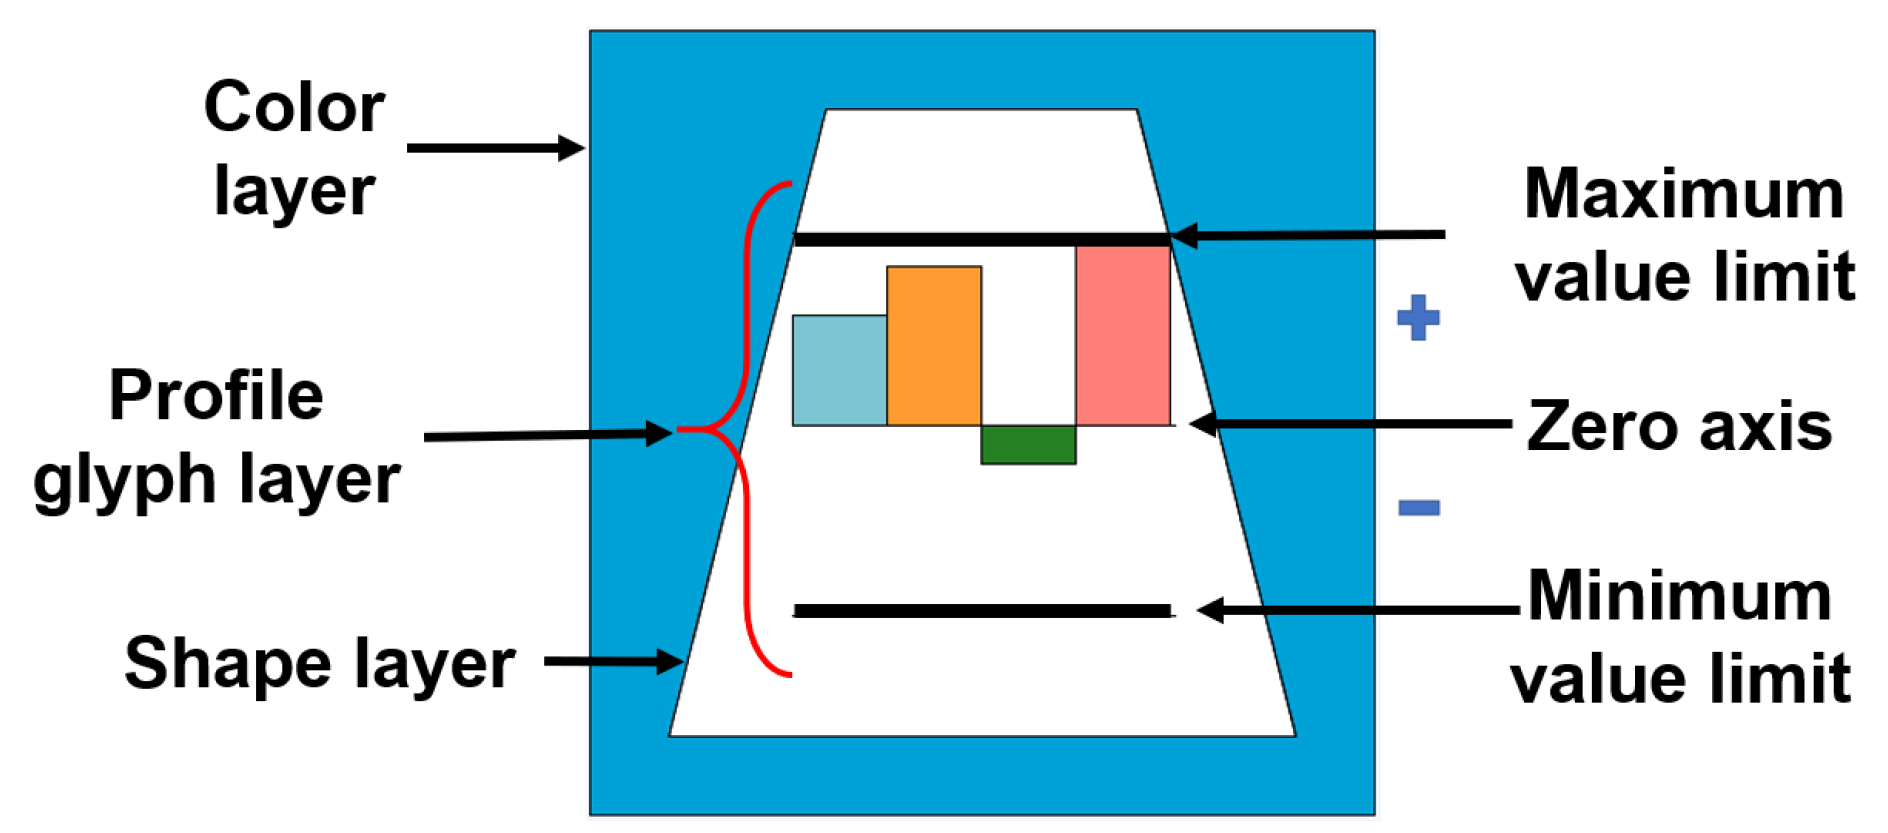
Figure 4.
A layered glyph with three layers. The top layer presents a profile glyph, which represents quantitative data of four dimensions. The bars indicate positive values (above the zero axis) or negative values (below the zero axis), always respecting the reference lines that indicate the maximum and minimum size of the bar.
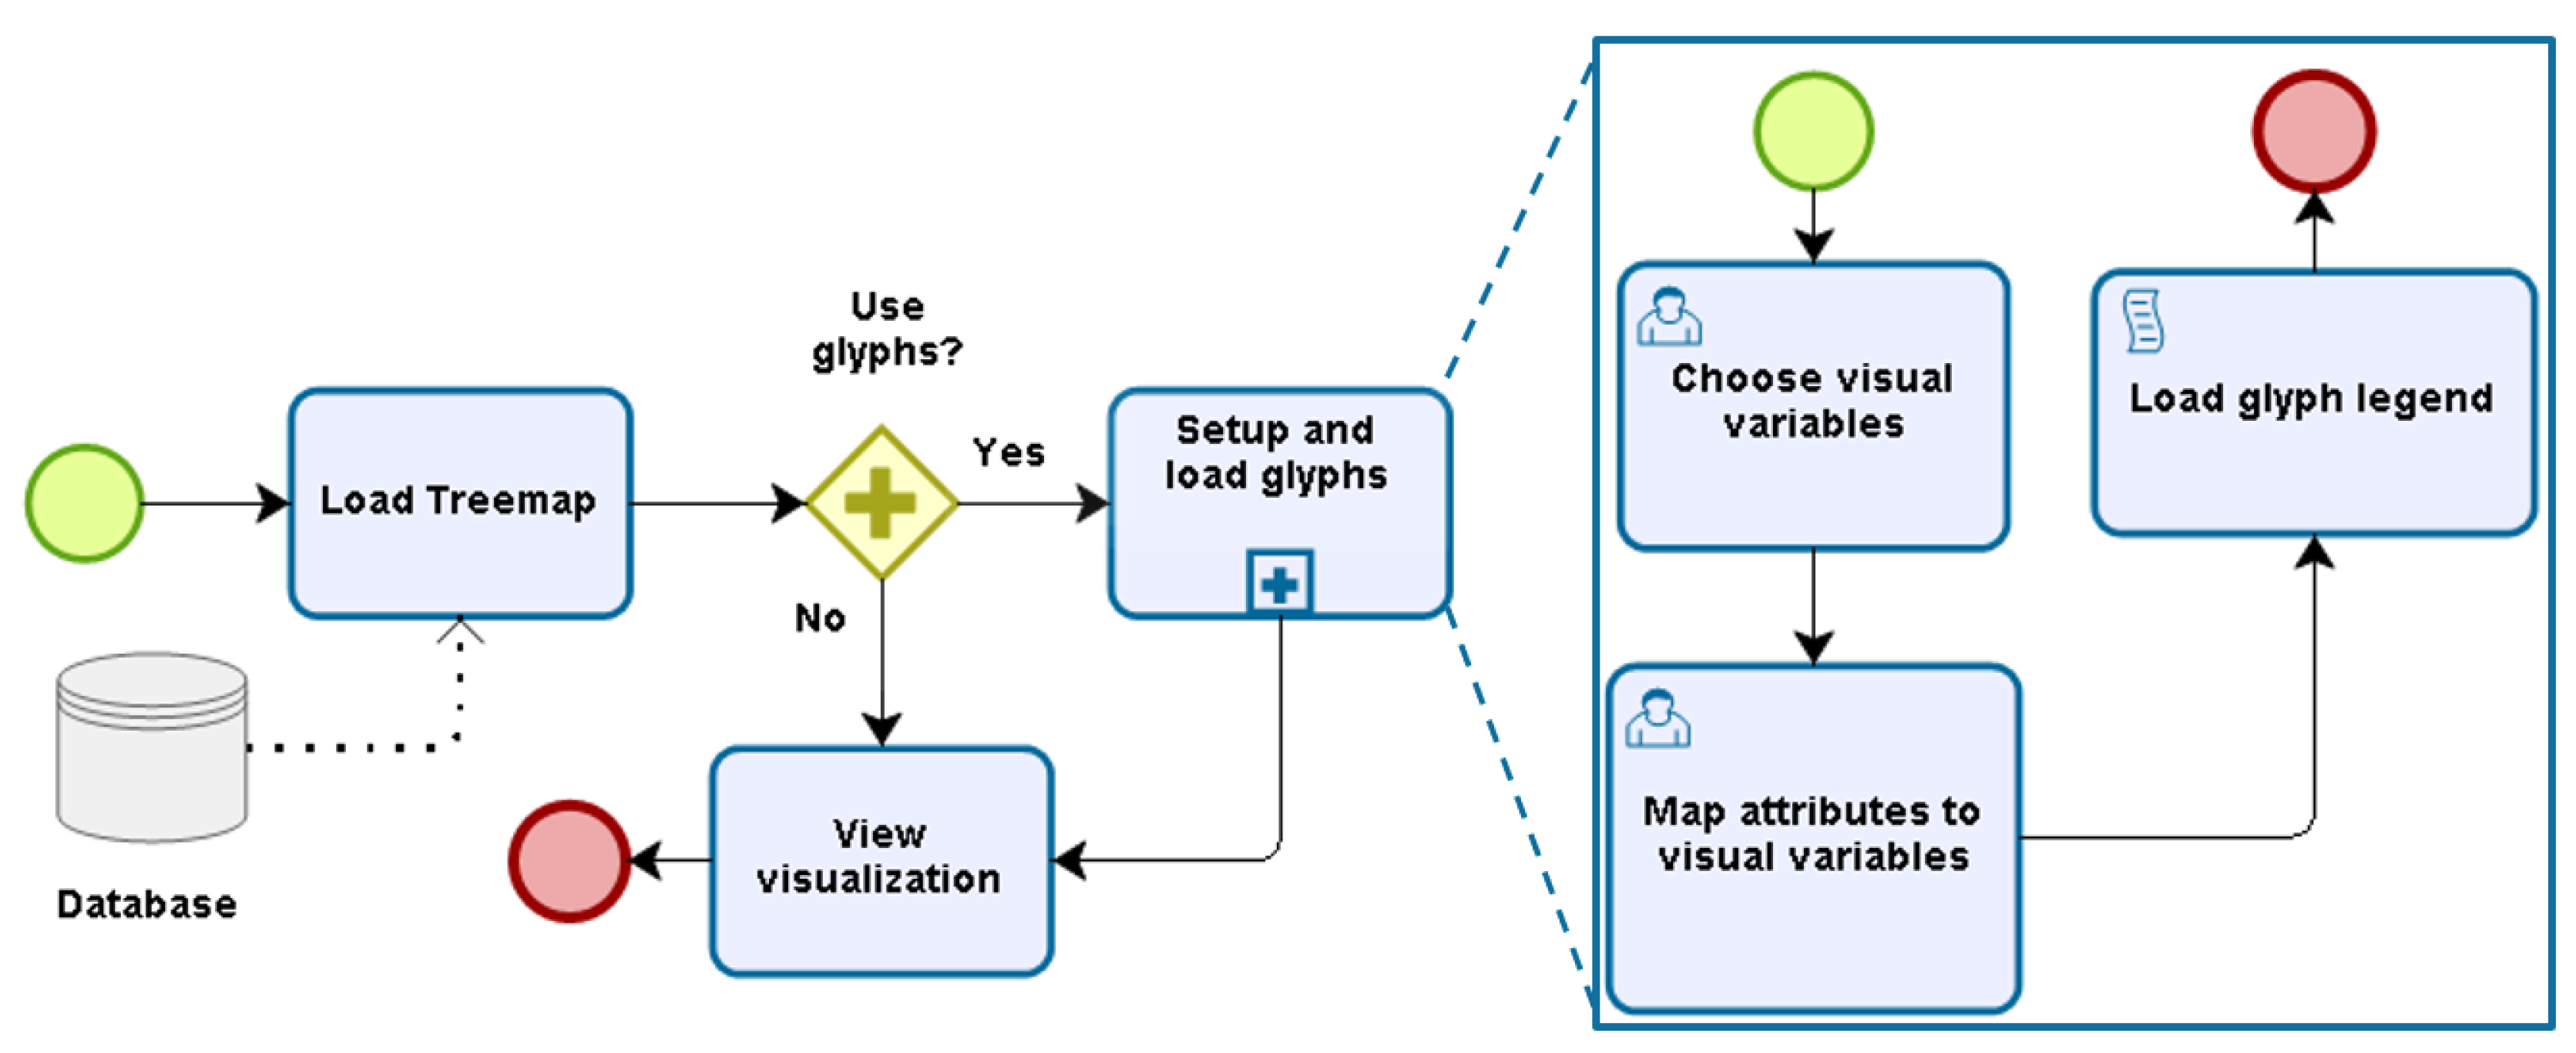
Figure 5.
Prototype’s process flow.
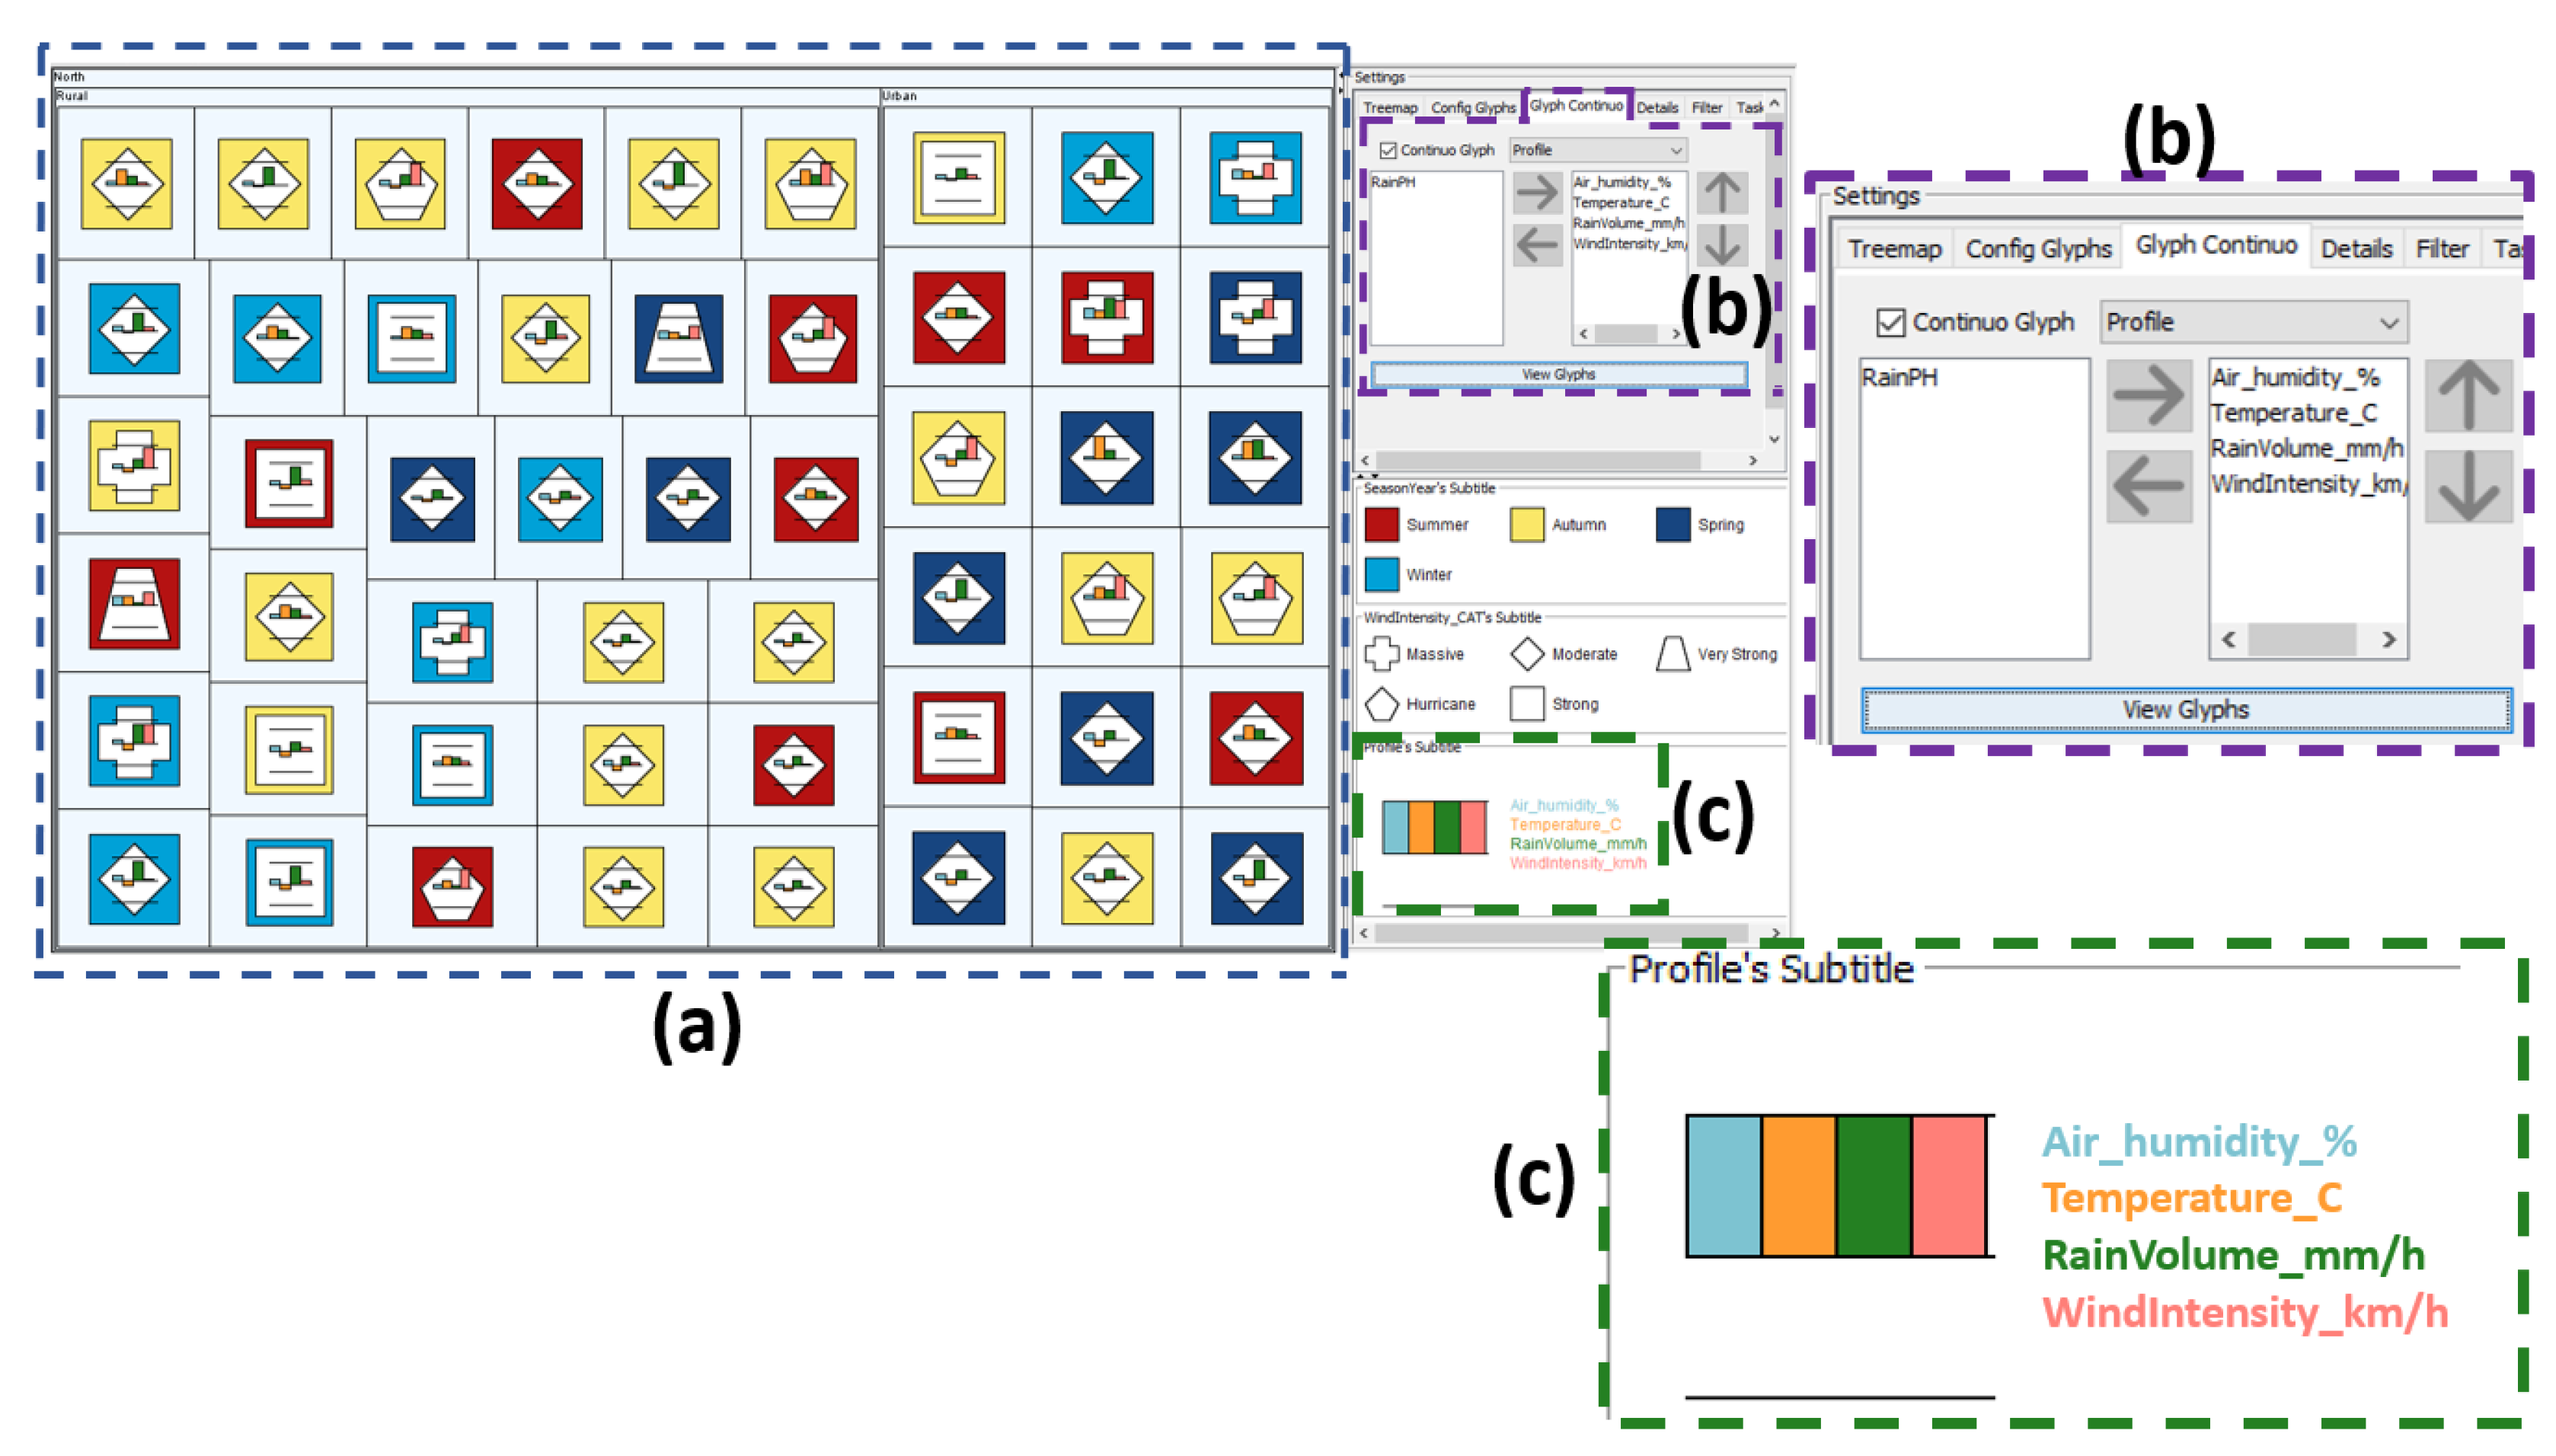
Figure 6.
(a)—Overview of the prototype composed by Treemap and glyphs; (b)—Glyph’s visual variables configuration area; (c)—Visual variables mapping area of the attributes; (d)—Presentation area of the glyph’s legend.
Figure 7.
(a)—An overview of the treemap with quantitative glyphs and hierarchy. (b)—Profile glyph dimensions configuration. (c)—Profile glyph legend.
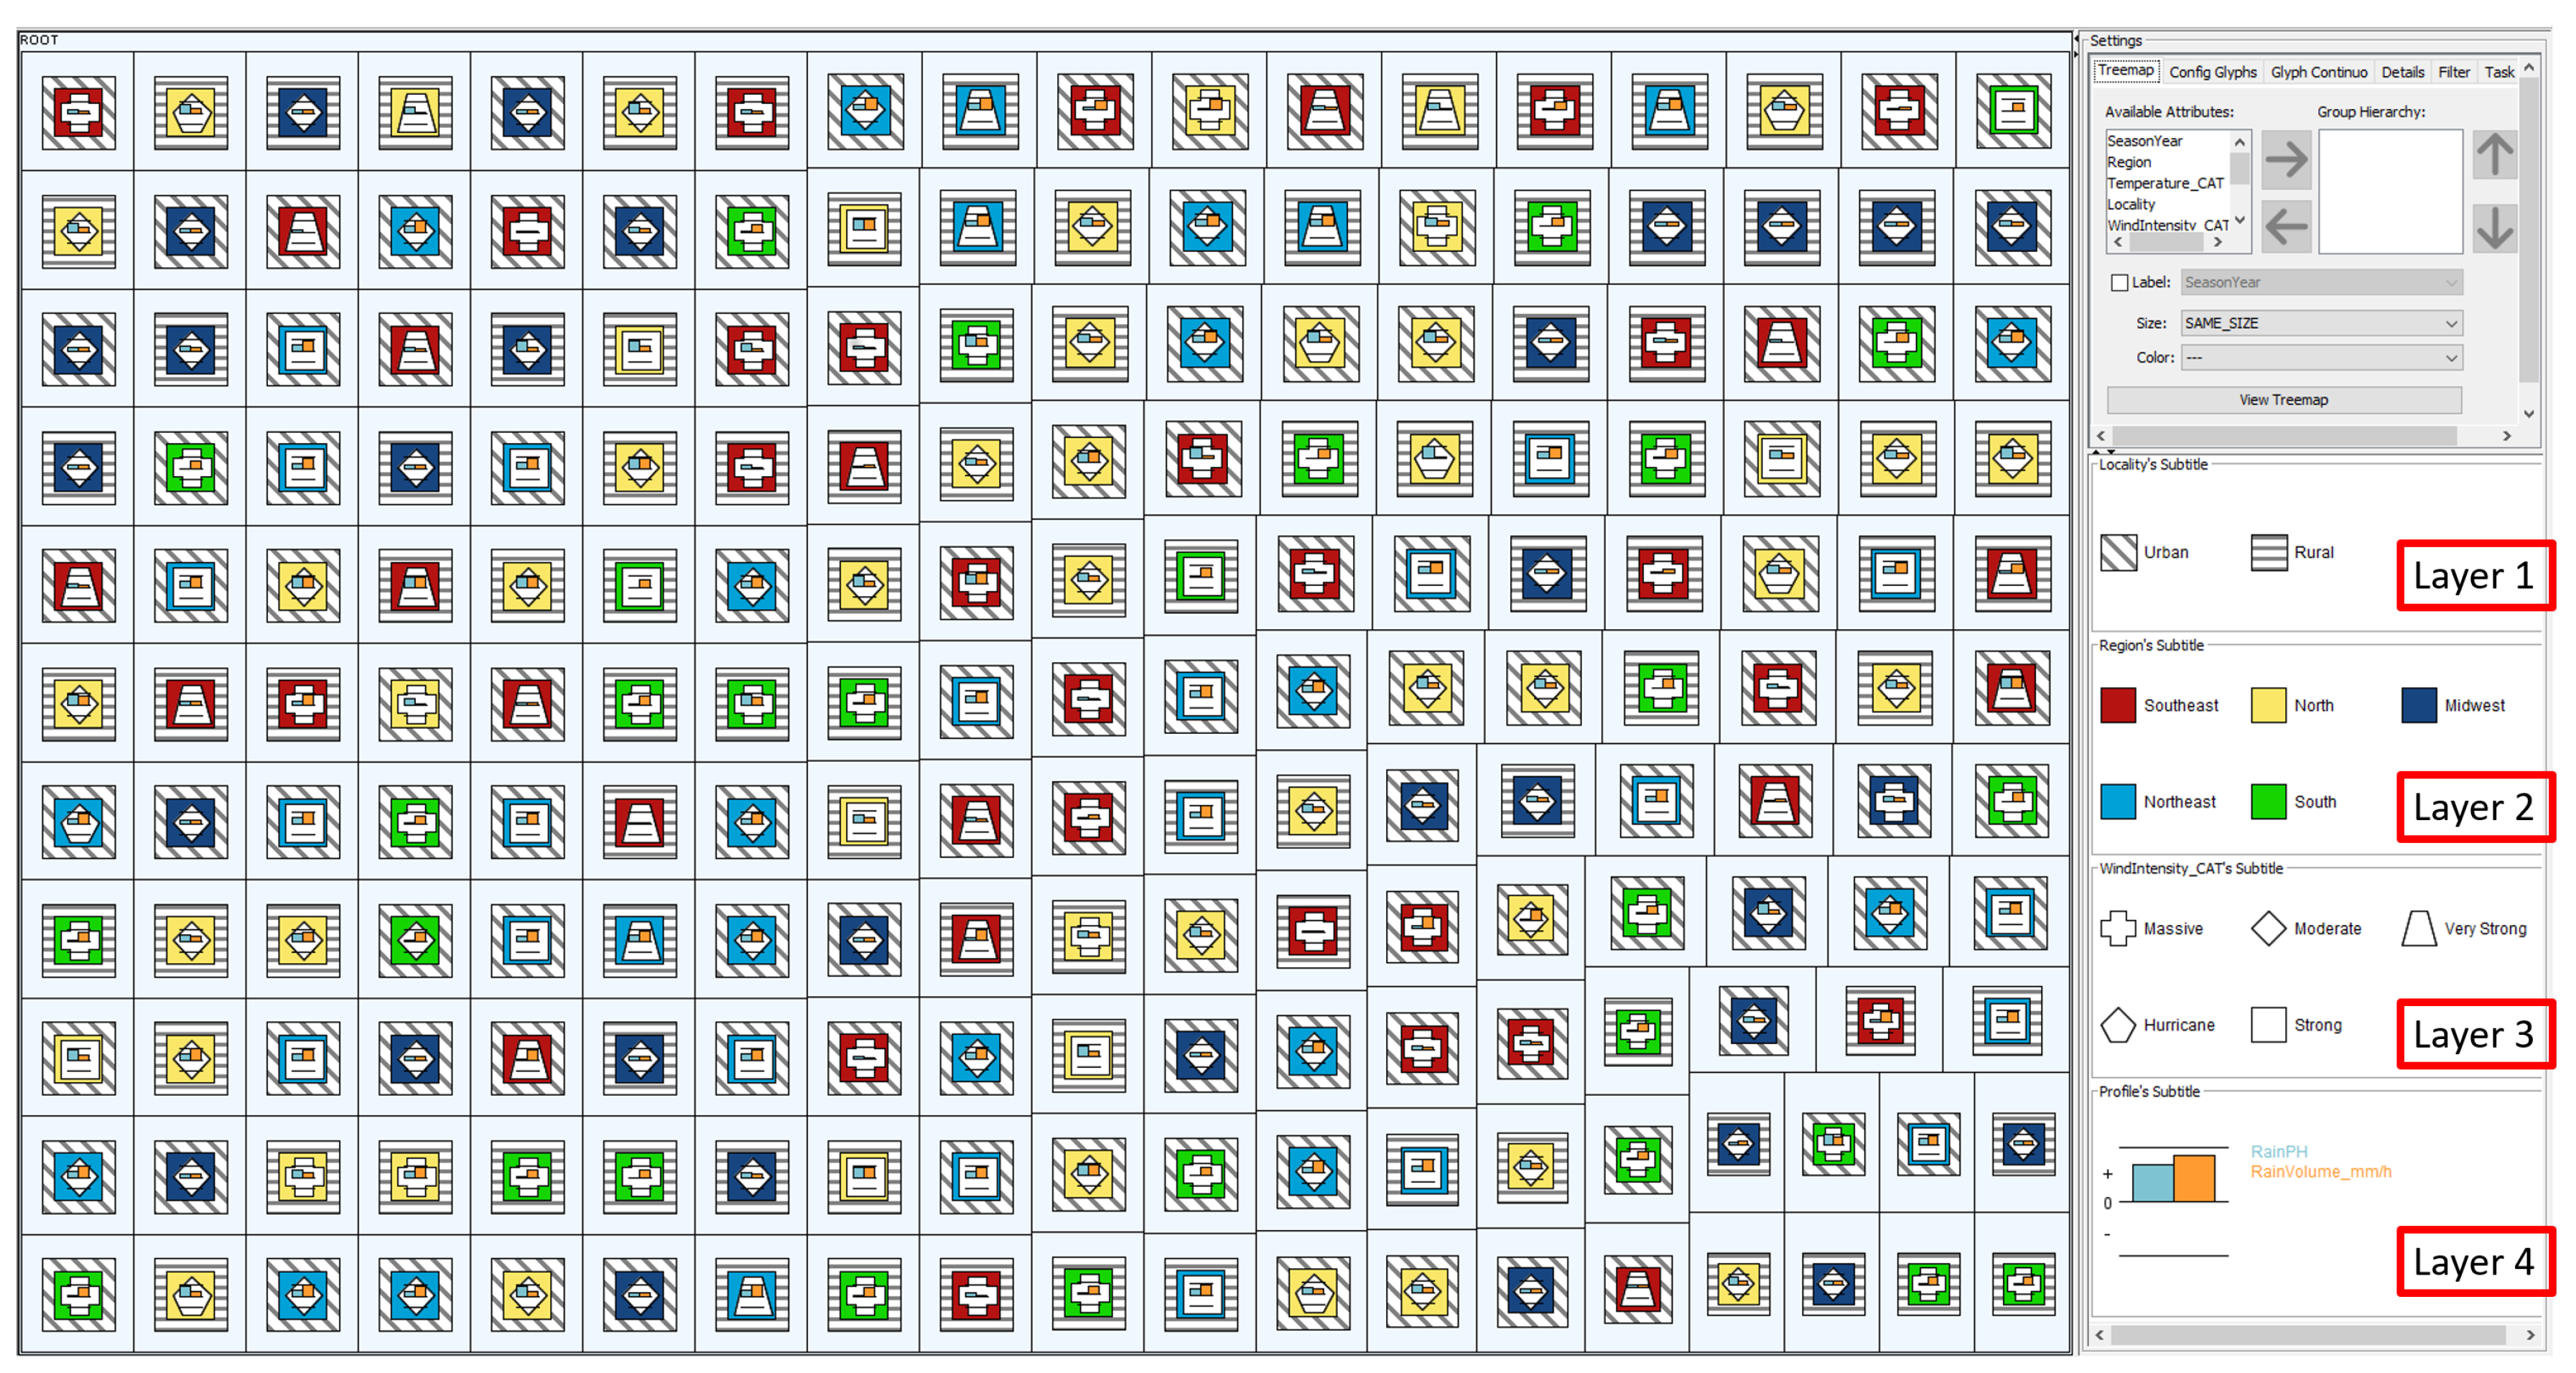
Figure 8.
Scenario Glyphs (G) visualization configured for one of the user tasks. This visualization uses no Treemap hierarchy; the absence of hierarchy is replaced by categorical glyphs.
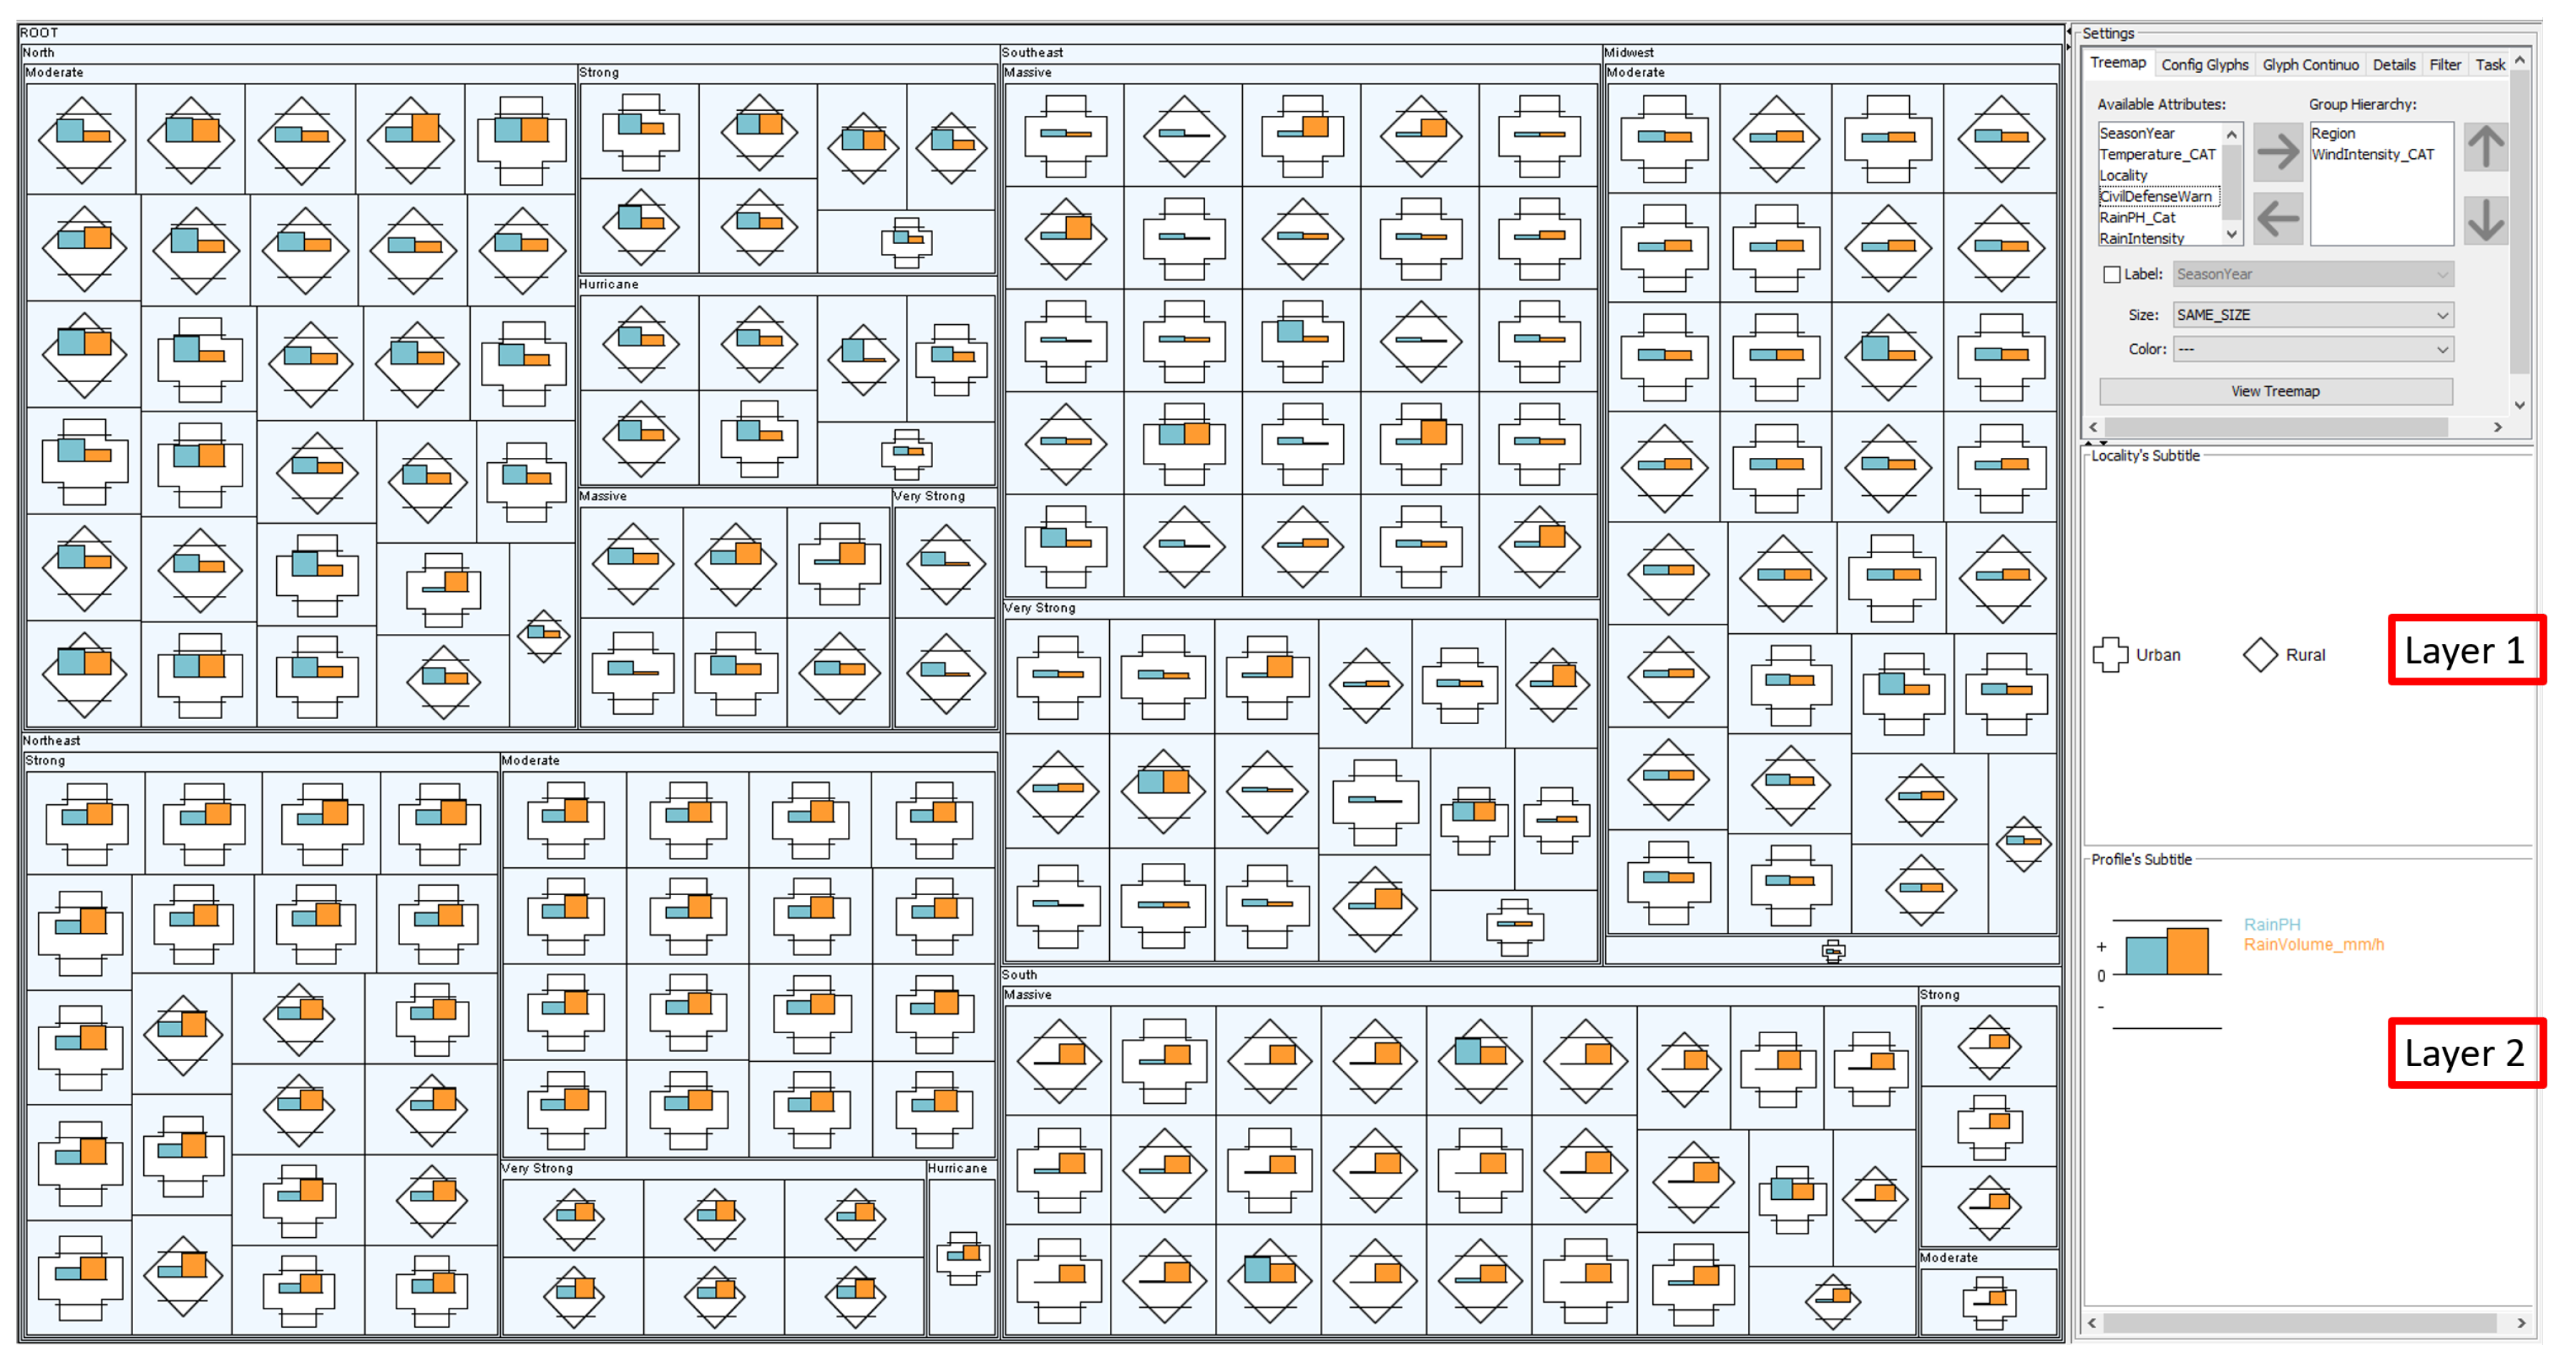
Figure 9.
Scenario Glyphs and Hierarchy (GH) visualization configured for one of the user tasks. This visualization is a Treemap with hierarchy and complemente.
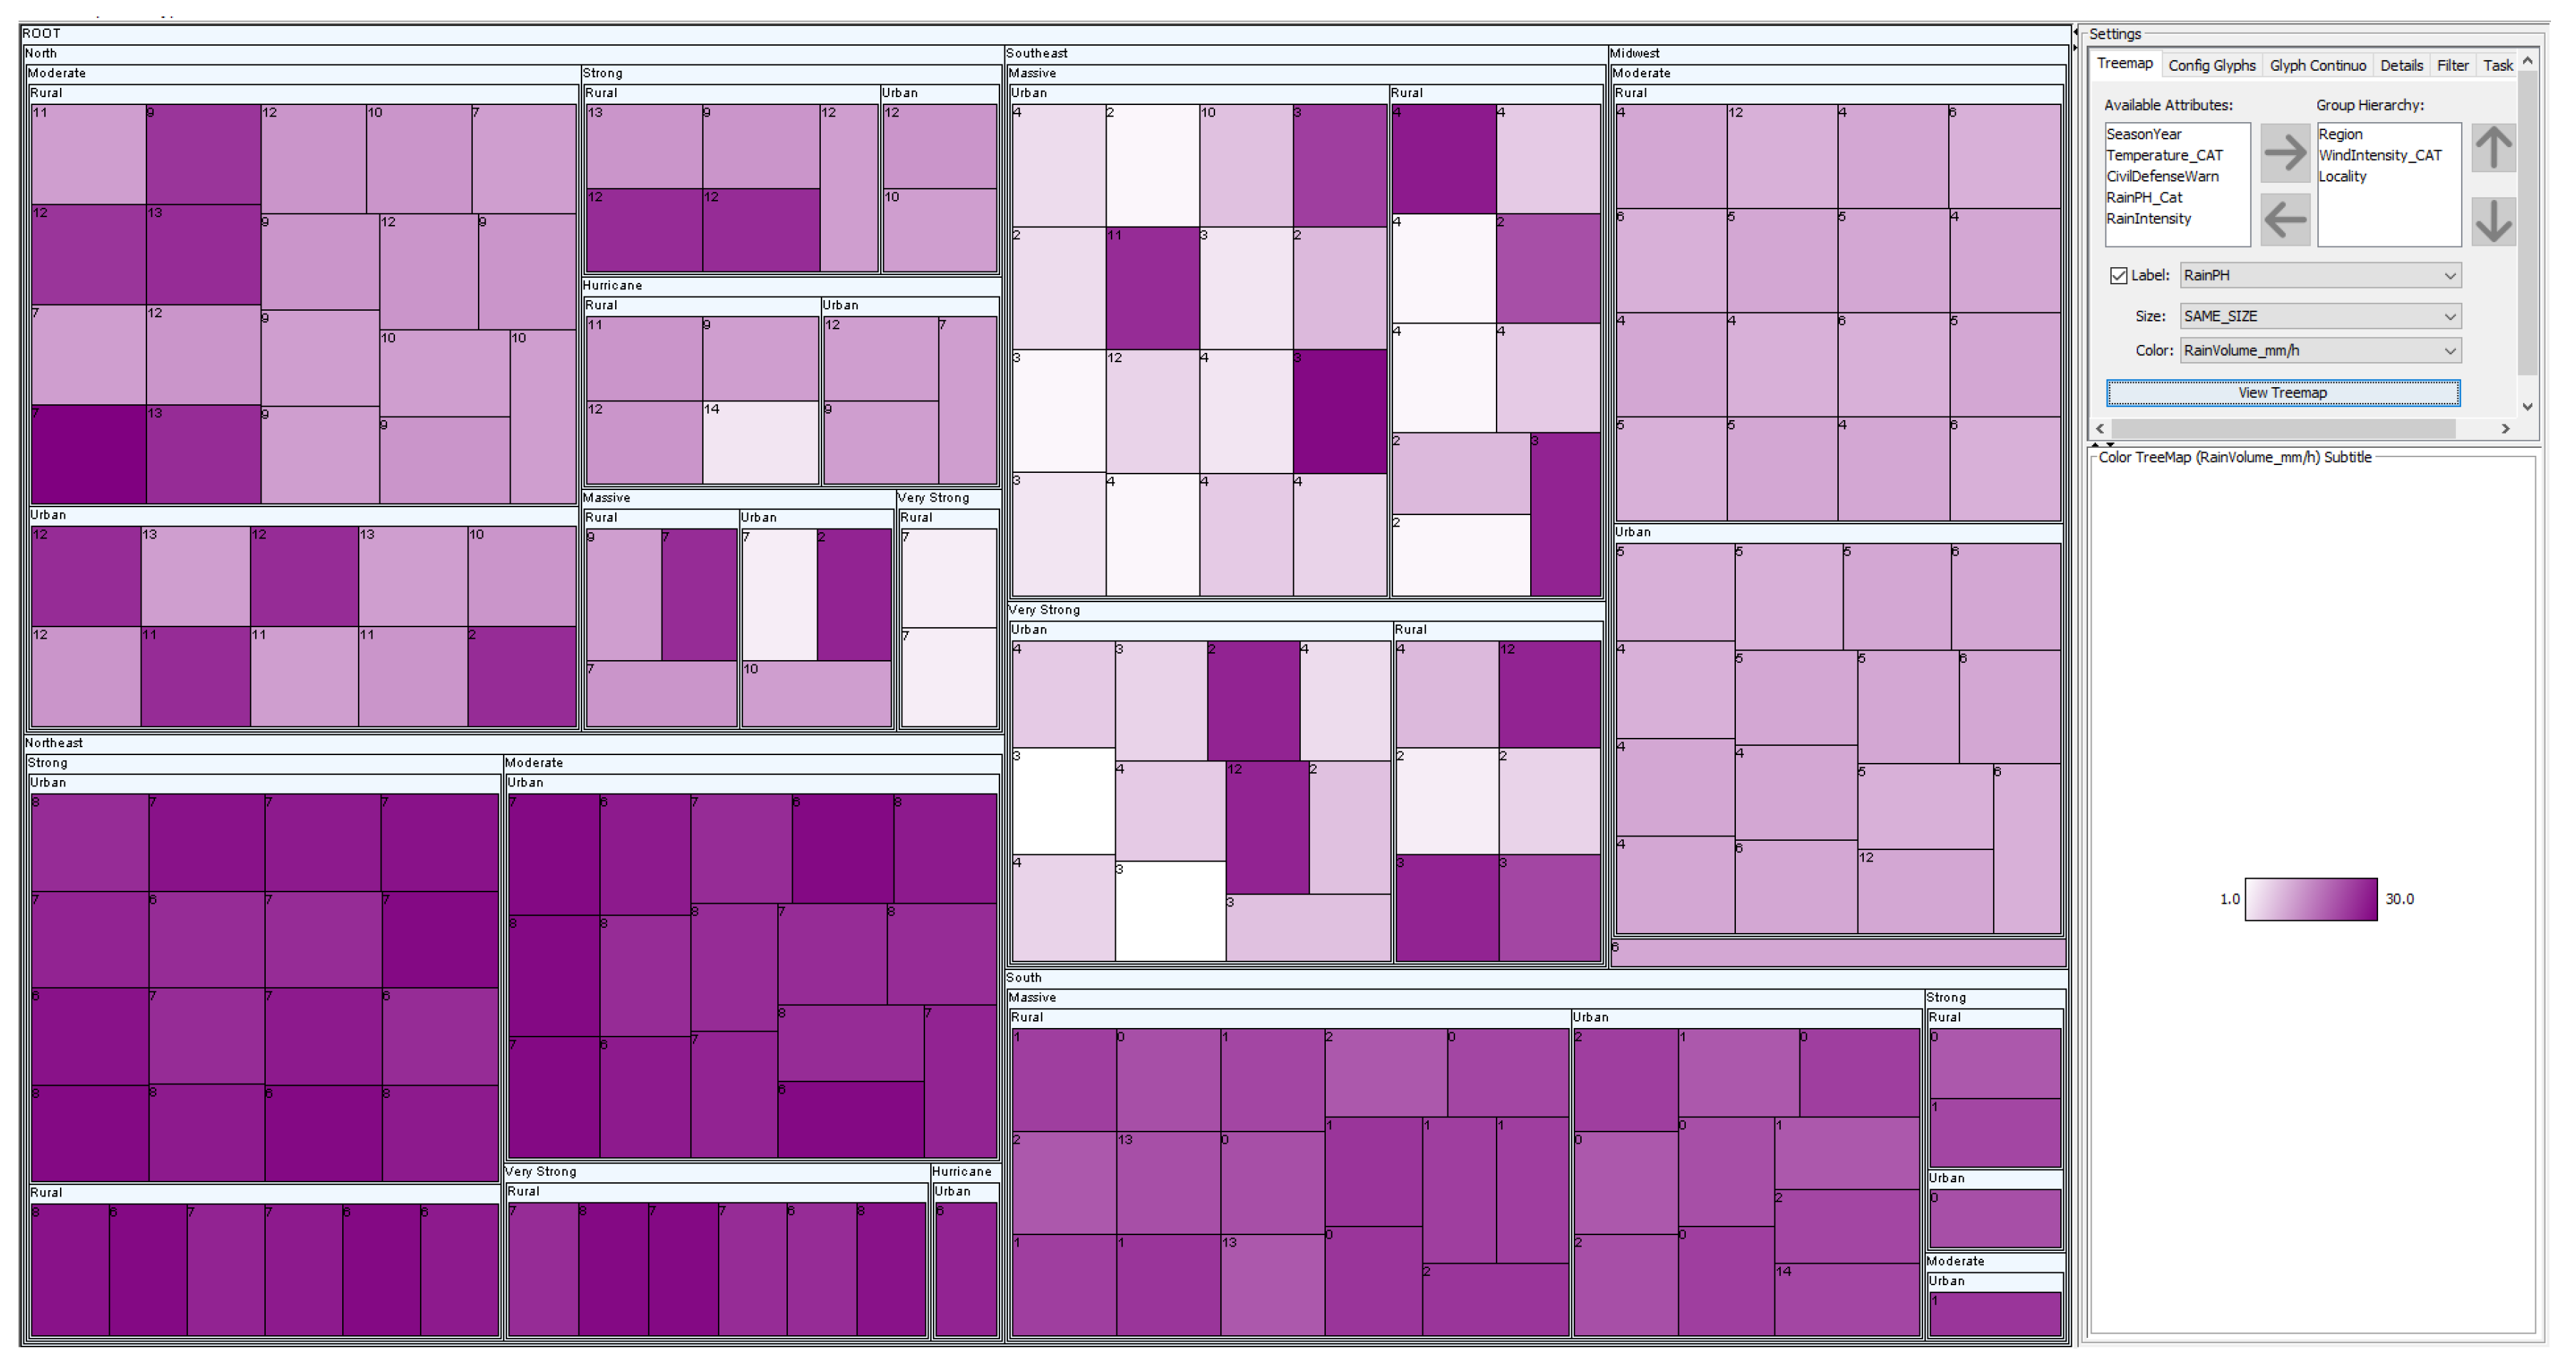
Figure 10.
Visualization of Scenario Hierarchy (H) visualization configured for one of the user tasks. This visualization is a squarified Treemap with no glyphs.
Figure 11.
Example of task displayed to the participant, the task command and the submit button is above the visualization.
Figure 12.
How to interpret the charts for the results of one task in the following sections. (a)—Quantity of correct and incorrect answers and a pair-wise test using bootstrapping; (b)—Mean response time with 95% confidence intervals; (c)—Pair-wise time comparison using bootstrapping and Cohen’s d.
Figure 13.
(a)—Right/Wrong answers, and pair-wise test using bootstrapping; (b)—Response time confidence interval; and (c)—Pair-wise test time; for tasks T1, T2, T3, and T4.
Figure 14.
(a)—Right/Wrong answers, and pair-wise test using bootstrapping; (b)—Response time confidence interval; and (c)—Pair-wise test time; for tasks T5, T6, T7, and T8.
Figure 15.
Total of errors in scenarios.
Table 1.
Proposals that used glyphs and proposals that used glyphs in treemaps compared with our approach.
| | [38] | [39] | [40] | [41] | [42] | [43] | [44] | [45] | [46] | Our Approach |
|---|
| Uses glyph in the overview | X | ✓ | ✓ | ✓ | ✓ | X | ✓ | X | ✓ | ✓ |
| Increases amount of dimensions | ✓ | ✓ | ✓ | ✓ | ✓ | ✓ | ✓ | X | ✓ | ✓ |
| Number of visual variables | 3 | 1 | 2 | 6 | 8 | 4 | 2 | 1 | 4 | 5 |
| Uses squarified Treemap | X | X | X | X | X | ✓ | X | X | ✓ | ✓ |
| Glyph uses overlay | X | ✓ | ✓ | ✓ | ✓ | X | X | X | ✓ | ✓ |
| Uses quantitative glyph | ✓ | X | X | ✓ | ✓ | ✓ | ✓ | ✓ | X | ✓ |
| Uses categorical glyph | ✓ | ✓ | ✓ | ✓ | ✓ | ✓ | X | X | ✓ | ✓ |
| Glyph is domain-agnostic | ✓ | X | X | X | X | X | X | ✓ | ✓ | ✓ |
| Uses Treemap layout | X | X | X | X | X | ✓ | ✓ | ✓ | ✓ | ✓ |
| Had user studies | X | X | X | X | X | ✓ | X | X | X | ✓ |
Table 2.
Dimensions of the synthetic weather dataset.
| Dimension | Data Type | Data |
|---|
| SeasonYear | categorical | spring, summer, autumn, winter |
| Region | categorical | north, northeast, midwest, southeast, south |
| RainPH | quantitative | 0 to 14 |
| Air humidity% | quantitative | 1 to 70 |
| Temperature_C | quantitative | −15 to 35 |
| Temperature_CAT | categorical | low, medium, high |
| Locality | categorical | rural, urban |
| RainVolume_mm/h | quantitative | 1 to 30 |
| WindIntensity_km/h | quantitative | 1 to 120 |
| WindIntensity_CAT | categorical | moderate, massive, hurricane, strong, very strong |
| CivilDefenseWarn | categorical | activated, non-activated |
| RainPH_Cat | categorical | acid, base, neutral |
| RainIntensity | categorical | weak, moderate, strong, very strong |
Table 3.
List of tasks used in the evaluation.
| Tasks | Discussed Hypotheses | What Is Being Evaluated? |
|---|
| T1—Locate the region where a basic rain record occurred, with massive winds, and had the civil defense alert activated. | H1, H2, H3, H4, H5, and H6 | The use of glyphs to replace hierarchies. |
| T2—In the northern region, during the summer, select the three highest wind intensities. | H2 | The facility to locate the highest values. |
| T3—In the Northeast region, select the record (one only) with a negative temperature. | H3 | The facility to locate the negative values. |
| T4—Select the unique record in the south region for the rain with zero PH, strong winds and rural location. | H4 | The facility to locate the zero values. |
| T5—Locate the region that registered only one occurrence of a hurricane. | H5 | The facility to locate the unique value. |
| T6—Locate the region which has only one record of acid rain and low temperature. | H5 | The facility to locate the unique and small value. |
| T7—Identify the wind intensity pattern for the rural location of the midwest region. | H6 | The facility to identify patterns. |
| T8—During the spring, identify the region which has the lowest average air humidity. (%). | H6 | The facility to identify and compare patterns between groups. |
Table 4.
Attributes distribution in the scenarios G, GH, and H on realizing the task 4. The user task used the same attributes, differing on the use of visual mapping.
| Visual Mapping | G | GH | H |
|---|
| Treemap Size | — | — | — |
| Treemap Label | — | — | RainPH |
| Treemap Color | — | — | RainVolume_mm/h |
| Treemap Hierarchy | — | Region, WindIntensity_CAT | Region, WindIntensity_CAT, Localion |
| Glyph Texture | Localion | — | — |
| Glyph Color | Region | — | — |
| Glyph Shape | WindIntensity_CAT | Localion | — |
| Glyph Text | — | — | — |
| Profile Glyph | RainPH, RainVolume_mm/h | RainPH, RainVolume_mm/h | — |
| Total attributes used | 5 | 5 | 5 |
© 2020 by the authors. Licensee MDPI, Basel, Switzerland. This article is an open access article distributed under the terms and conditions of the Creative Commons Attribution (CC BY) license (http://creativecommons.org/licenses/by/4.0/).

 ,
, 


