Article

The Effects of a Predictive HMI and Different Transition Frequencies on Acceptance, Workload, Usability, and Gaze Behavior during Urban Automated Driving

Institute of Ergonomics, Technical University of Munich, 80333 München, Germany
*
Author to whom correspondence should be addressed.
Submission received: 13 December 2019 / Revised: 15 January 2020 / Accepted: 27 January 2020 / Published: 30 January 2020
(This article belongs to the Special Issue Automotive User Interfaces and Interactions in Automated Driving)

Abstract

:
Automated driving research as a key topic in the automotive industry is currently undergoing change. Research is shifting from unexpected and time-critical take-over situations to human machine interface (HMI) design for predictable transitions. Furthermore, new applications like automated city driving are getting more attention and the ability to engage in non-driving related activities (NDRA) starting from SAE Level 3 automation poses new questions to HMI design. Moreover, future introduction scenarios and automated capabilities are still unclear. Thus, we designed, executed, and assessed a driving simulator study focusing on the effect of different transition frequencies and a predictive HMI while freely engaging in naturalistic NDRA. In the study with 33 participants, we found transition frequency to have effects on workload and acceptance, as well as a small impact on the usability evaluation of the system. Trust, however, was not affected. The predictive HMI was used and accepted, as can be seen by eye-tracking data and the post-study questionnaire, but could not mitigate the above-mentioned negative effects induced by transition frequency. Most attractive activities were window gazing, chatting, phone use, and reading magazines. Descriptively, window gazing and chatting gained attractiveness when interrupted more often, while reading magazines and playing games were negatively affected by transition rate.

1. Introduction

With the ongoing research in the field of automated driving, the focus of human factors research is shifting toward urban automated driving, non-critical transitions, and so-called non-driving related activities (NDRA). Currently, SAE Level 2 systems like Tesla autopilot are already on the market [1], allowing the user to activate the system on highway and rural roads. When activated, the automation takes over longitudinal and lateral control, but constant supervision by the driver is required. Starting from the subsequent Level 3 automation, no supervision by the user is needed and therefore engaging in NDRA becomes legal [2]. This marks a paradigm shift from a dual task paradigm (driving task + secondary task) to a task-switching paradigm; the user is allowed to spend longer time on NDRA before switching to an interrupting task (e.g., taking over manual control or attending HMI messages) [3]. According to Huemer and Vollrath [4], the term NDRA covers all activities unrelated to the driving task. König and Neumayr [5] have found the engagement in NDRA to be the second-most important advantage of automated driving cars, outstripped only by enhanced mobility options for the elderly and disabled. Nowadays, 46% of car drivers say their time in a car is “lost” [6]. On train trips, 13% of travelers consider their travel time as “waste” [7], illustrating the potential of automated driving to increase comfort in future mobility. In several driving simulator studies, the likelihood of activity engagement has been shown to increase with rising levels of automation [8,9]. This engagement can furthermore affect the evaluation of the journey—people who mostly spend their time on working, reading, and writing emails for business purposes appreciate their travel time most [7].

1.1. Background

In recent automotive human factors research, the focus has been on extracting factors influencing the take-over performance in case of unexpected and urgent requests to intervene (RtI) due to extreme weather, missing lane markings, accidents, and software and hardware errors [10,11,12]. While these safety-critical, but probably exceptional, take-over situations have consequently been highly researched, planned and more frequently occurring transitions are underrepresented, but are gaining attention [12,13,14,15]. In research on urgent take-over situations, the impact of different NDRA was also assessed, but mainly using standardized tasks like n-back or a surrogate reference task [16]. Consequently, questions on user needs resulting from naturalistic activity engagement were not covered. In order to investigate the attractiveness of different NDRA and in turn derive HMI requirements, published online surveys, observations in busses and trains, and driving simulator studies were researched by the authors. An online survey querying end-user expectations on naturalistic NDRA engagement in automated driving has been conducted by Pfleging et al. [17]. Their survey with 300 participants reveals that users would most frequently listen to music, talk to other passengers, and look out of the window. However, activities that are (legally) enabled by automated driving, like texting, Internet surfing, eating/drinking, and reading, are also popular. Less attractive are sleeping, watching movies, office tasks, and games. In another online survey by Sommer [18] of 7000 participants across seven countries, people also rated listening to music/radio and talking to other passengers as most attractive, followed by phone calls and writing and checking email. Another method was used by Pfleging et al. [17]—the researchers interviewed 43 users of public transportation in Munich and found the majority of people were text messaging, talking to other passengers, using social media features, calling, listening to music, and sleeping. Also covering train rides, a survey of 19,715 train travelers in Great Britain revealed reading for leisure and window gazing/people watching to be the two most prominent activities, followed by sending text messages, working/studying, and listening to music/radio/podcast [7]. Similarly, Thalys [19] found reading newspaper/magazines to be the most attractive activity, followed by doing nothing/relaxing, reading a book, listening to music, sleeping, playing games, working, and watching a movie. This was obtained in an online survey of 4025 travelers of the European high-speed train Thalys.
Despite different NDRA terminology and different methods used in the presented studies, activities people desire to do during an automated car drive (most attractive: listening to music, talking to other passengers) seem to differ from those performed on a train trip (most attractive: reading, texting). Desired activities are more similar to today’s activities in manual driving [20]. This might be due to a lack of experience with automated driving and a lack of trust amongst the respondents. We therefore investigated driving simulator studies dealing with free NDRA engagement. Only two such studies were found. A study was performed by Large et al. [21], with five participants driving the same drive twice a day for one week, thus simulating commuting with a conditionally automated car and free NDRA. The most common activities were reading an article or magazine, social network activities, web-browsing, and watching films. In another study by Hecht et al. [22], the researchers observed 20 participants during a 60 minute conditionally automated monotonous highway drive and coded NDRA engagement. Most participants engaged in gazing out of the window, followed by phone use, reading books and magazines, browsing the pre-installed tablet, and watching videos. When considering the total time spent on activities as a measure of attractiveness, watching videos is the most attractive NDRA, followed by gazing out of the window, phone use, and listening to music on the tablet. The activity with the highest average engagement duration is laptop use, followed by listening to music, watching videos, and playing games. These studies suggest activity engagement during automated driving to be more like activity engagement on train rides than during today’s manual driving. However, many researchers highlight large individual differences in the choice of activities and their respective durations [21,22]. Hecht et al. [23] thus researched factors influencing the choice of activities and found that factors involving privacy, comfort, travel purpose, trip duration, and age have an effect on the attractiveness of several activities in an online survey with 200 participants.
However, SAE Level 3 automation is, at least in Germany, not approved, neither for highway driving, nor for rural areas or cities. Moreover, the introduction of fully automated cars is still a long way off [24]. When talking about Level 3 and 4 automation, one must also keep in mind that it can prompt the driver to take over manual control during the trip (or start a minimum risk maneuver), thus interrupting the user during NDRA engagement. Especially in the city with its complex infrastructure and large amount of vulnerable road users, shorter periods of automated driving time, e.g., only between two extensive crossroads, may appear and thus raise the frequency of RtIs [25]. Task interruptions, however, can cause negative effects (see Janssen et al. [26] for an extensive overview). Studies found interruptions to worsen primary task performance by additional time required to finish the primary task, by a higher load on the work memory, and higher error rates [27,28]. They can furthermore cause discomfort by increasing subjectively experienced annoyance and anxiety [29] and increase the total workload [30] (especially for complex tasks [31]). A task interruption prior to task completion is particularly problematic because of the high motivation to finish the task [32]. Interrupting a task also requires self-control, which is limited and decreasing over time [33]. Furthermore, interruptions and the subsequent manual driving periods potentially reduce the perceived usefulness and thus lower the acceptance of automated driving functions [3]. Naujoks et al. [3] have consequently highlighted the importance of interruption management for HMI design in automated driving. The interruption process includes interruption lag, interruption length, and resumption lag [3,34]. Both interruption length and mental effort needed to process the interrupting task have the potential to worsen post-interruption NDRA performance [35]. Closely linked to interruptions is the process of activity planning. According to the three-level model of planning by Schömig and Metz [36] and Wandtner et al. [15], appropriate self-regulatory behavior includes limiting task engagements to sections of automated driving (planning level), considering estimated task duration and predicted system availability (decision level), and maintenance of take-over readiness (control level). Planning one’s activity engagement in automated driving can be supported by predictive HMI elements that display current and upcoming periods of automated driving, thus theoretically allowing the user to adapt NDRA engagement and in turn reduce workload and discomfort due to interruption events. Beggiato et al. [37] consequently name “remaining time to take over” as one of the items of the system status, that was identified as the most important item needed in Level 3 automation. In a study by Hecht et al. [23], remaining time in automated driving mode was rated the second-most important information item in urban automated driving (after reliability). Moreover, NDRA engagement was found to lower the importance of most information items, but it did not affect the importance of the predictive HMI. In line with this, significantly different time budgets are required for different NDRA, for example an average time budget of 10 minutes for smartphone use and 76 minutes for sleeping. This is undermining the importance of predictive HMI elements for the activity planning process in automated driving with the option to engage in various NDRA, which was also confirmed by Danner et al. [38] in a qualitative driving simulator study.
Studies actually investigating design and effects of predictive HMI elements were conducted by Richardson et al. [14], Wandtner et al. [15], and Holländer et al. [12]. All three studies found positive effects; Richardson et al. [14] discovered time- and distance-based predictive HMIs for conditionally automated trucks to lower workload, and increase acceptance and usability compared to a baseline HMI with no predictive elements. No difference was found between the predictive HMIs. However, post-study questions revealed distance-based HMI to be the favorite. Richardson et al. [14] assume the professional truck drivers’ background to be the reason for this preference. Positive effects on usability were also found by Holländer et al. [12]. In a study in a simple static driving simulator, a bar indicator and a countdown were compared with a baseline HMI with no additional information on the remaining length of the automated driving section. The bar indicator was rated best in both usability and personal preferences. Not displaying planned RtIs leads to significantly lower usability ratings than visual feedback with a dynamic bar. Also dealing with a distance-based predictive HMI, Wandtner et al. [15] assessed its impact on NDRA engagement. In a driving simulator study with several requests to intervene in a Level 3 highway scenario, a predictive HMI was supplemented by an overview of the automated driving sections of the entire track. Since drivers were free to accept or reject a given task, the engagement was used to evaluate the effect of the HMI. Results show that drivers reject more tasks prior to take-over situations in the predictive HMI group. However, there was no difference in the take-over performance between the HMI conditions. Common to all three studies was the location of the predictive HMI close by or even integrated in the NDRA device and the predetermined NDRA. In Richardson et al. [14], the NDRA was given as watching a video on the central information display where also the remaining time or distance was displayed. Holländer et al. [12] assessed different NDRA (email correction, text messenger, video task); all three displayed on a central information display with the predictive HMI elements integrated. In Wandtner et al. [15], a texting task (with a reward system) was implemented on a tablet mounted at the center console and the predictive HMI being displayed on an additional display on top of the center console.
In summary, NDRA engagement in future automated cars will be diverse and depend on several factors, with available time budget being one of them. Automated driving functions with SAE Level 3 or 4 are likely to be limited to certain parts of the drive, e.g., highways or less complex city areas. As a consequence of limited availability, interruptions of the automated drive and the users’ NDRA engagement will occur. These interruptions can have negative effects on the activity engagement and thus on the acceptance of an automated driving function. In order to mitigate negative effects and enhance planning options for the user, predictive HMI elements were already researched in several studies and have, at least partly, positive effects for the user. Nonetheless, the range of future activities features a variety of devices and items and the effectiveness of visual HMI elements in realistic and diverse use cases remains unclear. Furthermore, knowledge on introduction scenarios of Level 3 or 4 automated driving functions is vague. Disengagement reports suggest difficulties of automated driving functions with complex scenarios, like construction sites, intersections, and with multiple vulnerable road users. However, effects of different capabilities to handle complex driving situations, causing different transition frequencies, requires further research.

1.2. Aims and Objectives

This study adds to the rising body of research on planned rather than unexpected and time-critical transitions. We derived HMI requirements from NDRA engagement, namely the need to plan activity engagement and the importance of interruption management. By shifting to a city scenario, we tackle a new field of applications for automated driving. Moreover, the impact of different transition frequencies on user acceptance and comfort and naturalistic activity engagement has not yet been addressed. Thus, we have designed, executed, and exploited a driving simulator study in a dynamic seat box, using a mixed design with the HMI concept (baseline/predictive) as the between and the transition frequencies (no/rare/frequent RtIs) as the within factor, addressing the following research questions:
  • What are the effects of different RtI frequencies on workload, acceptance, usability, trust, and subjective time use in urban automated driving?
  • Can potential negative effects of a less capable car automation be mitigated by a predictive HMI?
  • What are the effects of different RtI frequencies and a predictive HMI on NDRA engagement?
Based on findings on the effects of interruptions and the connection between acceptance and perceived usefulness, we hypothesize that with more RtIs workload is elevated and acceptance reduced. An impact on trust and usability is not expected, based on findings by Körber et al. [39]. The predictive HMI is expected to have a positive effect on usability, workload, trust, and acceptance, like it was found in studies outlined above. Regarding gaze behavior during phases of activated automation, we expect an increasing attention ratio for the instrument cluster with the predictive HMI and a different monitoring ratio both for HMI and RtI conditions. Regarding NDRA engagement, we expect gazing out of the window/doing nothing and phone use to become more popular with shorter periods of automated driving, as these activities were found to require only short time spans.

2. Materials and Methods

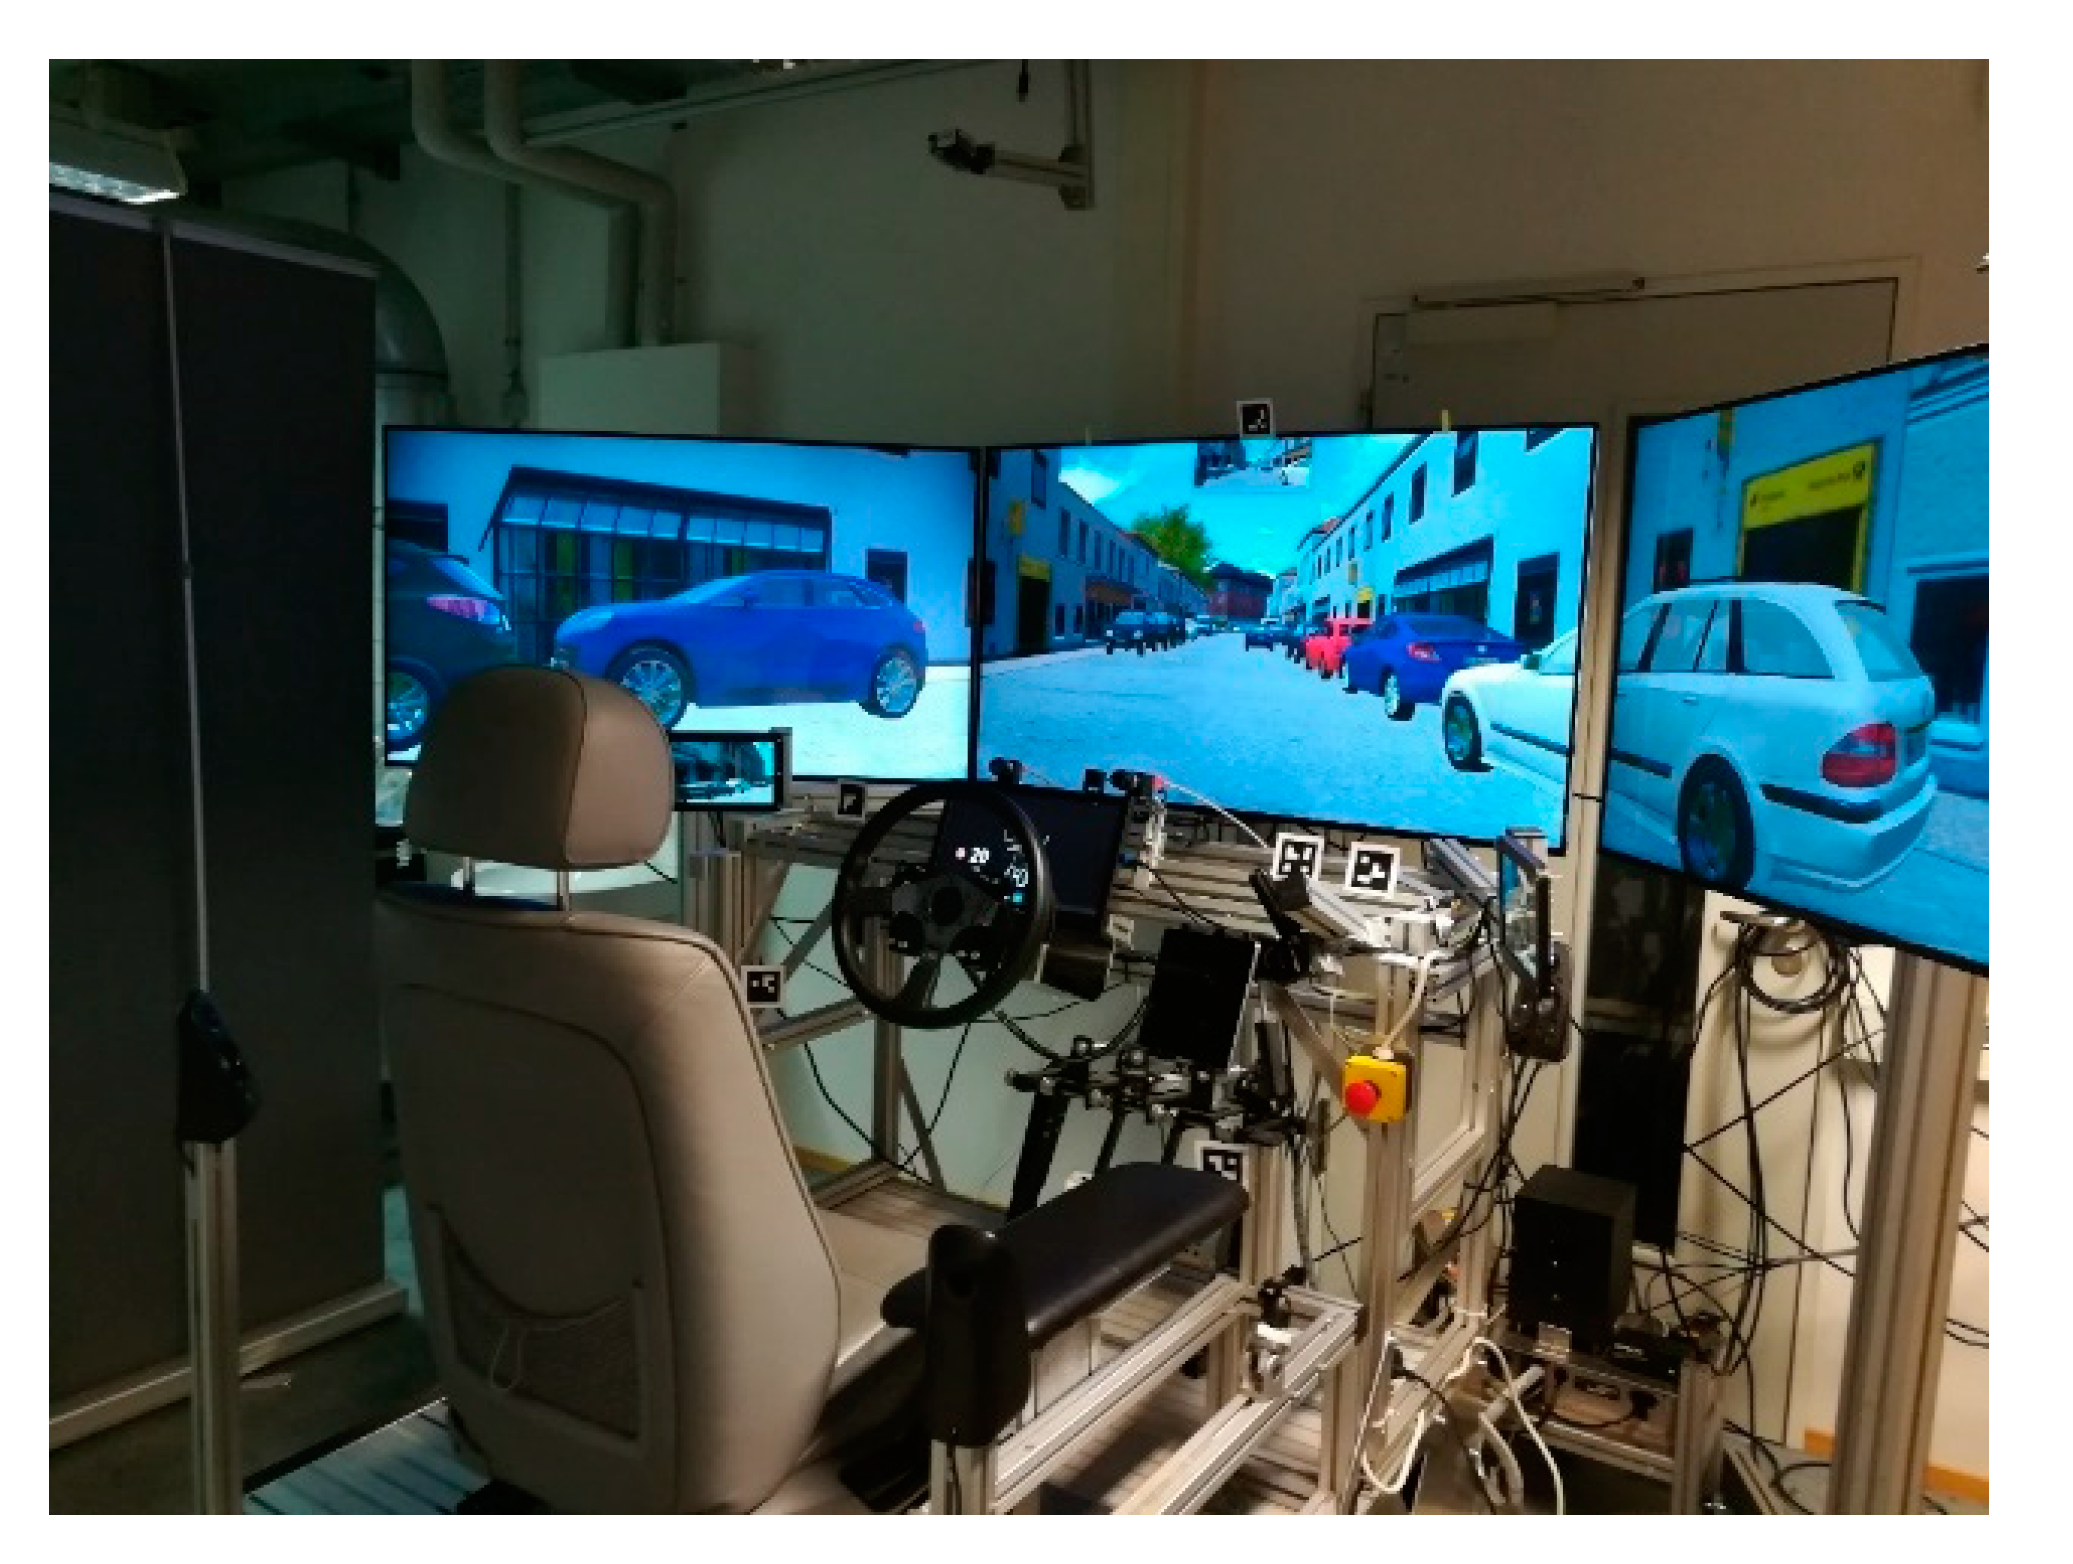
2.1. Driving Simulation and Automated Driving System

The study was conducted in a dynamical driving simulator, as shown in Figure 1. This simulator has a horizontal field of view of 120° displayed on three 55-inch monitors with ultra HD resolution (4096×2160 px). Side mirrors are represented through two additional displays and the rear mirror is integrated in the middle screen. The instrument cluster is displayed on an additional screen located behind the steering wheel. The steering wheel itself and the pedals are from SensoDrive and installed on an aluminum frame. A motion platform from D-BOX is installed to induce pitch and role motions, thus making the experience of driving in dynamic environments a more realistic one. The simulator is run with the driving simulator software SILAB 6 from Würzburger Institut für Verkehrswissenschaften GmbH. Furthermore, the head-mounted eye-tracking system Dikablis by Ergoneers was used to assess gaze behavior.
The implemented driving automation carried out both longitudinal and lateral control and was activated through a button on the steering wheel. Due to technical limitations, the speed limit for the activation was 30 km/h. According to SAE, the system required no supervision and was able to detect all system limits. Furthermore, the system drove according to speed limits and respected the traffic rules. Deactivation of the system could be done either through pressing the activation/deactivation button, or through steering or braking. Depending on the HMI concept, drivers were either informed about system limits via the predictive HMI and reminded via cascade auditory warnings 28, 14, and 7 seconds ahead of the system limits or just 7 seconds ahead (baseline group). Both groups were supported with an emergency braking assist in case of missing an intervention by the driver.

2.2. Study Design and Procedure

For this study, a 2×3 factorial design was used, with the between-subject factor HMI concept (baseline, predictive) and the within-subject factor transition frequency (in three separate drives: no, rare, frequent RtIs). Participants were randomly assigned to the between-subject factor. Upon arrival, the experimenter welcomed participants, informed them about the procedure, and written consent was obtained. The participants then completed a demographic questionnaire on age, gender, and driving and simulator experience. The experimenter instructed the participants on how to use the driving simulator, the capabilities of the automated driving system, and all the possible activities they could engage in. Participants were furthermore instructed to use the automation when available and to take-over when requested. They were encouraged to engage in NDRA during phases of automated driving, as they did not need to supervise the system. To enable naturalistic NDRA engagement, they were motivated to bring their own items to use. There was also a tablet computer installed in the mock-up featuring several different videos, music, radio stations, audio books, and games (similar to Feldhütter et al. [10]). Different magazines (cars, society/politics, riddles) were also given. Talking to the experimenter, who was not visible for the participants during the test drive, was not explicitly forbidden, but also not encouraged. In order to familiarize with the simulator in both manual and automated driving mode, participants completed a test drive. During this phase, they experienced several activations and deactivations of the automation, the predictive HMI (only predictive HMI group), and the emergency braking function. Once the participants had no more questions, the eye-tracking glasses were calibrated, and the first experimental track started. All the three drives, featuring different transition frequencies, were followed by a set of questionnaires (see section on dependent variables). Each drive lasted about 15 minutes. After the completion of all drives and questionnaires, additional questions on the HMI concepts and transition frequencies were asked. Finally, the participants received a compensation of 10€. The whole experiment lasted about 90 minutes.

2.3. Test Track and System Limits

The experiment was conducted to enhance knowledge on automated driving in urban areas and thus consisted of several city infrastructure elements like living areas with priority-to-the-right rule, as well as small urban lanes, wide roads, and different vulnerable road users. The vehicle was programmed to pass through this track either with no human input needed or with four or 10 RtIs. All three drives were performed on the same track; the only differences were the capabilities of the automated driving function to handle complex situations resulting in different RtI frequencies, as shown in Figure 2. An analysis of disengagement reports published by all manufacturers testing their automated cars on public roads in California reveals the current main infrastructure-related issues causing interventions to be complex intersections, construction sites, and areas with a high amount of vulnerable road users [25]. In the rare-RtI condition, system limits were defined as a complex intersection, a construction site narrowing the street to one lane, a bottleneck situation with an oncoming vehicle, and a priority-to-the-right intersection. In the frequent-RtI condition, additional intersection and bottleneck situations, and pedestrian crossings were system limits. The order of the RtI conditions was systematically varied.

2.4. Human–Machine Interfaces

The visual HMI was based on Feierle et al. [40] and displayed in the instrument cluster, as shown in Figure 3. Main elements were current speed and speed limit, the vehicle and its surroundings, and the driving mode (manual/automated). The latter was represented via icons at the bottom and at the top of the instrument cluster. Furthermore, navigation was shown on the right and the availability of the automated mode was indicated via textbox in the center. In case of an RtI, the driver was prompted to take over vehicle control (via textbox), supported by the distance to system limit and the reason for this RtI (same textbox). In the baseline HMI group, the system limit was announced 7 seconds prior to the system limit, thus representing a system solely based on its own sensor setup.
The predictive HMI included a countdown (in steps of > 7 minutes, > 4 minutes, > 2 minutes, > 1 minutes, > 30 seconds) displayed when automation was active, supported with color-coded frames around the respective textboxes. This predictive approach could, for example, be realized by car-2-x communication, using other cars’ data and map-based infrastructure information. The auditory HMI included an auditory icon announcing the availability of the automated driving function, and, depending on the HMI concept, one or three more salient auditory icons indicating the upcoming system limit.

2.5. Dependent Variables

The post-drive questionnaires included the system usability scale [41], the NASA raw task-load index [42], the van der Laan acceptance questionnaire [43], a single-item question on trust, and a single-item question on the subjective use of travel time. We furthermore recorded gaze behavior with the three areas of interest “road,” “instrument cluster”, and “NDRA” to measure attention ratio and monitoring ratio. A GoPro camera was used to observe NDRA engagement and disengagement. An overview of the dependent variables can be found in Table 1. After the last drive, additional questions were asked, including a question on the minimum time the automation should be available, a question on the acceptance of choosing a longer trip duration in order to avoid RtIs, and another question on whether participants of the predictive HMI group adapted their NDRA engagement according to the remaining time. Take-over metrics, like take-over time, time to collision, and lateral/longitudinal accelerations, were not taken into consideration because of the described differences in the acoustic take-over signals, the free activity engagement, and findings of Wandtner et al. [15] who found no effect of a predictive HMI on take-over metrics.

2.6. Sample Characteristics

Forty-two participants, evenly distributed between the HMI conditions, were tested. However, two participants had to cancel the experiments due to kinetosis. Another seven participants had to be excluded because of technical issues with the eye-tracking system, causing additional interruptions during the drive. The remaining sample consisted of n = 18 (4 female, 14 male) participants in the predictive and n = 15 (5 female, 10 male) participants in the baseline condition, with an average age of M = 28.55 years (SD = 13.42, min = 18, max = 73). All participants held a German driver’s license (for M = 11.09, SD = 13.20 years). Fifteen participants (45.45%) had already taken part in other simulator studies, ten in studies related to automated driving. The participants rated their experience with automated driving mainly as “medium” (31%).

3. Results

Statistics were performed using SPSS 24 with a level of significance of p < 0.05. We calculated mixed analysis of variance (ANOVA) with transition frequency as the within-subject factor and HMI concept as the between-subject factor. Prerequisites for ANOVA were tested with Levene’s test (for variance homogeneity), Shapiro–Wilk test (for normality), and Mauchly test (for sphericity). As ANOVA was found to be robust against violation of normality [44], it was interpreted despite this violation. In case of missing variance homogeneity, ANOVA was not interpreted, only post-hoc tests were used. Greenhouse–Geisser (ε ≤ 0.75) or Huynh–Feldt (ε > 0.75) correction were applied when sphericity prerequisite was not fulfilled. Partial eta square ( η p 2 ) was given for effect size (small effect: η p 2 = 0.01, medium effect: η p 2 = 0.06, large effect: η p 2 = 0.14). Friedman tests were used as a non-parametric alternative for testing the impact of RtI frequency. Post-hoc comparisons were performed using t-tests with Bonferroni correction. The Bonferroni–Holm method was applied to deal with familywise error rates for multiple hypothesis tests (as grouped in subchapters). Results of the post-study questionnaire were analyzed using the Mann–Whitney U test.

3.1. Acceptance, Usability, Trust, and Subjective Use of Travel Time

Regarding usability, as shown in Figure 4, there is homogeneity of covariances, as assessed by Box’s test (p = 0.356), but no homogeneity of the error variances, as assessed by Levene’s test (p = 0.008). Thus, results of the ANOVA must not be interpreted. However, post-hoc tests reveal a significant impact stemming from different transition frequencies. Descriptively, there is no difference among HMI conditions. System Usability Scale (SUS) scores can be interpreted as excellent for no RtI (predictive: M = 87.08, SD = 10.19, baseline: M = 88.17, SD = 11.89), and good for the rare- (predictive: M = 83.61, SD = 12.58, baseline: M = 78.00, SD = 20.23) and frequent-RtI condition (predictive: M = 76.53, SD = 12.25, baseline: M = 75.17, SD = 22.31). When it comes to acceptance, a significantly negative effect with a large effect size was associated with more RtIs, as shown in Figure 4 (Greenhouse–Geisser F(1.35, 47.76) = 30.78, p < 0.001, η p 2 = 0.498). Even the rare-RtI condition significantly lowers acceptance compared to a completely automated trip. HMI however shows no effect on participants’ acceptance rating of the system (F(1, 31) = 0.16, p = 0.695). Boxplots furthermore show an increasing variety of acceptance ratings with less capable automation systems. No interaction effect (Greenhouse–Geisser F(1.35, 47.76) = 30.78, p = 0.315) was found. Acceptance was not normally distributed for all groups except for the no-RtI condition, as asssed by the Shapiro–Wilk test (p > 0.05). There was homogeneity of the error variances, as assessed by Levene’s test (p > 0.05) and homogeneity of covariances, as assessed by Box’s test (p = 0.902). For subjective evaluation of travel time, as shown in Figure 5, an effect of HMI condition can descriptively not be found. A Friedman test was performed to analyze the impact of RtI frequency on subjective use of time ratings. Results show a statistically significant impact of RtI frequency (Chi-Quadrat (2) = 49.115, p < 0.001, n = 33) on participants’ subjective evaluation of the use of travel time. For the trust evaluation, as shown in Figure 5, no difference between groups can be found descriptively. A Friedman test to analyze the impact of RtI frequency on trust ratings shows no statistically significant impact of RtI frequency on trust level (Chi-Quadrat (2) = 4.160, p = 0.125, n = 33).

3.2. Workload

Measuring workload with NASA-RTLX reveals a significant impact of the transition frequencies with a large effect size, as shown in Figure 6 (Greenhouse–Geisser F(1.33, 41.15) = 46.85, p < 0.001, η p 2 = 0.602). Even rare RtIs higher workload significantly compared to the no-RtI condition. As for the HMI concepts, no significant effect on workload was found (F(1, 31) = 0.81, p =0.809), only the rare-RtI condition descriptively shows a tendency to lower workload in the predictive condition. There was no statistically significant interaction between transition frequencies and HMI (Greenhouse–Geisser F(1.33, 41.15) = 1.59, p < 0.809). Workload was normally distributed for all groups except for rare-RtI (both HMI) and frequent-RtI conditions (predictive HMI), as assessed by the Shapiro–Wilk test (p > 0.05). There was homogeneity of the error variances, as assessed by Levene’s test (p > 0.05) and homogeneity of covariances, as assessed by Box’s test (p = 0.573).

3.3. NDRA Engagement

As explained in Section 2, participants were encouraged to engage in every activity they desired. Therefore, we expected the engagement to be natural and allow for conclusions to be drawn regarding everyday automated driving. In order to assess activity engagement and thus further enhance research results described in Section 1, video data of this study was analyzed, and participation rates determined (number of participants engaging in an activity compared to full sample). Activities were coded in as much detail as can be obtained from video data while at the same time protecting privacy. Phone use can therefore include multiple activities (texting, Internet surfing, gaming, videos, etc.). Activities performed on the tablet were coded as gaming, videos, and others (Internet surfing and browsing tablet). Gazing out of the window was counted with a duration of at least 20 seconds. Sleeping, phone calls, laptop use, reading a book, and listening to music via phone or tablet did not occur.
As can be seen in Figure 7, window gazing/relaxing, talking, phone use, and reading magazines are the most popular activities. Shorter automated driving periods seem to promote window gazing (mainly in the predictive condition) and talking with the experimenter (in the baseline condition). In addition, descriptively, the attractiveness of reading is decreased by the frequent-RtI condition (mainly in the predictive condition), while phone use is decreasing in the baseline condition.

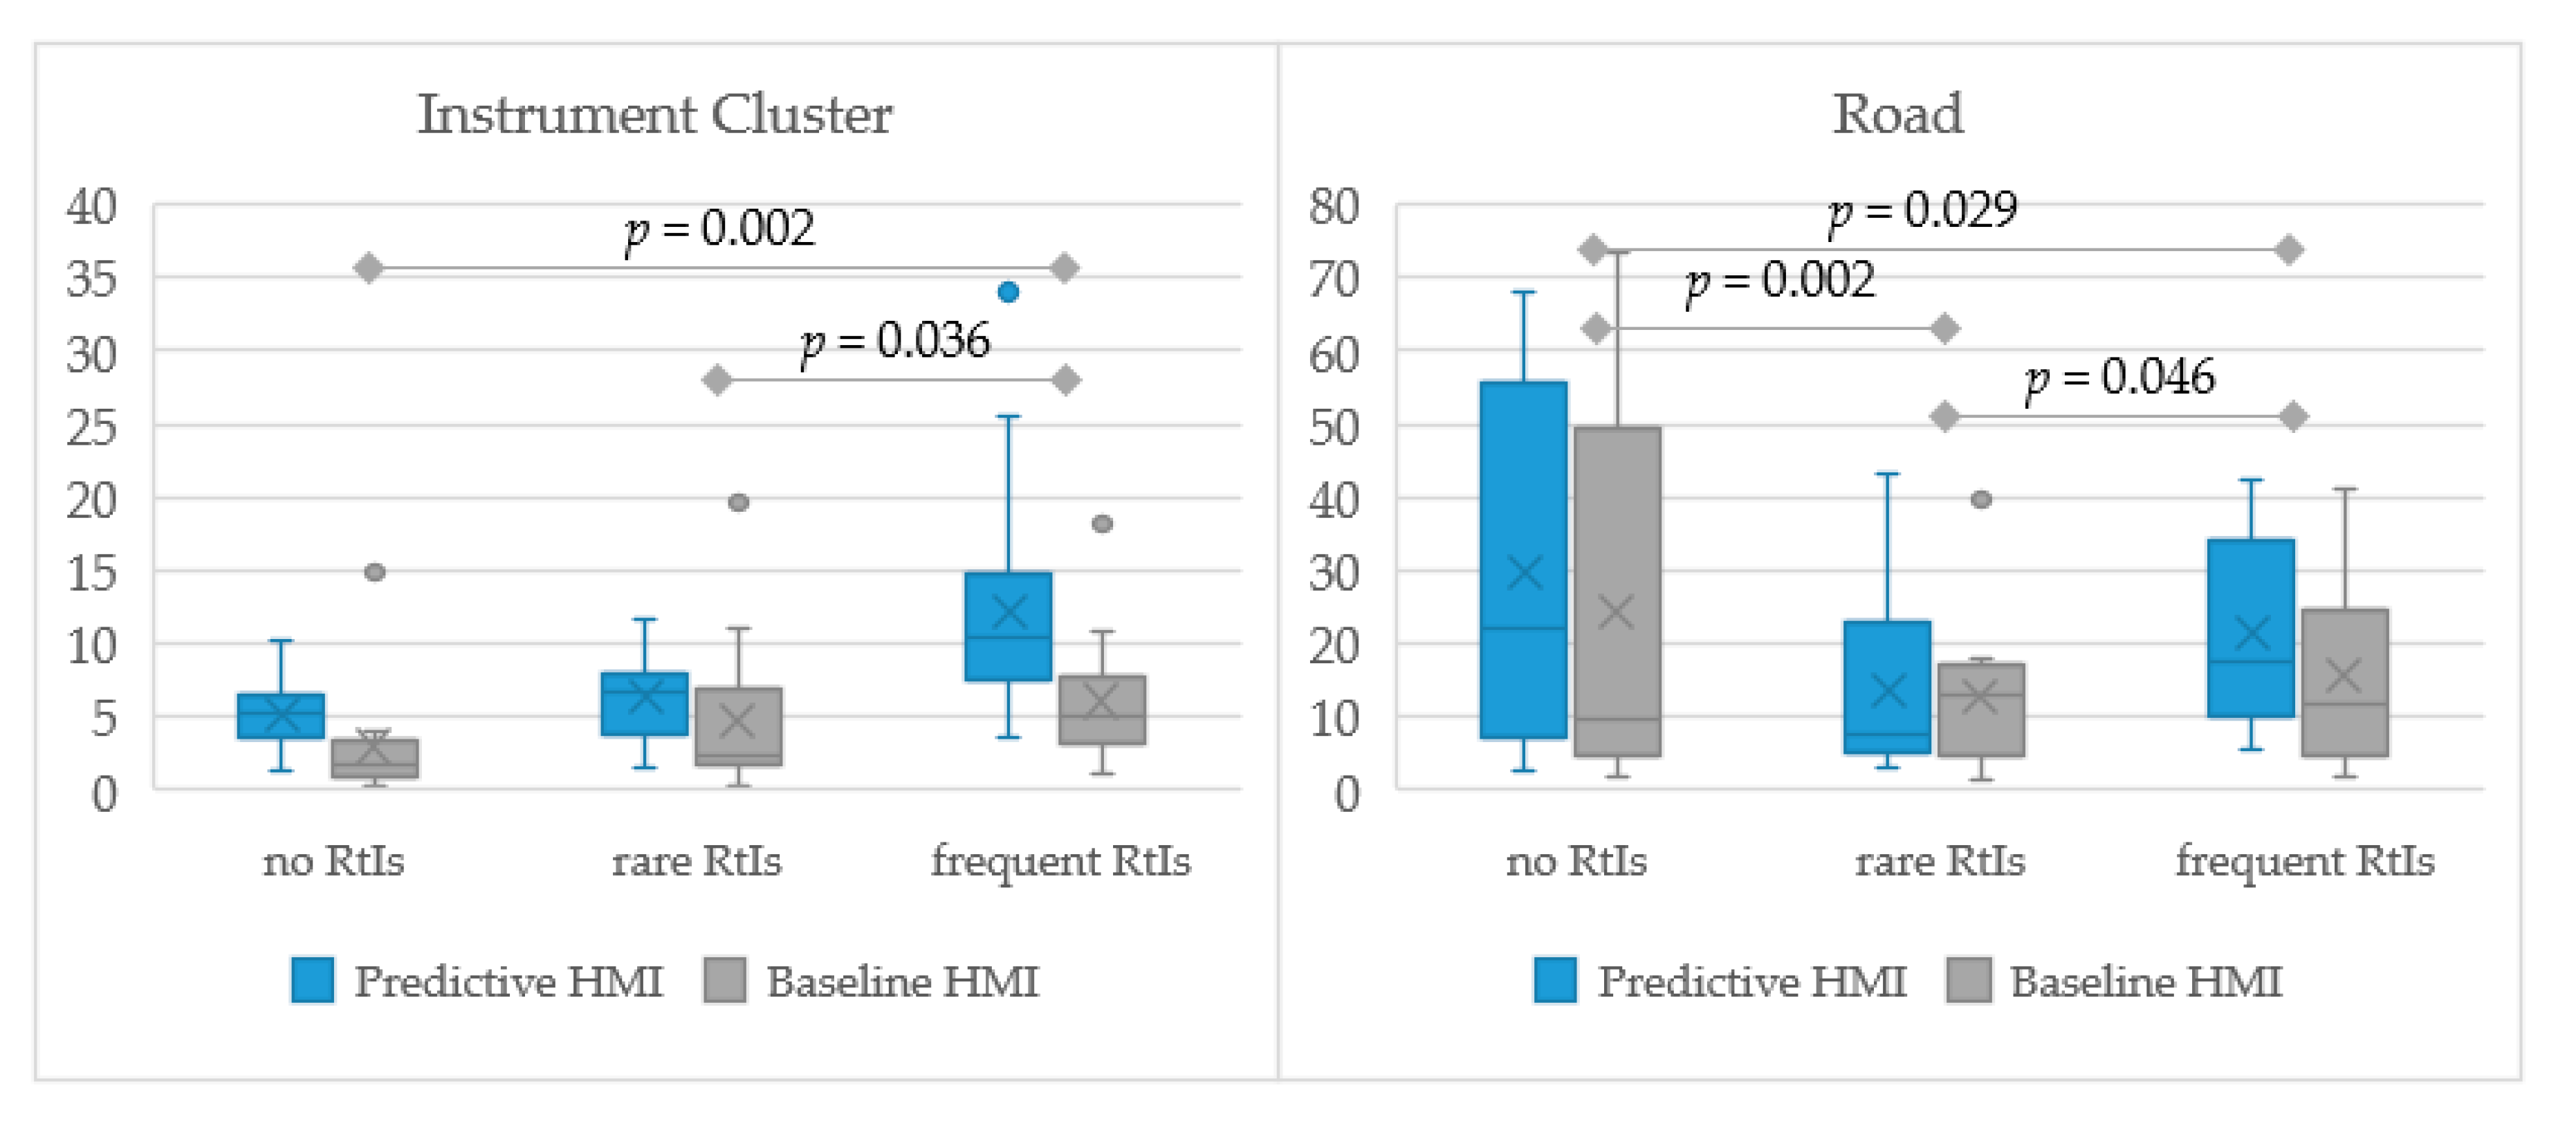
3.4. Eye-Tracking Data

For analyzing eye-tracking data, obtained using Dikablis glasses, six additional participants were excluded due to not meeting quality criteria set in ISO 15007 [45] (70% detection rate). In terms of analyzing gaze data of the remaining 27 participants (predictive HMI group: 15; baseline HMI group: 12), three areas of interest (AOIs) were defined: instrument cluster (IC), road, and NDRA. As it was not possible to clearly distinguish the AOI NDRA due to different and moving items, we defined this AOI as everything that is not AOI road, AOI IC, or not detected. The monitoring ratio and AOI data were calculated. The monitoring ratio describes the ratio of gaze duration for the AOIs road and IC divided by gaze duration for AOI NDRA [46]. A monitoring ratio larger than 1 thus indicates control glances overweighting NDRA engagement and vice versa. In order to eliminate effects of manual driving, gaze behavior was assessed only during phases with activated automation. Different automation durations are caused by (a) more manual driving time that comes with more RtIs and (b) the acoustic RtI countdown in the predictive condition. Furthermore, some participants skipped some automated drives in the frequent condition (probably due to frustration or time needed to activate automation). Total automated drive times and average durations per automated driven sequence can be found in Figure 8. Total automated driving time is the summed time across the complete drive, while the average automated driving time is the average time interval between each system limit. While the total automated driving time was almost 16 minutes in the no-RtI condition, it drops to eight in the predictive and ten in the baseline condition during the frequent-RtI drive. Average automated driving time drops down to about one minute.
In terms of the IC attention ratio, there was a strong effect of the RtI frequency (Greenhouse–Geisser F(1.37, 34.30) = 10.42, p = 0.002, η p 2 = 0.294); with more interruptions, the IC attention ratio rises, as shown in Figure 9. The effect of HMI is close to significant (F(1, 25) = 6.09, p = 0.063, η p 2 = 0.196) in a way that participants with the predictive HMI look at the IC longer. The interaction effect is not significant (Greenhouse–Geisser F(1.37, 34.30) = 1.372, p = 0.133). IC gaze data is normally distributed except for the predictive HMI in the no- and rare-RtI condition, as assessed by the Shapiro–Wilk test (p > 0.05). The results are also limited by the fact that there was no homogeneity of covariances, as assessed by Box’s test (p < 0.001). There was homogeneity of the error variances, as assessed by Levene’s test (p > 0.05).
Road attention ratio, as shown in Figure 9, is heavily affected by the RtI frequency (Huynh–Feldt F(1.66, 41.59) = 11.25, p < 0.001, η p 2 = 0.310); average glance durations and respective variance are highest for the uninterrupted drive, and lowest for the rare-RtI condition. The effect of HMI (F(1, 25) = 0.48, p = 0.494) and the interaction effect (Huynh–Feldt F(1.66, 41.59) = 1.66, p = 0.591) are not significant. Road gaze data is normally distributed except for the predictive HMI in the no- and frequent-RtI condition and the baseline HMI in the frequent-RtI condition, as assessed by the Shapiro–Wilk test (p > 0.05). There is homogeneity of the error variances, as assessed by Levene’s test (p > 0.05), and homogeneity of covariances, as assessed by Box’s test (p = 0.388).
Regarding the NDRA attention ratio, as shown in Figure 10, there is no homogeneity of the error variances, as assessed by Levene’s test (p = 0.043), and homogeneity of covariances, as assessed by Box’s test (p = 0.288). Only post-hoc results can thus be interpreted: As can be expected from previous results, gaze data for NDRA engagement shows a peak for the rare-RtI condition but is significantly decreasing for both no and frequent RtIs. There is a tendency to less NDRA attention when having a predictive HMI, especially in the frequent-RtI condition. NDRA gaze data is only normally distributed in the predictive- and rare-RtI condition.
Regarding the monitoring ratio, as shown in Figure 10, RtI frequency exhibits a strong effect(Greenhouse–Geisser F(1.07, 26.65) = 6.82, p = 0.013, η p 2 = 0.214); the monitoring ratio is lowest for rare RtIs. The effect of HMI is not significant (F(1, 25) = 1.52, p = 0.229), but descriptively, there is a difference between the HMI concepts in a way that the monitoring ratio is larger for the predictive condition. The interaction effect is not significant (Greenhouse–Geisser F(1.07, 26.65) = 0.84, p = 0.376). However, there is homogeneity of the error variances, as assessed by Levene’s test (p > 0.05), but no homogeneity of covariances, as assessed by Box’s test (p = 0.026). Data is normally distributed, except for predictive HMI in the frequent condition, as assessed by Levene’s test (p > 0.05).

3.5. Post-Study Questionnaire

When participants were asked about the minimum automated driving time they preferred, an average of 4.48 min (SD = 3.30, min = 0.5 min, max = 10 min; see Figure 11) was cited. Both groups were not normally distributed, as assessed by the Shapiro–Wilk test (p = 0.018). There was no statistically significant difference in time budget between HMI conditions (U = 99,000.00, Z = −0.730, p = 0.465). We furthermore asked whether participants were willing to accept a longer trip duration for less RtIs on a scale from 1 (not at all) to 7 (absolutely). There was a tendency to accept more RtIs (M = 4.97, SD = 1.82). Group differences show a tendency to less acceptance in the predictive group than in the baseline group, as shown in Figure 11, which is, however, not significant (U = 98,500.00, Z = −1.359, p = 0.174). Participants of the predictive HMI group were also asked to rate whether they adapted their activity engagement to the remaining time as displayed on the predictive HMI on a 7-Likert scale from 1 (not at all) to 7 (absolutely). Most participants stated to have done so (M = 5.77, SD = 1.22, min = 3, max = 7). Lastly, the favorite drive and the respective reasons were investigated: 55% rated the no-RtI condition as best, 42% voted for rare RtI, and 3% for the frequent-RtI condition. The reason for the latter was “being in charge.” Positive aspects mentioned by participants who liked the rare-RtI condition best were “good use of time”, “feeling of control”, and lowered monotony. The ones who rated the no-RtI condition as the best mentioned time use, no interruptions, and low workload as positive aspects. In an open question, missing information items were: remaining time to RtI (three participants of baseline group), map displaying automated driving sections, acoustic information on remaining time to RtI, remaining time to RtI prior to activation of automation (one participant each).

4. Discussion and Future Work

4.1. HMI Concepts

As described in Section 1, several studies have highlighted the importance of preparing the user of SAE Level 3 or 4 systems for upcoming RtIs. This allows for safe and comfortable take-overs and supports the user in planning of NDRA engagement. Furthermore, the negative effects of interruption events can be potentially mitigated, causing lower workload and higher usability. We thus hypothesized a positive effect of the predictive HMI on usability, workload, trust, and acceptance. However, we did not find a significant impact on workload using NASA-RTLX. We found participants driving with the predictive HMI to look at the instrument cluster more often than with the baseline HMI, which indicates acceptance of the predictive HMI. Nonetheless, it was necessary to redirect gazes from the NDRA toward the instrument cluster to retrieve the relevant information about upcoming system limits as the predictive HMI was not integrated in any NDRA. Since there was no peripheral visibility and no auditory signals indicating the remaining time until the RtI, the predictive HMI in the instrument cluster could have failed to convey the relevant information with enough time to interrupt the NDRA (close to the RtIs), causing the first RtI signal to interrupt the activity, which in turn results in no positive effects of the predictive HMI compared to the baseline HMI. Allowing for free activity engagement makes it more difficult to directly communicate with the user and consequently counteracts positive effects of the predictive HMI on workload. Furthermore, some participants might not have used the predictive information, as they did not perceive any benefit and found it sufficient to react to the acoustic RtI only.
We also expected usability and acceptance to be improved by the predictive HMI, as Richardson et al. [14] found out. This turned out to not be the case, likely for the same reason as for workload—the lack of peripheral visibility, and respectively, the need to redirect gazes toward the instrument cluster to retrieve timing information. In contrast to our experiment, the studies presented in Section 1.1 all integrated the predictive HMI in the NDRA or close by the NDRA device. Since we aimed for realistic everyday NDRA engagement including items that cannot be used to communicate with the user, our predictive HMI was only displayed in the instrument cluster. Despite the lack of positive impact on acceptance, usability, and workload, we found some hints for the predictive HMI to support activity planning: First, the subjective evaluation in the post-study questionnaire (most participants stated to have adapted their activity engagement due to the predictive HMI). Second, eye-tracking data shows a higher IC attention ratio with the predictive HMI, which is rising with the RtI frequency. The latter is also less the case for the baseline condition. Furthermore, there is a trend to lower NDRA attention ratio in predictive and frequent RtI conditions, indicating that participants decided not to engage in NDRA due to short time spans (well below desired time spans). Third, there are the insignificant tendencies of the predictive group participants to accept shorter automated driving periods and to show less acceptance for a longer trip duration for less RtIs compared to the baseline condition. Fourth, NDRA participation rates indicate a trend to participants adapting their NDRA engagement to the transition frequency in the predictive HMI condition, with the baseline participants doing less so. This is in line with participants’ statements in the post-study questionnaire and with findings of Wandtner et al. [15], who suggests an improved NDRA planning with a predictive HMI. The predictive HMI in the instrument cluster might thus be used to plan activity engagement at the beginning of the automated drive time and infrequently between activation and deactivation, but it does not lead to a better preparation for the take-over and the respective interruption.

4.2. Transition Frequency

Regarding RtI frequency, we hypothesized that with more RtIs acceptance is reduced and workload elevated. Additionally, a changing monitoring ratio was expected, but no impact on trust and usability. Different transition frequencies were found to negatively affect workload. Workload can be elevated due to interruption events or due to increased manual driving times [47], or due to the activation and deactivation process of the implemented automation. Furthermore, as hypothesized, acceptance was lowered by an increasing RtI frequency; the rare-RtI condition already lowers the acceptance significantly. We also found RtI frequency to lower usability, which was not expected but can probably be explained by the activation process of the implemented automation. As hypothesized (based on Körber et al. [39]), RtI frequency showed no effect on trust. Furthermore, subjective time use was decreased by more RtIs. As expected, the monitoring ratio was influenced by the RtI conditions. The lowest monitoring ratio was found for the rare-RtI condition, meaning that visual NDRA engagement is highest. For the no-RtI condition, an extremely huge variance can be seen in NDRA and road attention ratio (and thus in the monitoring ratio). The attention ratio is significantly higher than during phases of automated driving in the few-RtI condition. This can possibly be explained by the limited time budget of one to six minutes in the few-RtI condition that caused the participants to engage in their chosen activity more efficiently with less interruptions and less activity switchovers compared to the no-RtI condition with an automated driving time of almost 16 minutes. The higher attention ratio in the frequent-RtI condition (compared to the no-RtI condition) is probably due to participants choosing to do nothing but gazing out of the window in this condition because of time spans being well below desired durations.
Regarding NDRA engagement, gazing out of the window/doing nothing, and phone use were expected to become more popular with more interruptions. Analyzing the participation rates reveals that shorter automation durations promote window gazing and talking, while the attractiveness of reading is decreased. This is to some extent in line with Hecht et al. [23] and their investigation on required time budgets per activity. It is, however, only a trend and would need further inquiries with larger sample sizes to enhance findings and perform statistic tests. The large variety in NDRA attention ratios might also be explained by motion sickness and the unavailability of desired items. Unlike studies by Pfleging et al. [17] and Sommer [18] suggest, no one used the radio or listened to music. This may also be caused by the lack of privacy [23]. Furthermore, participants are not yet used to automated driving and might thus change their behavior over time. Additionally, factors like trip purpose, trip duration, and comfort can have an effect on the choice of activities [23].

4.3. Limitations and Future Research

Clearly a restriction when interpreting the presented results is the experimental setting. The seat box does not represent a complete car, but only parts of it. The mock-up is open and based on screens, which causes it to be less immersive. Nonetheless, we consider the setup to be appropriate for the presented research. Due to the experimenter being close by and the installed GoPro cameras, privacy is limited. This may cause a diminished attractiveness of activities like voice-messaging and phone calls, but also sleeping, eating, and drinking become less popular with lowered privacy [23]. Furthermore, due to the limited sample, elderly people are underrepresented. Attractiveness of phone use is negatively affected by age, and reading books/magazines positively [23]. The eye-tracking sample in particular is small, includes many students, and more male than female participants. Restrictions are also different audio signals between the HMI conditions, with the predictive HMI featuring a warning cascade with three signals prior to the system limit, whereas the baseline HMI includes only one signal 7 seconds prior to the system limit. Furthermore, the free activity engagement allows for conclusions on everyday NDRA engagement in future automated driving. The predictive HMI condition in connection with different RtI frequencies helps to enhance findings of Hecht et al. [23] on desired time budgets. Furthermore, the motivation to engage in free NDRA was expected to be the same for all participants, unlike in artificial or predetermined NDRA settings and as NDRA engagement was shown to influence travel time evaluation [7], a positive utility of the predictive HMI was expected to positively influence the respective question. However, more specific use cases can be implemented for future evaluations to further inquire the usefulness of predictive HMI elements. Another limitation is the implemented automation. Sometimes problems occurred when activating the automation, causing swaying movements and in few cases the deactivation. This could have possibly influenced trust, workload, usability, and acceptance. Motion sickness, which we did not assess, can be a reason for refraining from activity engagement [48]. Previous studies have shown a large variety in NDRA choice and respective activity durations. In this study, we did additionally show large variety in the minimum time budget of automated driving that users want to be confronted with. Future work should therefore focus on adaptive automation systems and enhance users’ ability to plan the trip or parts of the trip according to their specific needs (depending, for example, on trip purpose, timing aspects, specific task necessities, etc.). A user should be enabled to plan the trip accordingly with the help of a respective HMI. Furthermore, our predictive HMI did not improve workload compared to the baseline situation. We therefore suggest using a peripheral view, possibly by implementing LED stripes. This allows for continuous communication while not interrupting the user in his/her activity and can also lead to a reduction of information items in the instrument cluster, as proposed by Kindelsberger et al. [49]. Since there will always be uncertainty when predicting upcoming RtIs (due to changing traffic, construction sites, route changes, etc.), it should be investigated whether this uncertainty can be integrated in the predictive HMI.

5. Conclusions

In the presented study with 33 participants, a predictive HMI was found to have no effects on workload, usability, acceptance, and trust. This contrasts with previous studies. However, individual activity engagement was allowed, and the remaining time was communicated only via the instrument cluster. The lack of direct communication, e.g., via NDRA-integrated predictive HMI, likely caused the inexistent positive effect on workload and usability. Future research should thus focus on communicating the remaining time in a non-interruptive and universal way to enable activity planning and mitigate interruption effects. However, evidence for a positive use of the predictive HMI was found in gaze behavior and post-study questionnaire results.
Different transition frequencies (and thus more manual driving) caused higher workload and lower acceptance and usability ratings. Participants want the automation to be available for at least 4.5 minutes in order to be offered and would also to, some extent, accept longer drive durations for fewer RtIs. Most popular activities were gazing out of the window/relaxing, followed by talking, phone use, and reading magazines. Future research should investigate how to include the user in the trip planning process, inform in a non-interruptive way, and prepare for the interruption of NDRA.

Author Contributions

Conceptualization, T.H., S.K., and K.B.; methodology, T.H. and S.K.; software, T.H. and S.K.; validation, T.H. and S.K.; formal analysis, T.H. and S.K.; investigation, T.H. and S.K.; resources, T.H. and K.B.; data curation, T.H. and S.K.; writing—original draft preparation, T.H.; writing—review and editing, T.H., S.K., and K.B.; visualization, T.H.; supervision, T.H. and K.B.; project administration, T.H.; funding acquisition, K.B. All authors have read and agreed to the published version of the manuscript.

Funding

This research was funded by research project @CITY-AF, carried out at the request of the Federal Ministry of Economics and Energy (Bundesministerium für Wirtschaft und Energie), under research project No. 19A18003N. The author is solely responsible for the content

Conflicts of Interest

The authors declare no conflict of interest. The funders had no role in the design of the study; in the collection, analyses, or interpretation of data; in the writing of the manuscript, or in the decision to publish the results.

References

  1. Tesla. Future of Driving. Available online: https://www.tesla.com/autopilot?redirect=no (accessed on 19 November 2019).
  2. On-Road Automated Driving Committee. Taxonomy and Definitions for Terms Related to Driving Automation Systems for On-Road Motor Vehicles. 2018. Available online: https://www.sae.org/standards/content/j3016_201806/ (accessed on 30 January 2020).
  3. Naujoks, F.; Wiedemann, K.; Schoemig, N. The Importance of Interruption Management for Usefulness and Acceptance of Automated Driving. In Proceedings of the 9th International Conference on Automotive User Interfaces and Interactive Vehicular Applications, Oldenburg, Germany, 24–27 September 2017; pp. 254–263. [Google Scholar]
  4. Huemer, A.K.; Vollrath, M. Ablenkung durch fahrfremde Tätigkeiten: Machbarkeitsstudie. Bericht zum Forschungsprojekt FE 82.376/2009. Mensch und Sicherheit. 2012, M 225, 7–92. [Google Scholar]
  5. König, M.; Neumayr, L. Users’ resistance towards radical innovations: The case of the self-driving car. Transp. Res. Part F Traff. Psychol. Behav. 2017, 44, 42–52. [Google Scholar] [CrossRef]
  6. AutoScout24 GmbH. Unser Auto von morgen 2011. Studie zu den Wünschen der Deutschen an das Auto von morgen. 2011. Available online: http://about.autoscout24.com/de-de/au-press/2011_as24_studie_auto_v_morgen.pdf (accessed on 30 January 2020).
  7. Susilo, Y.O.; Lyons, G.; Jain, J.; Atkins, S. Rail Passengers’ Time Use and Utility Assessment. Transp. Res. Rec. 2013, 2323, 99–109. [Google Scholar] [CrossRef]
  8. Llaneras, R.E.; Salinger, J.; Green, C.A. Human Factors Issues Associated with Limited Ability Autonomous Driving Systems: Drivers’ Allocation of Visual Attention to the Forward Roadway. In Proceedings of the 7th International Driving Symposium on Human Factors in Driver Assessment, Training, and Vehicle Design 2013. Driving Assessment Conference, Bolton Landing, NY, USA, 17–20 June 2013; pp. 92–98. [Google Scholar]
  9. Naujoks, F.; Purucker, C.; Neukum, A. Secondary task engagement and vehicle automation–Comparing the effects of different automation levels in an on-road experiment. Transp. Res. Part F Traff. Psychol. Behav. 2016, 38, 67–82. [Google Scholar] [CrossRef]
  10. Feldhütter, A.; Hecht, T.; Kalb, L.; Bengler, K. Effect of prolonged periods of conditionally automated driving on the development of fatigue: With and without non-driving-related activities. Cogn. Tech. Work. 2018, 21, 33–40. [Google Scholar] [CrossRef]
  11. Zeeb, K.; Buchner, A.; Schrauf, M. What determines the take-over time? An integrated model approach of driver take-over after automated driving. Accid. Anal. Prev. 2015, 78, 212–221. [Google Scholar] [CrossRef]
  12. Holländer, K.; Pfleging, B. Preparing Drivers for Planned Control Transitions in Automated Cars. In Proceedings of the 17th International Conference on Mobile and Ubiquitous Multimedia, Cairo, Egypt, 25–28 November 2018. [Google Scholar]
  13. Naujoks, F.; Forster, Y.; Wiedemann, K.; Neukum, A. A human-machine interface for cooperative highly automated driving. In Advances in Human Aspects of Transportation; Springer International Publishing: Cham, Switzerland, 2017. [Google Scholar]
  14. Richardson, N.T.; Flohr, L.; Michel, B. Takeover Requests in Highly Automated Truck Driving: How Do the Amount and Type of Additional Information Influence the Driver–Automation Interaction? MTI 2018, 2, 68. [Google Scholar] [CrossRef] [Green Version]
  15. Wandtner, B.; Schömig, N.; Schmidt, G. Secondary task engagement and disengagement in the context of highly automated driving. Transp. Res. Part F Traff. Psychol. Behav. 2018, 58, 253–263. [Google Scholar] [CrossRef]
  16. Naujoks, F.; Befelein, D.; Wiedemann, K.; Neukum, A. A review of non-driving-related tasks used in studies on automated driving. In Proceedings of the 8th Conference on Applied Human Factors and Ergonomics (AHFE). 8th Conference on Applied Human Factors and Ergonomics, Los Angeles, CA, USA, 17–21 July 2017; pp. 525–537. [Google Scholar]
  17. Pfleging, B.; Rang, M.; Broy, N. Investigating user needs for non-driving-related activities during automated driving. In Proceedings of the 15th International Conference on Mobile and Ubiquitous Multimedia (MUM), Rovaniemi, Finland, 12–15 December 2016; pp. 91–99. [Google Scholar]
  18. Sommer, K. Continental Mobilitätsstudie. Available online: http://www.contionline.com/generator/www/com/de/continental/presseportal/allgemein/elekt romobilitaet/workshop_2011_12_15/download/studie_de.pdf (accessed on 30 January 2020).
  19. Thalys. Umfrage im Auftrag von Thalys: Wie reisen Europäer? Studie unter europäischen Reisenden zeigt länderspezifische Unterschiede und Gemeinsamkeiten im Reiseverhalten. Köln, 2013. Available online: https://docplayer.org/39039121-Umfrage-im-auftrag-von-thalys-wie-reisen-europaeer.html (accessed on 30 January 2020).
  20. Metz, B.; Landau, A.; Just, M. Frequency of secondary tasks in driving–Results from naturalistic driving data. Saf. Sci. 2014, 68, 195–203. [Google Scholar] [CrossRef]
  21. Large, D.; Burnett, G.; Morris, A.; Muthumani, A.; Matthias, R. Design Implications of Drivers’ Engagement with Secondary Activities During Highly-Automated Driving – A Longitudinal Simulator Study. In Proceedings of the Road Safety and Simulation International Conference (RSS) 2017. Road Safety and Simulation International Conference (RSS), The Hague, Netherlands, 17–19 October 2017; pp. 1–10. [Google Scholar]
  22. Hecht, T.; Feldhütter, A.; Draeger, K.; Bengler, K. What do you do? An analysis of non-driving related activities during a 60 minutes conditionally automated highway drive. In Proceedings of the 2019 International Conference on Human Interaction and Emerging Technologies IHIET 2019, Nice, France, 22–24 August 2019. [Google Scholar]
  23. Hecht, T.; Darlagiannis, E.; Bengler, K. Non-driving Related Activities in Automated Driving–An Online Survey Investigating User Needs. In International Conference on Human Systems Engineering and Design: Future Trends and Applications; Springer: Cham, Switzerland, 2019; Volume 1026, pp. 182–188. [Google Scholar]
  24. Andreassi, S. Patience is a virtue: Waiting for fully autonomous vehicles to hit the road. Available online: https://www.embedded-computing.com/embedded-computing-design/patience-is-a-virtue-waiting-for-fully-autonomous-vehicles-to-hit-the-road# (accessed on 19 November 2019).
  25. Lv, C.; Cao, D.; Zhao, Y.; Auger, D.J.; Sullman, M.; Wang, H.; Dutka, L.M.; Skrypchuk, L.; Mouzakitis, A. Analysis of autopilot disengagements occurring during autonomous vehicle testing. IEEE/CAA J. Autom. Sinica. 2018, 5, 58–68. [Google Scholar] [CrossRef] [Green Version]
  26. Janssen, C.P.; Iqbal, S.T.; Kun, A.L.; Donker, S.F. Interrupted by my car? Implications of interruption and interleaving research for automated vehicles. Int. J. Hum. Comput. Stud. 2019, 130, 221–233. [Google Scholar] [CrossRef]
  27. Altmann, E.M.; Trafton, J.G. Task Interruption. Resumption Lag and the Role of Cues. 2004. Available online: http://www.dtic.mil/dtic/tr/fulltext/u2/a480333.pdf (accessed on 30 January 2020).
  28. Edwards, M.B.; Gronlund, S.D. Task interruption and its effects on memory. Mem. 1998, 6, 665–687. [Google Scholar] [CrossRef] [PubMed] [Green Version]
  29. Bailey, B.P.; Konstan, J.A. On the need for attention-aware systems: Measuring effects of interruption on task performance, error rate, and affective state. Comput. Human. Behav. 2006, 22, 685–708. [Google Scholar] [CrossRef]
  30. Speier, C.; Valacich, J.S.; Vessey, I. The Influence of Task Interruption on Individual Decision Making: An Information Overload Perspective. Decis. Sci. 1999, 30, 337–360. [Google Scholar] [CrossRef]
  31. Weigl, M.; Müller, A.; Vincent, C.; Angerer, P.; Sevdalis, N. The association of workflow interruptions and hospital doctors’ workload: A prospective observational study. BMJ Qual. Saf. 2012, 21, 399–407. [Google Scholar] [CrossRef] [Green Version]
  32. Heath, C.; Larrick, R.P.; Wu, G. Goals as reference points. Cogn. Psychol. 1999, 38, 79–109. [Google Scholar] [CrossRef]
  33. Muraven, M.; Tice, D.M.; Baumeister, R.F. Self-control as a limited resource: Regulatory depletion patterns. J. Pers. Soc. Psychol. 1998, 74, 774. [Google Scholar] [CrossRef]
  34. Trafton, J.G.; Altmann, E.M.; Brock, D.P.; Mintz, F.E. Preparing to resume an interrupted task: Effects of prospective goal encoding and retrospective rehearsal. Int. J. Hum. Comput. Stud. 2003, 58, 583–603. [Google Scholar] [CrossRef]
  35. Monk, C.A.; Trafton, J.G.; Boehm-Davis, D.A. The effect of interruption duration and demand on resuming suspended goals. J. Exp. Psychol. Appl. 2008, 14, 299–313. [Google Scholar] [CrossRef] [Green Version]
  36. Schömig, N.; Metz, B. Three levels of situation awareness in driving with secondary tasks. Saf. Sci. 2013, 56, 44–51. [Google Scholar] [CrossRef]
  37. Beggiato, M.; Hartwich, F.; Schleinitz, K.; Krems, J.; Othersen, I.; Petermann-Stock, I. What would drivers like to know during automated driving? Information needs at different levels of automation. 7. Tagung Fahrerassistenzsysteme. 2015. Available online: https://mediatum.ub.tum.de/doc/1285216/file.pdf (accessed on 30 January 2020).
  38. Danner, S.; Pfromm, M.; Limbacher, R.; Bengler, K. Information needs regarding the purposeful activation of automated driving functions—an exploratory study. Available online: https://www.researchgate.net/profile/Simon_Danner5/publication/338712235_Information_needs_regarding_the_purposeful_activation_of_automated_driving_functions-an_exploratory_study/links/5e26d10ea6fdcc38d24e09a7/Information-needs-regarding-the-purposeful-activation-of-automated-driving-functions-an-exploratory-study.pdf (accessed on 30 January 2020).
  39. Körber, M.; Prasch, L.; Bengler, K. Why Do I Have to Drive Now? Post Hoc Explanations of Takeover Requests. Hum. Factors 2018, 60, 305–323. [Google Scholar] [CrossRef] [PubMed] [Green Version]
  40. Feierle, A.; Bücherl, F.; Hecht, T.; Bengler, K. Evaluation of Display Concepts for the Instrument Cluster in Urban Automated Driving. In Proceedings of the International Conference on Human Systems Engineering and Design: Future Trends and Applications, Munich, Germany, 16–18 September 2019. [Google Scholar]
  41. Brooke, J. SUS - A quick and dirty usability scale. Usability Eval. Ind. 1998, 189, 4–7. [Google Scholar]
  42. Hart, S.G.; Staveland, L.E. Development of NASA-TLX (Task Load Index): Results of empirical and theoretical research. In Advances in Psychology; north-holland publishing company: Amsterdam, The Netherlands, 1988. [Google Scholar]
  43. van der Laan, J.D.; Heino, A.; de Waard, D. A simple procedure for the assessment of acceptance of advanced transport telematics. Transp. Res. Part C Emerg. Technol. 1997, 5, 1–10. [Google Scholar] [CrossRef]
  44. Harwell, M.R.; Rubinstein, E.N.; Hayes, W.S.; Olds, C.C. Summarizing Monte Carlo Results in Methodological Research: The One- and Two-Factor Fixed Effects ANOVA Cases. J. Educ. Stat. 2016, 17, 315–339. [Google Scholar] [CrossRef]
  45. EN ISO 15007-1:2014: Road vehicles - Measurement of driver visual behaviour with respect to transport information and control systems - Part 1: Definitions and parameters; Beuth Verlag GmbH: Berlin, Germany, 2015; Available online: https://www.iso.org/ru/standard/56621.html (accessed on 30 January 2020).
  46. Hergeth, S.; Lorenz, L.; Vilimek, R.; Krems, J.F. Keep Your Scanners Peeled: Gaze Behavior as a Measure of Automation Trust During Highly Automated Driving. Hum. Factors 2016, 58, 509–519. [Google Scholar] [CrossRef]
  47. Stapel, J.; Mullakkal-Babu, F.; Happee, R. Driver Behavior and Workload in an On-road Automated Vehicle. In Proceedings of the Road Safety and Simulation International Conference (RSS) 2017, Road Safety and Simulation International Conference (RSS), The Hague, The Netherlands, 17–19 October 2017. [Google Scholar]
  48. Bohrmann, D.; Bengler, K. Reclined Posture for Enabling Autonomous Driving. In Human Systems Engineering and Design II; Ahram, T., Karwowski, W., Pickl, S., Taiar, R., Eds.; Springer International Publishing: Cham, Switzerland, 2020; pp. 169–175. ISBN 978-3-030-27928-8. [Google Scholar]
  49. Kindelsberger, J.; Fridman, L.; Glazer, M.; Reimer, B. Designing Toward Minimalism in Vehicle HMI. arXiv 2018, arXiv:1805.02787. [Google Scholar]
Figure 1. Dynamic mock-up used in the present study.
Information 11 00073 g001
Figure 2. Graphical representation of different RtI frequencies in the three separate experimental drives.
Information 11 00073 g002
Figure 3. Left: Instrument cluster displaying speed limit, current speed, automation scale, navigation, take-over request, and reason for take-over. Right: predictive HMI textbox, “remaining time in automated mode >1min”.
Information 11 00073 g003
Figure 4. Boxplots for usability (System Usability Score) and acceptance (van der Laan acceptance questionnaire). RtI, requests to intervene.
Information 11 00073 g004
Figure 5. Boxplots for subjective use of travel time (7-Likert) and trust (7-Likert).
Information 11 00073 g005
Figure 6. Boxplots for workload (NASA-RTLX).
Information 11 00073 g006
Figure 7. Participation rates for predictive HMI and baseline HMI group, per RtI condition.
Information 11 00073 g007aInformation 11 00073 g007b
Figure 8. Total automated driving time per drive and HMI condition, average automated driving time per drive and HMI condition; error bars represent standard deviation.
Information 11 00073 g008
Figure 9. Attention ratios for instrument cluster and road per drive and HMI condition (in percent).
Information 11 00073 g009
Figure 10. Attention ratio for NDRA and monitoring ratio per drive in the HMI condition (in percent).
Information 11 00073 g010
Figure 11. Desired minimum automated driving duration and willingness to accept longer trip durations for less interruptions (7-Likert).
Information 11 00073 g011
Table 1. Summary of variables used in the presented study.
DatabaseVariableData Collection
Subjective dataUsabilitySystem Usability Scale (SUS)
WorkloadNASA-RTLX
AcceptanceVan der Laan Acceptance Questionnaire
TrustSingle-Item (7 Likert)
Use of travel timeSingle-Item (7 Likert)
Objective dataAttention Ratio
Monitoring Ratio
Remote eye-tracking system (Dikablis)
BehaviorNDRA participation rateGoPro camera

