Reliable Estimation of Urban Link Travel Time Using Multi-Sensor Data Fusion

1
School of Control Science and Engineering, Shandong University, Jinan 250061, China
2
School of Traffic and Logistics Engineering, Shandong Jiaotong University, Jinan 250357, China
*
Author to whom correspondence should be addressed.
Information 2020, 11(5), 267; https://0-doi-org.brum.beds.ac.uk/10.3390/info11050267
Submission received: 10 March 2020
/
Revised: 23 April 2020
/
Accepted: 14 May 2020
/
Published: 16 May 2020
(This article belongs to the Section Information Processes)
Abstract
:Travel time is one of the most critical indexes to describe urban traffic operating states. How to obtain accurate and robust travel time estimates, so as to facilitate to make traffic control decision-making for administrators and trip-planning for travelers, is an urgent issue of wide concern. This paper proposes a reliable estimation method of urban link travel time using multi-sensor data fusion. Utilizing the characteristic analysis of each individual traffic sensor data, we first extract link travel time from license plate recognition data, geomagnetic detector data and floating car data, respectively, and find that their distribution patterns are similar and follow logarithmic normal distribution. Then, a support degree algorithm based on similarity function and a credibility algorithm based on membership function are developed, aiming to overcome the conflicts among multi-sensor traffic data and the uncertainties of single-sensor traffic data. The reliable fusion weights for each type of traffic sensor data are further determined by integrating the corresponding support degree with credibility. A case study was conducted using real-world data from a link of Jingshi Road in Jinan, China and demonstrated that the proposed method can effectively improve the accuracy and reliability of link travel time estimations in urban road systems.
1. Introduction
Travel time is critical traffic information for road users and traffic managers [1]. It can better measure traffic congestion and transportation efficiency of urban roads, which is used as an indicator of traffic operating performance. Urban link travel time estimation plays an important role in evaluating urban traffic conditions and developing urban traffic management strategies.
The rapid development of intelligent transportation systems (ITS) has brought various road traffic perception technologies, promoting the wide-scale deployment and application of different types of traffic sensors. It is more common for a road link to be monitored by multiple sensors simultaneously. Fixed sensors of urban road networks, such as geomagnetic sensors and camera detectors, can obtain nearly-full-sample spot traffic state information near the installation location, but they cannot fully capture traffic operating states of the entire road links [2,3]. Mobile sensors that rely on mobile internet technology, such as GPS-based floating cars, can continuously track traffic flow information of the entire road links while failing to guarantee uniform coverage of effective floating cars in temporal and spatial dimensions [4,5]. Different types of traffic sensors have their own characteristics, which are closely related and complementary. Therefore, to obtain accurate and reliable estimations of urban link travel time, it is very necessary to fuse multi-sensor traffic data, take advantage of the detection advantages of different sensors and avoid the deficiencies of individual sensors.
Many research efforts have focused on data fusion approaches to enhance the accuracy and robustness of travel time estimates using multi-sensor traffic data. Current research findings of travel time fusion estimation can be broadly divided into three categories: statistical-based fusion algorithms, probability-based fusion algorithms, and artificial intelligence-based fusion algorithms [6]. In the statistical fusion algorithms, the statistical information of data quality is used to determine the weight of each traffic sensor data, and then data fusion is achieved by the weighted average method [7]. Tarko and Rouphail proposed a data fusion method of travel time based on the squared estimation error in ADVANCE (Advanced Driver and Vehicle Advisory Navigation Concept) project, namely the simple convex combination [8]. El Faouzi also extended the simple convex combination to the Bar–Shalom/Campo combination, by considering the covariance of different estimates [9]. Although these algorithms are relatively simple and widely used, they are less efficient when encountering multiple inconsistent or even conflicting data sources. Probabilistic fusion algorithms adopt the probability distribution or density functions to characterize the data uncertainty, and then combine the mathematical reasoning rules of Bayesian theory or evidence theory to achieve data fusion. Nantes et al. presented a real-time traffic state estimation model for arterial corridors by fusing heterogenous data sources, i.e., loop detector, GPS and Bluetooth data, through a Bayesian observer [10]. Mil and Piantanakulchai combined a modified Bayesian data fusion approach with the Gaussian mixture model to obtain travel time fusion estimates of different types of traffic sensors [11]. Evidence theory is a generalization of Bayesian theory, regardless of prior information. El Faouzi and Lefevre developed a classifiers and distance-based evidential fusion approach to estimate travel time [12]. Xia et al. fused two ITS data sources, i.e., microwave vehicle detector data and vehicle plate identification data, to estimate link travel time, based on the Dempster–Shafer evidence reasoning theory [13]. However, data fusion methods based on evidence theory may produce counter-intuitive results when fusing highly conflicting pieces of evidence [14,15]. Artificial intelligence-based fusion algorithms mainly include neural network, k-nearest neighbor and deep learning. Kolanowski et al. used the Elman artificial neural network to fuse multi-sensor data for the purpose of positioning [16]. Chen et al. proposed space discretization travel time calculation algorithm and speed integral travel time calculation method by combining the neural network with data fusion [17]. Tak et al. designed a multi-level k-nearest neighbor method with data fusion to predict travel time [18]. Liu et al. summarized existing urban big data fusion methods based on deep learning (DL) model and classified them into three categories, namely DL-output-based fusion, DL-input-based fusion and DL-double-stage-based fusion [19]. Zhao et al. adopted a gated recurrent unit model to predict travel time based on multi-source data [20]. These methods can tackle complex data fusion problems, but have a higher requirement for the number of training samples.
Considering the imperfection and diversity of traffic sensor technologies, and the nature of the application environment, all traffic sensor data may have some quality issues, such as imperfection, inconsistency and disparateness [21]. To tackle the aforementioned data issues and deficiencies of the existing methods, we propose a reliable estimation method of urban link travel time using multi-sensor data fusion. The main contributions of this paper are as follows: first, a support degree algorithm among multi-sensor traffic data is proposed based on similarity function and log-normal distribution model, so as to solve the conflicts of different traffic data sources; second, a credibility algorithm of single-sensor traffic data based on membership function is developed to eliminate unrealistic erroneous data and exclude uncertainty of data detection, incorporating the effects of sample vehicle penetration rate; third, the reliable fusion weights of each type of traffic sensor data are determined by integrating the support degree with the credibility, which further achieves accurate and reliable link travel time estimates.
The remaining part of the paper is organized as follows. In Section 2, urban link travel time extraction algorithms based on each single-sensor traffic data are presented respectively. Section 3 proposes a novel multi-sensor data fusion method to estimate link travel time. In Section 4, a case study is conducted to validate the effectiveness of the proposed method. The last section concludes this paper.
2. Link Travel Time Extraction Algorithms Based on Single-Sensor Traffic Data
New urban traffic data sources are increasing with the large-scale deployment and application of urban road traffic flow sensors. In order to understand the traffic operating mechanism of urban road system, it is crucial to efficiently extract valuable and accurate information from multi-sensor traffic data. The mainstream front-end traffic detectors for urban roads mainly include geomagnetic sensor, license plate recognition detection, and floating car detection. The obtained traffic sensor data collect the same urban traffic spatiotemporal information, but describe real traffic conditions from different scales and dimensions. The extraction algorithms of link travel time based on three types of single-sensor traffic data are given respectively.
2.1. Travel Time Extraction from License Plate Recognition Data
In the past few years, license plate recognition (LPR) camera systems have achieved rapid development in many countries and been widely used in the fields of traffic monitoring, law enforcement management, and automatic toll collection. When vehicles pass through the camera detection area, vehicle passing events are accurately recorded, including license plate number, passing time, instantaneous speed, intersection number, approach number, and lane number. Compared with conventional aggregate traffic data (such as five-minute flow data), high-resolution LPR event data can provide more detailed traffic flow information [22]. The rich data items make LPR data source have some unique characteristics [23,24]. First, it accurately records all the vehicle departing timestamps at the stop line of the intersection. Second, it can continuously track the vehicle trajectories based on the uniqueness of license plate number. Third, it can monitor traffic flows from different directions of the intersection at lane level. The detection advantages of LPR data enable it to become an emerging traffic data source for evaluating urban traffic states.
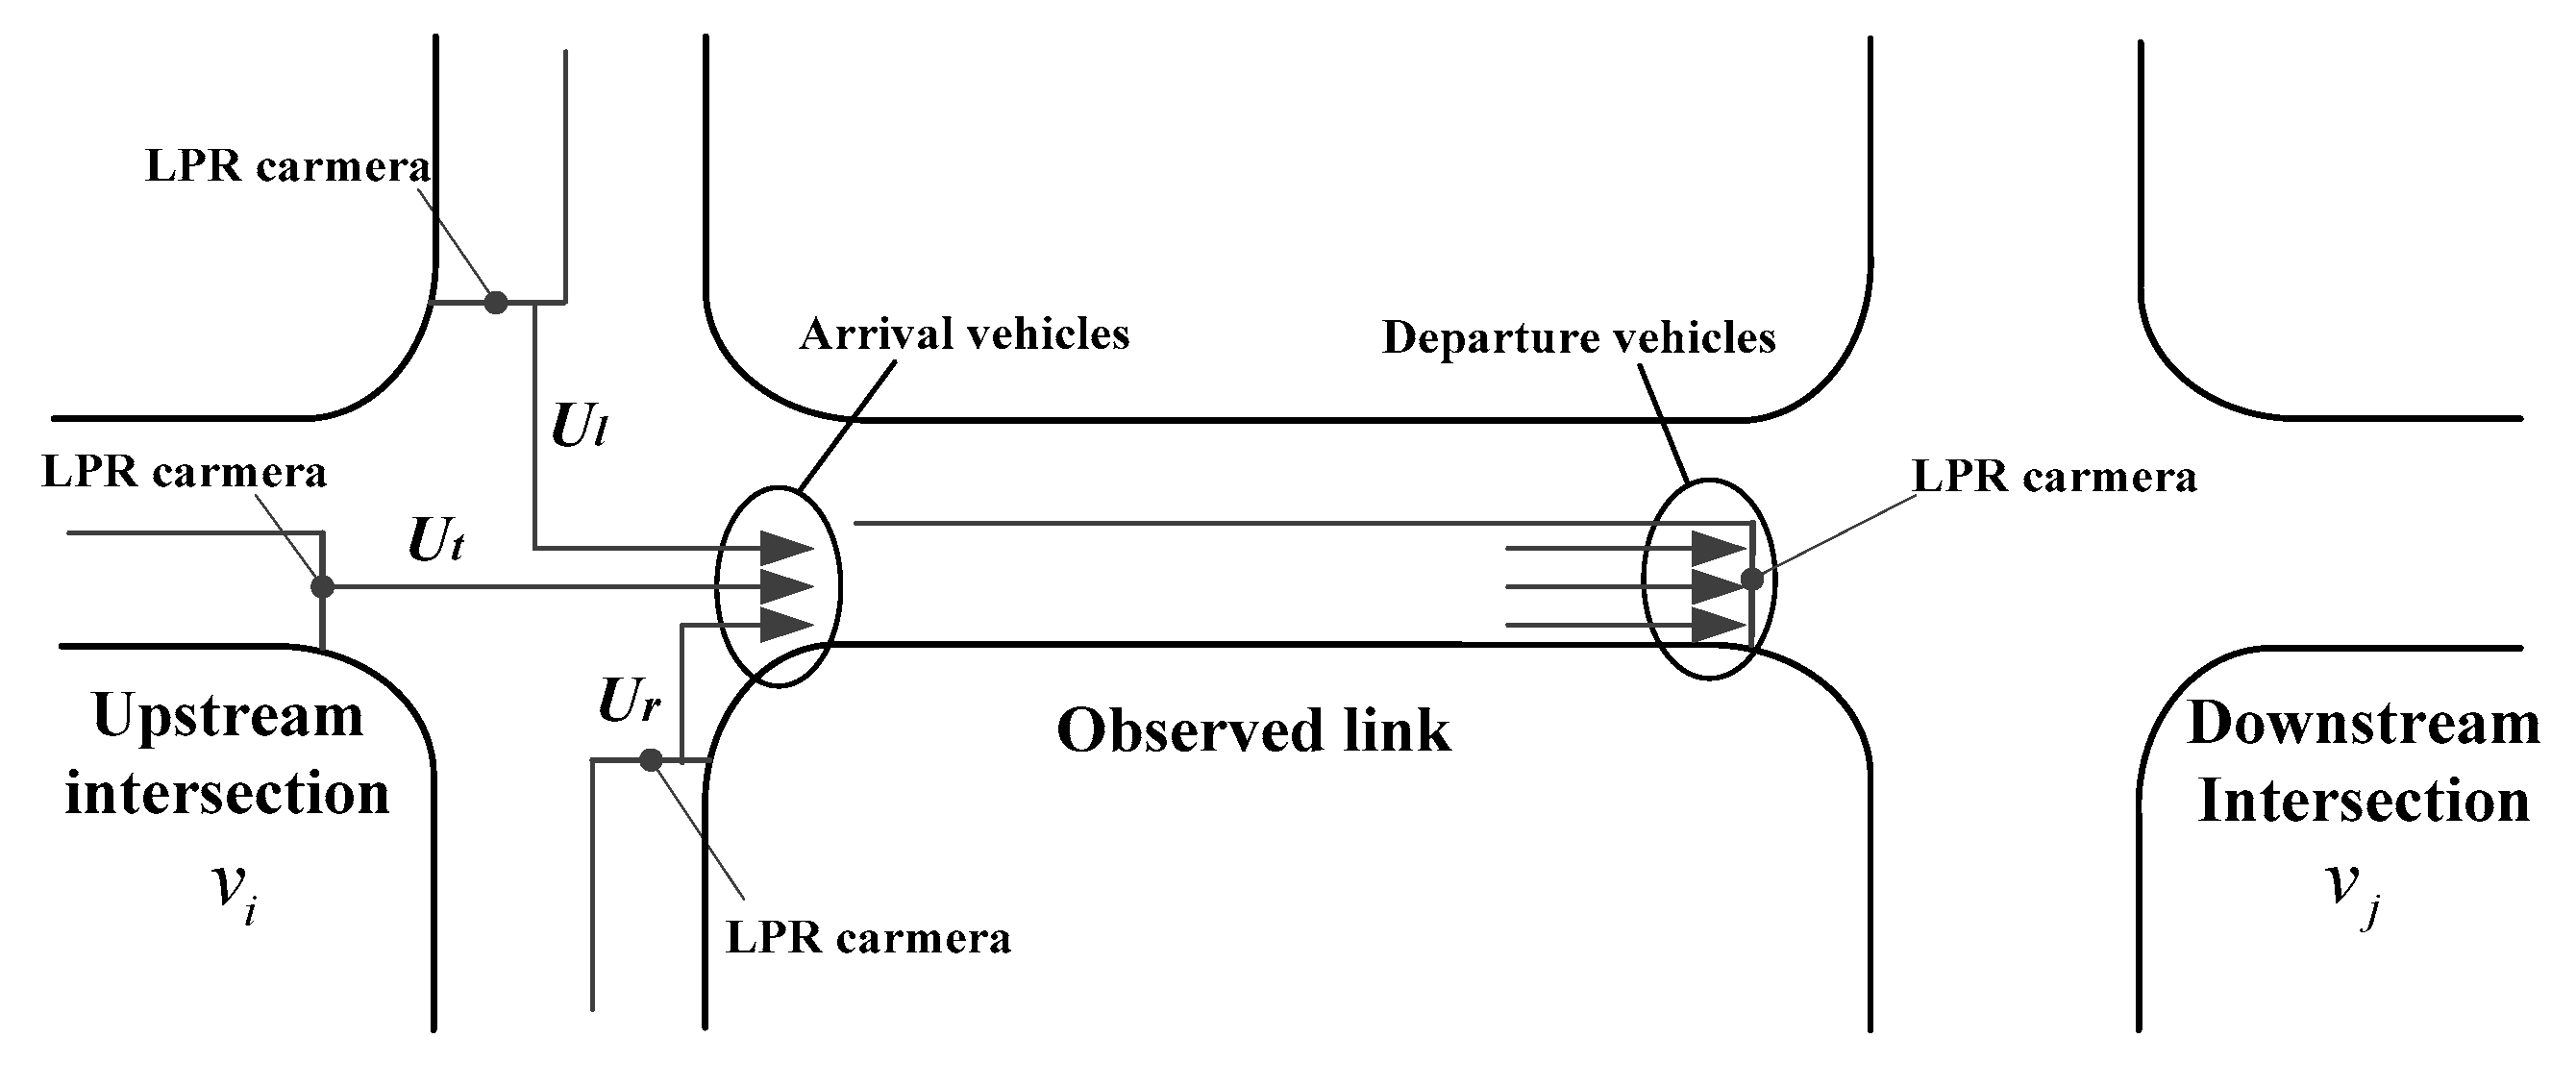
In this study, the urban road network is divided into many links with the stop lines as the breakpoints, that is, the distance between the stop lines at the upstream and downstream intersections is considered as a complete road link. As shown in Figure 1, the arriving vehicles on the observed link are composed of three different directions of traffic flows at the upstream intersection, i.e., through arrival vehicles , right arrival vehicles , and left arrival vehicles . The uniqueness of the license plate information enables a repeated identification between the arrival and departure vehicles on the observed link. The travel time records are obtained according to the matched vehicles. The average travel time using LPR data can be calculated by the following formula:
where is the number of matched vehicles on the observed link at the timestep t; is departure time of the nth matched vehicle on the observed link ; is arrival time of the nth matched vehicle on the observed link .
The above original travel time records contain some problem data, due to the misidentification of the license plate information or the vehicles stopping on the way. Therefore, it is necessary to preprocess the original data by removing outlier travel time records. The rough screening and mean absolute deviation (MAD) algorithms are adopted [25]. First, the range of rough screening is set to , and the records beyond this range are removed. Then the MAD algorithm is used for further screening to obtain valid travel time records. The evaluation criterion of this algorithm is set as , where is the median of all the travel time records at the timestep t. Moreover, the MAD is calculated by:
2.2. Travel Time Extraction from Geomagnetic Detector Data
In the past, vehicle arrivals on the road links were always detected using loop coil detectors. This type of traffic sensor is buried under the ground, which causes great damage to the road surface and requires a large amount of maintenance. The geomagnetic detector is not only stable and reliable with high detection accuracy, but also convenient to install and maintain. These two magnetic detectors can obtain similar traffic flow information, such as traffic flow rate and occupancy rate. As an alternative to the loop coils, the geomagnetic detectors are developing into an important fixed urban road detector.
Geomagnetic detector data (GDD) belong to point traffic flow data, and the certain mathematical models need to be constructed to obtain the corresponding average travel time. The previous studies [26,27] show that the link travel time series in highway and urban road environments are greatly affected by the fluctuation of traffic flows, but they exhibit different function relationships. The BPR (Bureau of Public Roads) function [28] is a travel time estimation model with traffic flow rate as an independent variable for highway environment. Its mathematical formula is as follows:
where is the average travel time estimate of observed link using the GDD at the timestep t; is the travel time of observed link (vi, vj) in free flow state; is the actual traffic flow of observed link obtained from the GDD at the timestep t; cij is the capacity of observed link ; and are impedance parameters. The BPR function shows three important relationship characteristics: (i) the link travel time is close to the free-flow travel time when actual traffic flow is small enough; (ii) the link travel time varies slowly and is proportional to traffic flow when actual flow is far less than the link capacity; (iii) the link travel time increases rapidly with the change of traffic flow when actual flow approaches or exceeds capacity. Unlike the highway environment, there are signal controls in urban road networks. As traffic congestion is increasingly heavier, urban link travel time will not get continuous growth. This means that when traffic flow exceeds the capacity and road link reaches the certain congested level, the flow begins to decrease and the travel time increases to a stable high value. So, the BPR function model cannot be directly applied to urban roads, and the uniformly calibrated BPR model achieves poor estimation in the congested state. In view of this, the BPR model is calibrated by differentiating traffic conditions, so as to make better use of the GDD to estimate urban link travel time [29]. This paper considers the product of traffic flow and occupancy rate from the GDD as road traffic state index. The specific calculation formula is as follows:
where is traffic state index of observed link using the GDD at the timestep t; and are actual flow and occupancy rate of observed link from the GDD at the timestep t. Taking the historical GDD and LPR data of Jingshi Road in Jinan as an example, the results show that the traffic state index is relatively consistent with the trend of link travel time series, as shown in Figure 2. The link traffic state is classified into three categories according to the change trend of this index: (i) when , the traffic state index is low and stable, and the observed link is smooth at the timestep t; (ii) when , the traffic state index increases and the observed link is in a blocked state at the timestep t; (iii) when , the traffic state index is high and the observed link is in a congested state at the timestep t.
The BPR function is calibrated in the above three states of smooth, blocked and congested, respectively. The calibrated BPR function is as follows:
2.3. Travel Time Extraction from Floating Car Data
Vehicles with on-board positioning systems and communication devices can detect real-time traffic flow information when driving on the road. These mobile vehicles are called floating cars and the detected data are floating car data (FCD). These data contain license plate number, latitude and longitude, instantaneous speed, GPS time, status code, etc. Compared to fixed traffic sensors, floating car detection can continuously capture road traffic state information and get a wide coverage of road networks, without destroying road infrastructure. Recently, floating car data have become an important traffic data source for urban road systems and achieved a wide variety of applications, such as road monitoring, traffic management and travel service [30]. From the perspective of the characteristics of the FCD, this paper adopts a suitable travel time extraction method.
First, the GPS positioning data of floating cars are matched with the road electronic map to obtain the observed trajectories of vehicles. The return frequency of the FCD used in this paper is 3 s. Considering a large number of detection points of each vehicle on the observed link, the time deviation between the first and last detection points is taken as a link travel time record .
For some road links, the observed vehicle trajectories do not completely cover the entire road link. The link travel time record needs to be extended to the entire link by using the coefficient and the calculation formula is as follows:
where is the whole link travel time extended from link travel time record of the nth floating car; is the ratio of the length covered by the nth observed vehicle trajectory to the total link length.
The credibility of the obtained link travel time is proportional to the overlap between the observed vehicle trajectories and the detection link. So, the proportion of the overlapping part in the total link length is assigned to each whole travel time as the corresponding weight, and the average link travel time using the FCD at the timestep t is calculated as follows:
3. Urban Link Travel Time Estimation Method Using Multi-Sensor Data Fusion
Multi-sensor traffic data fusion aims at obtaining a consistent interpretation or description of observation objects and achieving the best estimation or decision tasks, by processing and fusing multi-sensor traffic information in different time and space domains. Each individual traffic sensor data in the urban road system have some uncertainties, such as the incompleteness of data, unreliability of data acquisition and the contradictions of different data sources. The fusion of these uncertain information is essentially an uncertainty reasoning and decision-making process. Evidence theory is an effective method to resolve the problem of uncertainty information fusion. Data fusion using evidence theory is mainly to estimate the credibility of different evidences, and different credibility measures will produce different fusion effects. Considering multi-sensor traffic data as different evidences for observing the same traffic parameter, we propose a reliable estimation method of urban link travel time using multi-sensor data fusion.
In this method, three travel time series are first extracted from the LPR, GDD and FCD respectively, according to Section 2. On the basis of obtaining distribution functions of three link travel time series, we develop a support degree algorithm based on similarity function and a credibility algorithm based on membership function. Then, an integrated credibility is proposed based on the support degree among multi-sensor traffic data and the credibility of single-sensor traffic data, which further achieve accurate and reliable link travel time estimates. The flowchart of the proposed method is shown in Figure 3.
3.1. Support Degree Algorithm of Multi-Sensor Traffic Data
In the urban road systems, the GDD, FCD and LPR data can extract average link travel time that fits the lognormal distribution. We suppose that the three types of traffic sensor data are regarded as different types of evidence, i.e., . The average link travel time series extracted from traffic data sources a and b are denoted by the vector and , . The corresponding probability density functions are denoted by and , which are used as the characteristic functions of traffic data sources. and are the average link travel time at the timestep t in and . The conflict degree between various traffic data sources at the same time step is measured using the confidence distance, which is specifically calculated as:
where is the confidence distance measure between and . When the average link travel time of traffic data source a follows a lognormal distribution, the characteristic function is given by:
The average travel time of the same road link at the same timestep is observed by multi-sensor traffic data. Accordingly, can be calculated based on the travel time estimates at the timestep t. Then, the confidence distance matrix Dt is obtained by:
The smaller the confidence distance measure is, the smaller the conflict degree between and . This means that traffic data source a is highly supported by b. Therefore, the similarity measure between and is defined as:
The corresponding similarity matrix of the three traffic data sources can also be obtained, namely:
The support degree of traffic data source a from other data sources can be calculated by the following formula:
The normalized support degree of traffic data source a is given by:
3.2. Credibility Algorithm of Multi-Sensor Traffic Data
The average travel time obtained by each type of traffic sensor data may have quality issues, such as false data and an unrealistic outlier. This paper adopts the principle of threefold standard deviation to determine the reasonable range of travel time, i.e., . Moreover, given the fact that the floating cars are unevenly distributed in space and time domains, the proportion of samples also needs to be considered. So, the membership function for each type of traffic sensor data is developed to represent the credibility of each estimation, which is calculated as follows:
where is the credibility of link travel time estimate at the timestep t based on traffic data source a; and are the mean and standard deviation of logarithm of link travel time estimates based on traffic data source a. is the sample vehicle penetration rate of traffic data source a at the timestep t, i.e., the ratio of the number of sample vehicles to the link traffic flow. So, the license plate recognition penetration rate and the floating car penetration rate can be calculated by the following formulae:
where is the number of sample vehicles (matched vehicles) in the LPR data; is the number of floating car samples in the FCD; is the real-time traffic flow detected by the GDD. Considering that the link travel time extracted by the GDD is an indirect estimate and does not involve vehicle penetration rate, we adopt Equations (16) and (17) to derive , that is:
The credibility of each type of traffic sensor data is obtained by the normalization processing, and the specific calculation is as follows:
3.3. Reliable Fusion of Average Link Travel Time
The support degree among multi-sensor traffic data reflects the contradictions of the average link travel time parameters extracted by different traffic data sources. The credibility of multi-sensor traffic data characterizes the imperfection and unreliability of a single data source itself. To obtain accurate urban traffic flow information, this paper proposes an integrated credibility estimation of traffic data source based on the support degree and the credibility, which is calculated as follows:
where is the integrated credibility of traffic data source a at the timestep t.
The integrated credibility of each type of traffic sensor data is adjusted by the normalization processing, that is:
Taking the above normalized credibility of each type of traffic sensor data as the fusion weight, the average link travel time using multi-sensor traffic data fusion is calculated as follows:
where , and are average travel time estimates of observed link , using the LPR, GDD and FCD at the timestep t, respectively.
In addition, the scalability of this proposed method for more data sources needs to be elaborated. Similar to the LPR, GDD and FCD in this paper, we first extract link travel time series from new data sources and estimate the corresponding distribution functions. For the support degree algorithm of multi-sensor traffic data, the confidence distance matrix and similarity matrix are extended from to , where n is the total number of traffic data sources. The calculation of the elements in the matrices is exactly the same as that in Section 3.1. For the credibility algorithm of multi-sensor traffic data, the penetration rate of new data sources should be determined based on its own detection characteristics. Simultaneously, the penetration rate of GDD is updated. Then, the integrated credibility of each data source can be calculated respectively. Finally, the fusion formula of link travel time, i.e., Equation (22), should be expanded according to the total number of traffic data sources.
4. Case Study and Results
To verify the effectiveness of the proposed fusion method in this paper, three types of traffic sensor data, including the LPR data, the GDD and the FCD are used for the calibration and accuracy test of the average link travel time fusion estimation method. The LPR data are converted from the traffic flow information detected by the cameras at the intersections. The GDD are collected by the detectors installed near the stop lines at the intersections. The FCD are derived from the floating cars with on-board GPS devices. The test area is a link of Jingshi Road in Jinan City. The link length is 720 m including two intersections. Note that LPR data are obtained based on the random arrival vehicles and do not have a fixed sampling time interval. The sampling time intervals of GDD and FCD are 5 min and 3 s, respectively. Although these raw data are asynchronous, their reference time is consistent. In this case study, the unit of the average link travel time extracted from each traffic data source is 15 min. The data collection time is all Wednesdays (0:00–24:00) in March 2016. The first four Wednesdays (March 2, March 9, March 16 and 23) are historical data for parameter calibration of the proposed fusion method. Additionally, the data of last Wednesday (March 30) is used for testing the proposed fusion method in this paper. From the above data, the LPR, GDD and FCD involve an average of 27,138, 36,810 and 1218 vehicles per day, respectively.
4.1. Distribution Fitting of Average Link Travel Time Series
The average link travel time series are extracted from three traffic data sources. The corresponding probability histogram is drawn based on the historical travel time series. The preliminary analysis shows that the average link travel time distributions based on three traffic data sources are asymmetric and exhibit a long tail. The commonly used normal distribution is a symmetric distribution, which will not give a good fit. Hence, we adopt the log-normal distribution function to fit the average link travel time based on the distribution fitting toolbox of MATLAB [31]. Figure 4, Figure 5 and Figure 6 display the probability histograms of three types of single-sensor traffic data and the corresponding probability density function (PDF) curves of the fitted distributions. Furthermore, a Kolmogorov–Smirnov test is employed to evaluate the quality of the fitted distribution functions. Table 1 gives the distribution parameters of average link travel time series, based on three types of single-sensor traffic data and corresponding goodness-of-fit test results. As can be observed in Table 1, their test statistics are less than the critical value at significance level of 0.05, which indicates the average travel time series following the fitted distribution functions.
4.2. Analysis of Case Results
Average link travel time at a certain time step is defined as the arithmetic mean of travel time records of all vehicles on the observed link. However, none of the existing traffic data sources can obtain travel time records of all vehicles. The average penetration rate of matched vehicles from the LPR detectors at peak hours is as high as 80%. And related research shows that the travel delay error from the LPR system is within 6% [32]. Therefore, the average link travel time extracted from four-day historical LPR data is used as the basic data for comparative analysis.
We adopt an existing weight distribution fusion method to make a comparative analysis with the proposed fusion method in this paper [7]. This method assigns the weights of travel time estimates based on multiple traffic data sources, ensuring that the total mean square error of the data fusion result is minimized. Then, the weighted average method is used to obtain the travel time fusion estimates. The weight of the link travel time estimate at the timestep t based on traffic data source a is calculated as follows:
where is the squared error between the estimation of traffic data source a at the timestep t and the estimation of historical LPR data at the timestep t−1.
The mean absolute percentage error (MAPE), mean absolute error (MAE) and root mean square error (RMSE) are adopted to evaluate the accuracy and stability of the proposed fusion method, and the calculation formulae are as follows:
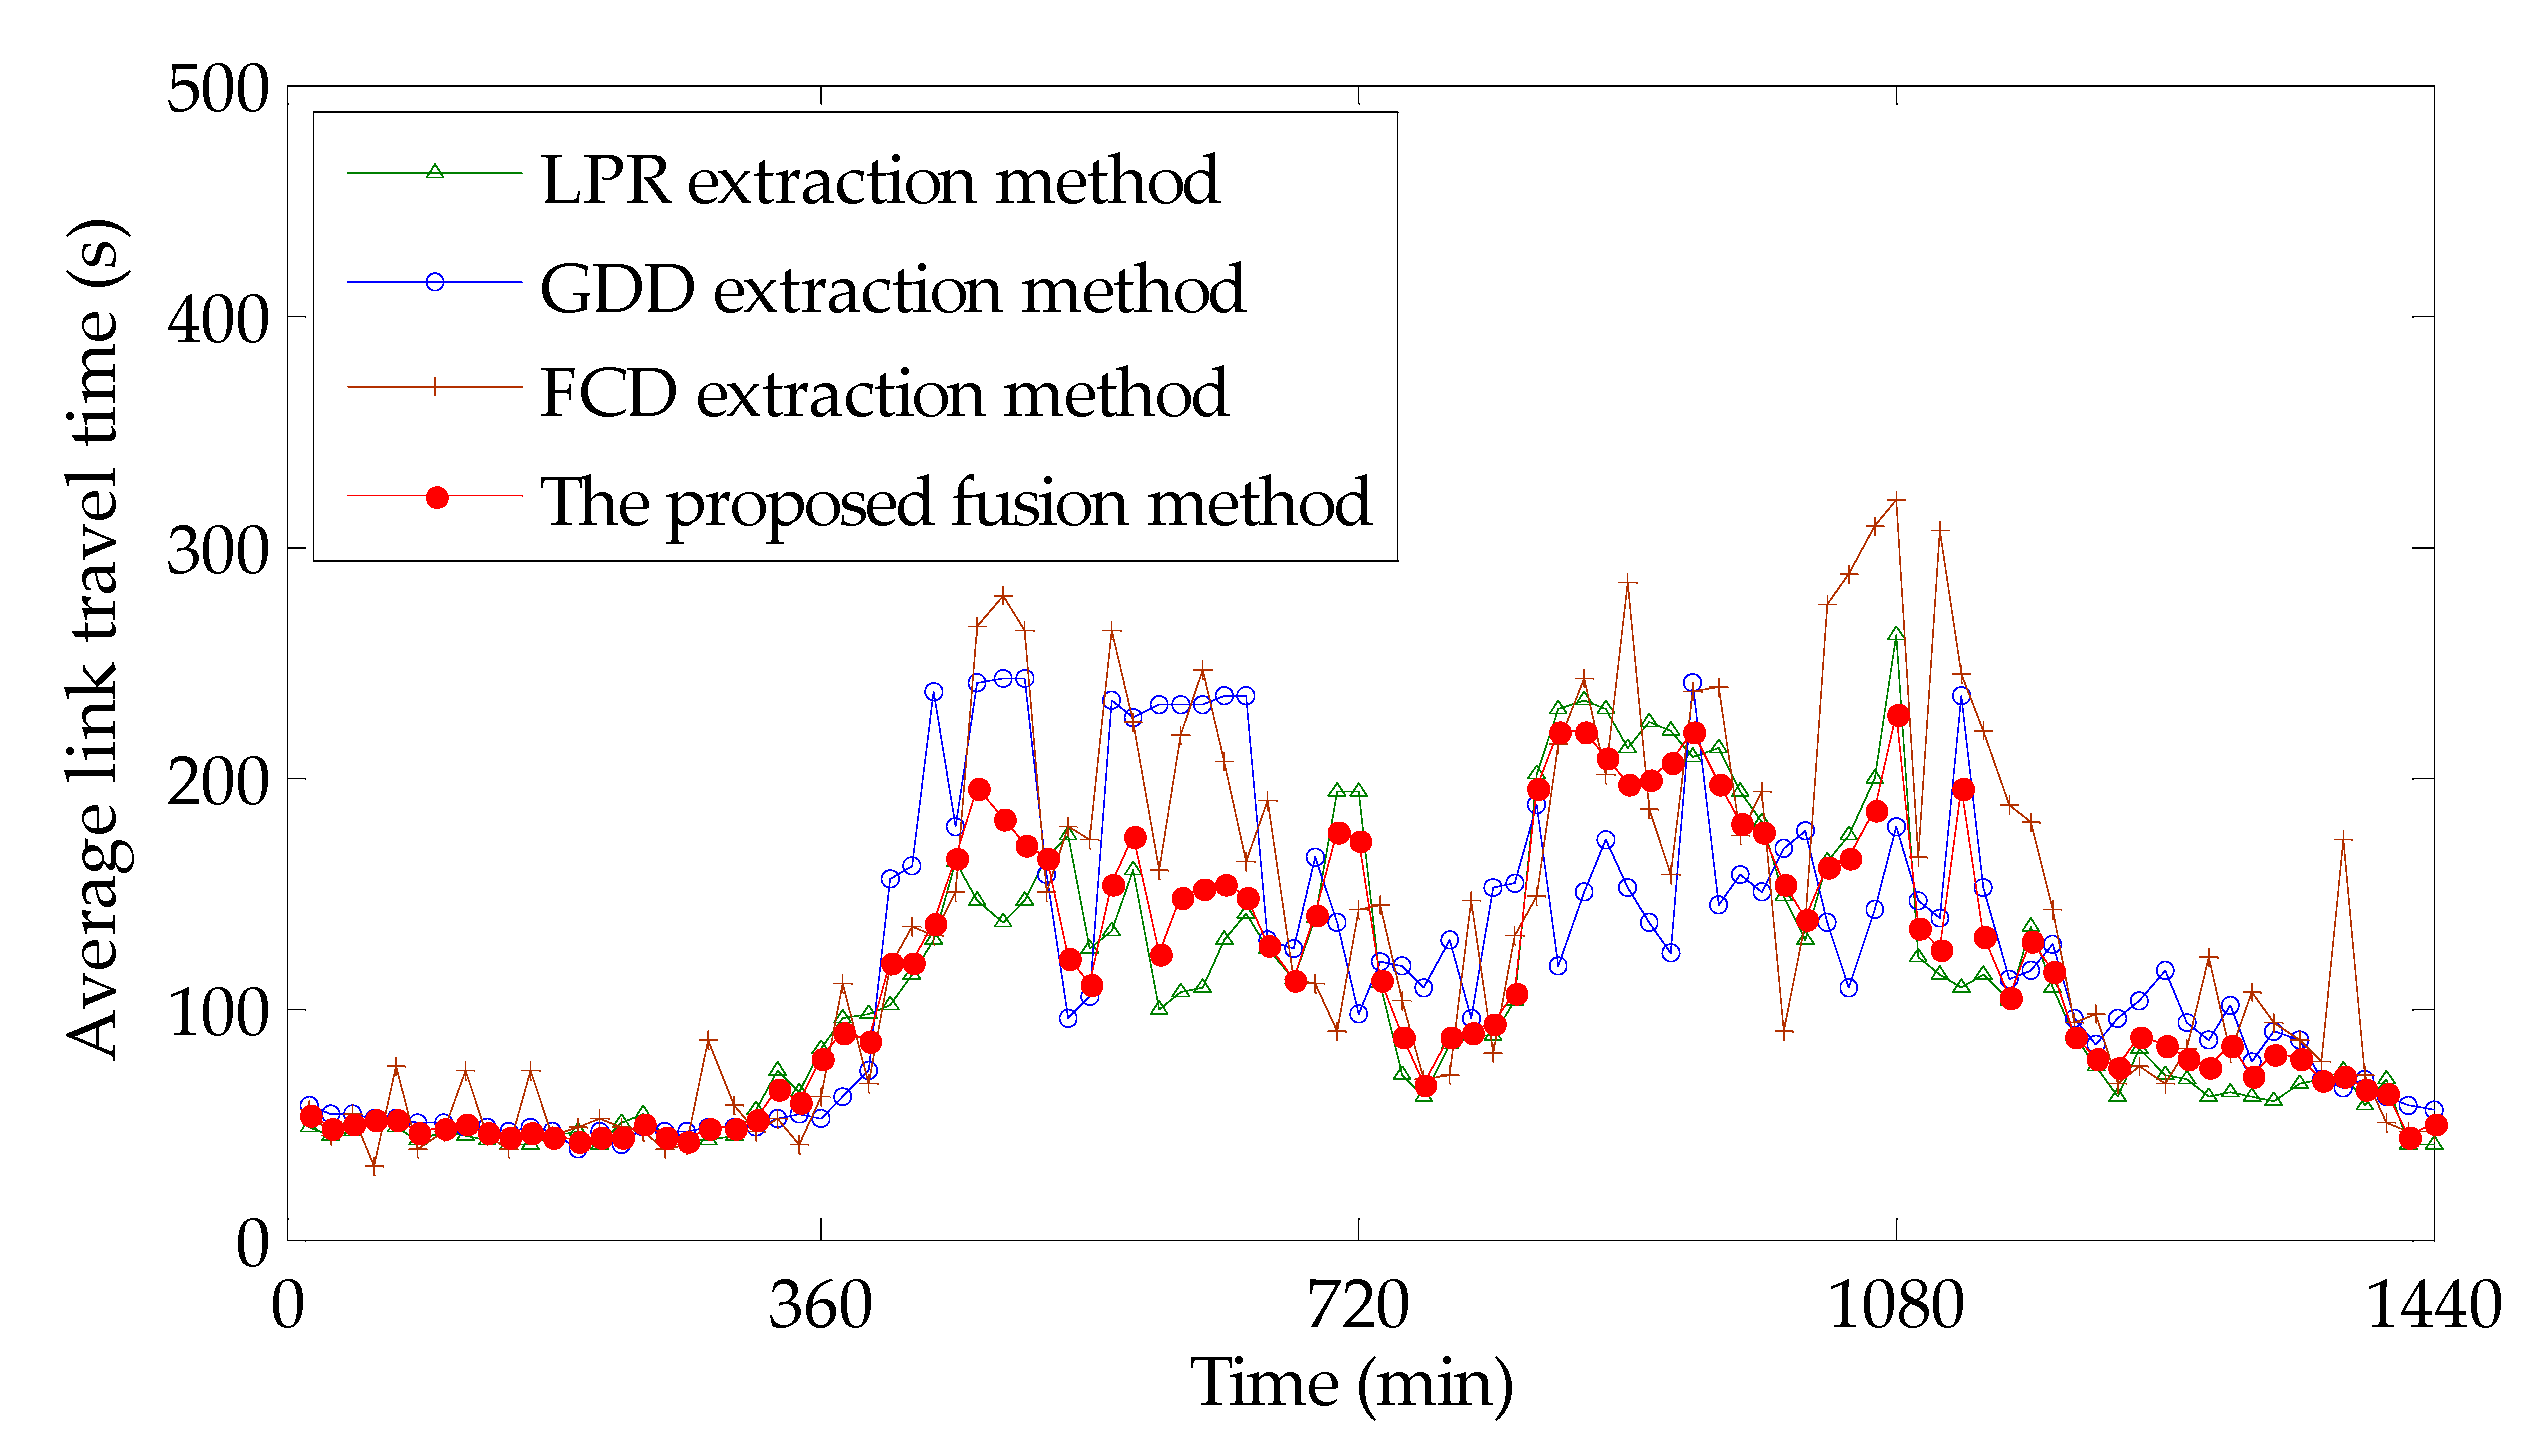
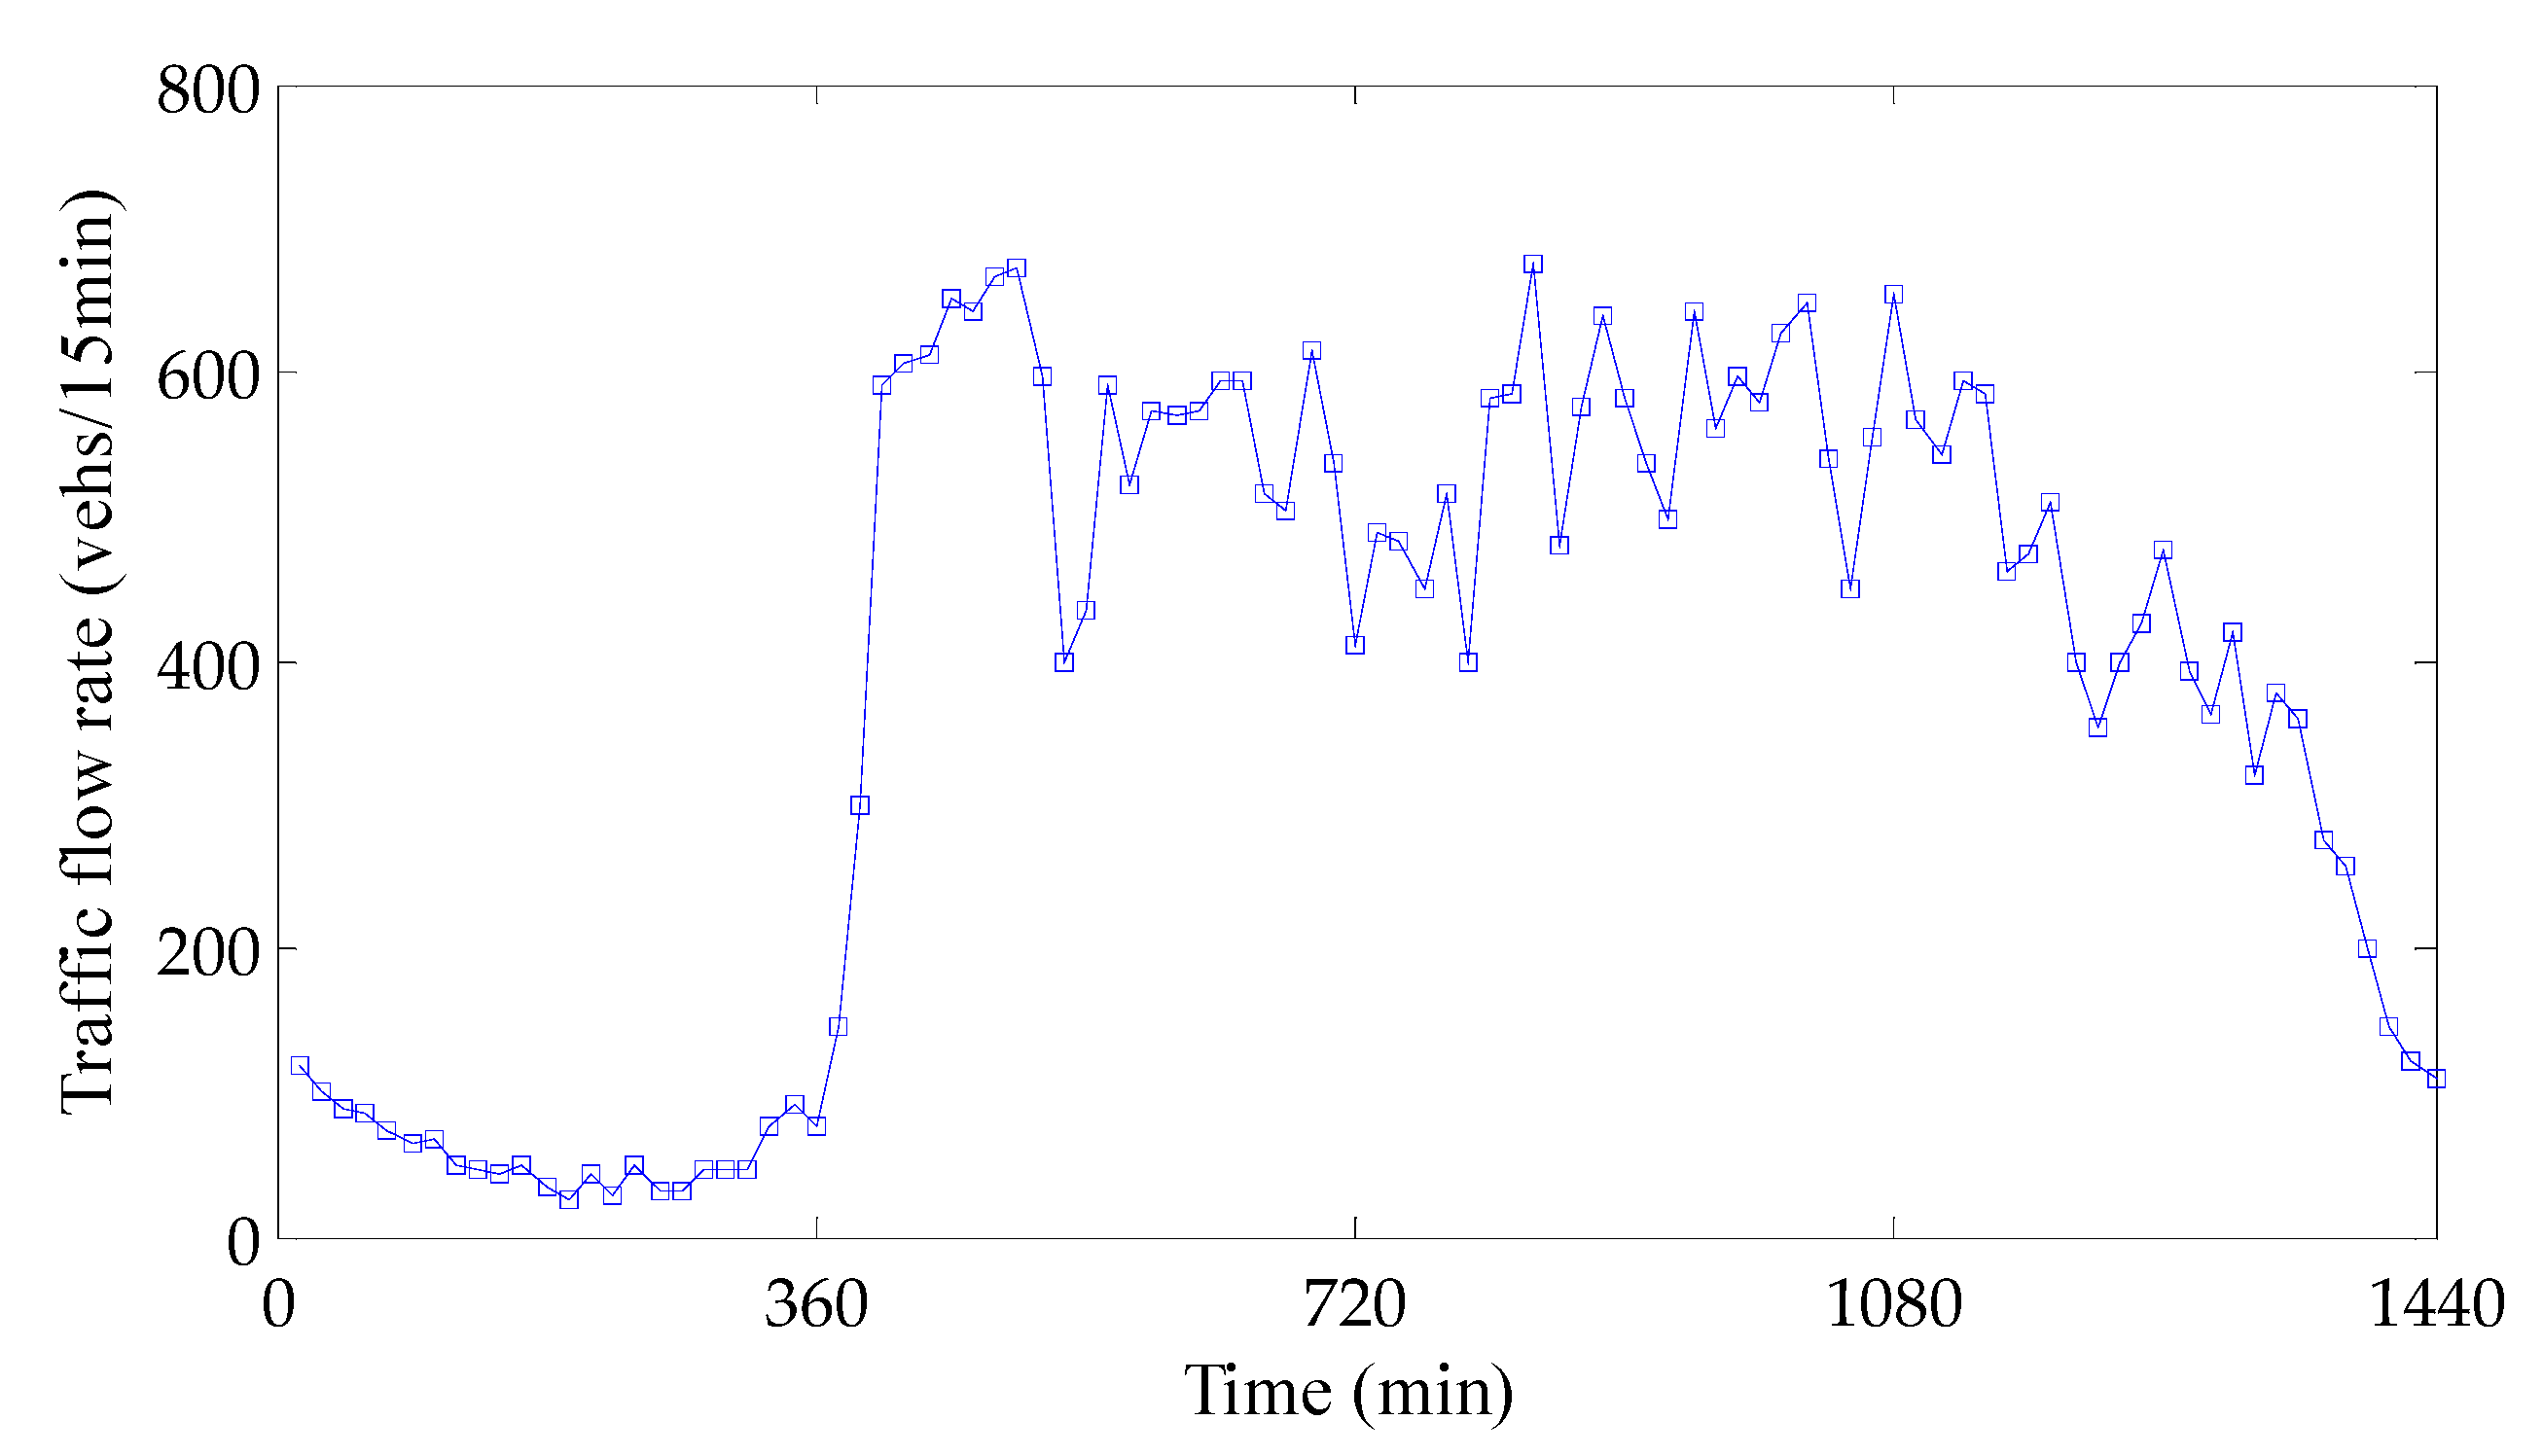
The average link travel time series obtained by the proposed fusion methods and three single-sensor traffic data extraction methods are shown in Figure 7. Figure 8 displays the traffic flow rate series based on GDD data. We found that different average link travel time estimation methods exhibit more consistent estimation results for low-flow traffic scenarios. However, during the morning and evening rush hours, there were some estimation differences among four different methods. This is due to the fact that as traffic flows increase, vehicles experience different levels of queuing and delays at signalized intersections, generating travel time records with large differences. To further confirm this, we calculated the standard deviation of 15 min travel time records, and the average value at night is 7.3 and the average value of peak hours is 36.2. So, three single-source traffic data extraction methods with different sample sets and sample sizes produce clear differences in estimation results for peak hours. At this time, the support and credibility algorithms act together, making the fusion results in this paper more inclined to the estimates with strong support degree and high credibility. This also explains that, unlike the evening peak, the fusion estimate of the morning peak is not significantly close to the two similar estimates (i.e., extracted by the GDD and FCD), due to the effect of higher LPR penetration rate.
The comparative analysis of the errors is shown in Table 2. As shown in Table 2, the estimation accuracy and stability of the two fusion methods outperform the single-sensor traffic data extraction methods. It can be seen that multi-sensor traffic data fusion can effectively avoid the limitations of single-sensor data and improve the problems of insufficient accuracy and poor stability. Compared with the weight distribution fusion method, the estimation of the proposed fusion method in this paper is closer to the basic data, and the corresponding MAPE and MAE have increased by 10.11% and 8.98%, respectively. The RMSE has improved by 16.55%, which indicates that the stability of the fusion method in this paper is more stable than the weight distribution fusion method.
5. Conclusions
This paper proposes an urban link travel time estimation method using multi-sensor traffic data fusion to capture the real traffic operating states of the urban road network system. Based on the the characteristic analysis of each individual traffic sensor data, the link travel time series are first extracted from three single-sensor traffic data. We adopt the logarithmic normal distribution function to fit the link travel time series and reveal the corresponding distribution laws. On this basis, a support degree algorithm based on similarity function is developed to measure the conflicts among multi-sensor traffic data. Moreover, a credibility algorithm based on membership function is presented by incorporating the effects of sample vehicle penetration rate, so as to accurately characterize the imperfections of single sensor data. Furthermore, an integrated credibility estimation method is proposed to determine the fusion weights of each traffic sensor datum, deriving a reliable fusion result of link travel time.
Future research will be conducted to integrate the goodness of fit of average link travel time distribution into the proposed fusion method. The effects of the goodness of fit on the fusion results should also be explored. In addition, a single source of floating car data in this paper fails to ensure the randomness of the sample vehicles when exploring the travel time distribution, which causes some estimation deviation. How to evaluate and revise this estimation deviation of travel time is another research priority.
Author Contributions
Methodology, Y.G.; Validation, Y.G.; Writing—original draft, Y.G.; Writing—review and editing, L.Y. All authors have read and agreed to the published version of the manuscript.
Funding
This work is supported by National Natural Science Foundation of China (Grant No. ZR2017MF011), Shandong Natural Science Foundation of China (Grant No. ZR2018MF027), National Statistical Science Research of China (Grant No. 2017LZ22), Shandong Key Research and Development Project of China (Grant No. 2016GSF120009, 2017GGX50110, GG201809240117), Technology Research Program of the Ministry of Public Security, China (Grant No. 2018JSYJB05), Jinan Philosophy and Social Science Planning Program of China (Grant No. JNSK18D15) and Jinan Self-developed Innovation Team Project of “20 Policies for Colleges and Universities” Program, China (Grant No. 2019GXRC022).
Acknowledgments
The authors would like to thank the editors and the anonymous reviewers of this journal.
Conflicts of Interest
The authors declare no conflict of interest.
References
- Nie, Q.; Xia, J.; Qian, Z.; An, C.; Cui, Q.; Information, R. Use of Multisensor Data in Reliable Short-Term Travel Time Forecasting for Urban Roads. Transp. Res. Rec. J. Transp. Res. Board 2015, 2526, 61–69. [Google Scholar] [CrossRef]
- Bhaskar, A.; Chung, E.; Dumont, A.-G. Fusing Loop Detector and Probe Vehicle Data to Estimate Travel Time Statistics on Signalized Urban Networks. Comput. Civ. Infrastruct. Eng. 2010, 26, 433–450. [Google Scholar] [CrossRef] [Green Version]
- Yuan, Y.; Van Lint, H.; Van Wageningen-Kessels, F.; Hoogendoorn, S. Network-Wide Traffic State Estimation Using Loop Detector and Floating Car Data. J. Intell. Transp. Syst. 2014, 18, 41–50. [Google Scholar] [CrossRef]
- Zhu, N.; Liu, Y.; Ma, S.; He, Z. Mobile Traffic Sensor Routing in Dynamic Transportation Systems. IEEE Trans. Intell. Transp. Syst. 2014, 15, 2273–2285. [Google Scholar] [CrossRef]
- Li, X.; Shu, W.; Li, M.; Huang, H.-Y.; Luo, P.-E.; Wu, M.-Y. Performance Evaluation of Vehicle-Based Mobile Sensor Networks for Traffic Monitoring. IEEE Trans. Veh. Technol. 2008, 58, 1647–1653. [Google Scholar] [CrossRef]
- Shi, C.; Chen, B.; Lam, W.H.; Li, Q. Heterogeneous Data Fusion Method to Estimate Travel Time Distributions in Congested Road Networks. Sensors 2017, 17, 2822. [Google Scholar] [CrossRef] [Green Version]
- Choi, K.; Chung, Y.S. A data fusion algorithm for estimating link travel time. J. Intell. Transp. Syst. Technol. Plan. Oper. 2002, 7, 235–260. [Google Scholar] [CrossRef]
- Tarko, A.; Rouphail, N. Travel time data fusion in ADVANCE. In Proceedings of the Pacific Rim Trans Tech Conference, Seattle, WA, USA, 25–28 July 1993. [Google Scholar]
- El Faouzi, N.-E. Data-driven aggregative schemes for multisource estimation fusion: A road travel time application. Defense Secur. 2004, 5434, 351–359. [Google Scholar] [CrossRef]
- Nantes, A.; Ngoduy, D.; Bhaskar, A.; Miska, M.; Chung, E. Real-time traffic state estimation in urban corridors from heterogeneous data. Transp. Res. Part C Emerg. Technol. 2016, 66, 99–118. [Google Scholar] [CrossRef] [Green Version]
- Mil, S.; Piantanakulchai, M.; Soknath, M.; Mongkut, P. Modified Bayesian data fusion model for travel time estimation considering spurious data and traffic conditions. Appl. Soft Comput. 2018, 72, 65–78. [Google Scholar] [CrossRef]
- El Faouzi, N.; Lefevre, E. Classifiers and distance-based evidential fusion for road travel time estimation. In Proceedings of the Multisensor, Multisource Information Fusion: Architectures, Algorithms, and Applications, Kissimmee, FL, USA, 19–20 April 2006; Volume 6242. [Google Scholar]
- Xia, J.X.; Zhang, W.H.; Ma, D.S. A method to urban road travel time estimation through its data fusion based on DS evidential theory. Appl. Mech. Mater. 2014, 488, 1419–1425. [Google Scholar] [CrossRef]
- Xiao, F. A Novel Evidence Theory and Fuzzy Preference Approach-Based Multi-Sensor Data Fusion Technique for Fault Diagnosis. Sensors 2017, 17, 2504. [Google Scholar] [CrossRef] [PubMed] [Green Version]
- Deng, Y. Generalized evidence theory. Appl. Intell. 2015, 43, 530–543. [Google Scholar] [CrossRef] [Green Version]
- Kolanowski, K.; Świetlicka, A.; Kapela, R.; Pochmara, J.; Rybarczyk, A. Multisensor data fusion using Elman neural networks. Appl. Math. Comput. 2018, 319, 236–244. [Google Scholar] [CrossRef]
- Chen, D.; Zhang, K.; Liao, T. Practical travel time prediction algorithms based on neural network and data fusion for urban expressway. In Proceedings of the 2010 Sixth International Conference on Natural Computation, Yantai, China, 10–12 August 2010; Volume 4, pp. 1754–1758. [Google Scholar]
- Tak, S.; Kim, S.; Jang, K.; Yeo, H. Real-Time Travel Time Prediction Using Multi-Level k-Nearest Neighbor Algorithm and Data Fusion Method. Comput. Civ. Build. Eng. 2014, 2014, 1861–1868. [Google Scholar] [CrossRef] [Green Version]
- Liu, J.; Li, T.; Xie, P.; Du, S.; Teng, F.; Yang, X. Urban big data fusion based on deep learning: An overview. Inf. Fusion 2020, 53, 123–133. [Google Scholar] [CrossRef]
- Zhao, J.; Gao, Y.; Qu, Y.; Yin, H.; Liu, Y.; Sun, H. Travel Time Prediction: Based on Gated Recurrent Unit Method and Data Fusion. IEEE Access 2018, 6, 70463–70472. [Google Scholar] [CrossRef]
- Khaleghi, B.; Khamis, A.; Karray, F.O.; Razavi, S.N. Multisensor data fusion: A review of the state-of-the-art. Inf. Fusion 2013, 14, 28–44. [Google Scholar] [CrossRef]
- Wu, X.; Liu, H.X. Using high-resolution event-based data for traffic modeling and control: An overview. Transp. Res. Part C Emerg. Technol. 2014, 42, 28–43. [Google Scholar] [CrossRef]
- Mo, B.; Li, R.; Zhan, X. Speed profile estimation using license plate recognition data. Transp. Res. Part C Emerg. Technol. 2017, 82, 358–378. [Google Scholar] [CrossRef]
- Zhan, X.; Li, R.; Ukkusuri, S. Lane-based real-time queue length estimation using license plate recognition data. Transp. Res. Part C Emerg. Technol. 2015, 57, 85–102. [Google Scholar] [CrossRef]
- Robinson, S.; Polak, J.W. Overtaking Rule Method for the Cleaning of Matched License-Plate Data. J. Transp. Eng. 2006, 132, 609–617. [Google Scholar] [CrossRef]
- Rothrock, C.A.; Keefer, L.A. Measurement of urban traffic congestion. Highw. Res. Board Bull. 1957, 156, 1–13. [Google Scholar]
- Branston, D. Link capacity functions: A review. Transp. Res. 1976, 10, 223–236. [Google Scholar] [CrossRef]
- Bureau of Public Roads. Traffic Assignment Manual; Department of Commerce: Washington, DC, USA, 1964.
- Jiang, G.; Li, J.; Zhang, C. Modified BPR functions for travel time estimation of urban arterial road segment. J. Southwest Jiaotong Univ. 2010, 45, 124–129. [Google Scholar]
- Rahmani, M.; Koutsopoulos, H.N. Path inference from sparse floating car data for urban networks. Transp. Res. Part C Emerg. Technol. 2013, 30, 41–54. [Google Scholar] [CrossRef]
- Wu, L. Fuzzy distribution fitting for law of traffic accidents based on MATLAB. Math. Pract. Theory 2009, 39, 90–95. [Google Scholar]
- Song, L.; Chen, J.; Shi, J.; Wang, S. Algorithm research of auto-detecting the travel delay information with vehicle license plate automatic recognition. J. Transp. Eng. Inf. 2008, 6, 107–112. [Google Scholar]
Figure 1.
Illustration of arrival vehicles from the upstream intersection.

Figure 2.
Relationship between average link travel time and traffic state index.

Figure 3.
The flowchart of the proposed method.

Figure 4.
Probability histogram and probability density function (PDF) curve of average travel time based on license plate recognition (LPR) data.
Figure 4.
Probability histogram and probability density function (PDF) curve of average travel time based on license plate recognition (LPR) data.

Figure 5.
Probability histogram and PDF curve of average travel time based on geomagnetic detector data (GDD).
Figure 5.
Probability histogram and PDF curve of average travel time based on geomagnetic detector data (GDD).

Figure 6.
Probability histogram and PDF curve of average travel time based on floating car data (FCD).
Figure 6.
Probability histogram and PDF curve of average travel time based on floating car data (FCD).

Figure 7.
Average link travel time curves based on multi-sensor traffic data.

Figure 8.
Traffic flow rate based on GDD data.


Table 1.
Parameters and goodness of fit test results of three average link travel time distributions.
Table 1.
Parameters and goodness of fit test results of three average link travel time distributions.
| Traffic Sensor Data | Distribution Parameter | Kolmogorov–Smirnov Test | |||
|---|---|---|---|---|---|
| Mean μα | Standard Deviation δα | Test Statistics | Critical Value at 0.05 Significance Level | Result | |
| LPR | 4.5276 | 0.5612 | 0.0823 | 0.1388 | Accepted |
| GDD | 4.6254 | 0.5561 | 0.1206 | 0.1388 | Accepted |
| FCD | 4.6923 | 0.6410 | 0.0873 | 0.1388 | Accepted |
Table 2.
Error analysis of average link travel time based on multi-sensor traffic data.
| Methods | MAPE/% | MAE | RMSE |
|---|---|---|---|
| GDD extraction method | 22.34 | 26.82 | 35.59 |
| FCD extraction method | 27.43 | 31.37 | 44.72 |
| LPR extraction method | 12.31 | 15.43 | 22.72 |
| Weight distribution fusion method | 10.39 | 11.46 | 16.07 |
| The proposed fusion method | 9.34 | 10.43 | 13.41 |
© 2020 by the authors. Licensee MDPI, Basel, Switzerland. This article is an open access article distributed under the terms and conditions of the Creative Commons Attribution (CC BY) license (http://creativecommons.org/licenses/by/4.0/).
Share and Cite
MDPI and ACS Style
Guo, Y.; Yang, L. Reliable Estimation of Urban Link Travel Time Using Multi-Sensor Data Fusion. Information 2020, 11, 267. https://0-doi-org.brum.beds.ac.uk/10.3390/info11050267
AMA Style
Guo Y, Yang L. Reliable Estimation of Urban Link Travel Time Using Multi-Sensor Data Fusion. Information. 2020; 11(5):267. https://0-doi-org.brum.beds.ac.uk/10.3390/info11050267
Chicago/Turabian StyleGuo, Yajuan, and Licai Yang. 2020. "Reliable Estimation of Urban Link Travel Time Using Multi-Sensor Data Fusion" Information 11, no. 5: 267. https://0-doi-org.brum.beds.ac.uk/10.3390/info11050267
Note that from the first issue of 2016, this journal uses article numbers instead of page numbers. See further details here.