Article

Efficient Paradigm to Measure Street-Crossing Onset Time of Pedestrians in Video-Based Interactions with Vehicles

1
Mercedes-Benz AG, Leibnizstraße 2, 71032 Böblingen, Germany
2
Department of Human Factors, Ulm University, Albert-Einstein-Allee 41, 89081 Ulm, Germany
3
Mercedes-Benz R&D NA, 309 N Pastoria Ave, Sunnyvale, CA 94085, USA
*
Author to whom correspondence should be addressed.
Submission received: 28 May 2020 / Revised: 26 June 2020 / Accepted: 29 June 2020 / Published: 11 July 2020

Abstract

:
With self-driving vehicles (SDVs), pedestrians can no longer rely on a human driver. Previous research suggests that pedestrians may benefit from an external Human–Machine Interface (eHMI) displaying information to surrounding traffic participants. This paper introduces a natural methodology to compare eHMI concepts from a pedestrian’s viewpoint. To measure eHMI effects on traffic flow, previous video-based studies instructed participants to indicate their crossing decision with interfering data collection devices, such as pressing a button or slider. We developed a quantifiable concept that allows participants to naturally step off a sidewalk to cross the street. Hidden force-sensitive resistor sensors recorded their crossing onset time (COT) in response to real-life videos of approaching vehicles in an immersive crosswalk simulation environment. We validated our method with an initial study of N = 34 pedestrians by showing (1) that it is able to detect significant eHMI effects on COT as well as subjective measures of perceived safety and user experience. The approach is further validated by (2) replicating the findings of a test track study and (3) participants’ reports that it felt natural to take a step forward to indicate their street crossing decision. We discuss the benefits and limitations of our method with regard to related approaches.

1. Introduction

Highly (SAE Level 4) and fully (SAE Level 5) automated vehicles no longer require a driver [1]. With self-driving vehicles (SDVs) and human road users sharing the road, a “mixed traffic” transition period will emerge, demanding pedestrians interact with both SDVs and conventional vehicles (CVs) [2]. The related complexity could negatively affect pedestrian safety [2]. In today’s traffic, pedestrians rely on a set of elaborate communication strategies when a CV approaches to decide whether it is safe to cross, including vehicle speed [3,4,5], distance of the vehicle [6], and eye contact with the driver [5,7]. While pedestrians can rely on traffic lights at signalized crossings, right of way can be ambiguous at unsignalized crossings, where human drivers frequently fail to yield to pedestrians. As a consequence, pedestrians are more risk-averse and seek more eye contact with the driver at unsignalized crossings [8,9]. As a substitute to communicating with a human driver, equipping SDVs with an external Human–Machine Interface (eHMI) has been proposed, to provide information to surrounding traffic participants [10]. An eHMI may be particularly important to reduce pedestrians’ uncertainty at ambiguous crossings [11]. Preceding studies showed that pedestrians feel uncomfortable when encountering a driverless vehicle [12,13,14]. Limiting the scope to pedestrians’ crossing decisions, previous research shows that the presence of an eHMI has positive effects on perceived safety [12,13,15,16,17,18], calmness [18], trust [12], comfort [19,20], user experience [12], and crossing decisions [13,17,21,22,23]. It can be argued that the necessity of an eHMI is demonstrated, but the type of information and means of conveying this information need to be further examined to reach the goal of a standardized eHMI. While subjective measures such as pedestrians’ perceived safety can be assessed with a questionnaire after each trial (e.g. [12,13,24]), the assessment of eHMIs’ effect on traffic flow poses a challenge. Traffic flow is an objective measure that can be quantified. The sooner a pedestrian initiates street crossing, the less time s/he has to wait on the curb and the less time a quickly approaching vehicle has to remain stopped, resulting in faster traffic for both the pedestrian and the approaching vehicle. In addition, to the improved time efficiency associated with a smooth flow of traffic, there are also environmental benefits such as decreased emissions and fuel consumption [25].
In the following, we will give an overview of the preceding applied methods to measure pedestrians’ street crossing decision. Then, we will explain the motivation for our method.

1.1. Previously Applied Research Methods to Capture Pedestrian Crossing Decisions

In the following, we provide an overview of methodologies applied in preceding studies to capture pedestrians’ street crossing decisions, discussing their benefits and limitations.
One approach is to capture the decision-making process of street crossing in terms of a function of the distance between the pedestrian and the approaching vehicle (e.g., [26,27,28]). For example, in a field study by Walker et al. [26], participants were instructed to express their feeling of safety to cross the road at any moment of time between 0 (“not at all willing to cross”) to 100 (“totally willing to cross”) on an input device that they hold in their hand while a vehicle approaches. While this approach is promising to form a better understanding of the underlying factors influencing a street crossing decision, we believe that it is not suitable to capture traffic flow. Pedestrians’ street crossing is an actual behavior that has a binary character—either a pedestrian is waiting on the curb or crosses the street. Thus, traffic flow cannot be measured on a continuous scale.
A further approach is to measure the binary crossing decision (yes/no), i.e., whether pedestrians would be willing to cross the street in front of an approaching vehicle (e.g., [15,24,29,30]). For example, Song et al. [15] conducted an online survey in which pedestrians watched videos of a vehicle approaching from an ego-perspective and had to decide after each trial whether they want to cross (pressing the space key) or let the vehicle pass (not pressing the space key). We argue that this approach does not give any indication regarding traffic flow, since it fails to produce a relationship with the point of time participants would initiate street crossing.
Another approach is to compute crossing onset time (COT) by capturing the time a pedestrian decides to cross in relation to the vehicle’s action. We argue that this is the only approach that can draw conclusions about eHMI effects on traffic flow. Regarding COT, the preceding methods can be divided into unnatural approaches, requiring participants to indicate their decision to cross in an explicit manner via pressing a button [11,17,22,23] or raising their hand [31], and natural approaches which allow participants to indicate their decision to cross with the actual behavior of taking a step forward [12,21,32,33]. We believe that methods requiring participants to imagine how they would act or feel make their decision explicit, which might limit their validity. We argue that, in terms of ecological validity, the natural behavior of stepping forward constitutes the best approach to measure COT. For example, in a test track study by Faas et al. [12], pedestrians watched an approaching vehicle coming to a stop at an intersection and had to cross the street as soon as they felt safe to do so. The vehicle encounters were video recorded for later analysis to estimate the time gap between the vehicle coming to a stop and the pedestrians’ COT. Street crossing can be seen as an unreflective skillful action [34]. When crossing a street, pedestrians often act adequately, yet without deliberation. Street-crossing decisions are not guided by explicit reasoning, but constitute a form of embodied intelligence or cognition. Bodily processes or so-called “gut-feelings” might be of enormous importance for street crossing decision making [35]. It can be argued that pedestrians make their decision to cross unconsciously as soon as they feel that it is safe to cross, which is usually as soon as they are sure that the vehicle intends to yield for them. Their embodied nature makes individuals’ street crossing decisions sensitive to aspects of the situation [34], such as the presence of a visible driver or an eHMI. However, to date, only a few test track studies [12,33] and VR studies [21,32] have assessed COT by allowing pedestrians to take a step forward.

1.2. Proposed Concept to Capture Street Crossing Onset Time (COT)

In this paper, we propose a parsimonious, safe, and reproducible paradigm for video-based lab studies that can capture COT in a natural way to test the efficacy of eHMI concepts for SDV and pedestrian interaction. We present a method in which participants indicate their COT by actually stepping off a “sidewalk” onto a “crosswalk”. We conducted the experiment in a lab environment where participants were immersed using two large TV screens for a panoramic street view. With adhesive tape, we sketched a sidewalk and a crosswalk onto the floor. Under the sidewalk, we hid two force-sensitive sensors to capture COT. When the participant stepped onto the sidewalk, the videos were triggered and the COT timer was started. The COT was recorded when the participant stepped off the sidewalk to enter the crosswalk, with force-sensitive resistor sensors making data analysis time-efficient.
For the experiment, we contrasted three eHMI variants (no eHMI, status eHMI, status+intent eHMI) to address the research question of which information an eHMI should communicate. We used two light-based eHMI concepts adapted from Faas et al. [12]. The status eHMI is a steady blue-green light indicating the automated driving mode, as recommended by the SAE [36]. For the status+intent eHMI, an additional slowly flashing blue-green light (adapted from [37]) indicated the SDV’s intent to yield as soon as the vehicle was braking, thus resembling the frontal brake light concept of previous eHMI studies [13,18,24,38]. We put the encounters with a driverless SDV in relation to encounters with a CV steered by a driver. We conducted three measuring points to study the stability of eHMI effects. The results of the study are published in Faas et al. [39]. The study showed that pedestrians benefit from an eHMI communicating SDVs’ status, and that additionally communicating SDVs’ intent adds further value. These eHMI effects last (acceptance, user experience) or even increase (COT, perceived safety, trust, learnability, reliance) with time.
The present paper focuses on the description and validation of the applied research method. For the present paper, we specifically re-evaluated the data of the first measuring time of the longitudinal study of Faas et al. [39], since we argue that our method is able to compare the efficacy of eHMI variants with one measuring time only. Furthermore, the present paper includes additional procedures that were not reported in Faas et al. [39] to validate the applied research method. To this end, we compared participants’ responses in the lab study of Faas et al. [39] with participants’ responses in the test track study of Faas et al. [12] to investigate potential differences attributed to the applied experimental methodology. Additionally, we analyzed participants’ self-reported naturalism in the study setup. In this paper, we provide a detailed description of our method to allow others to adopt it. We validate our method by showing that it is able to detect significant eHMI effects on COT (and thus traffic flow) and subjective measures of perceived safety and user experience. Our approach is further validated by replicating findings of a test track study. Finally, participants reported that it felt natural to take a step forward to indicate that they would cross the street. We conclude that our paradigm allows relative comparisons of eHMI variants.

2. Materials and Methods

2.1. Participants

Thirty-four pedestrians (19 male, 15 female) in the age range of 22 to 69 years (M = 41.5, SD = 15.8 years) took part in the study. A third-party agency recruited the participants. For screening, potential participants specified which modes of transportation they use during a typical work week by distributing the percentage out of 100% among driving, public transit, biking, walking, and other. Those, who distributed at least 20% to walking, received an invitation to participate in the study. All participants were living in the San Francisco Bay Area, CA, USA. All subjects gave their informed consent for inclusion before they participated in the study. The study was conducted in accordance with the Declaration of Helsinki, and the protocol was approved by the RD Ethical Clearing Committee of Daimler AG.

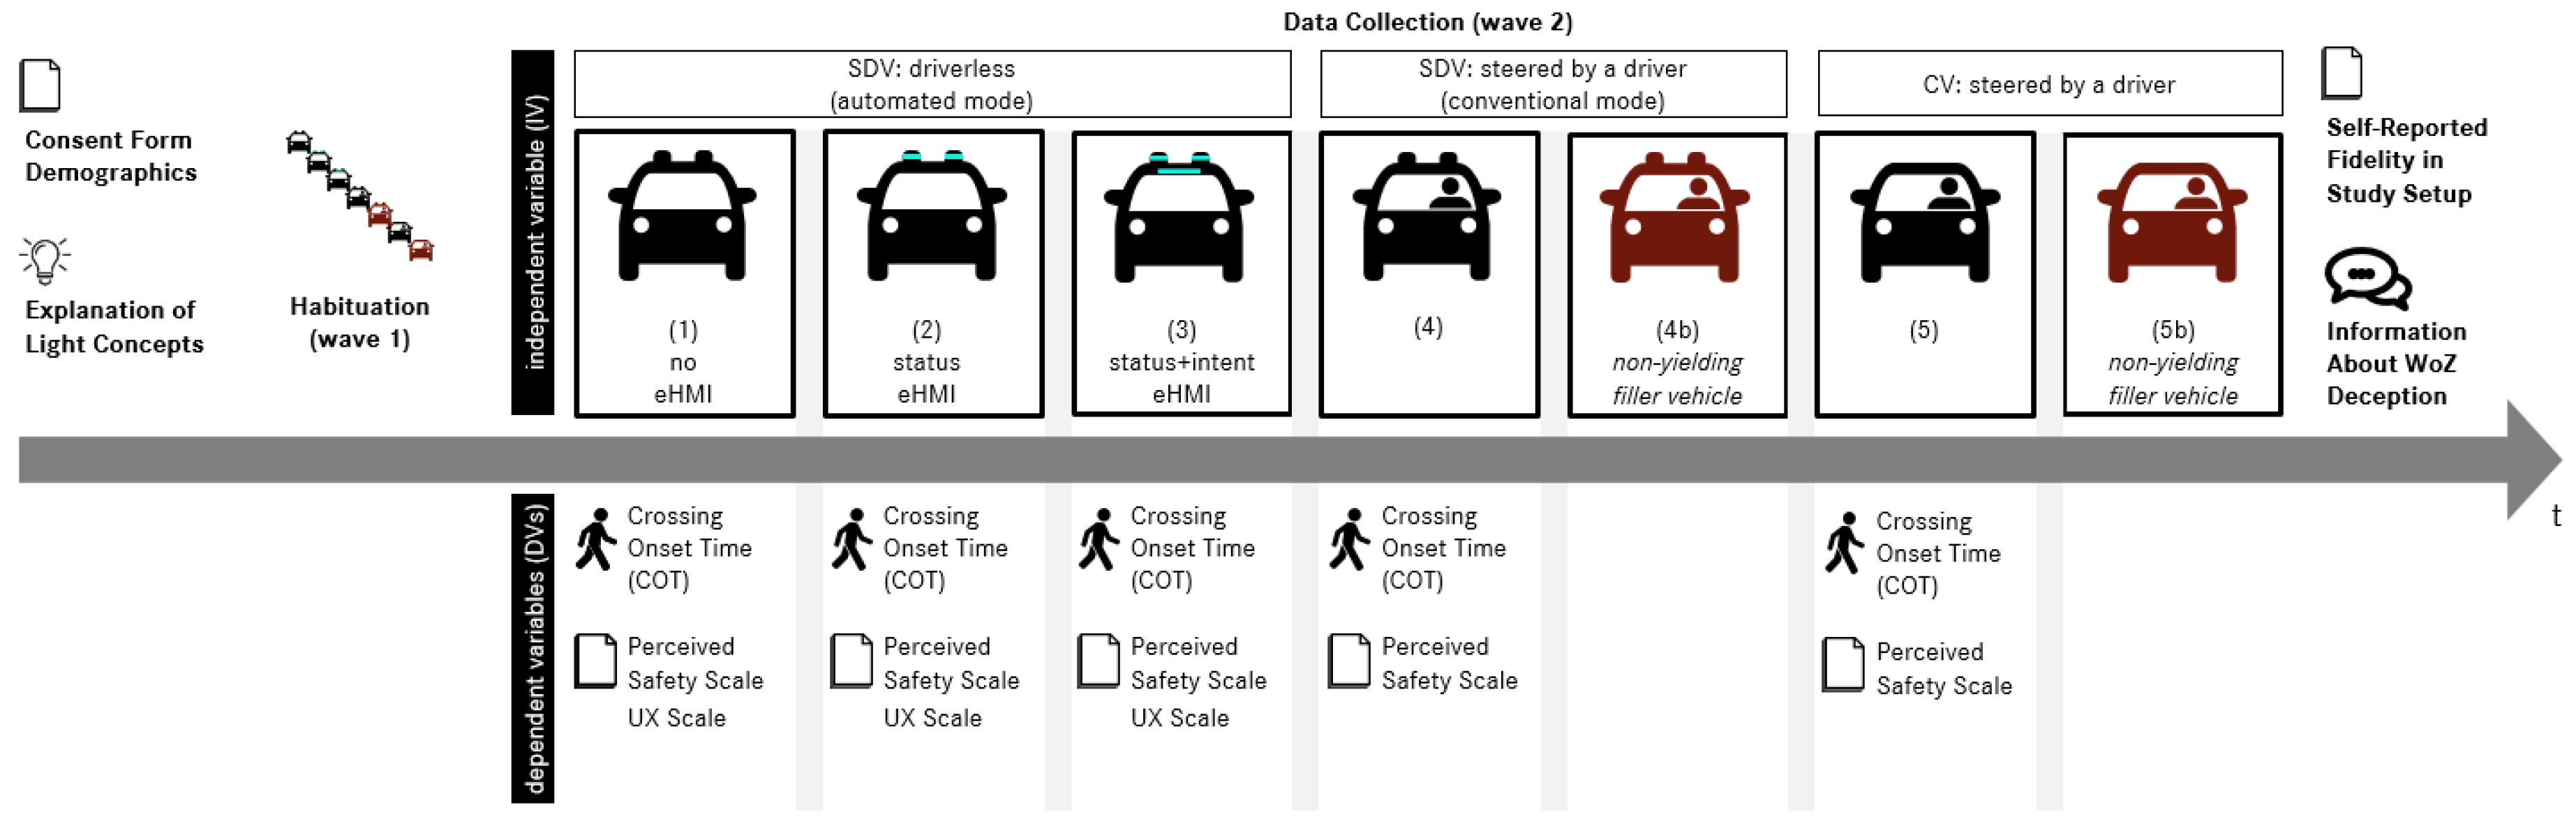
2.2. Independent Variable

Figure 1 gives an overview of the study procedure, including the independent variable, that is, vehicle type.
Three eHMI test conditions were contrasted without a driver, i.e., self-driving (Figure 2):
1.
Driverless SDV without eHMI: there is no indication whether the vehicle is in automated mode, i.e., self-driving, or conventional mode, i.e., steered by a driver;
2.
Driverless SDV with status eHMI: steadily emitting blue-green lights on each fake Lidar sensor indicates that the vehicle is in automated mode. The design follows the recommended practice of the SAE [36];
3.
Driverless SDV with status+intent eHMI: additionally to the “status” message, the “intent” signal was turned on when the approaching car started to brake, thus resembling the frontal brake light concept of previous eHMI studies [13,18,24,38]. To communicate the SDV’s intent to yield, a light above the windshield flashed with a frequency at 0.5 Hz and a sinus cycle from 30% to 100% light intensity. The design follows the recommendation of Faas et al. [37]. The video of the status+intent eHMI test condition is available through the link: https://0-dl-acm-org.brum.beds.ac.uk/doi/fullHtml/10.1145/3313831.3376484.
The driverless SDV was shown to always yield to pedestrians. We chose a driverless setup to resemble a future automated vehicle on its way to pick up a passenger. Furthermore, to realize a mixed traffic environment, we incorporated encounters with vehicles steered by a visible driver. The human-driven vehicles (Figure 3) were either yielding (test conditions 4, 5) or non-yielding (filler test conditions 4b, 5b):
4
SDV steered by a driver: yielding;
4b.
SDV steered by a driver: non-yielding (filler test condition);
5.
CV steered by a driver: yielding;
5b.
CV steered by a driver: non-yielding (filler test condition).
This study was designed to examine participants’ responses when the car was yielding. Thus, the responses to the non-yielding vehicles were not analyzed (test conditions 4b, 5b). The non-yielding vehicles were included to ensure that participants would not habituate to all cars stopping for them, which might lower their attention and COT. We deliberately chose not to include any non-yielding driverless SDV encounters. While it can be argued that human drivers differ in their driving style, vehicle automation is programmed to adhere to traffic laws, thus always yielding at a pedestrian crossing.

2.3. Materials and Equipment

The experiment took place at the lab facilities of Mercedes-Benz Research and Development North America in Sunnyvale, CA, USA. We immersed participants with two large TV screens (25.5 inches (width) by 44 inches (length)) displaying the real-life video clips. The TV screens were set up at an angle of 60 degree to create a panoramic view. With adhesive tape and a mat, we sketched a “sidewalk” and a “crosswalk” onto the floor (Figure 4). Under the “sidewalk”, we fixated two force-sensitive resistor sensors with the dimensions 44.45 × 44.45 nm (1.75 × 1.75 in). On the “sidewalk”, we sketched two footprints at the same level as the force-sensitive resistor sensors. An Arduino Uno analog-to-digital converter was used to read the variable resistance of the force-sensitive resistor sensors. A 1k resistor was used to create a voltage divider. The software Arduino IDE (version 1.8.9) was used to code the data. A timer was added to display the elapsed time. When participants stepped onto the footprints (respectively putting force on each sensor), the COT timer started and the video clips were triggered starting with a three-second countdown. To provoke natural behavior, the participants’ task was to cross the street when they felt safe to do so by entering the “crosswalk”. When participants stepped off the “sidewalk” (respectively removing force on either sensor), the COT timer stopped.
For the real-life videos with the SDV, we created a Wizard-of-Oz setup [40]. On the roof of a silver Mercedes-Benz S-Class (Series W222), we mounted fake Lidar sensors similar to those of SDVs currently test-driving on public roads (e.g., [41,42]) as a reminder of the vehicle’s ability to drive automated (see [43]). On the fake sensors, we attached LED light stripes to simulate the eHMIs. To create the deception of a driverless vehicle (test conditions 1, 2, 3), the driver controlling the vehicle wore a seat costume (adapted from [14]). For the videos in conventional driving mode (test conditions 4, 4b), the driver steering the vehicle was visible. For the videos with the CV and a visible driver (test conditions 5, 5b), we used three silver sedan models, namely a Chevrolet Impala, a Dodge Charger, and a Kia Optima. The occurrence of these models was randomized. All videos were cropped to a length of 15 s. Five observers who were not associated with the study checked the videos to ensure that they all displayed the same driving behavior.

2.4. Real-World Video Clips

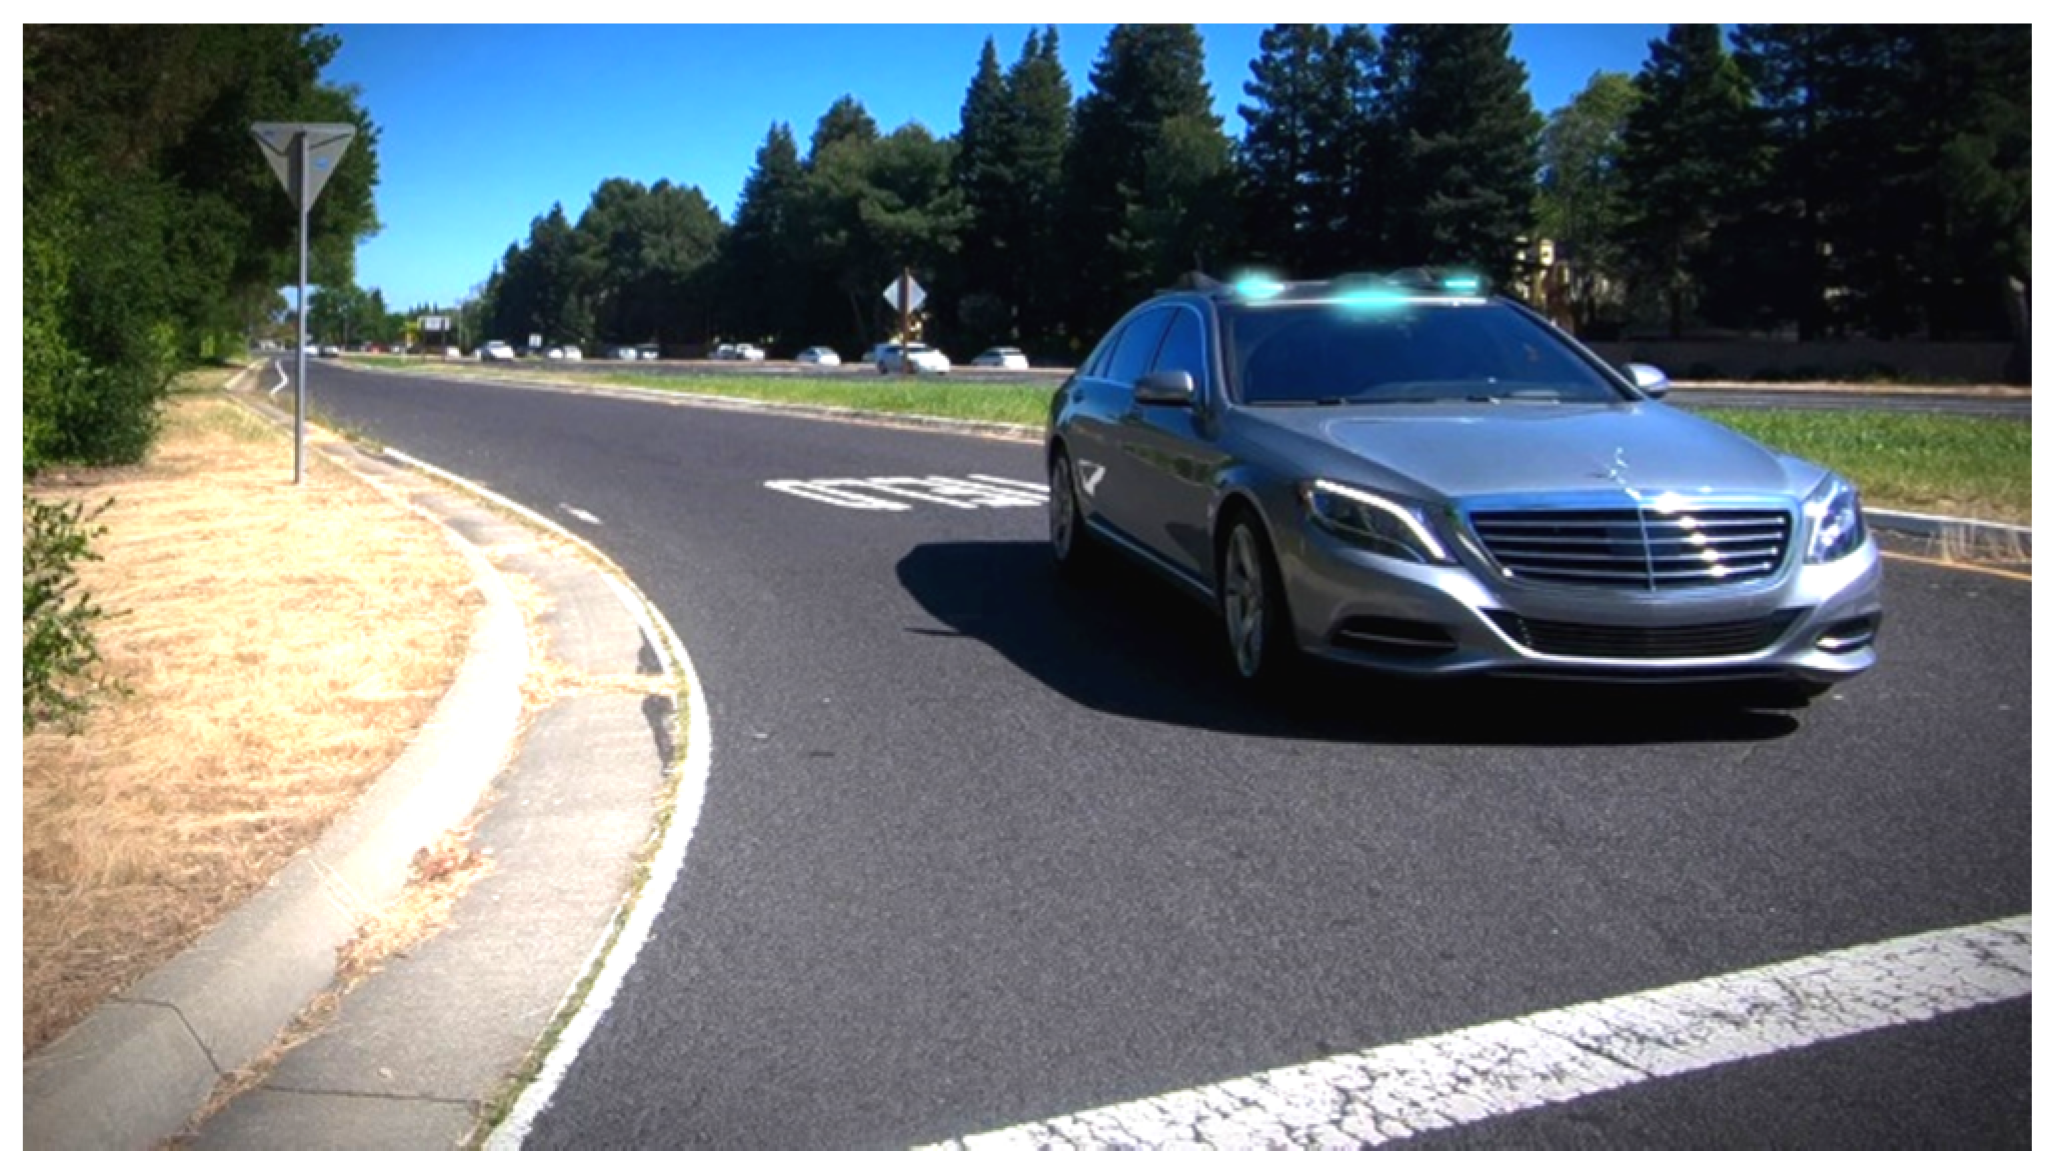
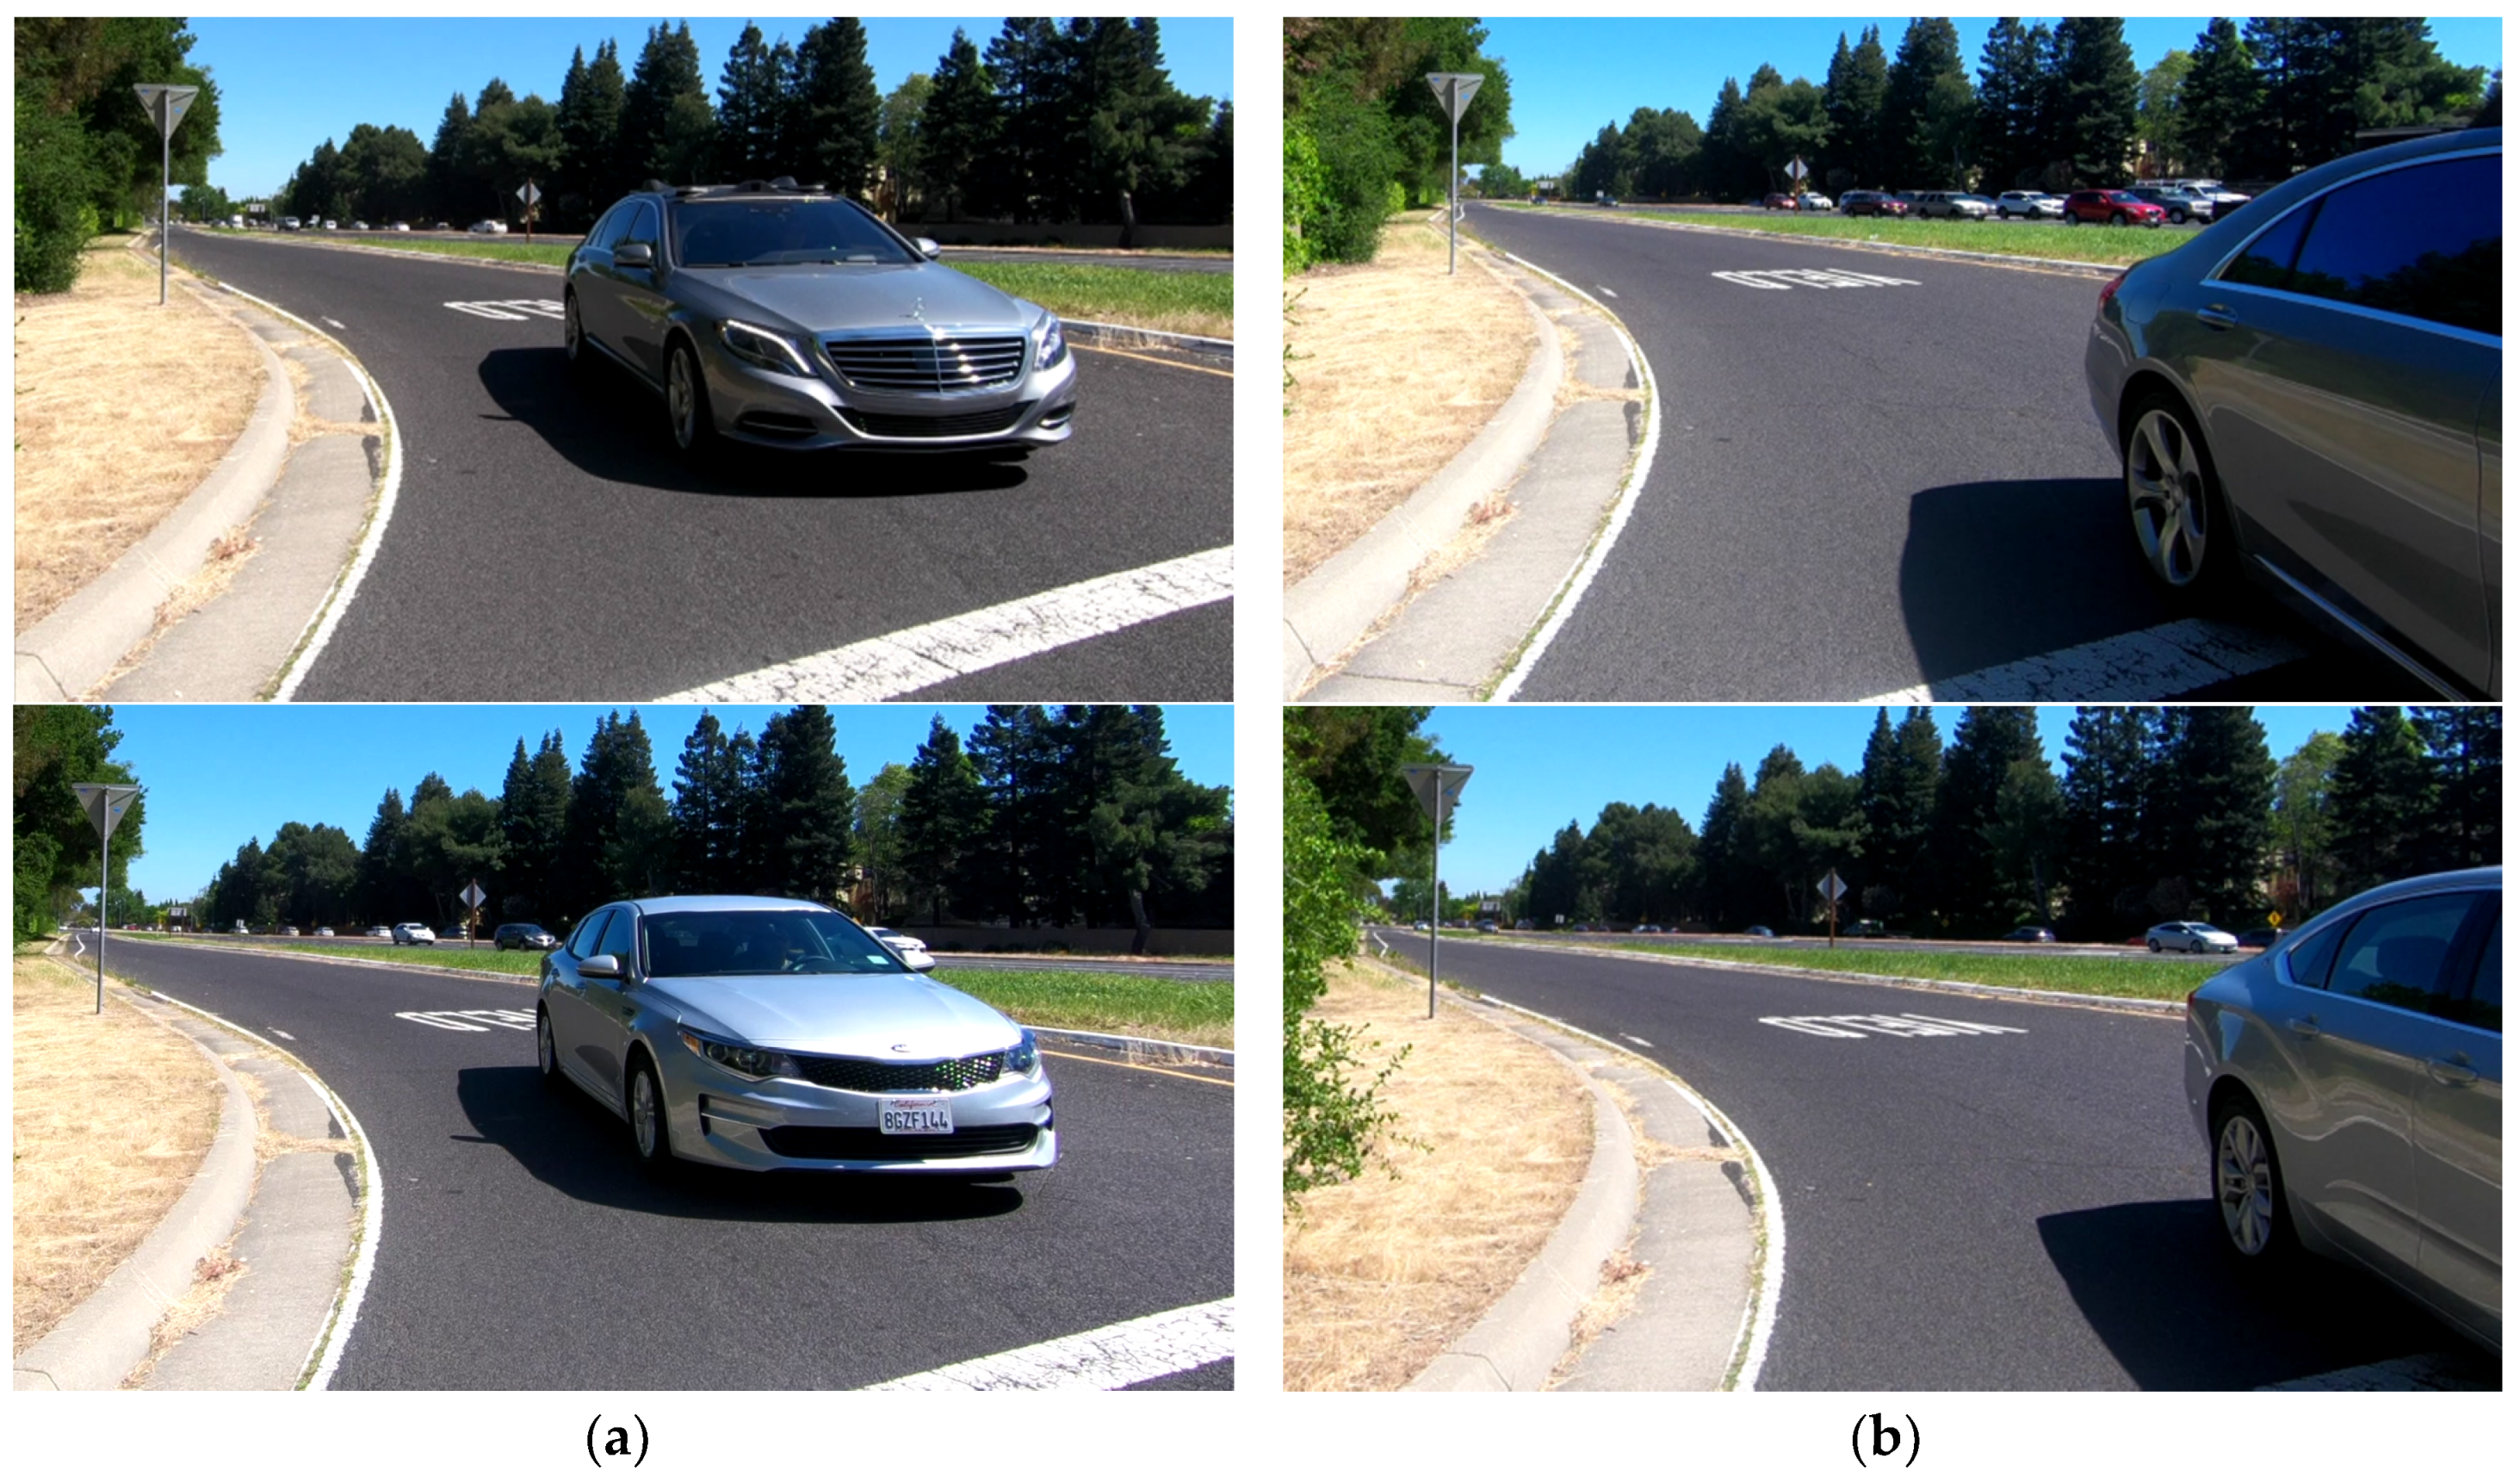
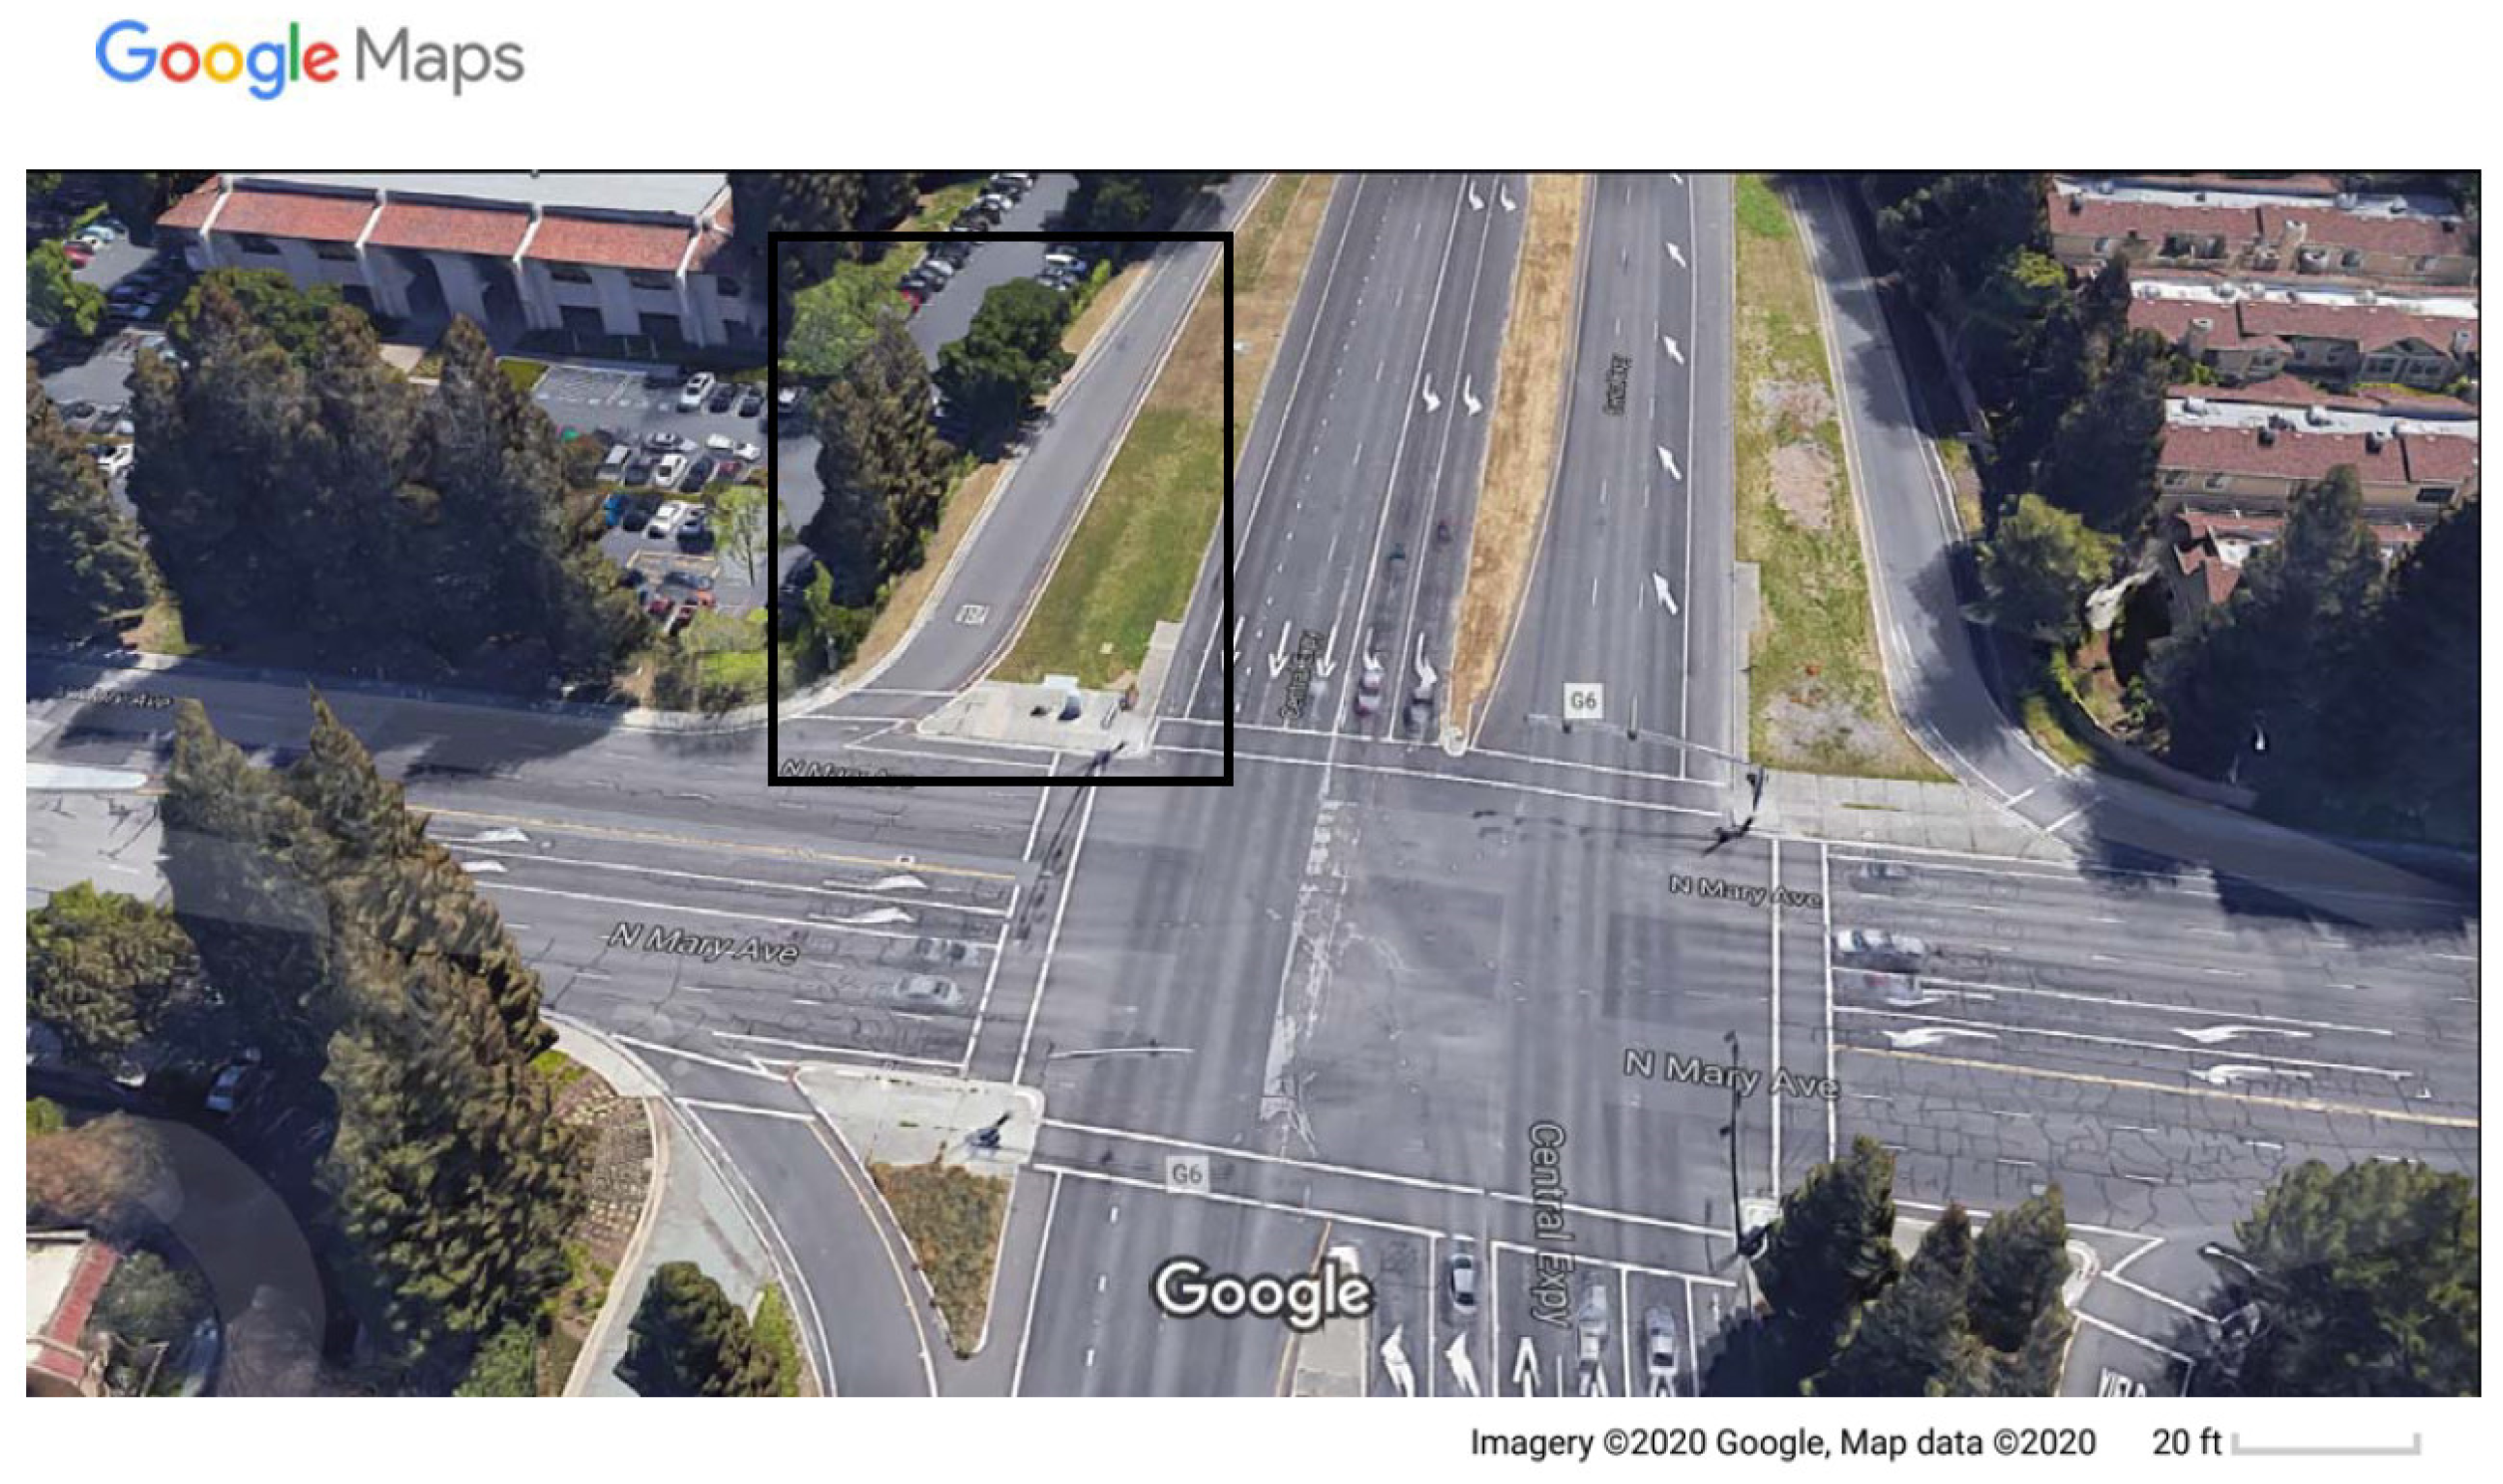
2.4.1. Real-World Crossing Scenario

For the traffic scenario, we chose an intersection that requires pedestrians to cross an expressway exit lane while a vehicle approaches. The crossing has no traffic lights, but the request “YIELD” is written onto the street. In a preceding workshop, this traffic scenario was identified to be ambiguous for pedestrians. Workshop participants reported that, while the law states designated priority to pedestrians, the norm is that some approaching vehicles do not stop. In ambiguous traffic scenarios, communication strategies with the driver become especially prominent [9].
The video clips were recorded on a sunny day on a public highway. The camera perspective was from the viewpoint of a pedestrian standing on the sidewalk waiting to cross the road (see Figure 2 and Figure 3). Specifically, the approaching vehicle was exiting Central Expressway to enter North Mary Avenue in Sunnyvale, CA, USA. Figure 5 shows the traffic scenario from a bird’s eye-view.

2.4.2. Video Flow

The experiment employed seven test conditions with yielding (test conditions 1, 2, 3, 4, 5) and non-yielding (test conditions 4b, 5b) vehicles in a within-subjects test design. Test conditions were randomized according to a Latin Square. Table 1 shows an overview of the video flow. The left TV screen showed the street with the approaching vehicles and the right screen showed the crosswalk. To allow time for participants to focus their attention back to the TV screens, each test condition started with a 3 s countdown on the left screen. Then, the video of the corresponding test condition was triggered. In each video, a vehicle approaches with a constant speed of 25 mph.
For the yielding videos (test conditions 1, 2, 3, 4, 5), the vehicle approached with a constant speed for 3 s, decelerated to come to a stop at the intersection for 8 s, and waited for the pedestrian to cross for 4 s. After participants stepped off the “sidewalk”, we provided visual feedback on their crossing decision through a street crossing video from an ego perspective on the right screen. On the left screen, the vehicle was waiting for the pedestrian to cross.
For the non-yielding videos (test conditions 4b, 5b), the vehicle slightly decelerated to make a right turn, but did not yield to the pedestrian. If participants succeeded by waiting for the car to pass to enter the street, a video was triggered on the right screen showing a street crossing from an ego perspective, while on the left screen the road was empty. If participants entered the crosswalk while the vehicle was still approaching, a red screen with the message “not safe to cross!” (left screen) and a video of a passing car (right screen) was triggered. In this case, the test condition was repeated.

2.5. Procedure and Participants’ Task

Prior to the experiment, participants provided written informed consent. Participants completed a demographic questionnaire. Then, participants were introduced with the definition of high driving automation (SAE Level 4). Participants were told that the SDV they will encounter “has both an automated and a manual driving mode. The vehicle can thus either be self-driving or be controlled manually by a driver.” Next, the three eHMI concepts were explained to participants. Subsequently, participants’ understanding of the eHMI concepts was tested by asking them “What does the light signal indicate?”
Following, participants were familiarized with the study setup by the experimenter going through the participants’ task. Participants were shown an example scenario with the status+intent eHMI (test condition 3). First, they were asked to imagine that the mat is a “sidewalk”.
Then, namely “The next slide lets you know that at this time, you can step on the sidewalk to begin the scenario. When you step on the sidewalk, please make sure your feet are aligned with the footprints. Once both feet are on these footprints, the scenario will begin.” Participants were told that in each scenario a vehicle will be approaching, but not all vehicles are going to yield. The participants’ task was “to safely cross the road at an intersection as a pedestrian while different vehicles approach. As soon as you feel safe to cross, please do so. You must cross for all scenarios. To cross, just step off the sidewalk as if you’re going to enter the crosswalk.” Thus, with each trial, participants indicated their COT by stepping of the “sidewalk” to enter the “crosswalk” (see Table 1). The field of view was panoramic in the way that pedestrian had to bend their head to the left to observe the approaching vehicle and step forward to initiate street crossing.
Subsequently, the room’s light was dimmed to allow a better contrast for the participant to see the contents of the TV screens clearly. Participants encountered two waves consisting of seven trials, each with vehicles that yielded to the pedestrian in five trials (test conditions 1, 2, 3, 4, 5) and non-yielding vehicles in two trials (test conditions 4b, 5b). Participants experienced one wave for habituation. After habituation, the second wave followed for data acquisition. We assessed participants’ COTs and subjective measures for all yielding vehicle trials. The crossing onset data were recorded by an Arduino Uno. After each trial, participants filled in a questionnaire to indicate subjective measures of perceived safety and user experience (see Figure 1).
After all trials, participants were asked to rate the naturalism of our paradigm. We informed participants that the encountered vehicle had not been driving automated at any time. Total testing time was about 30 min per participant.

2.6. Dependent Variables

In this paper, we report the following objective measure:
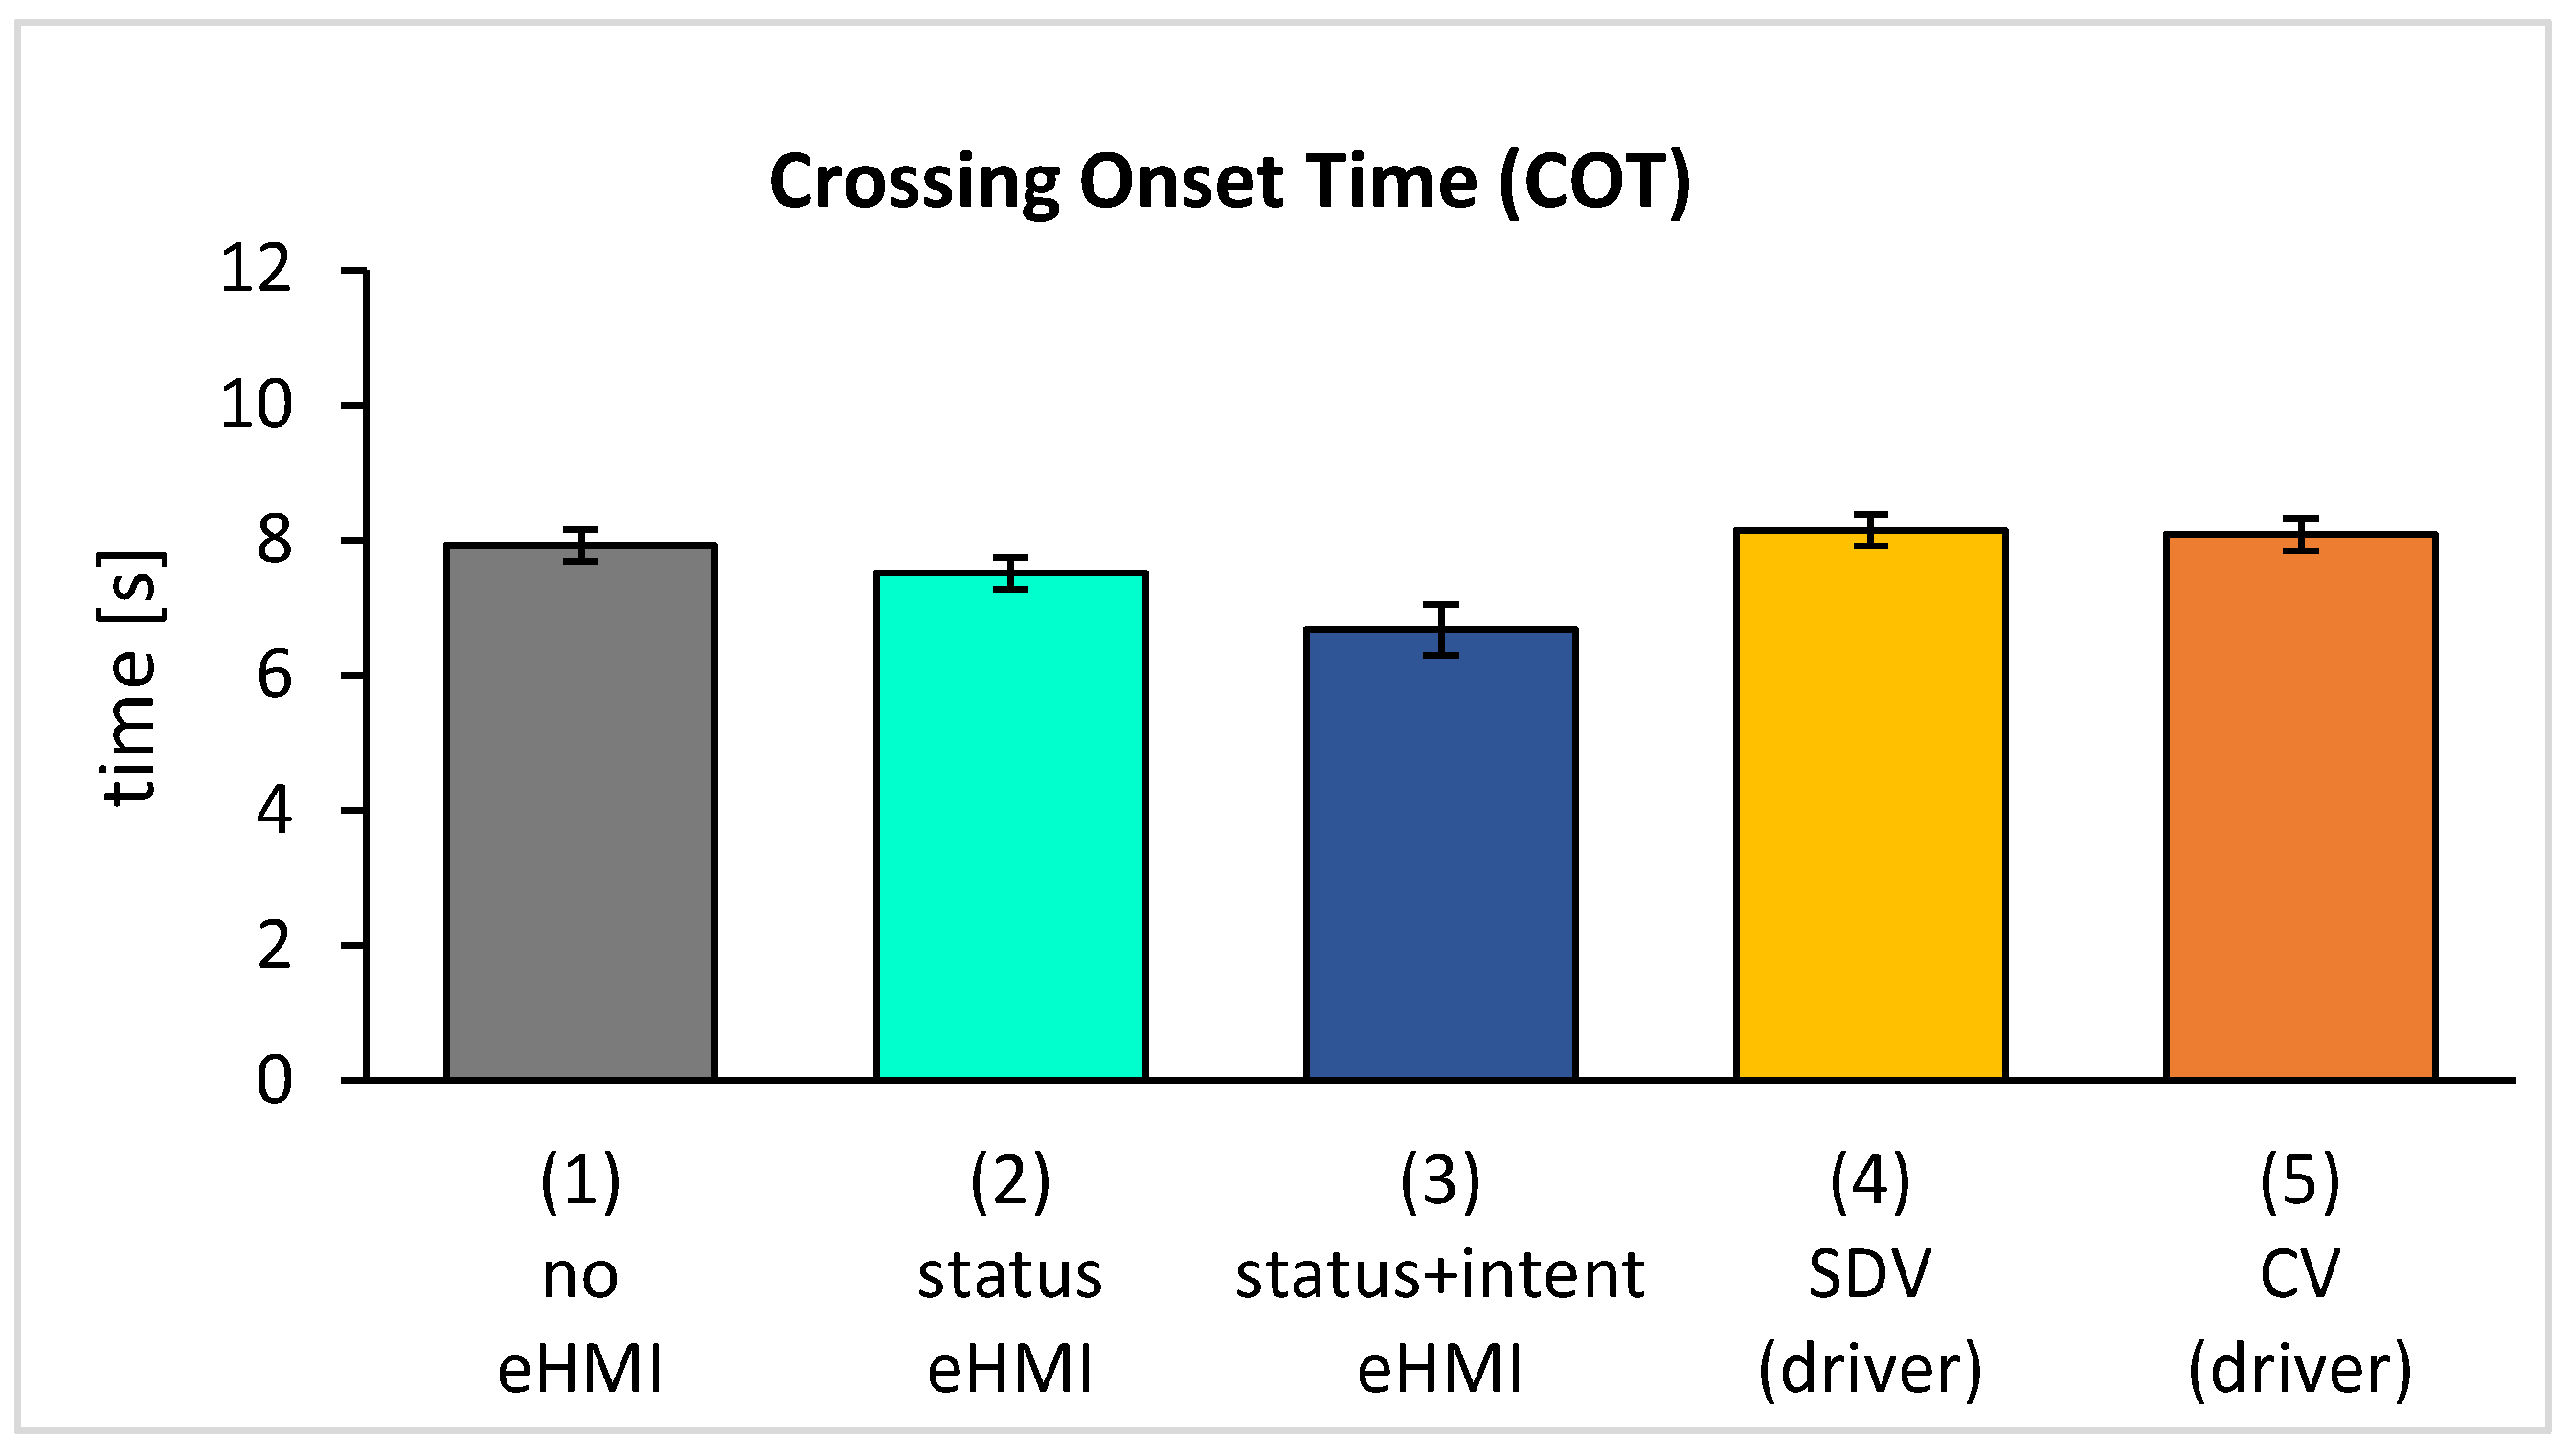
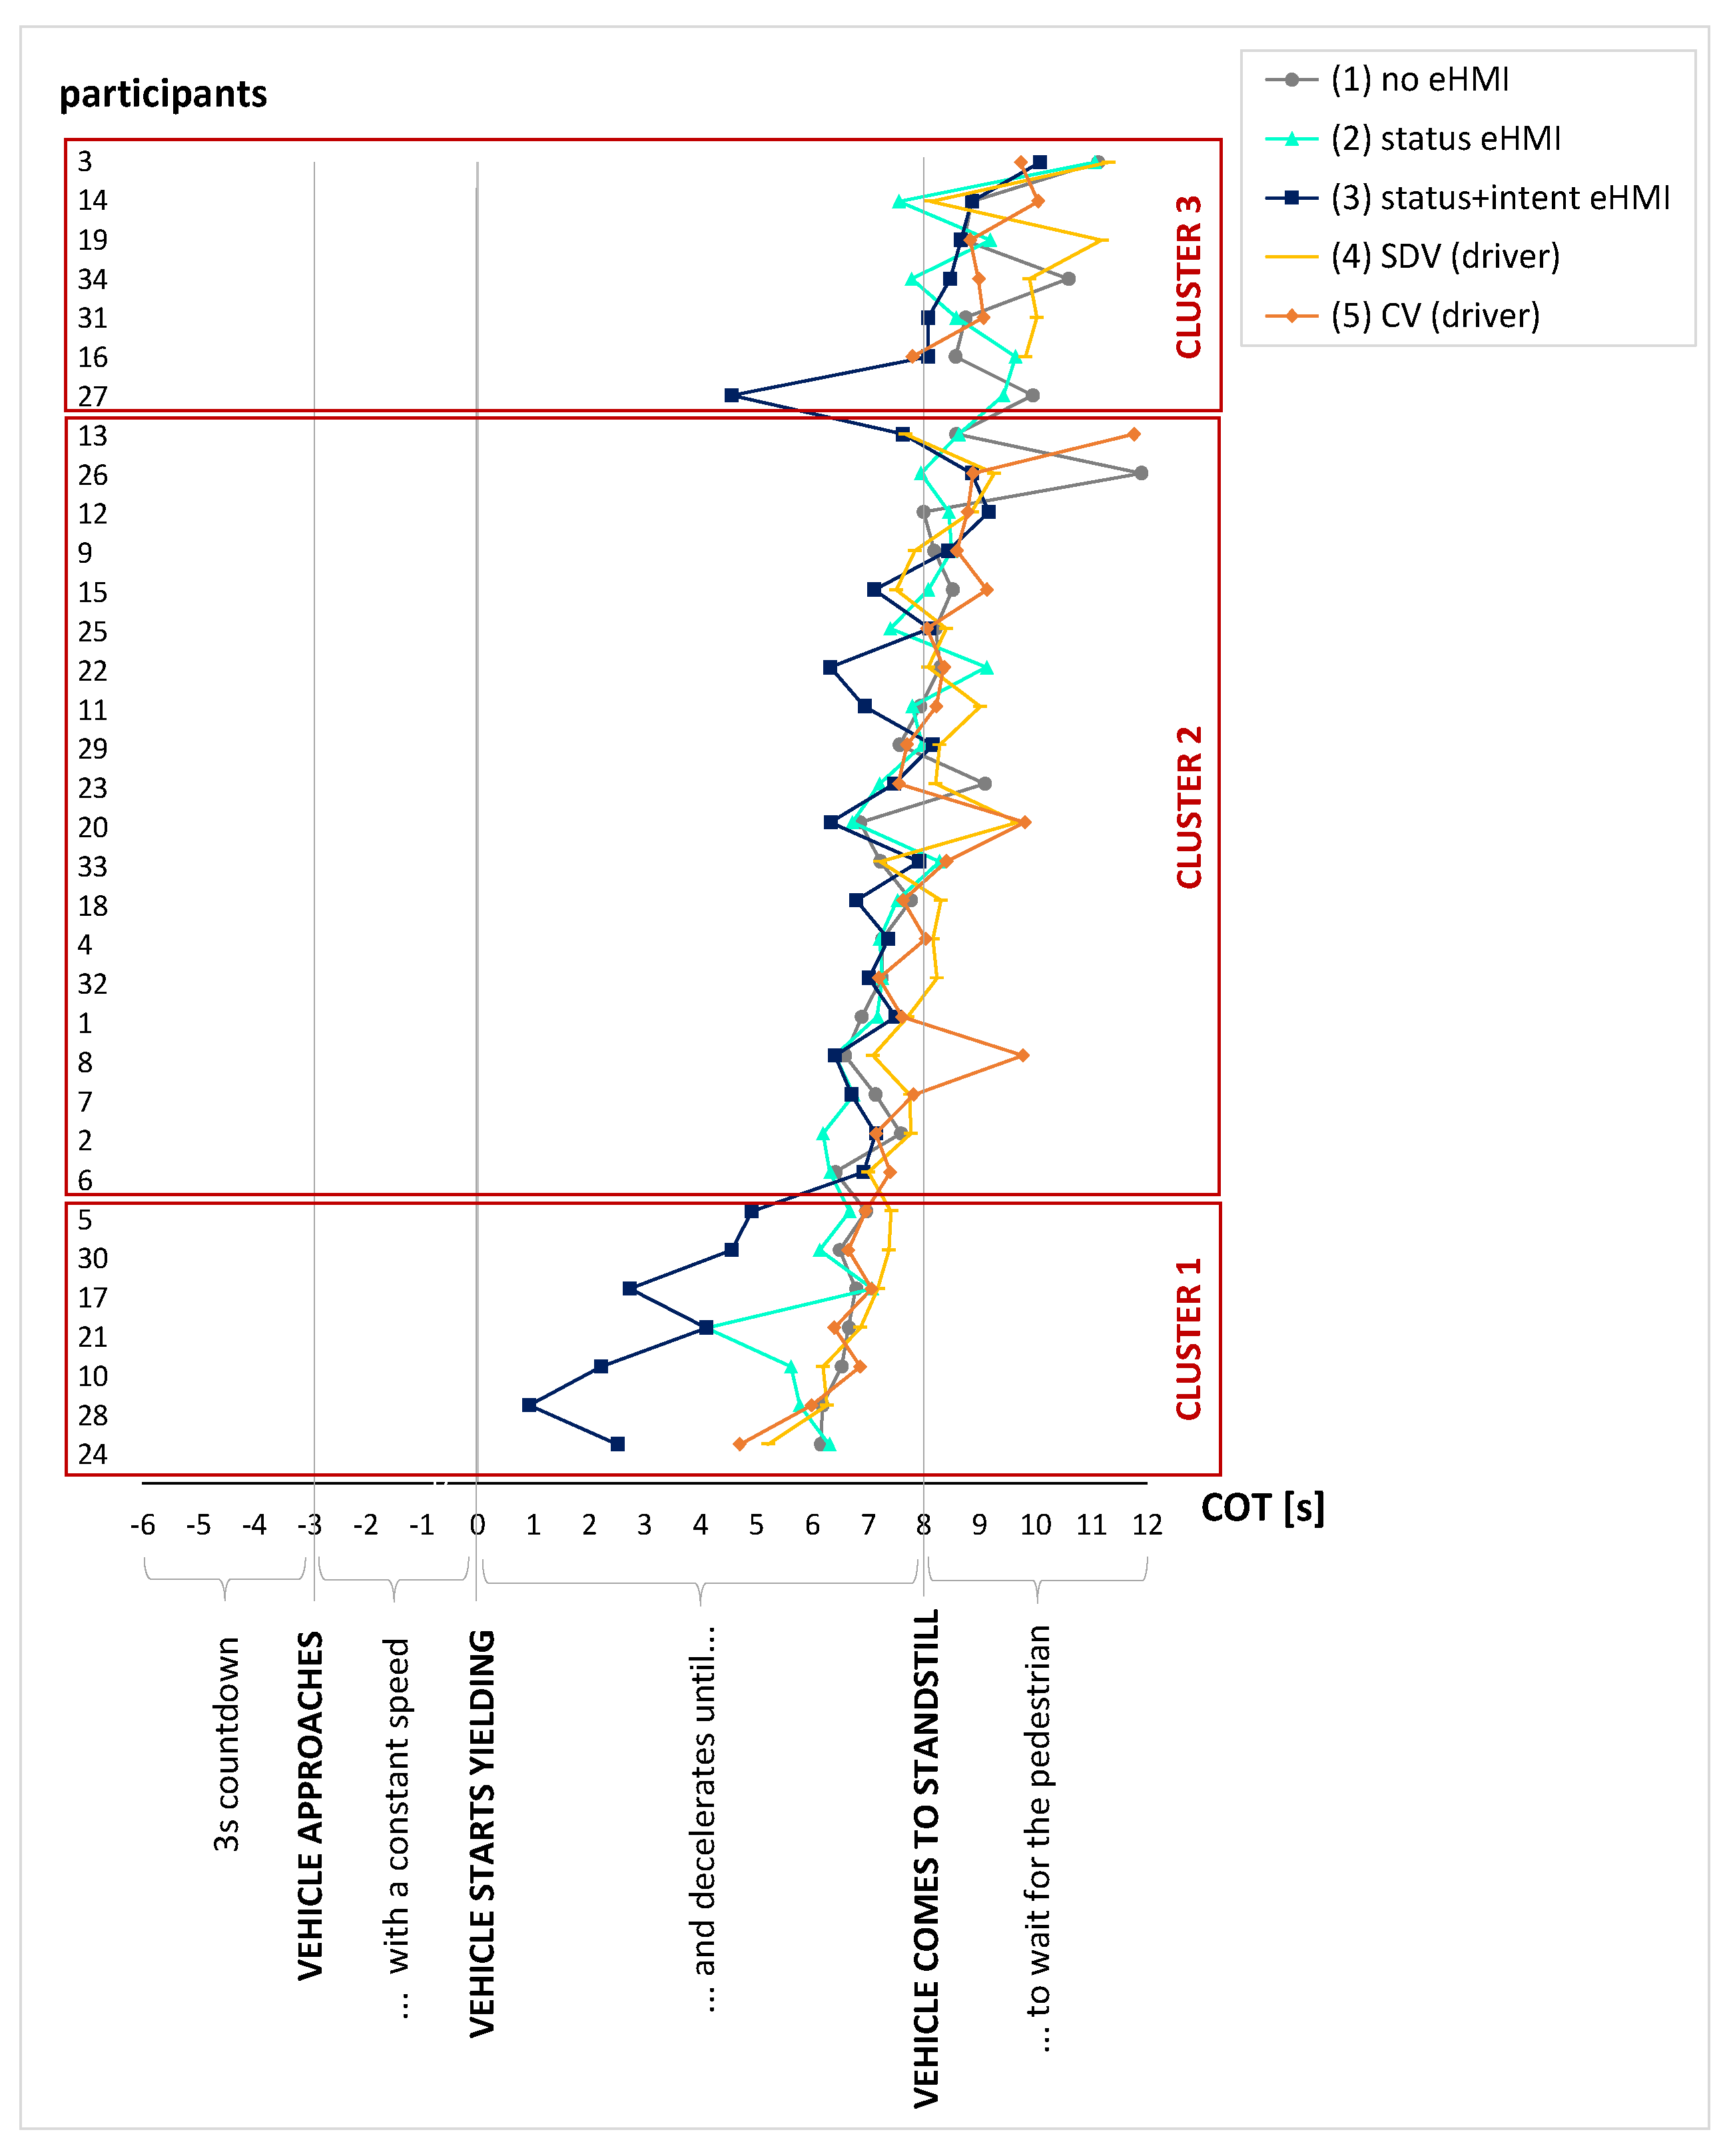
  • Crossing Onset Time (COT): After each yielding vehicle trial (test conditions 1, 2, 3, 4, 5), we determined COT. COT indicates the time in seconds between the vehicle yielding and the pedestrian stepping off the “sidewalk”. Hence, to calculate the COT, we have subtracted the time between the pedestrian entering the “sidewalk” and the vehicle yielding (3s countdown + 3s vehicle approaching at constant speed). We used COT as an index of traffic flow. Shorter times indicate an earlier crossing decision. The earlier pedestrians cross when it is safe to do so, the more efficient the traffic flows. We excluded extreme cases from data analysis, defined as more than three times the interquartile range (IQR) greater than the upper or lower quartile (2 values of N = 1 participant excluded).
Furthermore, we report the following subjective measures, all measured on a scale from −3 (very negative) to +3 (very positive):
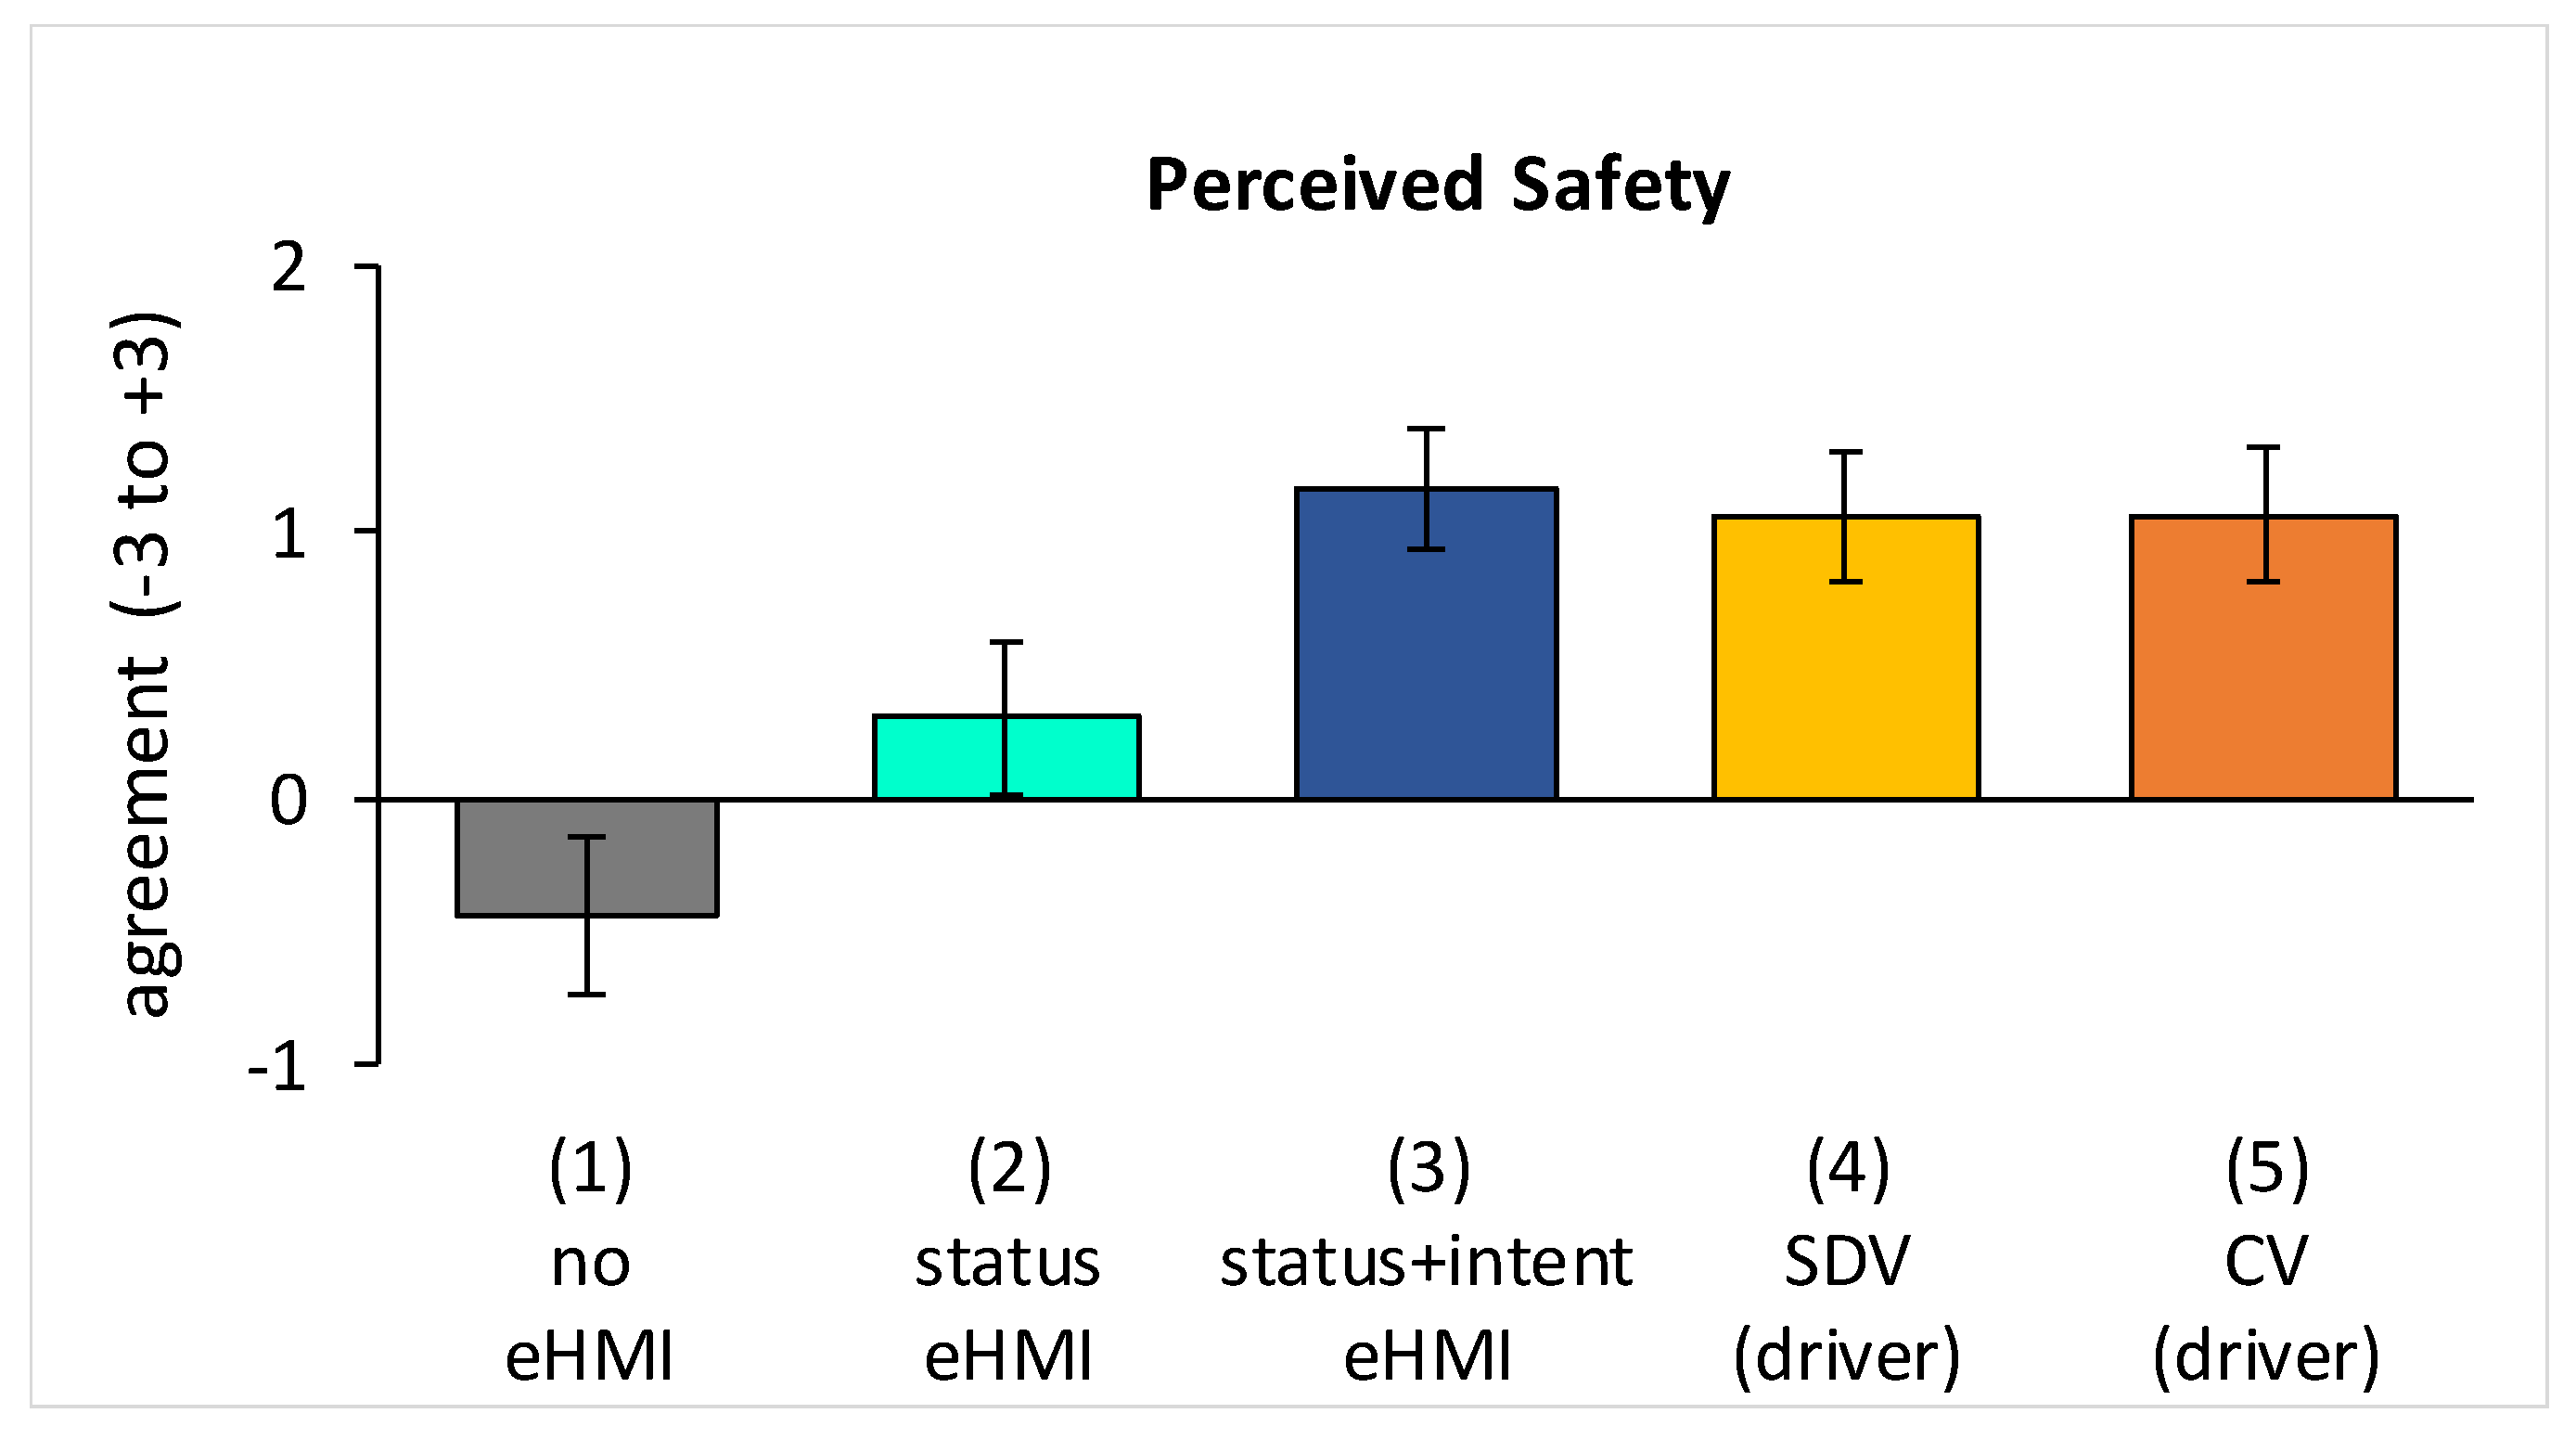
  • Perceived Safety: After each yielding vehicle trial (test conditions 1, 2, 3, 4, 5), participants reported their perceived safety with four items (based on [44]) with semantic differentials answered on a 7-point scale ranging from −3 to +3 (“anxious–relaxed”, “agitated–calm“, “unsafe–safe“, “timid–confident“). Reliability was excellent, with Cronbach’s α = 0.90 to 0.96;
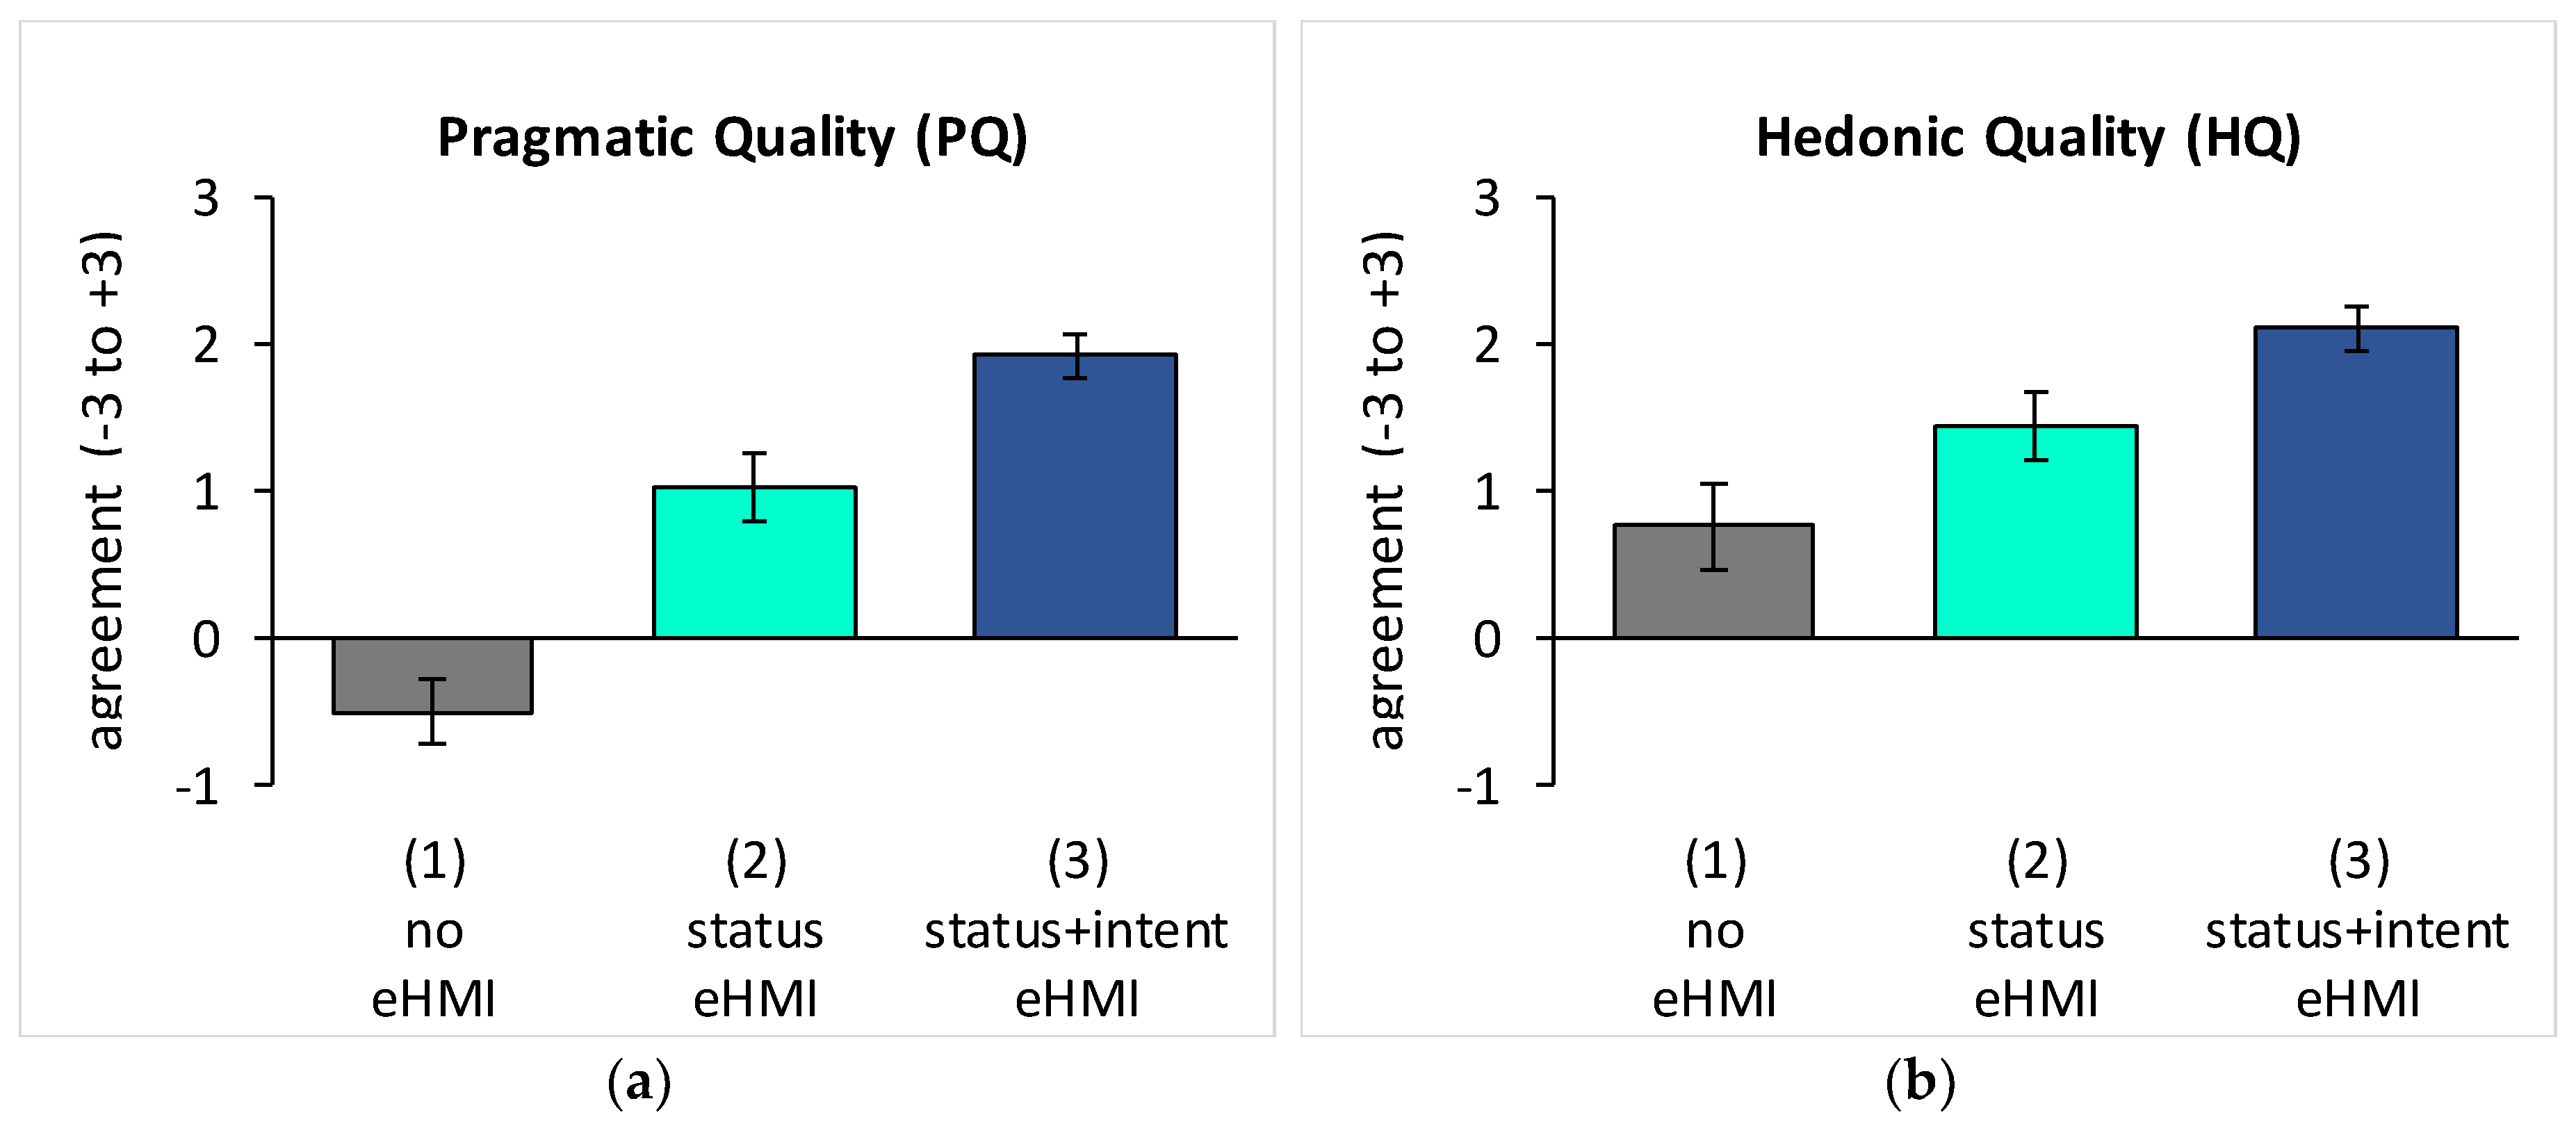
  • User Experience (UX) Qualities: After each driverless SDV trial (test condition 1, 2, 3), participants completed the short version of the User Experience Questionnaire (UEQ-S) [45]. The scale consists of two dimensions: pragmatic quality (PQ) and hedonic quality (HQ). Participants reported their user experience with semantic differentials ranging from −3 (negative) to +3 (positive). The reliability of all subscales was good to excellent, with Cronbach’s α = 0.80 to 0.94;
  • Naturalism: In the post-experiment interview, participants rated the items “How immersive was the study setup?” and “How natural was it to take a step forward to indicate that you would cross the street?” (based on [33]) on a scale from −3 (“not at all”) to +3 (“extremely”).

2.7. Data Analysis

We used repeated measures ANOVAs to test the effect of vehicle type (test conditions 1, 2, 3, 4, 5) on COT and perceived safety. As an additional analysis, we performed cluster analyses to categorize the participating pedestrians into groups according to their COT obtained for each yielding test condition. To classify pedestrians into groups, we used Ward’s method in combination with squared Euclidean distances (see [46,47]). As a hierarchical procedure, the Ward’s method successively merges cases into clusters such that the variance within a cluster is associated with the smallest possible increase (see [46,47]).
Next, we used repeated measures ANOVAs to test the effects of eHMI type (test conditions 1, 2, 3) on UX qualities (HQ and PQ).
Finally, we compared the subjective responses to the PQ scale of our participants and the participants in the test track study of Faas et al. [12] to investigate potential differences attributed to the applied experimental methodology. For this purpose, we used the data of the no eHMI, status eHMI, and status+intent eHMI test conditions that were assessed with N = 30 participants at an intersection traffic scenario on a test track in Immendingen, Germany. We believe that this comparison is valuable, although the experiments differ regarding participants’ nationality (U.S. vs. German) and traffic scenario (exit lane vs. four-way intersection). The study participants of this lab study and the test track study did not differ regarding age, t(57) = −0.37, p = 0.714, or gender, χ2(1) = 0.04, p = 0.838. We chose the PQ scale for the following comparison, since it is the only standardized questionnaire that has been applied in both studies. We used two-sample t-tests to investigate whether pedestrians’ subjective PQ ratings of the three eHMI variants (no eHMI, status eHMI, status+intent eHMI) differ among experimental methodology (lab study vs. test track study).
For all ANOVAs, the data were checked for sphericity using Mauchly’s test, and, where violated, Greenhouse–Geisser and Hyunh–Feldt corrections were applied (as recommended by [48]). Where needed, we used Bonferroni-corrected post-hoc t-tests.

3. Results

3.1. Crossing Onset Time (COT)

On COT, the one-way repeated measures ANOVA revealed a significant effect of vehicle, F(4, 128) = 12.47, p < 0.001, ηp2 = 0.28. Figure 6 shows the mean values. Post-hoc t-tests revealed that participants started crossing earlier if the driverless SDV (automated mode) was equipped with a status+intent eHMI (M = 6.74, SD = 2.17) compared to no eHMI (M = 7.86, SD = 1.40), p = 0.003, 95% CI [0.30–1.95]. However, there was no improvement from no-eHMI to the status eHMI (M = 7.46, SD = 1.35), p = 0.439, or from the status eHMI to the status+intent eHMI, p = 0.117. Regarding human-driven vehicles, there is no difference in COT between an SDV steered by a driver (M = 8.14, SD = 1.34) and a CV steered by a driver (M = 8.08, SD = 1.35), p = 1.000. When comparing driverless vehicles and vehicles steered by a driver, participants initiated street crossing at the same time for encounters with a driverless SDV without eHMI and an SDV steered by a driver, p = 1.000, or a CV steered by a driver, p = 1.000. However, if the driverless SDV is equipped with a status eHMI, p = 0.005, 95% CI [0.15–1.21], or a status+intent eHMI, p < 0.001, 95% CI [0.62–2.19], participants initiated crossing earlier than if encountering a SDV steered by a driver. Analogously, if the driverless SDV is equipped with a status eHMI, p = 0.068, 95% CI [−0.03–1.27], or a status+intent eHMI, p < 0.001, 95% CI [0.51–2.18], participants (tended to) initiate crossing earlier than if encountering a CV steered by a driver.
To account for pedestrians’ individual crossing strategies [12], we performed cluster analyses, classifying pedestrians into groups according to their COT obtained for each yielding test condition. A dendrogram graphically illustrates the formation of clusters at the individual fusion stages (Figure 7a). To determine the number of clusters into which pedestrians can be meaningfully clustered, we computed a structogram (Figure 7b). The stuctogram graphically illustrates that the fourth cluster contributes significantly less to the variance than the first three clusters. Because of the considerable drop in the Sum of Squared Errors (ΔSSE), it seems reasonable to assume a solution with three clusters. Figure 8 shows the individual COT for each participant sorted by the three derived clusters from cluster analyses. Visual inspection suggests the following description of the three clusters: The first cluster (N = 7) includes early crossers who cross before the vehicle comes to a stop and are strongly influenced by the test conditions, particularly by the presence of a status+intent eHMI. The second cluster (N = 20) describes intermediate crossers who initiate crossing at about the same time as the vehicle comes to a stop. They are slightly influenced by the test conditions and constitute the biggest cluster. The third cluster (N = 7) includes late crossers who wait for the vehicle to come to a stop before crossing the street. These late crossers are slightly influenced by the test conditions.
In summary, pedestrians initiated street-crossing the soonest with a status+intent eHMI. Compared to a CV or SDV steered by a driver, pedestrians initiated crossing at the same time if the driverless SDV was not equipped with an eHMI and sooner if it was equipped with an eHMI displaying the SDV’s status and intent (see also: Faas et al. [39]). The significant effect of status+intent eHMI seems to be carried by a cluster of pedestrians, who are likewise characterized by a tendency to cross the street early, also with human-driven vehicles.

3.2. Perceived Safety

On perceived safety, the one-way repeated measures ANOVA found a significant effect of vehicle, F(2.59, 85.56) = 8.65, p < 0.001, ηp2 = 0.21. Figure 9 shows the results. Pedestrians feel significantly safer if the driverless SDV (automated mode) is equipped with a status eHMI (M = 0.31, SD = 1.67) than if it is without eHMI (M = −0.43, SD = 1.73), p = 0.011, 95% CI [0.12–1.37]. With a status+intent eHMI (M = 1.17, SD = 1.32), pedestrians feel safer than with a status eHMI, p = 0.026, 95% CI [0.07–1.65], and, thus, also safer than without eHMI, p < 0.001, 95% CI [0.69–2.51], drawing the following pattern: status+intent eHMI > status eHMI > no eHMI. Regarding human-driven vehicles, participants feel equally safe with an SDV steered by a driver (M = 1.06, SD = 1.46) and a CV steered by a driver (M = 1.06, SD = 1.51), p = 1.000. Compared to an SDV steered by a driver or a CV steered by a driver, participants felt less safe encountering a driverless SDV without eHMI, all ps < 0.01. However, if the driverless SDV was equipped with a status eHMI or a status+intent eHMI, participants felt as safe as with a human driven vehicle, all ps > 0.05.
In summary, pedestrians felt safest with a status+intent eHMI. With any eHMI, pedestrians felt as safe as with human-driven vehicles. However, if the driverless SDV is not equipped with an eHMI, pedestrians felt less safe than with human-driven vehicles (see also: Faas et al. [39]).

3.3. User Experience

The one-way repeated measures ANOVAs found a significant effect of eHMI on PQ, F(2, 66) = 54.27, p < 0.001, ηp2 = 0.62, and HQ, F(1.60, 52.84) = 22.20, p < 0.001, ηp2 = 0.40. Figure 10 shows the results.
Pedestrians rate PQ significantly higher if the driverless SDV (automated mode) is equipped with the status eHMI (M = 1.03, SD = 1.37) than without eHMI (M = −0.49, SD = 1.30), p < 0.001, 95% CI [0.98–2.06]. With a status+intent eHMI (M = 1.93, SD = 0.86), pedestrians rate PQ higher than with a status eHMI, p = 0.001, 95% CI [0.32–1.48], and, thus, higher than without eHMI, p < 0.001, 95% CI [1.77–3.07], revealing the following pattern: status+intent eHMI > status eHMI > no eHMI.
Accordingly, pedestrians rate HQ significantly higher if the driverless SDV (automated mode) is equipped with the status eHMI (M = 1.43, SD = 1.34) than without eHMI (M = 0.76, SD = 1.67), p = 0.003, 95% CI [0.21–1.13]. With a status+intent eHMI (M = 2.11, SD = 0.86), pedestrians rate HQ higher than with a status eHMI, p = 0.001, 95% CI [0.27–1.09], and, thus, also higher than without eHMI, p < 0.001, 95% CI [0.71–1.98], leading to the same pattern: status+intent eHMI > status eHMI > no eHMI.
Based on Hinderks et al. [49], the UX scores can be interpreted as bad (PQ) and below average (HQ) for no eHMI, below average (PQ) and good (HQ) for the status eHMI and excellent (PQ, HQ) for the status+intent eHMI (see also: Faas et al. [39]).

3.4. Comparison of Participants’ PQ Ratings in This Lab Study and a Test Track Study

We compared the PQ responses of this lab study to the PQ results of the test track study of Faas et al. [12] to investigate whether the different experimental methodologies lead to different results. We used two-sample t-tests to investigate whether pedestrians’ PQ ratings of the three eHMI variants (no eHMI, status eHMI, status+intent eHMI) differ among experimental methodology (this lab study vs. test track study of Faas et al. [12]). Levene’s test for equality of variances was not violated for any t-test. Table 2 and Figure 11 show the results. For no eHMI, participants’ PQ ratings were significantly lower in this lab study compared to the test track study of Faas et al. [12], t(62) = −2.10, p = 0.40, r = 0.26. However, both mean scores lead to the same interpretation of a bad user experience according to the benchmarks of Hinderks et al. [49]. Accordingly, for the status eHMI there was a trend implicating that participants’ PQ ratings were lower in this lab study compared to the test track study of Faas et al. [12], t(62) = −1.71, p = 0.92, r = 0.21. For the status+intent eHMI, we found no significant difference between the studies, p = 0.822.
Furthermore, both studies revealed the same results regarding participants’ PQ ratings of the three eHMI conditions: status+intent eHMI > status eHMI > no eHMI, leading to similar conclusions (see also: Faas et al. [12], Faas et al. [39]).

3.5. Self-Reported Naturalism

After all trials, participants rated the naturalism of the experiment on a scale from −3 (“not at all”) to +3 (“extremely”). The mean score to the question “How immersive was the study setup?” was M = 0.62 (SD = 1.37), suggesting a fair immersion. The mean score to the question “How natural was it to take a step forward to indicate that you would cross the street?” was M = 1.82 (SD = 1.03), suggesting good validity.

4. Discussion

This paper presents an innovative method to study SDV–pedestrian interactions in a safe, reproducible, and a natural manner for video-based eHMI studies. We developed a cost-efficient concept that allows participants to show natural behavior (i.e., entering a street). Participants make an actual street-crossing decision; that is, they are instructed to take a step off a sketched “sidewalk” to enter a sketched “crosswalk” to measure COT as a means to assess traffic flow. In the following, we discuss how the eHMI effects, which have been brought to light by our approach, validate its application. Furthermore, we discuss our method with regard to related approaches as well as the limitations and further improvements of our methodology.

4.1. Validation

We showed that our method is able to detect statistically significant eHMI effects that are comparable to a real-life study on a test track, and further displays a good level of self-reported naturalism.
The results of the eHMI study, yielding significant and meaningful results, validate the use of our approach. We found that, compared to human-driven vehicles, pedestrians feel less safe encountering a driverless SDV if it has no eHMI. However, pedestrians feel as safe if the driverless SDV is equipped with an eHMI displaying its status and, eventually, intent. When comparing the eHMI variants, all subjective measures (perceived safety, HQ, PQ) revealed the same pattern: status+intent eHMI > status eHMI > no eHMI. On COT, we found that pedestrians make earlier (thus more efficient) crossing decisions with a status+intent eHMI than with no eHMI. The significant effect of status+intent eHMI seems to be carried by a cluster of participants, suggesting individual crossing strategies among pedestrians (comparable to different lane changing strategies among drivers, see for example, [50]). Thus, providing pedestrians with information on SDVs’ automated status and imminent intent supports a feeling of safety and HQ. Pedestrians perceive an eHMI to be useful information (PQ), supporting them in their decision to cross the road as observed in earlier COTs (for a textual discussion, see Faas et al. [39]).
The approach is further validated by the fact that the study outcomes confirm previous research showing eHMI effects on perceived safety [12,13,15,16,17,18] and crossing onset [13,17,21,22,23], suggesting that our method is as suitable as other approaches to detect eHMI effects. This becomes particularly clear as our method replicates the findings of a test track study by Faas et al. [12]. Both studies compared the effect of light-based eHMI concepts on PQ at an ambiguous crossing traffic scenario. Both studies revealed the same significant pattern regarding pedestrians’ rating of PQ: status+intent eHMI > status eHMI > no eHMI. Thus, both studies showed that communicating an SDV’s intent adds further benefit for pedestrians over just displaying the automated status. However, in the current lab study (Faas et al. [39]) pedestrians rated the no-eHMI test conditions as significantly worse, and the status eHMI test condition as slightly worse, than participants of the test track study (Faas et al. [12]). We believe that the worse ratings emerged because, in the lab study, a vehicle without an eHMI could mean a real disadvantage, potentially representing a non-yielding vehicle. On the contrary, in the test track study (Faas et al. [12]) all vehicles yielded, so the participants’ safety was guaranteed. Further, a lab study is more controlled than a test track study. Thus, while showing the same pattern of eHMI ratings (status+intent eHMI > status eHMI > no eHMI), the lab study produced more variance in participants’ ratings, leading to a more differentiated evaluation of the eHMIs variants.
Finally, participants reported that it felt natural to take a step forward to indicate their street-crossing decisions (M = 1.82 on a scale from −3 to +3), suggesting a good validity.

4.2. Benefits with Regard to Related Approaches

The benefits of our method are its natural approach to assess COT in a parsimonious, reproducible, and safe manner.
Most previous approaches assessed crossing decisions in an unnatural manner, instructing participants to indicate their decision via pressing a button [13,15,17,22,23,29,30], a slider [26,27,28], or raising their hand [31]. Those approaches make the participants’ crossing decisions explicit, creating an intermediary step that may affect their behavior. Participants have to transfer their implicit crossing decision to an explicit motor decision with their hand. Furthermore, participants may have to look at the button or slider, so they cannot observe the approaching vehicle at all times. For example, in the study of Walker et al. [26], 29% of the participants reported that they were not able to use the slider naturally, thus not able to indicate their feeling of safety valid. Since street-crossing can be seen as an unreflective skillful action, which is a form of embodied intelligence or cognition [34,35], we argue that COT should be measured in a natural way, by actually stepping off a sidewalk onto a crosswalk. Our approach allows participants to show natural street-crossing behavior (i.e., entering a street) if they feel safe to cross. Thus, with our method, participants are closer to the processes that take place in real-world traffic situations, which improves ecological validity.
Only a few test track studies [12,33] and VR studies [21,32] allowed participants to indicate their decision to cross in a natural manner via the actual behavior of making a step forward. However, test track and VR studies require high-priced apparatus and materials as well as time-consuming data analysis. For example, the required resources for an eHMI study on a test track include a test track location, a real vehicle, a light setup (e.g., LED stripes), and a driver steering the vehicle, possibly in a seat costume. These resources are required for several days. For later analysis, videos of each vehicle encounter need to be visually analyzed to extract the crossing onset measure (e.g., [12,33,37]). Similarly, to conduct and analyze VR studies, researchers need technologically advanced software and hardware (for an overview, see [51]). Participants might suffer simulation sickness [52]. Compared to previous studies on a test track or in VR, our approach requires only a few materials. Video-based studies are cost-efficient in comparison. The material required for our approach include two TV screens, adhesive tape, two force-sensitive resistor sensors, an Arduino Uno analog-to-digital converter, and a laptop with the software Arduino IDE. For our real-world eHMI video clips, we needed a vehicle, fake Lidar sensors with LED light stripes, and a seat costume to create the illusion of a driverless vehicle. If researchers do not have access to those materials, future studies could use animated videos instead, just as VR studies do (e.g., [17,21,32]). An advantage of animated videos is that they allow researchers to have absolute control of any variable they might want to manipulate. However, their physical accuracy is lower than real-life videos [53]. Data analysis of our approach is as time-efficient as the Arduino Uno records COT in real-time.
Furthermore, video-based studies allow for flexibility and variety in eHMI test conditions. Researchers need to conduct only one video of an approaching vehicle and can use animations to create eHMI variants. The study is reproducible.
Lastly, one advantage of video studies is the possibility of incorporating non-yielding vehicle encounters while ensuring participants’ safety. In contrast, test track studies need to meet high ethical standards and safety provisions, limiting their representativeness for complex urban traffic scenarios. For example, to guarantee participants’ safety, non-yielding vehicle encounters should not be incorporated. Our approach allows participants to experience safety critical situations without actually endangering them. Although non-yielding vehicle encounters are not of research interest, they prevent participants from habituating to all cars stopping for them, which might lower their attention and, thus, the validity of the study.

4.3. Limitations and Recommendations

While our approach is promising, we acknowledge that there are limitations that require further attention. The first one refers to the absence of a real safety risk. The fact that participants cannot be harmed ensures participants’ safety, but it also limits the realism of our approach. Since pedestrians do not have to fear any real risks from non-yielding vehicles, they might behave in a riskier manner than in normal traffic. The second limitation refers to participants’ fair evaluation of the approach’s immersiveness (M = 0.62 on a scale from −3 to +3), which might be rooted in the participants’ constrained field of view. While real-life videos from the perspective of a pedestrian exhibit a high level of physical accuracy, their operationalization is not as good as experiencing a traffic situation in a real environment [53]. Thus, our method is suitable for relative comparisons (i.e., detecting differences between eHMI concepts) but not to establish the true value of COT for a certain eHMI concept. However, this limitation applies to all research studies that use simulation. To make the setup more realistic, future studies could setup the “sidewalk” with a real curb so that participants need to take a step down onto the “crosswalk” compared to the current setup with a flat lab floor (suggestion made by Koojman et al. [21]). Moreover, the use of VR glasses instead of TV screens may increase the participants’ degree of immersion. However, despite these limitations, our approach proved its sensitivity to detect eHMI effects on pedestrians’ COT, perceived safety, and user experience.

5. Conclusions

This paper introduces a novel paradigm to study SDV–pedestrian interaction that is relatively easy to implement and can find a balance between a natural and parsimonious study setup. We propose the use of two TV screens and a simulated sidewalk with hidden force-sensitive resistor sensors as the input device. We believe that street crossing behavior should be grasped by the actual action of stepping off a sidewalk onto a street. We propose that the study design shows clear advantages, as opposed to an artificial design with participants watching videos on a screen in a sitting position and/or indicating their crossing decision with a button or slider. We believe that this experimental design can be valuable and effective for future video studies examining vehicle-pedestrian interaction.
Within the presented approach, it was possible to demonstrate the need for an eHMI for the communication between SDVs and pedestrians in an ambiguous traffic scenario. The eHMI concepts revealed significant differences in terms of COT, perceived safety, and User Experience (for a textual discussion, see Faas et al. [39]). Further, we validated our method’s efficacy by showing that its results are not only comparable, but more differentiated than the results produced by a test track approach. Furthermore, our method displays a good level of self-reported naturalism. Thus, the presented method is validated as a suitable tool to make relative comparisons between eHMI concepts. We conclude that the method can be applied in future studies comparing eHMI concepts from a pedestrians’ point of view.

Author Contributions

Conceptualization, S.M.F., S.M., A.C.K. and M.B.; Data curation, S.M.F. and A.C.K.; Formal analysis, S.M.F.; Investigation, S.M.F. and A.C.K.; Methodology, S.M.F., S.M., A.C.K. and M.B.; Project administration, S.M.F. and A.C.K.; Resources, S.M.F. and A.C.K.; Software, A.C.K.; Supervision, S.M.F.; Validation, S.M.F. and A.C.K.; Visualization, S.M.F.; Writing—original draft, S.M.F.; Writing—review and editing, S.M.F., S.M., A.C.K. and M.B. All authors have read and agreed to the published version of the manuscript.

Funding

This research received no external funding.

Acknowledgments

We would like to thank Juergen Arnold, Jeff Bertalotto, Michael Boehringer, Sean Cannone, Katarina Carlos, Edwin Danner, Kevin Gee, Peter Goedecke, Ulrich Hipp, Ralf Krause, Eric Larsen, Laura Neiswander, Frank Ruff, and Ellen Tyler for their help with the study, as well as all study participants for their time and feedback.

Conflicts of Interest

The authors declare no conflict of interest.

References

  1. SAE International. Taxonomy and Definitions for Terms Related to Driving Automation Systems for On-Road Motor Vehicles (J3016); SAE International: Warrendale, PA, USA, 2018. [Google Scholar]
  2. Sivak, M.; Schöttle, B. Road Safety with Self-Driving Vehicles: General Limitations and Road Sharing with Conventional Vehicles (Report No. UMTRI-2015-2). 2015. Available online: https://deepblue.lib.umich.edu/bitstream/handle/2027.42/111735/103187.pdf?sequence=1&isAllowed=y (accessed on 25 July 2019).
  3. Ackermann, C.; Beggiato, M.; Bluhm, L.-F.; Löw, A.; Krems, J.F. Deceleration parameters and their applicability as informal communication signal between pedestrians and automated vehicles. Transp. Res. Part F Traffic Psychol. Behav. 2019, 62, 757–768. [Google Scholar] [CrossRef]
  4. Petzoldt, T.; Schleinitz, K.; Banse, R. The potential safety effects of a frontal brake light for motor vehicles. IET Intell. Transp. Syst. 2018, 12, 449–453. [Google Scholar] [CrossRef]
  5. Šucha, M.; Dostal, D.; Risser, R. Pedestrian-driver communication and decision strategies at marked crossings. Accid. Anal. Prev. 2017, 102, 41–50. [Google Scholar] [CrossRef] [PubMed] [Green Version]
  6. Liu, Y.-C.; Tung, Y.-C. Risk analysis of pedestrians’ road-crossing decisions: Effects of age, time gap, time of day, and vehicle speed. Saf. Sci. 2014, 63, 77–82. [Google Scholar] [CrossRef]
  7. Rodríguez, P. Safety of Pedestrians and Cyclists When Interacting with Automated Vehicles: A Case Study of the Wepods. 2017. Available online: https://www.raddelft.nl/wp-content/uploads/2017/06/Paola-Rodriguez-Safety-of-Pedestrians-and-Cyclists-when-Interacting-with…pdf (accessed on 19 April 2019).
  8. Li, Y.; Dikmen, M.; Hussein, T.; Wang, Y.; Burns, C. To Cross or Not to Cross: Urgency-Based External Warning Displays on Autonomous Vehicles to Improve Pedestrian Crossing Safety. In Proceedings of the 10th International Conference on Automotive User Interfaces and Interactive Vehicular Applications Pages, Toronto, ON, Canada, 23–25 September 2018; pp. 188–197. [Google Scholar]
  9. Färber, B. Communication and Communication Problems between Autonomous Vehicles and Human Drivers. In Autonomous Driving, 1st ed.; Maurer, M., Gerdes, J.C., Lenz, B., Winner, H., Eds.; Springer: Berlin/Heidelberg, Germany, 2016; pp. 125–144. [Google Scholar]
  10. Schieben, A.; Wilbrink, M.; Kettwich, C.; Madigan, R.; Louw, T.; Merat, N. Designing the interaction of automated vehicles with other traffic participants: Design considerations based on human needs and expectations. Cogn. Technol. Work 2019, 2019, 69–85. [Google Scholar] [CrossRef] [Green Version]
  11. Jayaraman, S.K.; Creech, C.; Tilbury, D.M.; Yang, X.J.; Pradhan, A.K.; Tsui, K.M.; Robert, L.P. Pedestrian trust in automated vehicles: Role of traffic signal and AV driving behavior. Front. Robot. AI 2019, 6, 14. [Google Scholar] [CrossRef] [Green Version]
  12. Faas, S.M.; Mathis, L.-A.; Baumann, M. External HMI for self-driving vehicles: Which information shall be displayed? Transp. Res. Part F Traffic Psychol. Behav. 2020, 68, 171–186. [Google Scholar] [CrossRef]
  13. De Clercq, K.; Dietrich, A.; Núñez Velasco, J.P.; de Winter, J.; Happee, R. External human-machine interfaces on automated vehicles: Effects on pedestrian crossing decisions. Hum. Factors 2019, 61, 1353–1370. [Google Scholar] [CrossRef] [PubMed] [Green Version]
  14. Rothenbücher, D.; Li, J.; Sirkin, D.; Mok, B.; Ju, W. Ghost Driver: A Field Study Investigating the Interaction between Pedestrians and Driverless Vehicles. In Proceedings of the 25th IEEE International Symposium on Robot and Human Interactive Communication (IEEE Ro-Man ‘16), New York, NY, USA, 26–31 August 2016; pp. 795–802. [Google Scholar]
  15. Song, Y.E.; Lehsing, C.; Fuest, T.; Bengler, K. External HMIs and Their Effect on the Interaction between Pedestrians and Automated Vehicles. In Proceedings of the 1st International Conference on Intelligent Human Systems Integration (IHSI ‘18), Dubai, United Arab Emirates, 7–9 January 2018; pp. 13–18. [Google Scholar]
  16. Böckle, M.-P.; Brenden, A.P.; Klingegård, M.; Habibovic, A.; Bout, M. SAV2P: Exploring the impact of an interface for shared automated vehicles on pedestrians’ experience. In Proceedings of the 9th International Conference on Automotive User Interfaces and Interactive Vehicular Applications (AutomotiveUI ‘17), New York, NY, USA, 24–27 September 2017; pp. 136–140. [Google Scholar]
  17. Chang, C.-M.; Toda, K.; Sakamoto, D.; Igarashi, T. Eyes on a Car: An Interface Design for Communication between an Autonomous Car and a Pedestrian. In Proceedings of the 9th International Conference on Automotive User Interfaces and Interactive Vehicular Applications, New York, NY, USA, 24–27 September 2017; pp. 65–73. [Google Scholar]
  18. Habibovic, A.; Andersson, J.; Malmsten Lundgren, V.; Klingegård, M.; Englund, C.; Larsson, S. External Vehicle Interfaces for Communication with Other Road Users? In Road Vehicle Automation 5; Meyer, G., Beiker, S., Eds.; Springer: Cham, Germany, 2019; pp. 91–102. [Google Scholar]
  19. Hudson, C.R.; Deb, S.; Carruth, D.W.; McGinley, J.; Frey, D. Pedestrian Perception of Autonomous Vehicles with External Interacting Features. In Proceedings of the 9th International Conference on Applied Human Factors and Ergonomics (AHFE ‘18), Orlando, FL, USA, 21–25 July 2018; pp. 33–39. [Google Scholar]
  20. Ackermann, C.; Beggiato, M.; Schubert, S.; Krems, J.F. An experimental study to investigate design and assessment criteria: What is important for communication between pedestrians and automated vehicles? Appl. Ergon. 2019, 75, 272–282. [Google Scholar] [CrossRef]
  21. Kooijman, L.; Happee, R.; de Winter, J.C.F. How do eHMIs affect pedestrians’ crossing behavior? A study using a head-mounted display combined with a motion suit. Information 2019, 10, 386. [Google Scholar] [CrossRef] [Green Version]
  22. Mahadevan, K.; Sanoubari, E.; Somanath, S.; Young, J.E.; Sharlin, E. AV-Pedestrian Interaction Design Using a Pedestrian Mixed Traffic Simulator. In Proceedings of the 2019 on Designing Interactive Systems Conference (DIS ‘19), San Diego, CA, USA, 23–28 June 2019; pp. 475–486. [Google Scholar]
  23. Eisma, Y.B.; van Bergen, S.; ter Brake, S.M.; Hensen, M.T.T.; Tempelaar, W.J.; de Winter, J.C.F. External human–machine interfaces: The effect of display location on crossing intentions and eye movements. Information 2020, 11, 13. [Google Scholar] [CrossRef] [Green Version]
  24. Lagström, T.; Lundgren, V.M. Automated Vehicle’s Interaction with Pedestrians. 2015. Available online: http://publications.lib.chalmers.se/records/fulltext/238401/238401.pdf (accessed on 20 April 2019).
  25. Texas A&M Transportation Institute. Variable Speed Limits. 2018. Available online: https://mobility.tamu.edu/mip/strategies-pdfs/active-traffic/technical-summary/Variable-Speed-Limit-4-Pg.pdf (accessed on 10 February 2020).
  26. Walker, F.; Dey, D.; Martens, M.; Pfleging, B.; Eggen, B.; Terken, J. Feeling-of-Safety Slider: Measuring Pedestrian Willingness to Cross Roads in Field Interactions with Vehicles. In Proceedings of the Extended Abstracts of the 2019 CHI Conference on Human Factors in Computing Systems, Scotland, UK, 4–9 May 2019. [Google Scholar]
  27. Dey, D.; Walker, F.; Martens, M.; Terken, J. Gaze Patterns in Pedestrian Interaction with Vehicles. In Proceedings of the 11th International Conference on Automotive User Interfaces and Interactive Vehicular Applications (AutomotiveUI ‘19), Utrecht, The Netherlands, 22–25 September 2019; pp. 369–378. [Google Scholar]
  28. Dey, D.; Martens, M.; Eggen, B.; Terken, J. Pedestrian road-crossing willingness as a function of vehicle automation, external appearance, and driving behaviour. Transp. Res. Part F Traffic Psychol. Behav. 2019, 65, 191–205. [Google Scholar] [CrossRef]
  29. Bazilinskyy, P.; Dodou, D.; de Winter, J. Survey on eHMI concepts: The effect of text, color, and perspective. Transp. Res. Part F Traffic Psychol. Behav. 2019, 67, 175–194. [Google Scholar] [CrossRef]
  30. Fridman, L.; Mehler, B.; Xia, L.; Yang, Y.; Facusse, L.Y.; Reimer, B. To Walk or not to walk: Crowdsourced assessment of external vehicle-to-pedestrian displays. arXiv 2017, arXiv:1707.02698. [Google Scholar]
  31. Fuest, T.; Michalowski, L.; Träris, L.; Bellem, H.; Bengler, K. Using the Driving Behavior of an Automated Vehicle to Communicate Intentions: A Wizard of Oz Study. In Proceedings of the 21st International Conference on Intelligent Transportation Systems (ITSC ‘18), Maui, HI, USA, 4–7 November 2018; pp. 3596–3601. [Google Scholar]
  32. Lee, Y.M.; Uttley, J.; Solernou, A.; Giles, O.; Romano, R.; Markkula, G.; Merat, N. Investigating Pedestrians’ Crossing Behaviour During Car Deceleration Using Wireless Head Mounted Display: An Application Towards the Evaluation of eHMI of Automated Vehicles. In Proceedings of the Tenth International Driving Symposium on Human Factors in Driver Assessment, Training and Vehicle Design, Santa Fe, NM, USA, 24–27 June 2019; pp. 252–258. [Google Scholar]
  33. Palmeiro, A.R.; van der Kint, S.; Vissers, L.; Farah, H.; de Winter, J.C.F.; Hagenzieker, M. Interaction between pedestrians and automated vehicles: A Wizard of Oz experiment. Transp. Res. Part F Traffic Psychol. Behav. 2018, 58, 1005–1020. [Google Scholar] [CrossRef] [Green Version]
  34. Rietveld, E. Situated normativity: The normative aspect of embodied cognition in unreflective action. Mind 2008, 117, 973–1001. [Google Scholar] [CrossRef] [Green Version]
  35. Herbert, B.M.; Pollatos, O. The body in the mind: On the relationship between interoception and embodiment. Top. Cogn. Sci. 2012, 4, 692–704. [Google Scholar] [CrossRef] [PubMed]
  36. SAE International. Automated Driving System (ADS) Marker Lamp (J3134); SAE International: Warrendale, PA, USA, 2019. [Google Scholar]
  37. Faas, S.M.; Baumann, M. Yielding Light Signal Evaluation for Self-Driving Vehicle and Pedestrian Interaction. In Proceedings of the 2nd International Conference on Human Systems Engineering and Design: Future Trends and Applications (IHSED ‘19), Munich, Germany, 16–18 September 2019; pp. 189–194. [Google Scholar]
  38. Mahadevan, K.; Somanath, S.; Sharlin, E. Communicating Awareness and Intent in Autonomous Vehicle-Pedestrian Interaction. In Proceedings of the SIGCHI Conference on Human Factors in Computing Systems (CHI ‘18), Montreal, QC, Canada, 21–27 April 2018; pp. 1–12. [Google Scholar]
  39. Faas, S.M.; Kao, A.C.; Baumann, M. A longitudinal Video Study on Communicating Status and Intent for Self-Driving Vehicle—Pedestrian Interaction. In Proceedings of the SIGCHI Conference on Human Factors in Computing Systems (CHI ‘20), Oahu, HI, USA, 25–30 April 2020. [Google Scholar]
  40. Dahlbäck, N.; Jönsson, A.; Ahrenberg, L. Wizard of Oz Studies: Why and How. In Proceedings of the 1st International Conference on Intelligent User Interfaces (IUI ‘93), Orlando, FL, USA, 4–7 January 1993; pp. 193–200. [Google Scholar]
  41. Garsten, E. Mercedes-Benz, Bosch Launch Robocar Ride-Hailing Pilot in San Jose. 2019. Available online: https://www.forbes.com/sites/edgarsten/2019/12/09/mercedes-benz-bosch-launch-robocar-ride-hailing-pilot-in-san-jose/#441deb7e3c5b (accessed on 21 June 2020).
  42. Randazzo, R. Waymo’s Driverless Cars on the Road: Cautious, Clunky, Impressive. 2019. Available online: https://eu.azcentral.com/story/money/business/tech/2018/12/05/phoenix-waymo-vans-how-self-driving-cars-operate-roads/2082664002/ (accessed on 21 June 2020).
  43. Ackermans, S.; Dey, D.; Ruijten, P.; Cuijpers, R.H.; Pfleging, B. The Effects of Explicit Intention Communication, Conspicuous Sensors, and Pedestrian Attitude in Interactions with Automated Vehicles. In Proceedings of the SIGCHI Conference on Human Factors in Computing Systems (CHI ‘20), Honolulu, HI, USA, 25–30 April 2020. [Google Scholar]
  44. Bartneck, C.; Kulić, D.; Croft, E.; Zoghbi, S. Measurement instruments for the anthropomorphism, animacy, likeability, perceived intelligence, and perceived safety of robots. Int. J. Soc. Robot. 2009, 71–81. [Google Scholar] [CrossRef] [Green Version]
  45. Schrepp, M.; Hinderks, A.; Thomaschewski, J. Design and evaluation of a short version of the user experience questionnaire (UEQ-S). IJIMAI 2017, 103–108. [Google Scholar] [CrossRef] [Green Version]
  46. Bortz, J.; Schuster, C. Statistik für Human- und Sozialwissenschaftler, 7th ed.; Springer: Berlin/Heidelberg, Germany, 2010. [Google Scholar]
  47. Field, A. Discovering Statistics: Cluster Analysis. 2017. Available online: https://www.discoveringstatistics.com/2017/01/13/cluster-analysis/ (accessed on 21 June 2020).
  48. Field, A. Discovering Statistics Using IBM SPSS Statistics, 5th ed.; SAGE Publications Ltd.: London, UK, 2018. [Google Scholar]
  49. Hinderks, A.; Schrepp, M.; Thomaschewski, J. UEQ Data Analysis Tool. 2019. Available online: https://www.ueq-online.org/Material/Short_UEQ_Data_Analysis_Tool.xlsx (accessed on 22 June 2019).
  50. Sun, D.J.; Elefteriadou, L. Lane-Changing Behavior on Urban Streets: An “In-Vehicle” Field Experiment-Based Study. Comput.-Aided Civ. Infrastruct. Eng. 2012, 27, 525–542. [Google Scholar] [CrossRef]
  51. Feldstein, I.T.; Lehsing, C.; Dietrich, A.; Bengler, K. Pedestrian simulators for traffic research: State of the art and future of a motion lab. Int. J. Hum. Factors Model. Simul. 2018, 6, 250–265. [Google Scholar] [CrossRef]
  52. Hettinger, L.J.; Riccio, G.E. Visually induced motion sickness in virtual environments. Presence Teleoperators Virtual Environ. 1992, 3, 306–310. [Google Scholar] [CrossRef]
  53. Weiß, T.; Petzoldt, T.; Bannert, M.; Krems, J.F. Einsatz von computergestuetzten Medien und Fahrsimulatoren in Fahrausbildung, Fahrerweiterbildung und Fahrerlaubnispruefung. Ber. Bundesanst. Straßenwesen Reihe M (Mensch Sicherh.) 2009, 202. Available online: https://bast.opus.hbz-nrw.de/opus45-bast/frontdoor/deliver/index/docId/1/file/BASt_Schlussbericht_November_2007.pdf (accessed on 10 July 2020).
Figure 1. Procedure. The top row represents the study flow and the independent variable (IV). The driverless self-driving vehicle (SDV) (automated mode) is equipped with no eHMI, status eHMI or status+intent eHMI (test conditions 1, 2, 3). Both the SDV steered by a driver (conventional mode) and the conventional vehicle (CV) are either yielding (test conditions 4, 5) or non-yielding (filler test conditions 4b, 5b). In a randomized order, each participant experienced all seven test conditions once for habituation (wave 1) and once for data collection (wave 2). The bottom row represents the dependent variables (DVs) assessed in wave 2. The crossing onset time (COT) data were recorded by an Arduino Uno through the logs of two force-sensitive resistor sensors. For the subjective measures, participants filled in questionnaires after each trial. While perceived safety was measured for all yielding vehicle trials, we applied the user experience scales only after trials with a driverless SDV. Reproduced with permission from Faas, Kao and Baumann, A longitudinal video study on communicating status and intent for self-driving vehicle–pedestrian interaction, Proceedings of the SIGCHI Conference on Human Factors in Computing Systems (CHI ’20); published by ACM, 2020, doi: 10.1145/3313831.3376484.
Information 11 00360 g001
Figure 2. The study compared three eHMI test conditions within a driverless self-driving vehicle (SDV). This figure shows the status+intent eHMI (test condition 3). Two steady lights at the fake sensors indicate the automated status; a slowly flashing light at the windshield indicates its intent to yield to the pedestrian. For the status eHMI (test condition 2), the two steady lights were engaged. Without an eHMI (test condition 1), no lights were engaged. Reproduced with permission from Faas, Kao and Baumann, A longitudinal video study on communicating status and intent for self-driving vehicle–pedestrian interaction, Proceedings of the SIGCHI Conference on Human Factors in Computing Systems (CHI ’20); published by ACM, 2020, doi: 10.1145/3313831.3376484.
Information 11 00360 g002
Figure 3. To provide a mixed-traffic environment, a visible driver steered the self-driving vehicle (SDV; top row) respectively a conventional vehicle (CV; bottom row). They were either (a) yielding to let the pedestrian cross first (test condition 4, 5); or (b) non-yielding (test condition 4b, 5b) so that the pedestrian has to wait for the vehicle to go first and crosses the empty street afterwards safely.
Information 11 00360 g003
Figure 4. Study setup. Reproduced with permission from Faas, Kao and Baumann, A longitudinal video study on communicating status and intent for self-driving vehicle–pedestrian interaction, Proceedings of the SIGCHI Conference on Human Factors in Computing Systems (CHI ’20); published by ACM, 2020, doi: 10.1145/3313831.3376484.
Information 11 00360 g004
Figure 5. Traffic scenario from a bird’s-eye view. The crossing scenario at the exit lane is framed in black. Copyright: Imagery ©2020 Google, Map data ©2020.
Information 11 00360 g005
Figure 6. Mean crossing onset time (COT) for all yielding test conditions. Error bars: ±1 SE.
Information 11 00360 g006
Figure 7. Cluster analyses. (a) Dendrogram. On the x-axis, the Sum of Squared Errors (ΔSSE) are plotted. (b) Structogram for the number of clusters ranging from 1 to 7. The structogram indicates that by splitting the 3 clusters into 4 clusters, the ΔSSE values do not decrease much. Thus, three clusters seem appropriate for this scheme.
Information 11 00360 g007
Figure 8. Individual crossing onset time (COT) per participant for all yielding test conditions. Participants were sorted according to the three clusters derived from cluster analyses: (1) early crossers who are strongly influenced by the presence of the eHMIs, particularly the status+intent eHMI (N = 7) as well as (2) intermediate (N = 20) and (3) late crossers (N = 7), who are both slightly influenced by the eHMIs. Within each cluster, participants were sorted according to their average COT over all test conditions (e.g., within cluster 1, SP24 crosses the earliest, SP5 the latest over all yielding test conditions).
Information 11 00360 g008
Figure 9. Mean perceived safety scores for all yielding test conditions. Error bars: ±1 SE.
Information 11 00360 g009
Figure 10. Mean UX scores for all driverless self-driving vehicle (SDV; automated mode) test conditions, as shown by the subscales: (a) Pragmatic Quality (PQ) and (b) Hedonic Quality (HQ). Error bars: ±1 SE.
Information 11 00360 g010
Figure 11. Pedestrians’ Pragmatic Quality (PQ) ratings of the three eHMI variants (test conditions 1, 2, 3) in this lab study and in the test track study of Faas et al. [12]. Error bars: ±1 SE.
Information 11 00360 g011
Table 1. Participants’ task and video flow.
Participants’ TaskLeft ScreenRight Screen
Information 11 00360 i001Participant is ready for the next trial and asked to step on the “sidewalk”. Information 11 00360 i002 Information 11 00360 i003
Information 11 00360 i004Participant steps on the footprint…
…which triggers the 3s countdown… Information 11 00360 i005 Information 11 00360 i006
…followed by the video of the approaching vehicle. Information 11 00360 i007 Information 11 00360 i008
Information 11 00360 i009To indicate her/his crossing decision, the participant steps off the “sidewalk” to enter the “crosswalk”…
…which is a safe decision for yielding videos (test conditions 1, 2, 3, 4, 5), triggering a crossing video. Information 11 00360 i010 Information 11 00360 i011
…which is a safe decision if letting the vehicle go first for non-yielding videos (test conditions 4b, 5b), triggering a crossing video. Information 11 00360 i012 Information 11 00360 i013
…which is an unsafe decision if the vehicle is still approaching for non-yielding videos (test conditions 4b, 5b), triggering a visual warning and a passing car video. Information 11 00360 i014 Information 11 00360 i015
Table 2. Two-sample t-tests.
Test ConditionThis Lab Study 1Test Track Study 2t-Tests
MSDMSDdft-Valuep-Valuer
(1) no eHMI−0.491.300.311.7462−2.10p = 0.040 *0.26
(2) status eHMI1.031.371.561.0562−1.71p = 0.0920.21
(3) status+intent eHMI1.930.861.980.8562−0.23p = 0.822
1 in this lab study, N = 34 participants experienced the three eHMIs within-subject though real-world video clips; 2 in the test track study of Faas et al. [12], N = 30 participants experienced the three eHMIs within-subject at an intersection with a real vehicle. * p < 0.05.

