1. Introduction
Social media channels like Twitter have become an established communication channel for various actors, private and public. The restriction of Tweets to a length of 140 characters until 2017 and 280 characters since leads to concise messages that are available in near real-time and at no cost. Twitter started service in 2006, and in 2009, when an airplane crashed on the Hudson river in New York City, the news was spread on Twitter 15 minutes before mainstream media caught up [
1]. With currently around 6000 Tweets sent every second and about 500 million per day [
2], events all around the world are reported and made public. Monitoring public sentiment to predict election results [
3] or even riots [
4] or to analyze urban processes [
5] is one aspect of Twitter based event detection.
Another line of research is concerned with detecting natural disasters by analyzing Tweets that share information in near real-time [
6]. Especially geo-tagged Tweets can be a valuable source for disaster response. Twitter users as “social sensors” [
7,
8] immediately deliver in-situ information at currently no additional cost. Traditional remote sensing approaches such as satellite or drone images suffer from lower coverage (both spatial and temporal) and a temporal lag before the data is available [
9]. Although social media data have been shown to be a valuable addition, their analysis is difficult due to the data’s noisiness, its unstructured and diverse nature and the lack of labeling. Annotating and classifying the data is not feasible in a timely manner. An unsupervised alternative are topic models, allowing for organizing document collections into general themes, so called topics. As an example, Latent Dirichlet Allocation (LDA) [
10] models topics as distributions over a fixed vocabulary and documents as a mixture of topics.
The output of an LDA is difficult to process. Topics can be noisy, not well separated and identifying a topic with desired content can be infeasible even for humans [
11]. The fictitious example in
Table 1 (left) with five topics illustrates that there might be not a single disaster-related topic, but three (➁, ➃, and ➄). Automating the detection of relevant topics with a keyword-based approach could fail, as topic ➄ lacks the term “earthquake”. For real-world and more diverse datasets, the difficulties even increase. Guided [
12] and seeded [
13] LDA variants are a first step towards automated extraction of the disaster-related topic. Both suggest methods to incorporate prior knowledge about the topics’ term distribution. Instead of initializing the topics with random terms, the so called seed words are assigned a high probability for the specific topic. This seeding guides the LDA towards a desirable output during inference, meaning that terms that occur in the same context will eventually also have a high probability in the same topic. Topic ➀ in
Table 1 (right) could be an example for a topic seeded with disaster-related terms, e.g., “earthquake” or “shaking”. Tweets corresponding to the seeded topic can then automatically be detected.
One remaining question is how to automatically determine meaningful seed words. In [
14], domain experts manually define the seeds. Another possibility is to apply external sources to incorporate word correlation knowledge, such as WordNet [
15] or pretrained word embeddings [
16]. Jagarlamudi et al. [
13] rely on labeled data to extract seed words by applying feature selection. We aim to close this gap between currently existing approaches, where manual interference is needed especially to adapt to a new event, and the applicability in real world scenarios that often requires immediate action. We propose a method to automatically determine seed words for the disaster-related topic by comparing the vocabulary of the day when the disaster took place with that of a preceding, typical day in the same area. The resulting seed words are used to initialize a single topic of the LDA. After modeling the dataset, Tweets having assigned their maximum value at the specific topic are labeled as related to the event.
This paper investigates the potential of the fully automated seeding for the topic modeling of Tweets. We compare the performance against a basic LDA model and against a single pre-determined seed word for two different Twitter datasets: one covering the Napa valley earthquake in 2014 and the other covering hurricane Harvey in Texas in 2017. Besides an intrinsic evaluation of the coherence of the modeled topics, we determine the classification performance on a small, labeled subset of the data to assess the semantic congruence of the extracted relevant Tweets. Furthermore, we apply a geospatial analysis to determine the exact locations and “hot spots” affected by the events. Validating the spatial distributions of the Tweets against the official disaster footprints allows to generate additional value for disaster management.
In the following,
Section 2 summarizes existing work on using topic models for event and disaster detection in Tweets. Our proposed method to automatically seed a LDA model is introduced in
Section 3.
Section 4 presents the datasets used to run the corresponding experiments and the generated seed words. Intrinsic and extrinsic evaluations are conducted in
Section 5 and
Section 6, respectively, followed by a discussion of the results in
Section 7 and a conclusion in
Section 8.
7. Discussion
Comparing Tweets from two different days to extract meaningful seed words is a feasible way to automate the topic modeling process. Moreover, the experiments show that guiding the LDA towards those seed words for topics of interest improves the performance—only slightly in terms of overall topic coherence, but significantly for extracting disaster related Tweets, which is the central goal in supporting disaster management [
26].
When comparing the two datasets, it is clear that by fully automating the topic modeling process, the classification performance does not suffer. On the contrary, the classification of the hurricane dataset improves considerably. Keeping in mind that the nature of a hurricane is more diverse than that of an earthquake, it seems that the standard methods are limited. While using a “dummy” keyword (GLDA Baseline) as seed is competitive on the earthquake dataset, this variant also performs poorly on the hurricane dataset. Automatically generating seed words thus will also be helpful in case of unknown, diverse or rare events that are hard to describe by a small set of manually defined keywords.
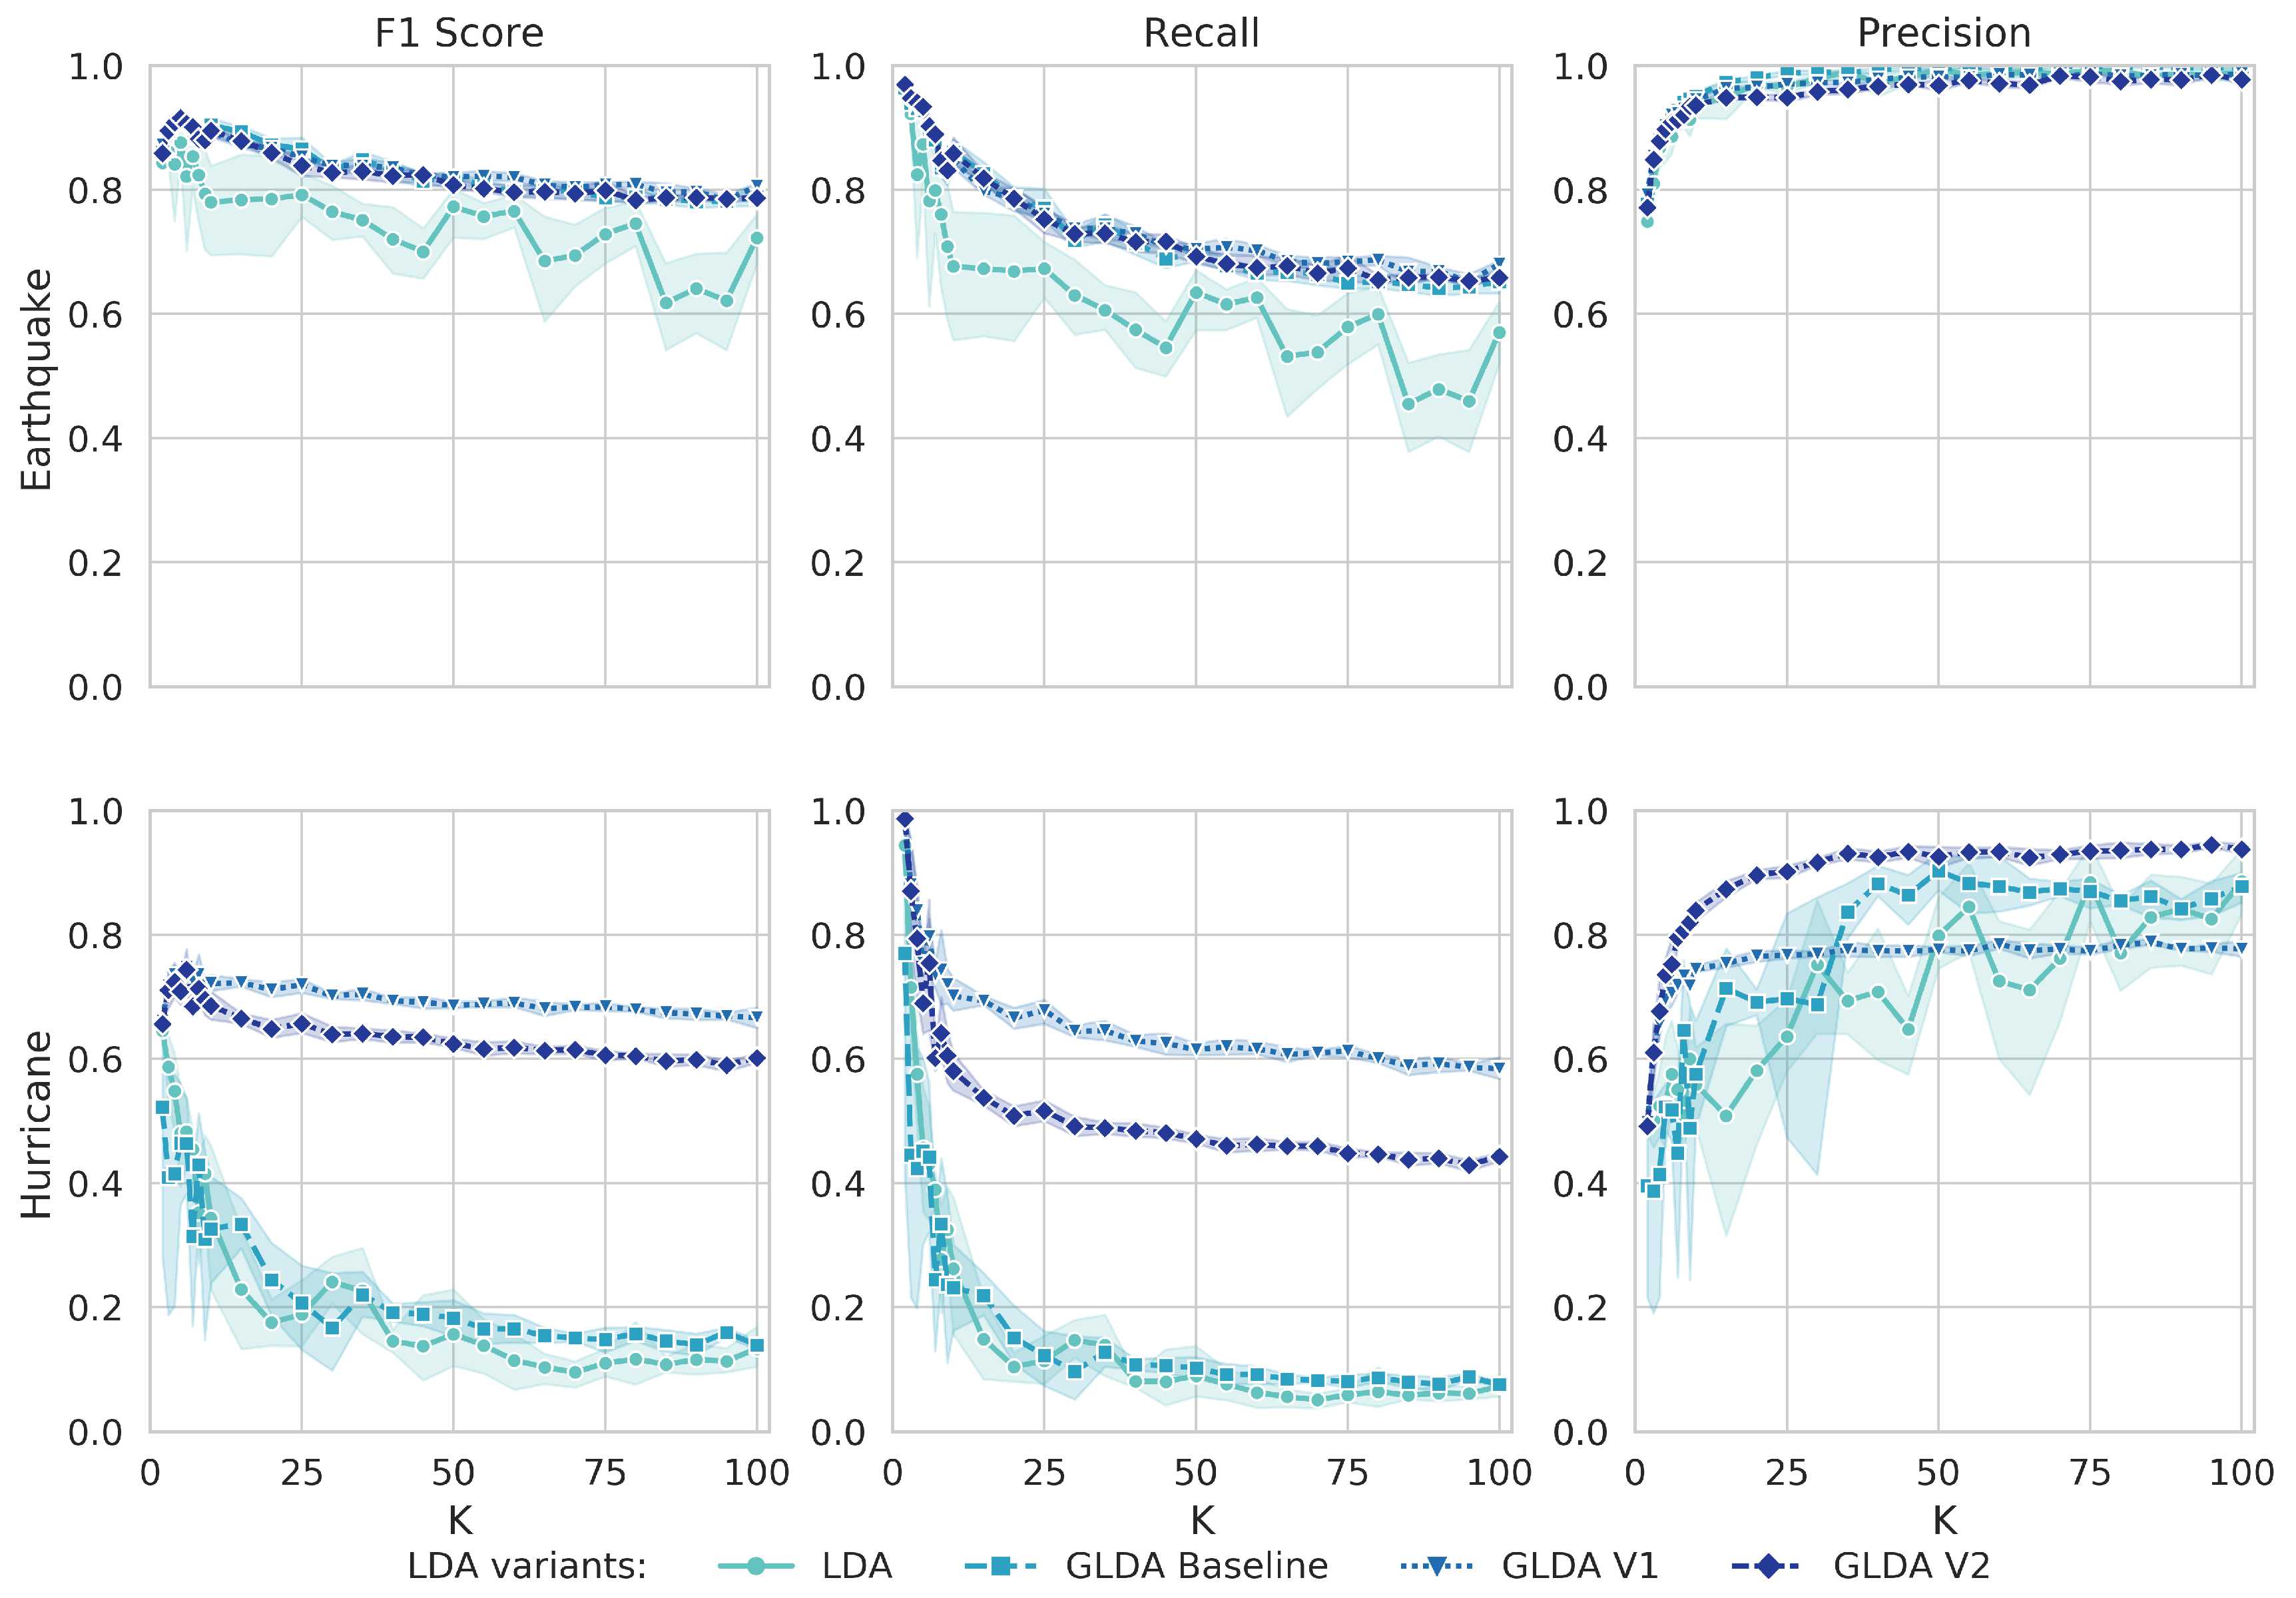
As the results of five different runs each imply, the performance of the guided LDA with automatically generated seed words is more stable. As the variation over the runs is low, there is no need for further hyper-parameter tuning or experimenting with the right number of topics, which is beneficial in real-world scenarios. For the LDA, even with the best performing K, the standard deviation is 3.9% on the earthquake dataset, while only 0.5% for both GLDA variants. On the hurricane dataset, the standard deviation is 1.7% for LDA, 1.5% for GLDA V1 and 0.8% for GLDA V2. At least for the LDA, this result could also mean that the model did not fully converge yet and more iteration steps (and more time) are needed.
According to our experiments, meaningful and disaster related Tweets are extracted with a small number of topics, i.e., . However, the score might not always be a good proxy for assessing the retrieval. Tasks focusing on displaying the retrieved Tweets in text-based form might require smaller, but highly precise result sets and thus favor precision over recall. For quantity-focused tasks, a higher recall might be preferable. The experiments suggest that the optimal value for K then differs: smaller K for better recall, higher K for improved precision.
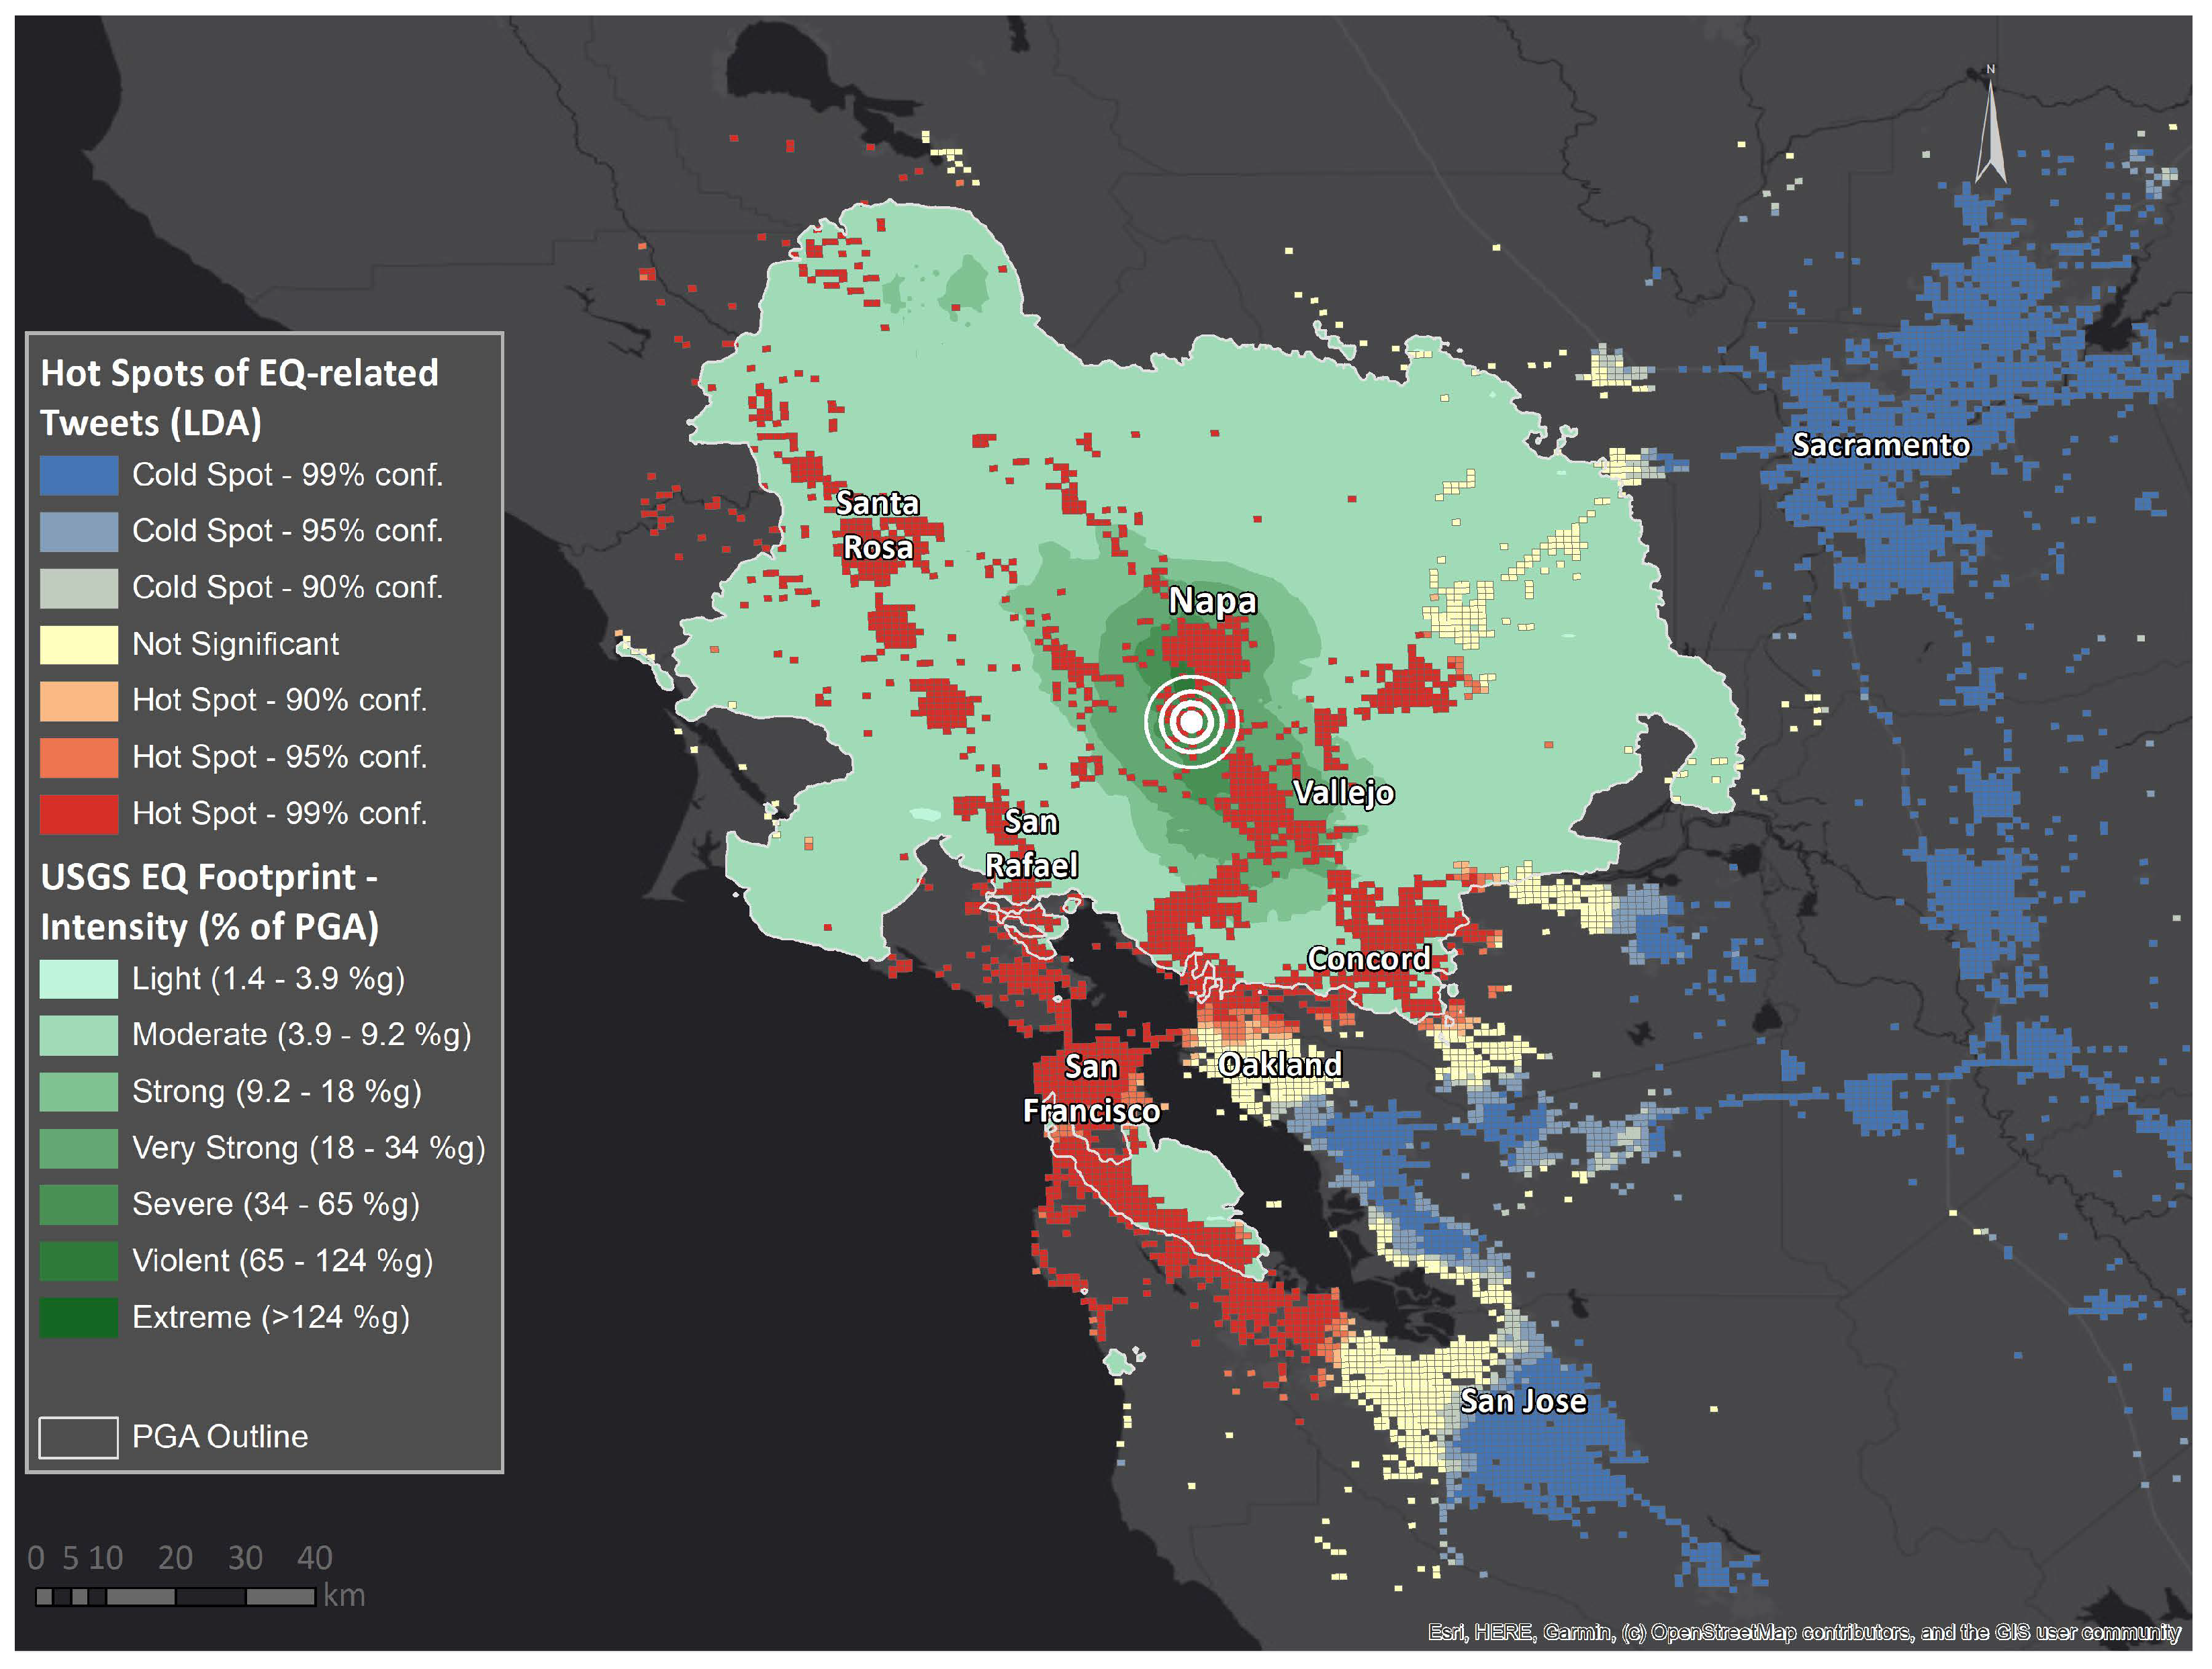
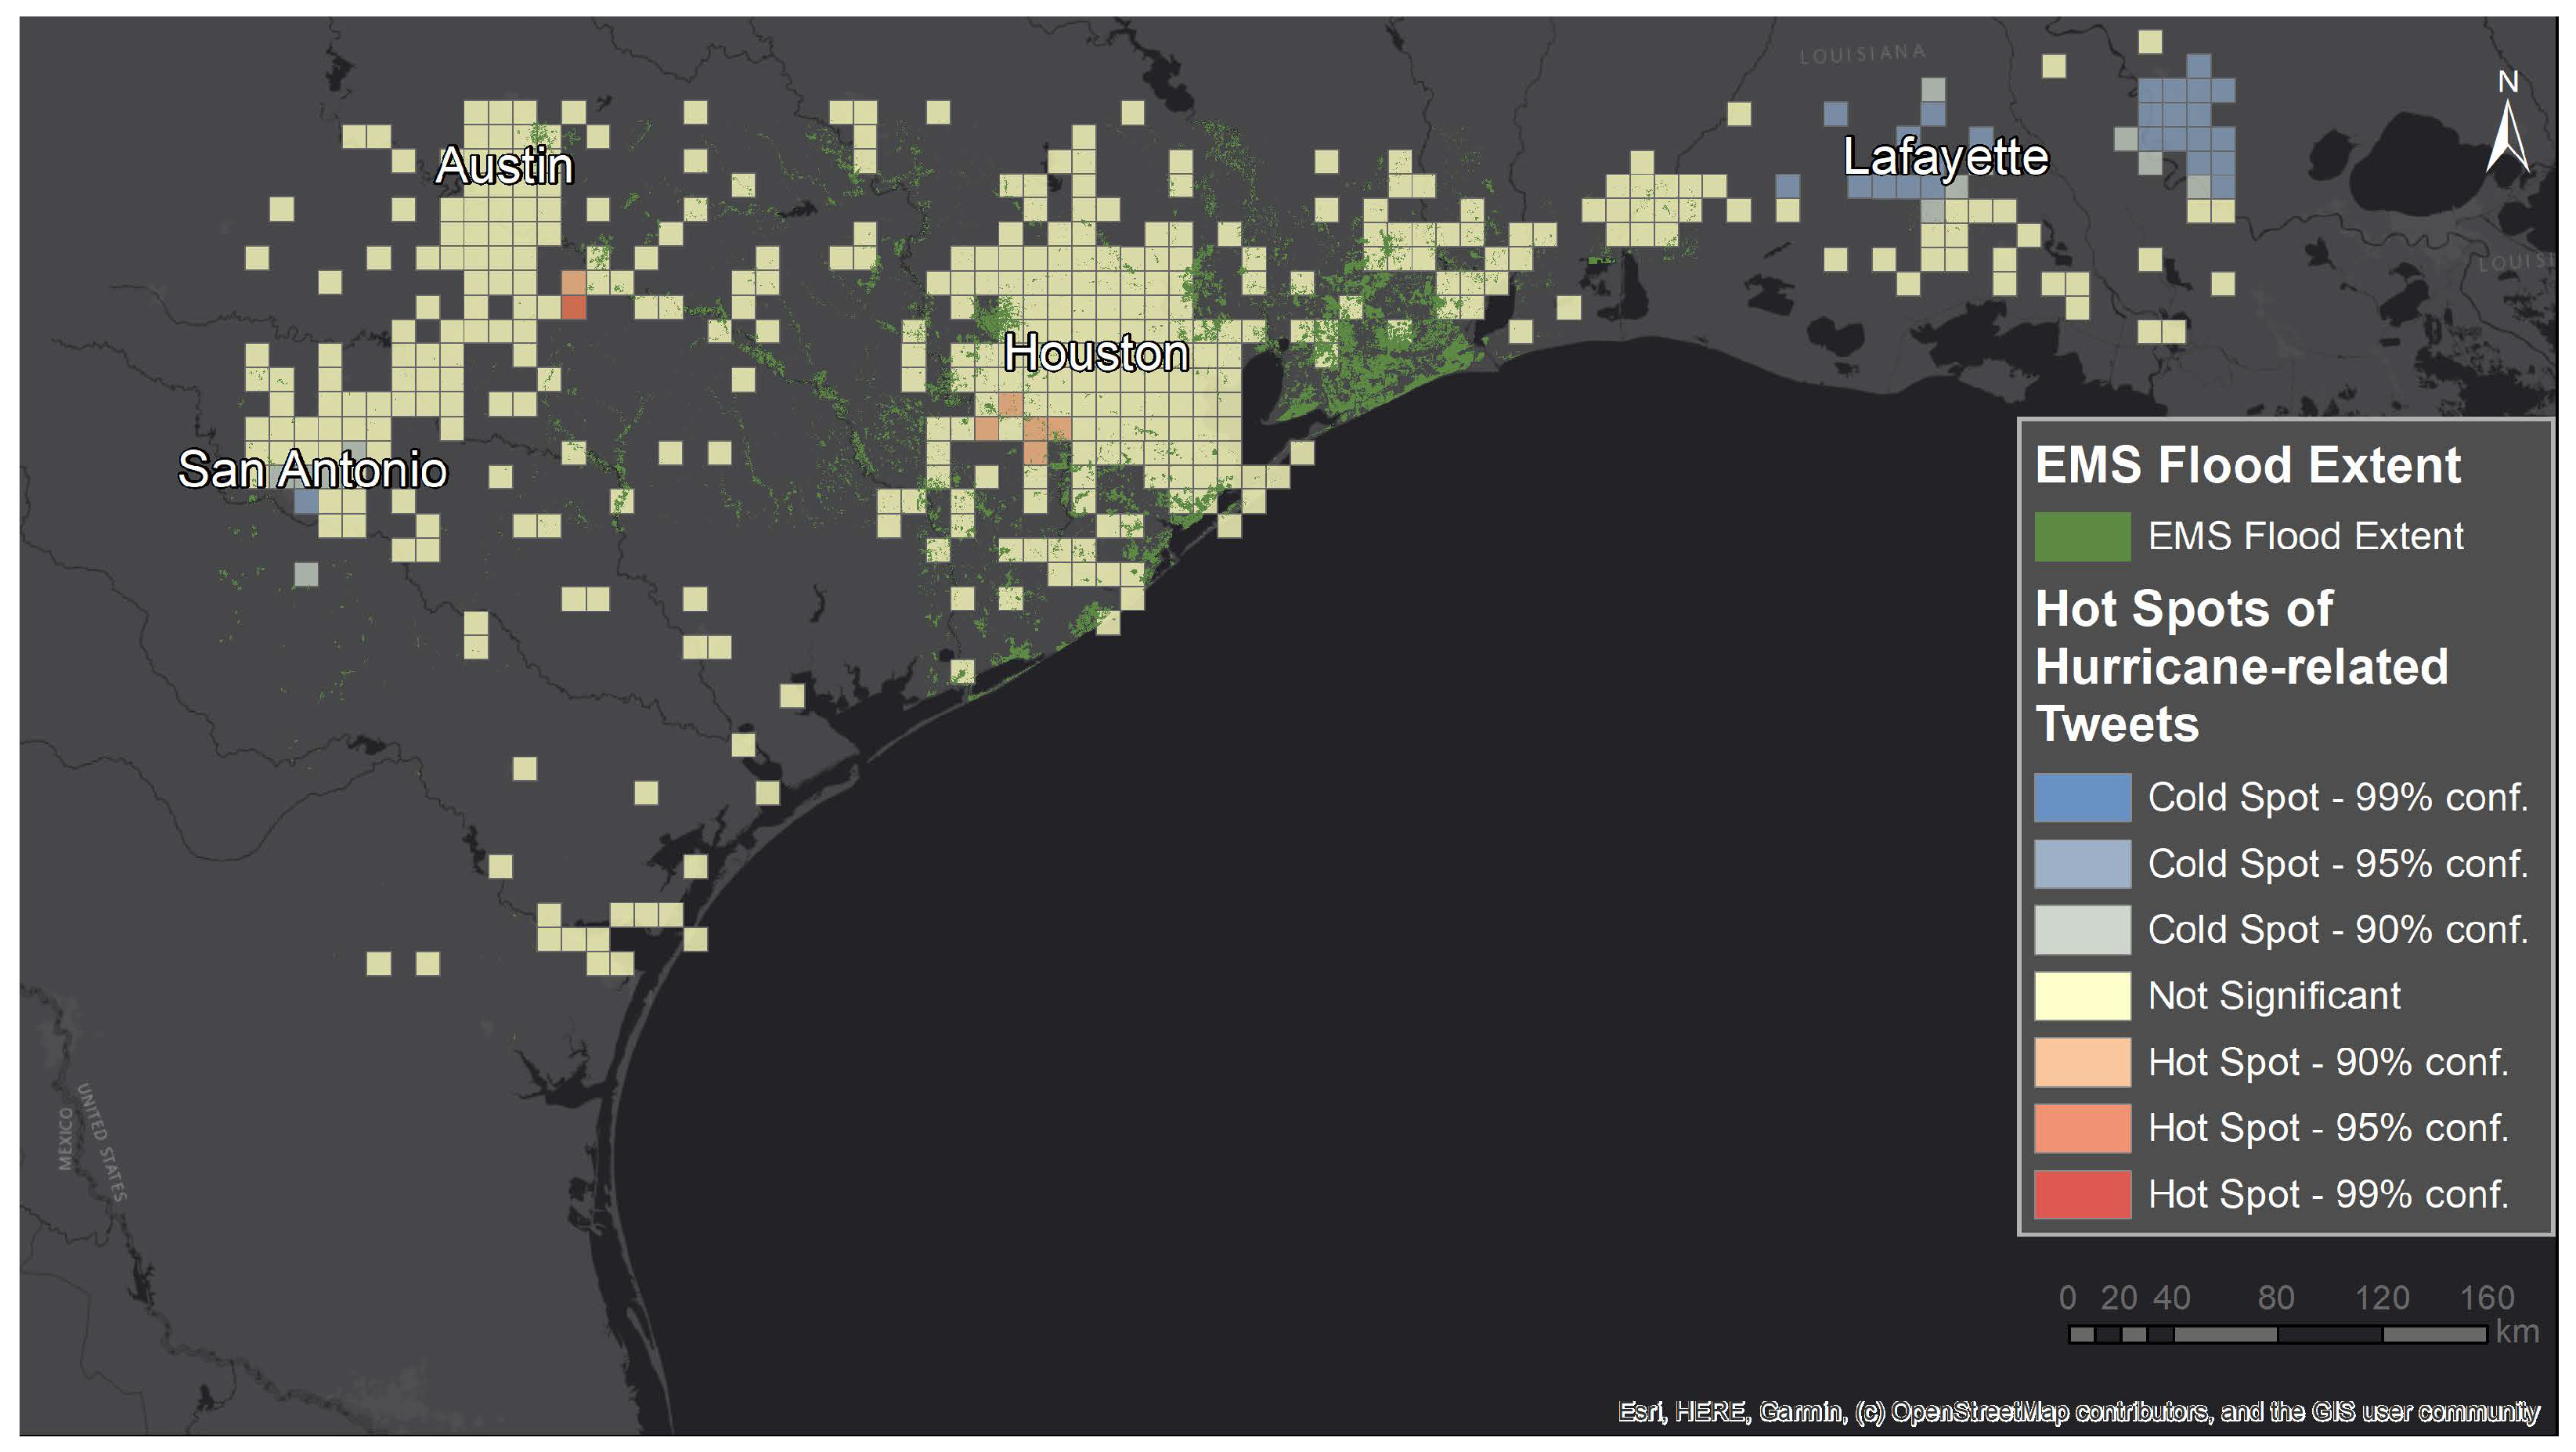
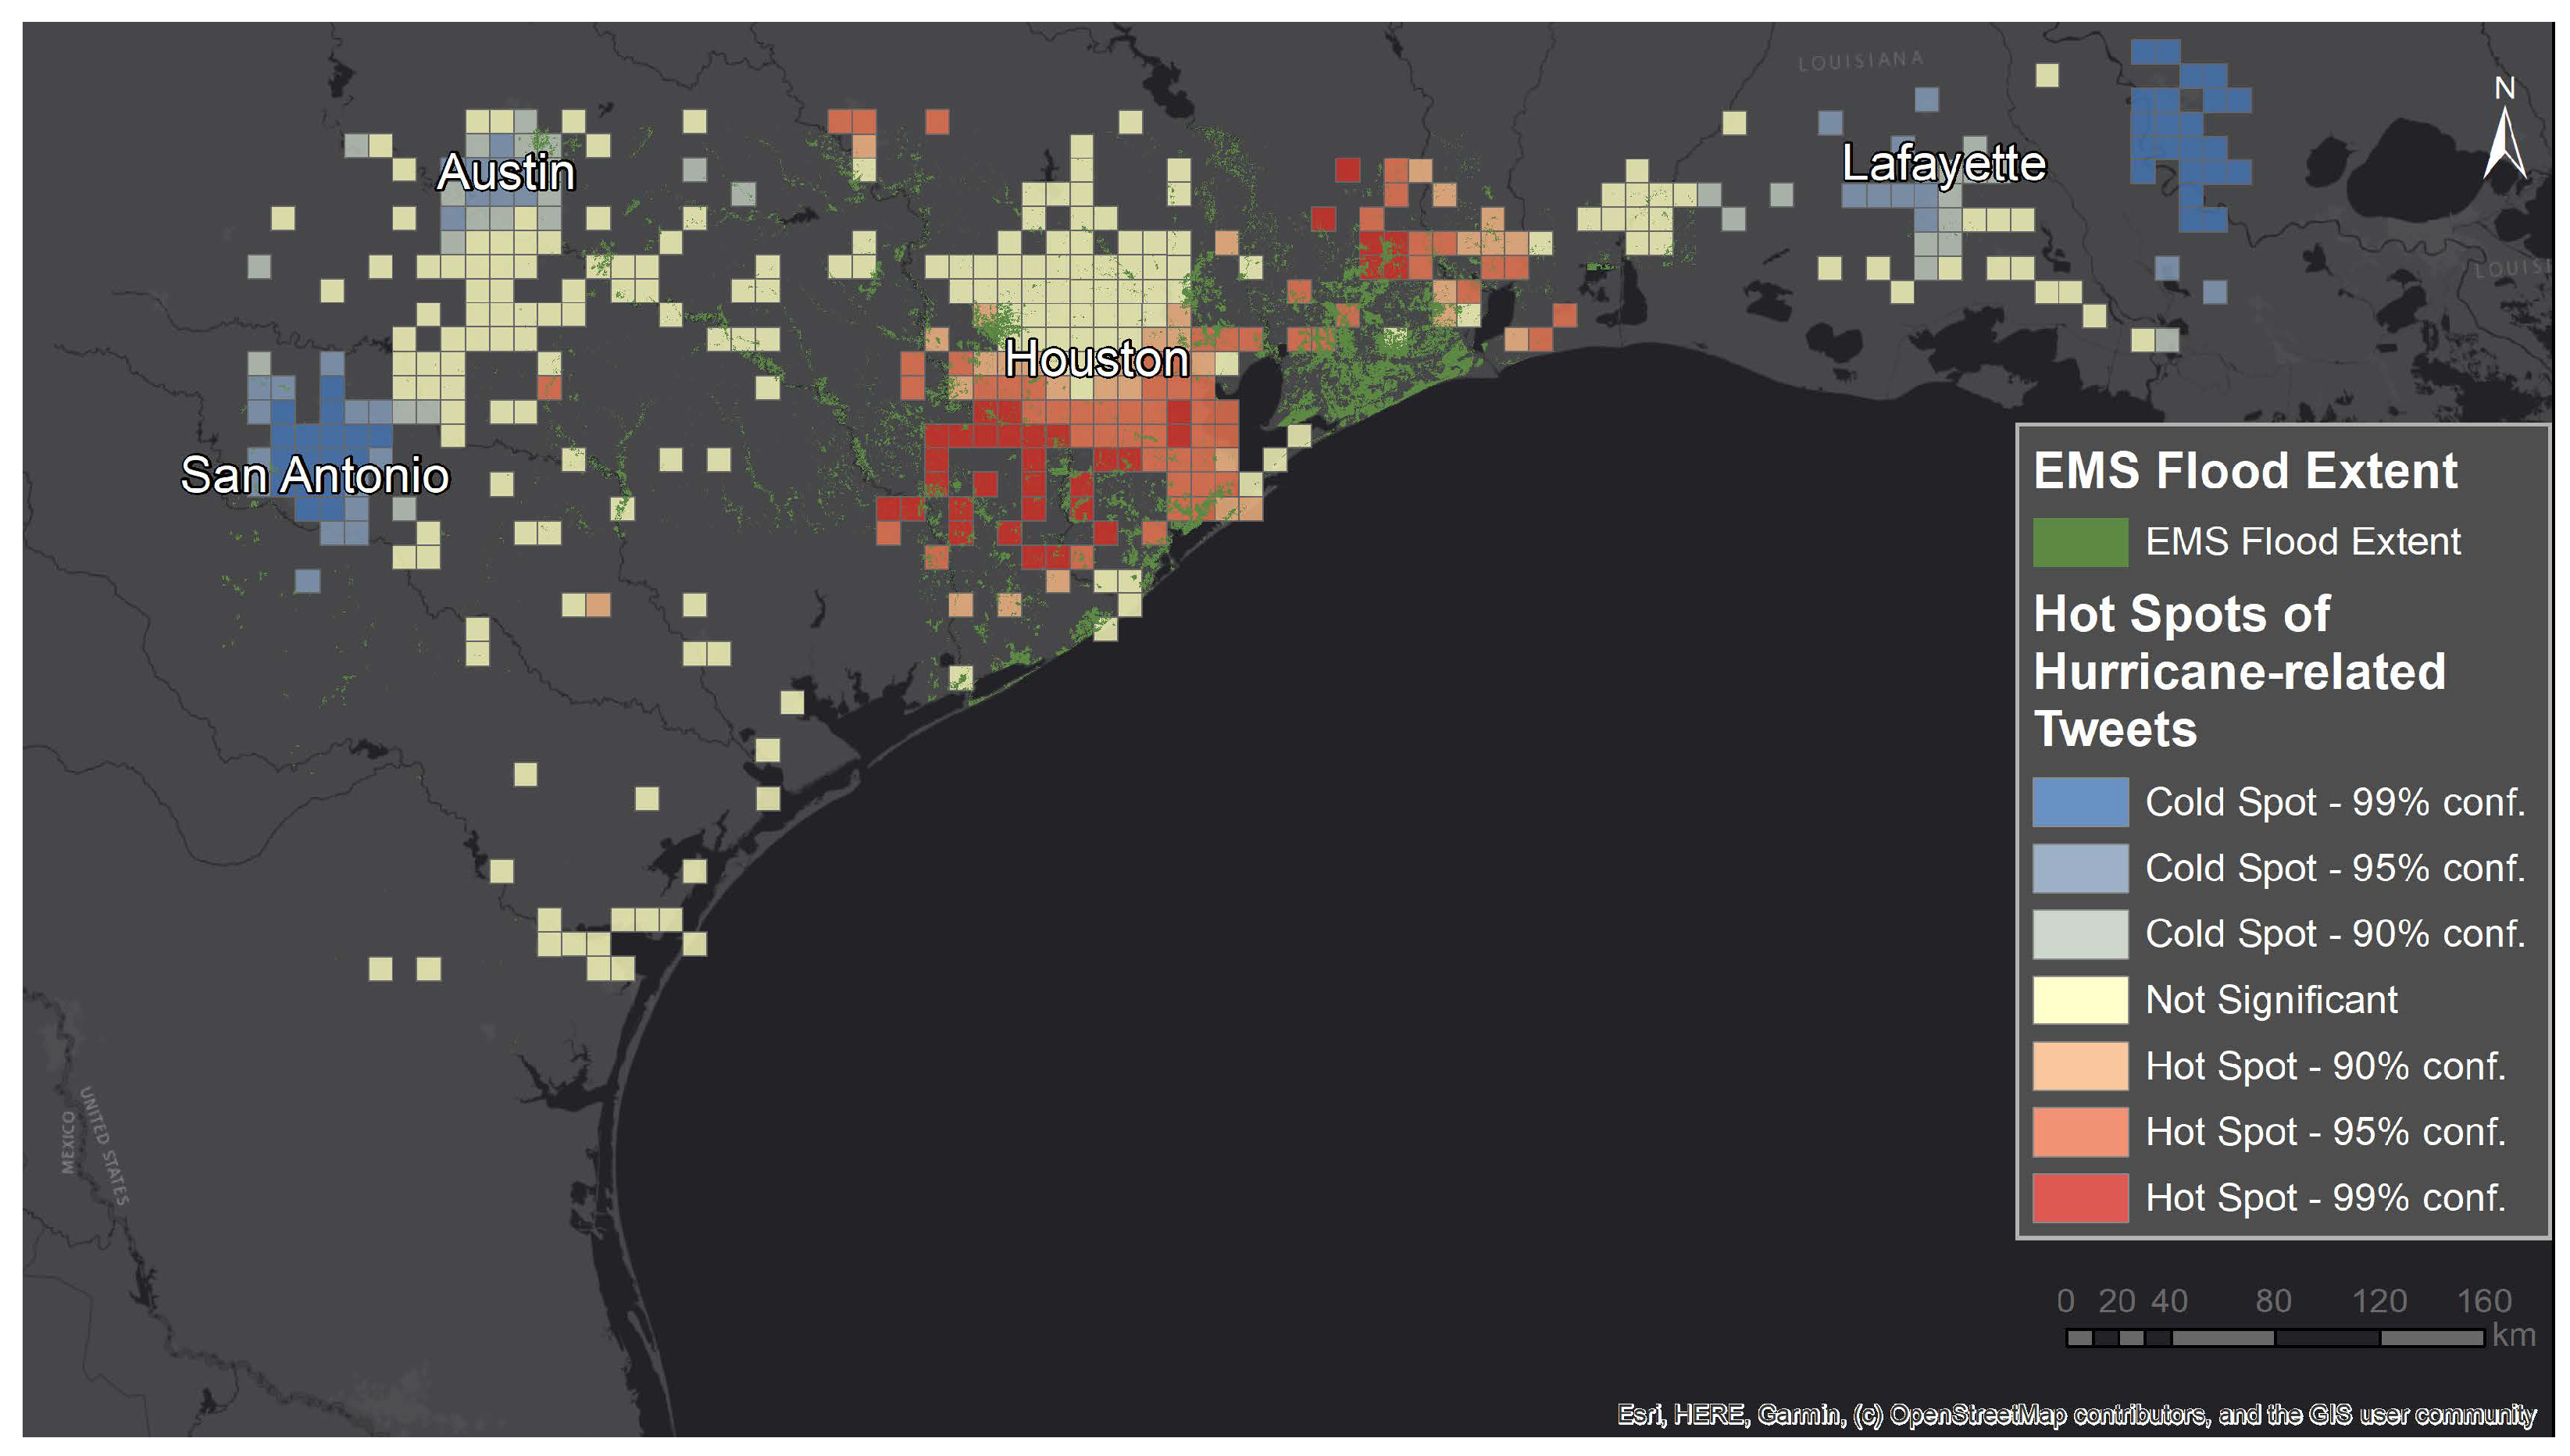
The geospatial visualization of hot and cold spots reveals an impressive alignment with the actual, official disaster footprints when computed based on the automatically extracted Tweets with GLDA V2. Correctly distinguishing between affected and non-affected areas allows to direct aid and rescue efforts to places where help is needed, and not to densely populated, urban areas by default.
Concerning the generalizability of these observations, experiments with further datasets and different events would be needed. Future experiments could also serve to investigate the effect of multilingualism on our approach. As both catastrophes took place in the United States, the predominant number of Tweets is in English. Although LDA can model topics over documents in different languages, more sophisticated topic models have been introduced to explicitly handle multilingualism. Existing methods for multilingual topic modeling [
46] would need to be adapted to also handle seed words.
In this study, the Twitter dataset was collected with a geo-crawler software that can crawl the Streaming and REST API of Twitter besides multiple other social media network APIs. Using the API, Tweets can currently be crawled up to a week back. In case of a natural disaster or other event, this allows for a comparison of two different days a week apart. For dates further back, online repositories such as the Internet Archive’s Twitter stream [
47] that collect data continuously can be consulted. Authorities or disaster response organizations might even have an interest in monitoring a geographic region by crawling the data regularly by themselves.
The geo-crawler focuses on geo-referenced social media posts that can include the precise coordinates of a GPS-enabled device. Although in June 2019, Twitter announced a fundamental change in adding precise location information to a Tweet [
48], Tweets with precise geolocation information still can be collected. Furthermore, the extraction of location information from text has made substantial progress in the last years and has consequently opened new opportunities for geospatial analysis on Twitter data [
49,
50,
51]. Therefore, the methodology developed in this paper can also be applied to other use cases which has been tested with success outside the scope of this study.
Author Contributions
Conceptualization, C.F., C.H., B.R. and S.W.; methodology, C.F., E.B., S.W.; software, C.F., C.H., E.B.; validation, C.F., C.H. and E.B.; formal analysis, C.F., C.H. and E.B.; investigation, C.F., C.H. and E.B.; data curation, C.H. and E.B.; writing–original draft preparation, C.F.; writing–review and editing, C.F., C.H., E.B., B.R. and S.W.; visualization, C.F., C.H.; supervision, B.R. and S.W.; project administration, B.R. and S.W.; funding acquisition, B.R. and S.W.; All authors have read and agreed to the published version of the manuscript.
Funding
This study has been carried out in the HUMAN+ project, which has been funded by the Austrian security research programme KIRAS of the Federal Ministry of Agriculture, Regions and Tourism (BMLRT), project number 865697. Additional funding was granted by the European Regional Development Fund (ERDF) for project number AB215 in the INTERREG program Austria-Bavaria 2014-2020.
Acknowledgments
We would like to thank Harvard University’s Center for Geographic Analysis for their support by providing us with the Twitter data for our study.
Conflicts of Interest
The authors declare no conflict of interest.
References
- Hodge, K. Techradar 10 News Stories That Broke on Twitter First. Available online: https://www.techradar.com/news/world-of-tech/internet/10-news-stories-that-broke-on-twitter-first-719532 (accessed on 24 July 2020).
- Internet Live Stats. Twitter Usage Statistics. Available online: https://www.internetlivestats.com/twitter-statistics/ (accessed on 24 July 2020).
- Wang, H.; Can, D.; Kazemzadeh, A.; Bar, F.; Narayanan, S. A system for real-time twitter sentiment analysis of 2012 us presidential election cycle. In Proceedings of the ACL 2012 System Demonstrations, Stroudsburg, PA, USA, 8–14 July 2012; pp. 115–120. [Google Scholar]
- Alsaedi, N.; Burnap, P.; Rana, O. Can We Predict a Riot? Disruptive Event Detection Using Twitter. ACM Trans. Internet Technol. 2017, 17, 1–26. [Google Scholar] [CrossRef] [Green Version]
- Resch, B.; Summa, A.; Zeile, P.; Strube, M. Citizen-centric Urban Planning through Extracting Emotion Information from Twitter in an Interdisciplinary Space-time-linguistics Algorithm. Urban Plan. 2016, 1, 114–127. [Google Scholar] [CrossRef]
- Niles, M.T.; Emery, B.F.; Reagan, A.J.; Dodds, P.S.; Danforth, C.M. Social Media Usage Patterns During Natural Hazards. PLoS ONE 2019, 14, e0210484. [Google Scholar] [CrossRef] [PubMed]
- Sakaki, T.; Okazaki, M.; Matsuo, Y. Earthquake shakes Twitter users: Real-time event detection by social sensors. In Proceedings of the 19th international conference on World Wide Web, Raleigh, NC, USA, 26–30 April 2010; pp. 851–860. [Google Scholar]
- Resch, B. People as Sensors and Collective Sensing-contextual Observations Complementing Geo-sensor Network Measurements. In Progress in Location-Based Services; Springer: New York, NY, USA, 2013; pp. 391–406. [Google Scholar]
- Havas, C.; Resch, B.; Francalanci, C.; Pernici, B.; Scalia, G.; Fernandez-Marquez, J.; Van Achte, T.; Zeug, G.; Mondardini, M.; Grandoni, D.; et al. E2mc: Improving Emergency Management Service Practice through Social Media and Crowdsourcing Analysis in Near Real time. Sensors 2017, 17, 2766. [Google Scholar] [CrossRef] [PubMed] [Green Version]
- Blei, D.M. Probabilistic Topic Models. Commun. ACM 2012, 55, 77–84. [Google Scholar] [CrossRef] [Green Version]
- Chang, J.; Gerrish, S.; Wang, C.; Boyd-Graber, J.L.; Blei, D.M. Reading Tea Leaves: How Humans Interpret Topic Models. In Advances in Neural Information Processing Systems; Bengio, Y., Schuurmans, D., Lafferty, J.D., Williams, C.K.I., Culotta, A., Eds.; Curran Associates, Inc.: Red Hook, NY, USA, 2009; pp. 288–296. [Google Scholar]
- Li, J.; Ge, Y.; Hong, Y.; Cheema, A.; Gu, B. Textual Review Dimensionality and Helpfulness: A Multi-Method Study. 2017. Available online: https://abstract=2931934 (accessed on 18 June 2020).
- Jagarlamudi, J.; Daumé, H., III; Udupa, R. Incorporating Lexical Priors into Topic Models. In Proceedings of the 13th Conference of the European Chapter of the Association for Computational Linguistics, Avignon, France, 23–27 April 2012; Association for Computational Linguistics: Stroudsburg, PA, USA, 2012; pp. 204–213. [Google Scholar]
- Andrzejewski, D.; Zhu, X. Latent Dirichlet Allocation with Topic-in-Set Knowledge. In Proceedings of the NAACL HLT 2009 Workshop on Semi-Supervised Learning for Natural Language Processing, Boulder, Colorado, 4 June 2009; pp. 43–48. [Google Scholar]
- Hu, Y.; Boyd-Graber, J. Efficient Tree-based Topic Modeling. In Proceedings of the 50th Annual Meeting of the Association for Computational Linguistics: Short Papers-Volume 2, Jeju Island, Korea, 8–14 July 2012; Association for Computational Linguistics: Boulder, Colorado, 2012; pp. 275–279. [Google Scholar]
- Xie, P.; Yang, D.; Xing, E. Incorporating Word Correlation Knowledge into Topic Modeling. In Proceedings of the 2015 Conference of the North American Chapter of the Association for Computational Linguistics: Human Language Technologies, Denver, CO, USA, 31 May–5 June 2015; pp. 725–734. [Google Scholar]
- Guan, X.; Chen, C. Using Social Media Data to Understand and Assess Disasters. Nat. Hazards 2014, 74, 837–850. [Google Scholar] [CrossRef]
- Gründer-Fahrer, S.; Schlaf, A.; Wiedemann, G.; Heyer, G. Topics and topical phases in German social media communication during a disaster. Nat. Lang. Eng. 2018, 24, 221–264. [Google Scholar] [CrossRef]
- Blei, D.M.; Ng, A.Y.; Jordan, M.I. Latent Dirichlet Allocation. J. Mach. Learn. Res. 2003, 3, 993–1022. [Google Scholar]
- Hoffman, M.; Bach, F.R.; Blei, D.M. Online Learning for Latent Dirichlet Allocation. In Advances in Neural Information Processing Systems; Lafferty, J.D., Williams, C.K.I., Shawe-Taylor, J., Zemel, R.S., Culotta, A., Eds.; Curran Associates, Inc.: Red Hook, NY, USA, 2010; pp. 856–864. [Google Scholar]
- Bishop, C.M. Pattern Recognition and Machine Learning; Springer: New York, NY, USA, 2006. [Google Scholar]
- Mimno, D.; Wallach, H.M.; Talley, E.; Leenders, M.; McCallum, A. Optimizing Semantic Coherence in Topic Models. In Proceedings of the Conference on Empirical Methods in Natural Language Processing, Edinburgh, UK, 27–31 July 2011; Association for Computational Linguistics: Stroudsburg, PA, USA, 2011; pp. 262–272. [Google Scholar]
- Stevens, K.; Kegelmeyer, P.; Andrzejewski, D.; Buttler, D. Exploring Topic Coherence Over Many Models and Many Topics. In Proceedings of the 2012 Joint Conference on Empirical Methods in Natural Language Processing and Computational Natural Language Learning, Jeju Island, Korea, 12–14 July 2012; pp. 952–961. [Google Scholar]
- Wang, S.; Chen, Z.; Fei, G.; Liu, B.; Emery, S. Targeted Topic Modeling for Focused Analysis. In Proceedings of the 22nd ACM SIGKDD International Conference on Knowledge Discovery and Data Mining, San Francisco, CA, USA, 13–17 August 2016; pp. 1235–1244. [Google Scholar]
- Kireyev, K.; Palen, L.; Anderson, K. Applications of Topics Models to Analysis of Disaster-related Twitter Data. In NIPS Workshop on Applications for Topic Models: Text and Beyond; JMLR.org: Whistler, BC, Canada, 2009; Volume 1. [Google Scholar]
- Resch, B.; Usländer, F.; Havas, C. Combining Machine-learning Topic Models and Spatiotemporal Analysis of Social Media Data for Disaster Footprint and Damage Assessment. Cartogr. Geogr. Inf. Sci. 2018, 45, 362–376. [Google Scholar] [CrossRef] [Green Version]
- Imran, M.; Castillo, C. Towards a Data-driven Approach to Identify Crisis-related Topics in Social Media Streams. In Proceedings of the 24th ACM International Conference on World Wide Web, Florence, Italy, 18–22 May 2015; pp. 1205–1210. [Google Scholar]
- Blei, D.M.; McAuliffe, J.D. Supervised topic models. In Proceedings of the 20th International Conference on Neural Information Processing Systems, Vancouver, BC, Canada, 3–7 December 2007; pp. 121–128. [Google Scholar]
- Ashktorab, Z.; Brown, C.; Nandi, M.; Culotta, A. Tweedr: Mining Twitter to Inform Disaster Response. In Proceedings of the 11th International Conference on Information Systems for Crisis Response and Management, University Park, PA, USA, 18–21 May 2014; ISCRAM Association: Centre County, PA, USA, 2014. [Google Scholar]
- Kirsch, B.; Giesselbach, S.; Knodt, D.; Rüping, S. Robust End-User-Driven Social Media Monitoring for Law Enforcement and Emergency Monitoring. In Community-Oriented Policing and Technological Innovations; Leventakis, G., Haberfeld, M.R., Eds.; Springer International Publishing: Cham, Switzerland, 2018; pp. 29–36. [Google Scholar]
- Yang, M.; Mei, J.; Ji, H.; Zhao, W.; Zhao, Z.; Chen, X. Identifying and Tracking Sentiments and Topics from Social Media Texts during Natural Disasters. In Proceedings of the 2017 Conference on Empirical Methods in Natural Language Processing, Copenhagen, Denmark, 9–11 September 2017; Association for Computational Linguistics: Copenhagen, Denmark, 2017; pp. 527–533. [Google Scholar]
- Twitter. Docs—Twitter Developer. Available online: https://developer.twitter.com/en/docs (accessed on 24 July 2020).
- Carter, W.N. Disaster Management: A Disaster Manager’s Handbook; Asian Development Bank: Metro Manila, Philippines, 2008. [Google Scholar]
- Pedregosa, F.; Varoquaux, G.; Gramfort, A.; Michel, V.; Thirion, B.; Grisel, O.; Blondel, M.; Prettenhofer, P.; Weiss, R.; Dubourg, V.; et al. Scikit-learn: Machine Learning in Python. J. Mach. Learn. Res. 2011, 12, 2825–2830. [Google Scholar]
- Denny, M.J.; Spirling, A. Text Preprocessing for Unsupervised Learning: Why It Matters, When It Misleads, and What to Do About It. Political Anal. 2018, 26, 168–189. [Google Scholar] [CrossRef] [Green Version]
- Maier, D.; Waldherr, A.; Miltner, P.; Wiedemann, G.; Niekler, A.; Keinert, A.; Pfetsch, B.; Heyer, G.; Reber, U.; Häussler, T.; et al. Applying LDA Topic Modeling in Communication Research: Toward a Valid and Reliable Methodology. Commun. Methods Meas. 2018, 12, 93–118. [Google Scholar] [CrossRef]
- Van Oldenborgh, G.J.; van der Wiel, K.; Sebastian, A.; Singh, R.; Arrighi, J.; Otto, F.; Haustein, K.; Li, S.; Vecchi, G.; Cullen, H. Attribution of Extreme Rainfall from Hurricane Harvey, August 2017. Environ. Res. Lett. 2017, 12, 124009. [Google Scholar] [CrossRef]
- Lin, T.; Tian, W.; Mei, Q.; Cheng, H. The Dual-sparse Topic Model: Mining Focused Topics and Focused Terms in Short Text. In Proceedings of the 23rd ACM International Conference on World Wide Web, Seoul, Korea, 7–11 April 2014; pp. 539–550. [Google Scholar]
- Zhao, W.X.; Jiang, J.; Weng, J.; He, J.; Lim, E.P.; Yan, H.; Li, X. Comparing Twitter and Traditional Media using Topic Models. In European Conference on Information Retrieval; Springer: New York, NY, USA, 2011; pp. 338–349. [Google Scholar]
- Manning, C.; Raghavan, P.; Schütze, H. Introduction to Information Retrieval. Nat. Lang. Eng. 2010, 16, 100–103. [Google Scholar]
- Wong, D.W.S.; Lee, J. Statistical Analysis of Geographic Information with ArcView GIS and ArcGIS; John Wiley & Sons: Hoboken, NJ, USA, 2005. [Google Scholar]
- Ord, J.K.; Getis, A. Local Spatial Autocorrelation Statistics: Distributional Issues and an Application. Geogr. Anal. 1995, 27, 286–306. [Google Scholar] [CrossRef]
- US Geological Survey. Earthquake Hazards Program. Available online: https://earthquake.usgs.gov/earthquakes/eventpage/nc72282711/executive#general_executive (accessed on 18 June 2020).
- US Geological Survey. The Modified Mercalli Intensity Scale. Available online: https://www.usgs.gov/natural-hazards/earthquake-hazards/science/modified-mercalli-intensity-scale?qt-science_center_objects=0#qt-science_center_objects (accessed on 18 June 2020).
- COPERNICUS Emergency Management Service. COPERNICUS EMS-Mapping. EMSR229: Hurricane Harvey in Texas. Available online: https://emergency.copernicus.eu/mapping/list-of-components/EMSR229 (accessed on 18 June 2020).
- Boyd-Graber, J.; Blei, D.M. Multilingual Topic Models for Unaligned Text. In Proceedings of the Twenty-Fifth Conference on Uncertainty in Artificial Intelligence, Montreal, QC, Canada, 18–21 June 2009; AUAI Press: Arlington, VA, USA, 2009; pp. 75–82. [Google Scholar]
- Internet Archive. Archive Team: The Twitter Stream Grab. Available online: https://archive.org/details/twitterstream (accessed on 24 July 2020).
- Twitter Support. Announcement. Available online: https://twitter.com/TwitterSupport/status/1141039841993355264?s=20 (accessed on 24 July 2020).
- Kumar, A.; Singh, J.P. Location Reference Identification from Tweets during Emergencies: A Deep Learning Approach. Int. J. Disaster Risk Reduct. 2019, 33, 365–375. [Google Scholar] [CrossRef] [Green Version]
- Limsopatham, N.; Collier, N. Bidirectional LSTM for Named Entity Recognition in Twitter Messages. In Proceedings of the 2nd Workshop on Noisy User-generated Text (WNUT), Osaka, Japan, 11 December 2016; pp. 145–152. [Google Scholar]
- Inkpen, D.; Liu, J.; Farzindar, A.; Kazemi, F.; Ghazi, D. Location Detection and Disambiguation from Twitter Messages. J. Intell. Inf. Syst. 2017, 49, 237–253. [Google Scholar] [CrossRef]
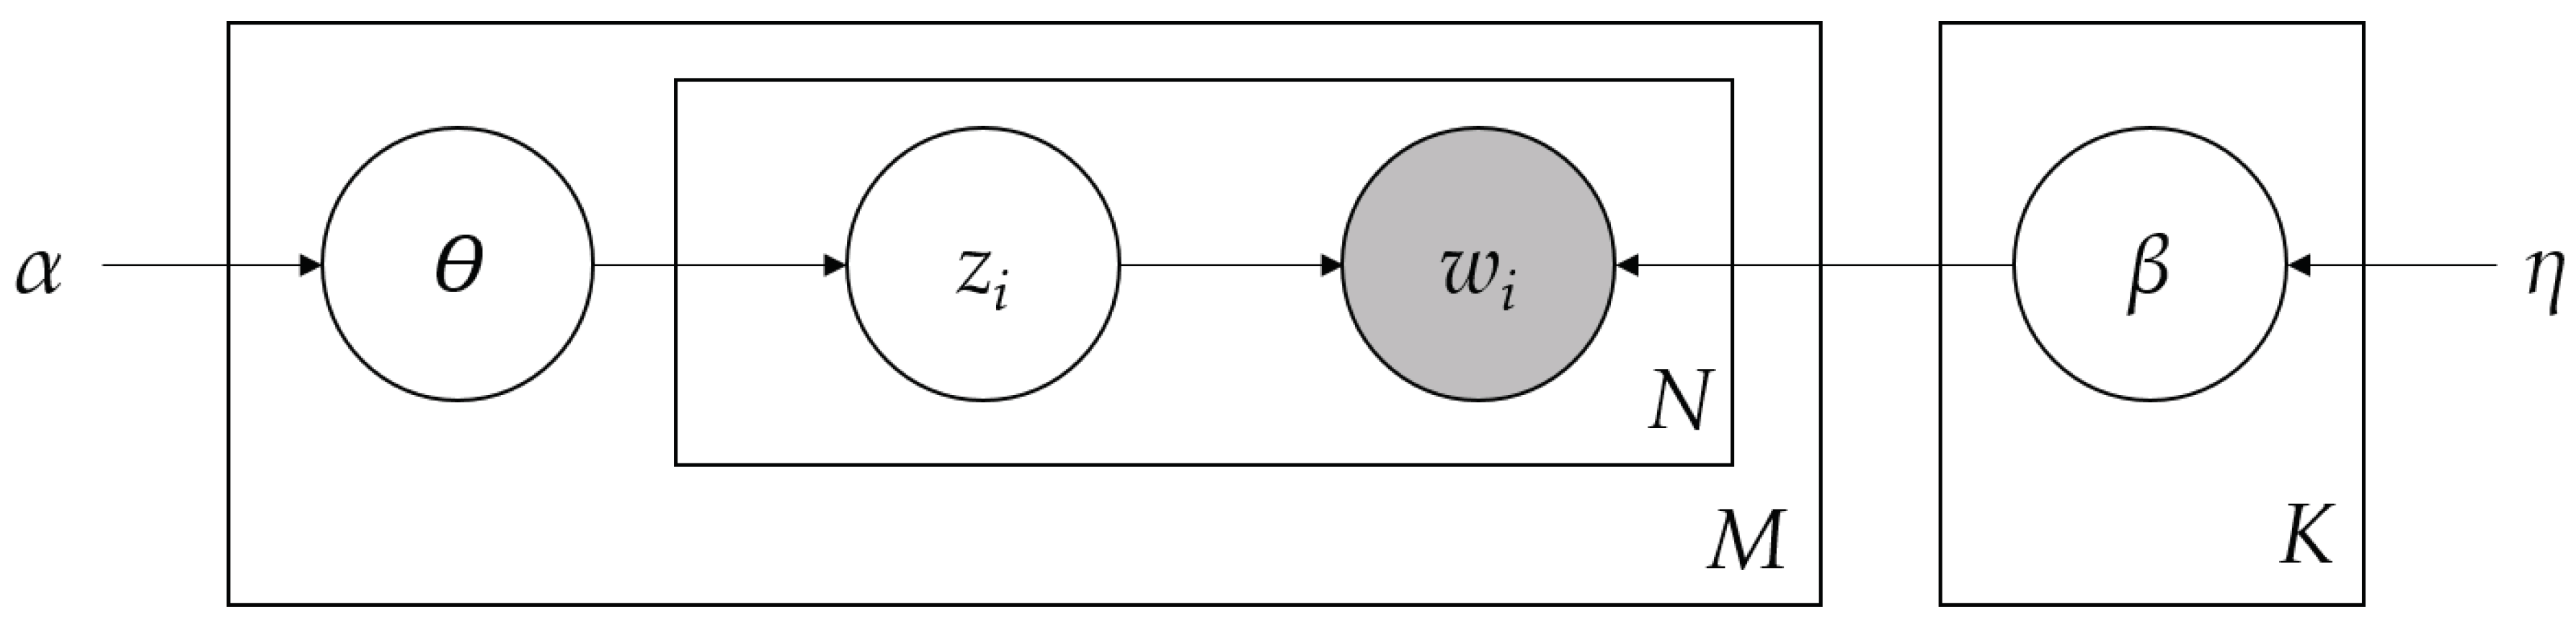
Figure 1.
Plate notation of the LDA (based on [
19]). The shaded node represents the observed variable, a word
in a document. The latent variables
for the topic assignment,
for the document-topic distribution and
for the topic-term distribution are shown as clear nodes.
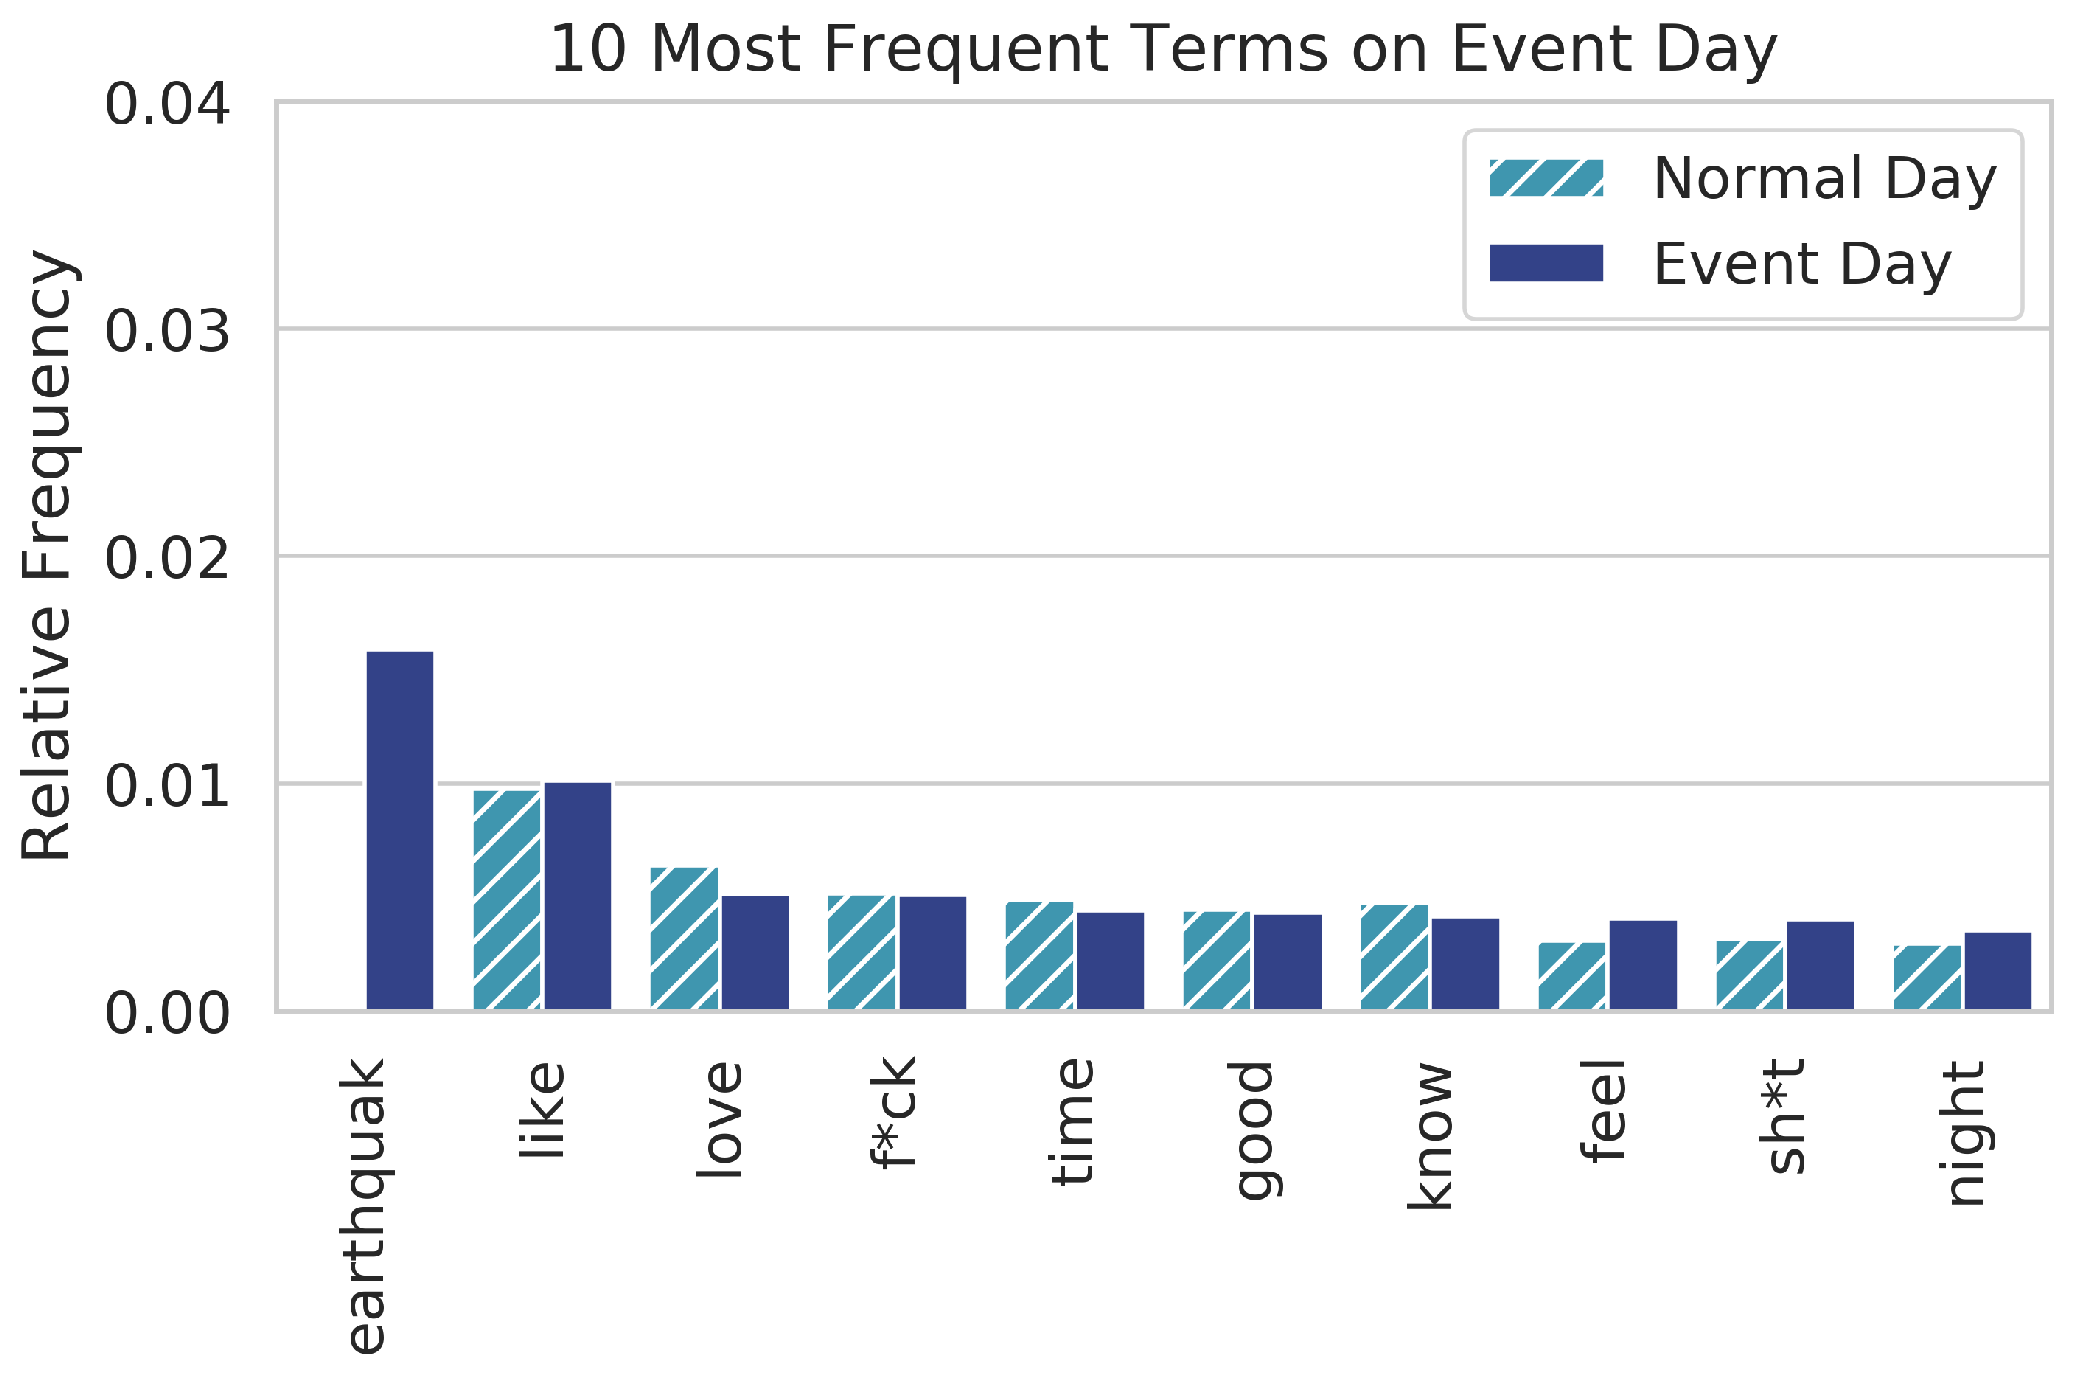
Figure 2.
Relative frequency of the ten most frequent terms in the earthquake dataset on the day of the event compared to their relative frequency in the comparison dataset of a normal day.
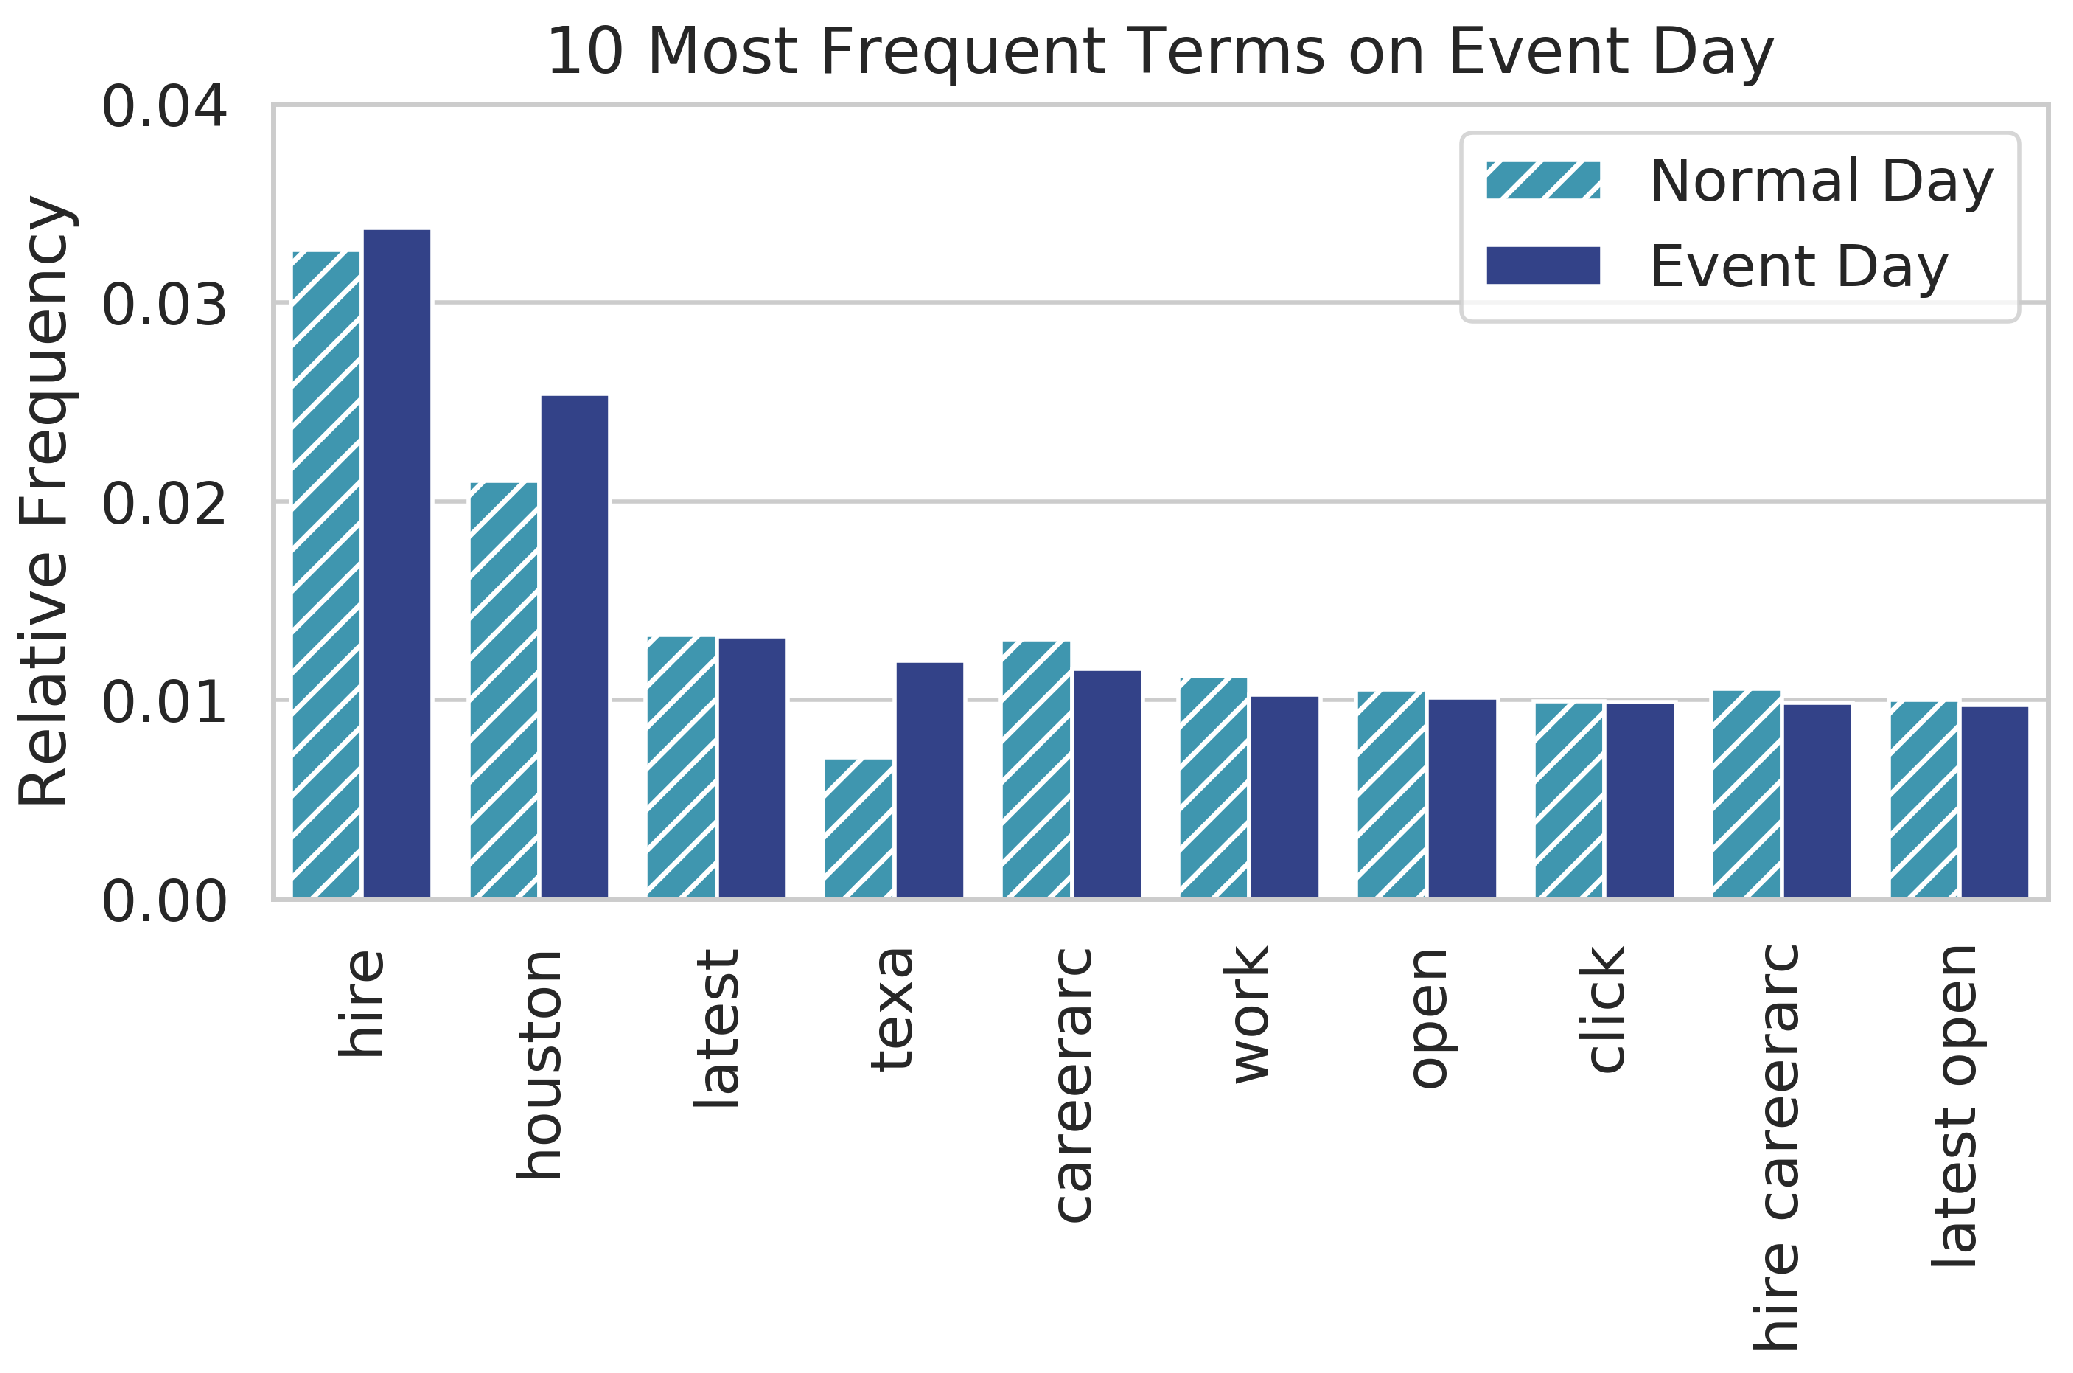
Figure 3.
Relative frequency of the ten most frequent terms in the hurricane dataset on the day of the event compared to their relative frequency in the comparison dataset of a normal day.
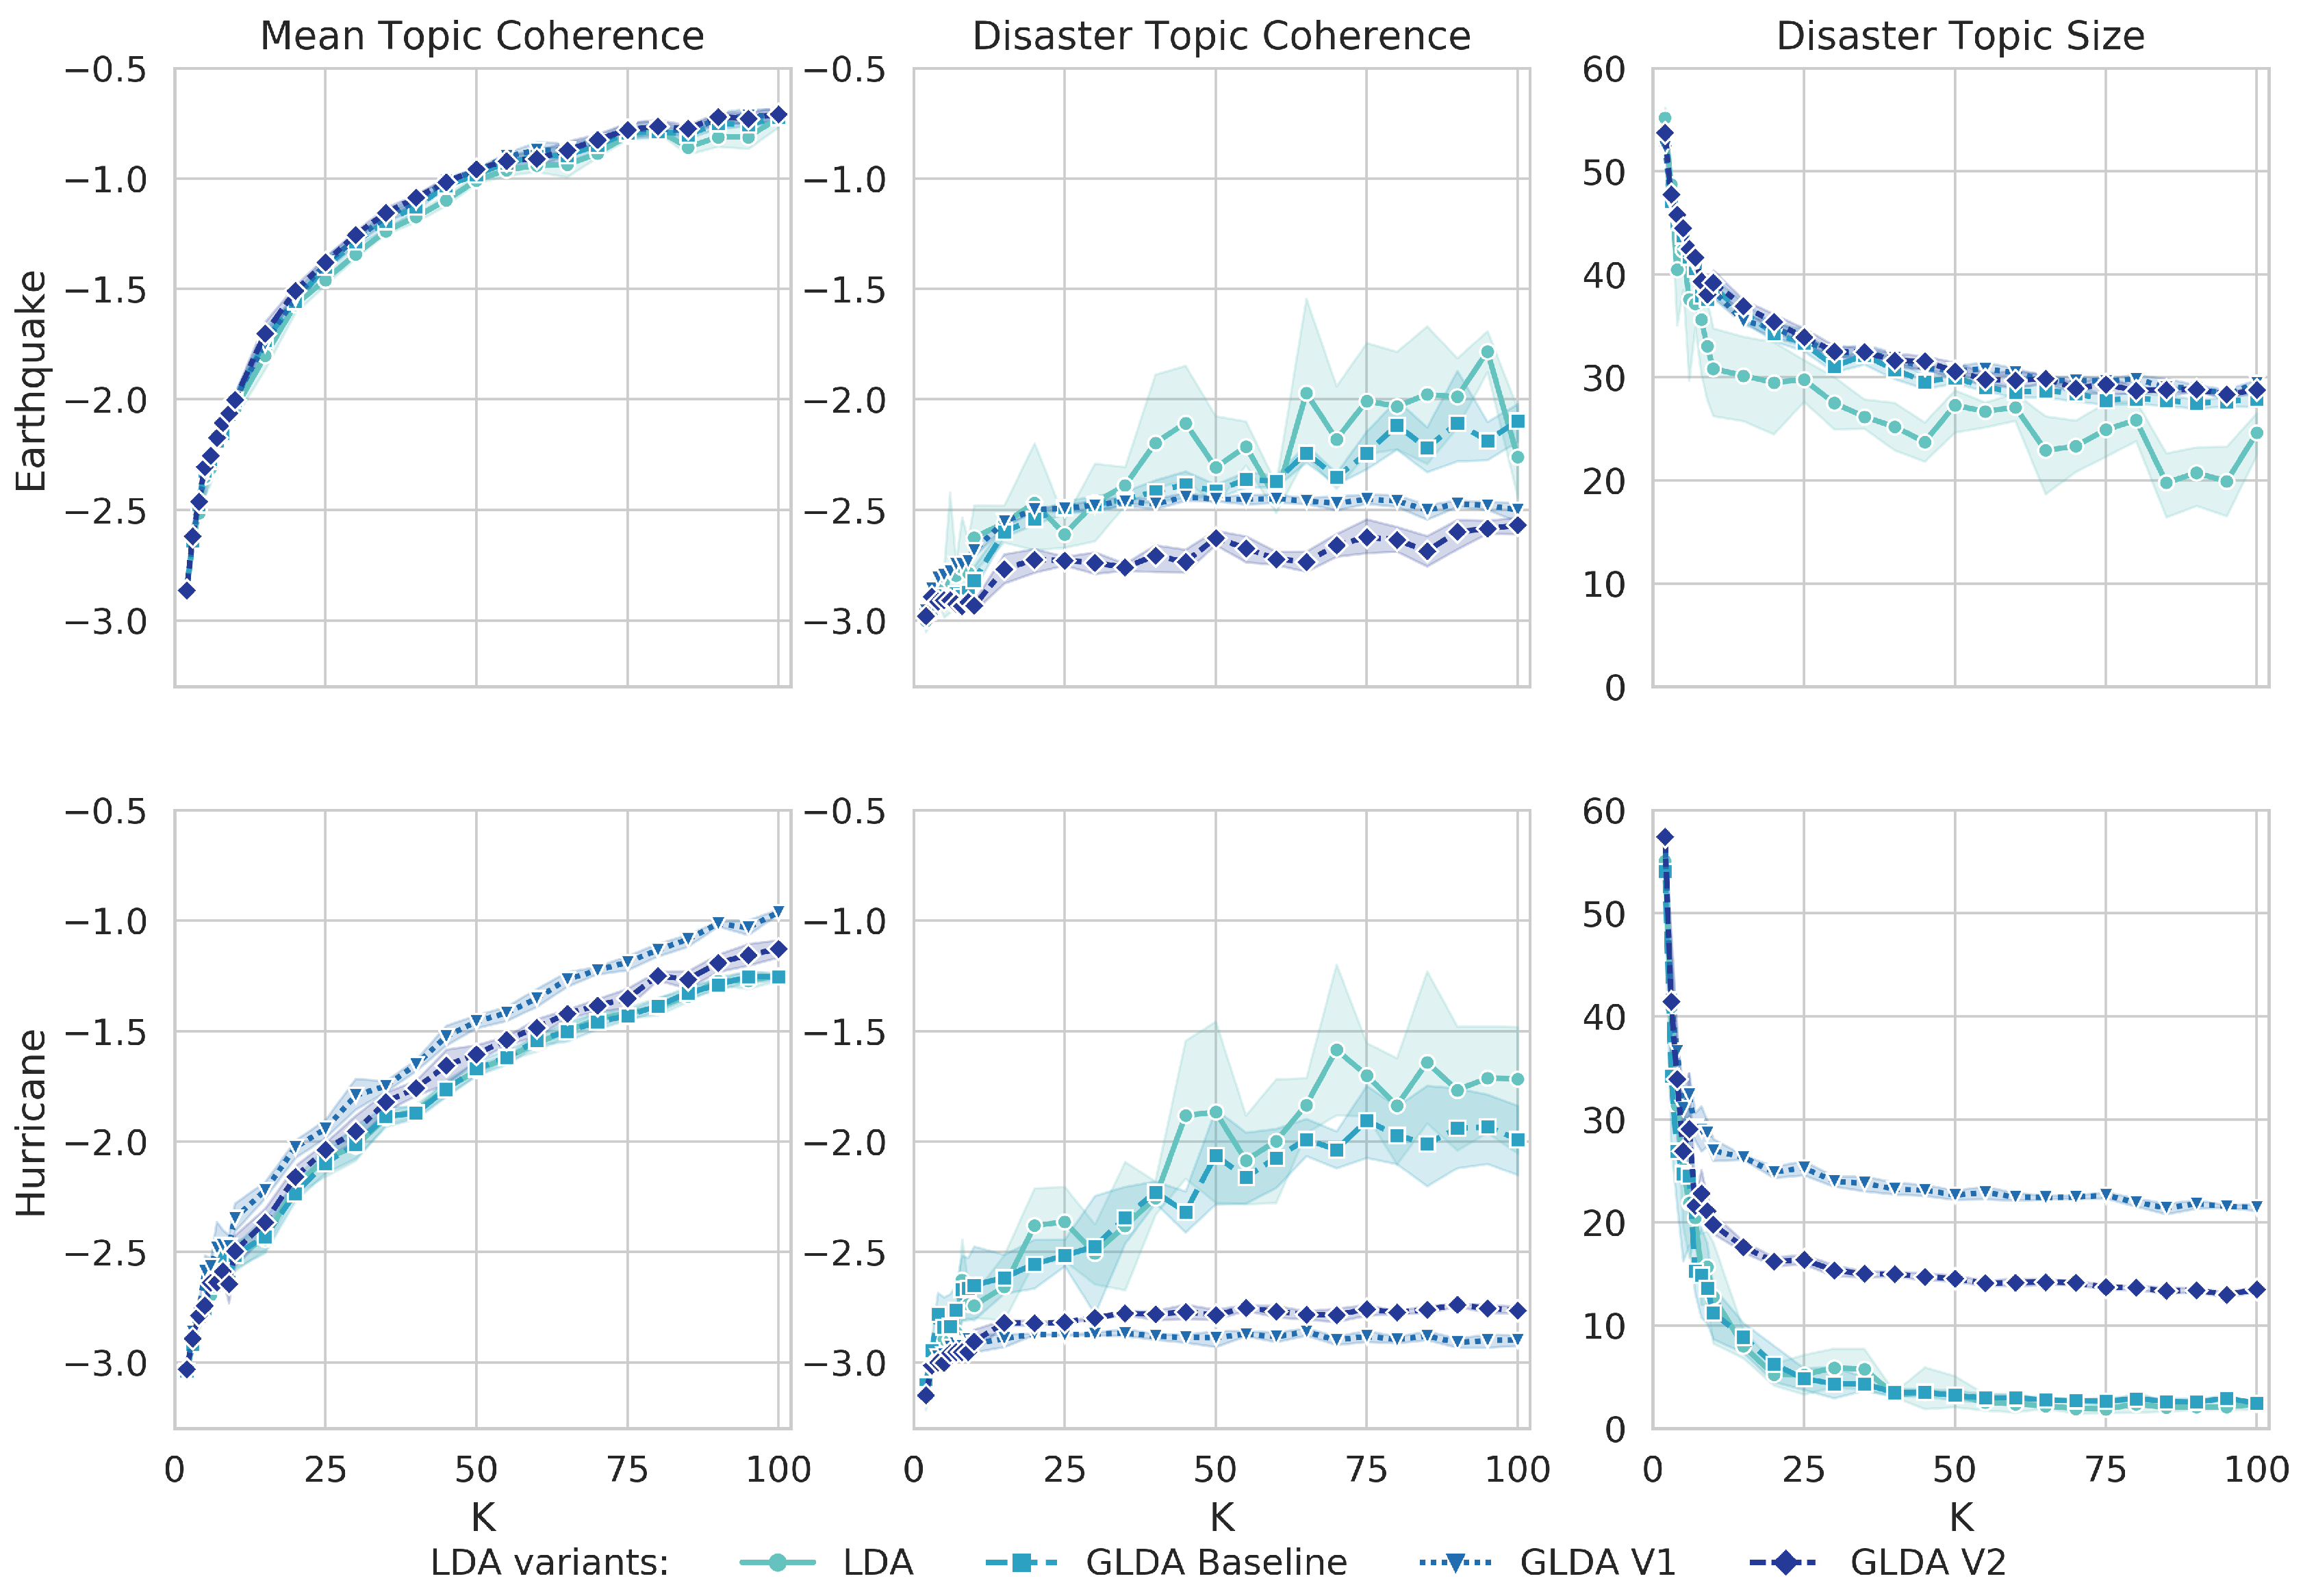
Figure 4.
Average coherence over all topics (left), topic coherence for the disaster topic (middle) and the percentage of Tweets from the test set remaining in the disaster topic (right) for all four model variants and varying numbers of topics K. Markers indicate the mean over five runs with same K, while the upper and lower limits refer to the 95% confidence interval.
Figure 5.
Results of the Tweet classification on the test set: score (left), recall (middle) and precision (right) for all four model variants and varying numbers of topics K. Markers indicate the mean over five runs with same K, while the upper and lower limits refer to the 95% confidence interval.
Figure 6.
Earthquake hot and cold spots obtained using plain LDA compared to the US Geological Survey (USGS) [
43] footprint measuring the intensity in per cent of the peak ground acceleration (PGA).
Figure 7.
Earthquake hot and cold spots obtained using GLDA V2 compared to the US Geological Survey (USGS) [
43] footprint measuring the intensity in per cent of the peak ground acceleration (PGA).
Figure 8.
Hurricane hot and cold spots obtained using plain LDA compared to COPERNICUS Emergency Management Service (EMS) [
45] mapping data depicting flooded areas six days after the landfall.
Figure 9.
Hurricane hot and cold spots obtained using GLDA V2 compared to COPERNICUS Emergency Management Service (EMS) [
45] mapping data depicting flooded areas six days after the landfall.
Table 1.
Fictitious example to illustrate the output of a normal, unseeded (left) and a guided LDA (right). The five topics could be detected by a topic model in a dataset containing Tweets related to an earthquake. Note that for guided LDA, all earthquake-related terms are in a single topic ➀, whereas the event is covered in the topics ➁, ➃, ➄ by the LDA.
| LDA | Guided LDA |
|---|
| ➀ love thank happy | ➀ earthquake sleep damage |
| ➁ earthquake woke felt | ➁ show watch life |
| ➂ game stadium sunday | ➂ game stadium today |
| ➃ earthquake last night | ➃ school tomorrow start |
| ➄ damage street hope | ➄ love thank happy |
Table 2.
Comparison of our approach (bottom) to related work concerning the methods used to incorporate prior information to the various model, dataset sizes and evaluation methods.
| Type | Authors | Model | Number of Tweets | Evaluation Method |
|---|
| manual selection | Resch et al. [26] | LDA | 95,000 | classification scores; spatial mapping |
| | Kireyev et al. [25] | LDA | 20,000 | qualitative analysis |
| manual labeling | Imran and Castillo [27] | LDA | 1000 | clustering scores (intra- and inter-similarity; volume) |
| | Ashktorab et al. [29] | sLDA | 1000 | classification scores ( score, precision, recall) |
| manually defined seed words | Kirsch et al. [30] | TTM | 10,000 | qualitative analysis |
| | Yang et al. [31] | LDST | 160,000 | spatial mapping |
| automatically defined seed words | Ferner et al. | GLDA | 95,000 (earthquake); 8000 (hurricane) | intrinsic analysis; classification scores; spatial mapping |
Table 3.
Results of the two proposed variants V1 (union vocabulary) and V2 (difference vocabulary) for automatically determining seed words on the earthquake dataset.
| V1 | V2 |
|---|
| earthquak | magnitud |
| napa | aftershock |
| felt | napaquak |
| quak | magnitud earthquak |
| woke | first earthquak |
| beyonc | felt earthquak |
| shake | feel earthquak |
| sleep | napa earthquak |
| california | earthquak last |
| voteso | earthquak woke |
Table 4.
Final set of seed words for the variants V1 (union vocabulary) and V2 (difference vocabulary) for the earthquake dataset. The number of seed words can differ as the biterms from
Table 3 are split up.
| Earthquake | V1 | earthquak, napa, felt, quak, woke, beyonc, shake, sleep, california, voteso |
| | V2 | magnitud, aftershock, napaquak, earthquak, first, felt, feel, napa, last, woke |
Table 5.
Results of the two proposed variants V1 (union vocabulary) and V2 (difference vocabulary) for automatically determining seed words on the hurricane dataset.
| V1 | V2 |
|---|
| flood | flood |
| hurricaneharvey | hurricaneharvey |
| harvey | harvey |
| texa | tornado |
| houston | hurrican |
| water | high water |
| rain | storm |
| houston texa | warn includ |
| tornado | close flood |
| hurrican | flash flood |
Table 6.
Final set of seed words for the variants V1 (union vocabulary) and V2 (difference vocabulary) for the hurricane dataset (bottom). The number of seed words can differ as the biterms from
Table 5 are split up.
| Hurricane | V1 | flood, hurricaneharvey, harvey, texa, houston, water, rain, tornado, hurrican |
| | V2 | flood, hurricaneharvey, harvey, tornado, hurrican, high, water, storm, warn, includ, close, flash |
Table 7.
Detailed classification results including precision and recall on the earthquake dataset (top) and the hurricane dataset (bottom) based on the best average score of the five runs for each variant.
| | Variant | K | Precision | Recall | score |
|---|
| Earthquake | LDA | 5 | 88.43% | 87.32% | 87.63% |
| | GLDA Baseline | 5 | 90.59% | 92.68% | 91.62% |
| | GLDA V1 | 5 | 90.31% | 92.71% | 91.49% |
| | GLDA V2 | 5 | 89.75% | 93.36% | 91.52% |
| Hurricane | LDA | 2 | 49.06% | 94.41% | 64.56% |
| | GLDA Baseline | 2 | 39.53% | 76.99% | 52.23% |
| | GLDA V1 | 6 | 70.58% | 79.72% | 74.77% |
| | GLDA V2 | 6 | 75.22% | 75.45% | 74.41% |
Table 8.
Top 10 terms in the disaster-related topic (i.e., highest probability in the topic-term matrix ) for both datasets based on the best value for K for the two automated variants GLDA V1 and V2. The ordering corresponds to the term probability. Terms that are unique for one variant are highlighted in italic.
| Earthquake | V1 | | earthquak, sleep, napa, felt, night, california, like, quak, feel, woke |
| | V2 | | earthquak, feel, last, night, napa, first, felt, like, california, sleep |
| Hurriance | V1 | | houston, texa, flood, hurricaneharvey, harvey, rain, traffic, water, tornado, close |
| | V2 | | houston, flood, hurricaneharvey, harvey, traffic, water, texa, tornado, close, high |
© 2020 by the authors. Licensee MDPI, Basel, Switzerland. This article is an open access article distributed under the terms and conditions of the Creative Commons Attribution (CC BY) license (http://creativecommons.org/licenses/by/4.0/).

 ,
, 


