
Early Stage Identification of COVID-19 Patients in Mexico Using Machine Learning: A Case Study for the Tijuana General Hospital

 , and
, and
Abstract
:1. Introduction
2. Background
3. Materials and Methods
3.1. Sample Size
3.2. Database
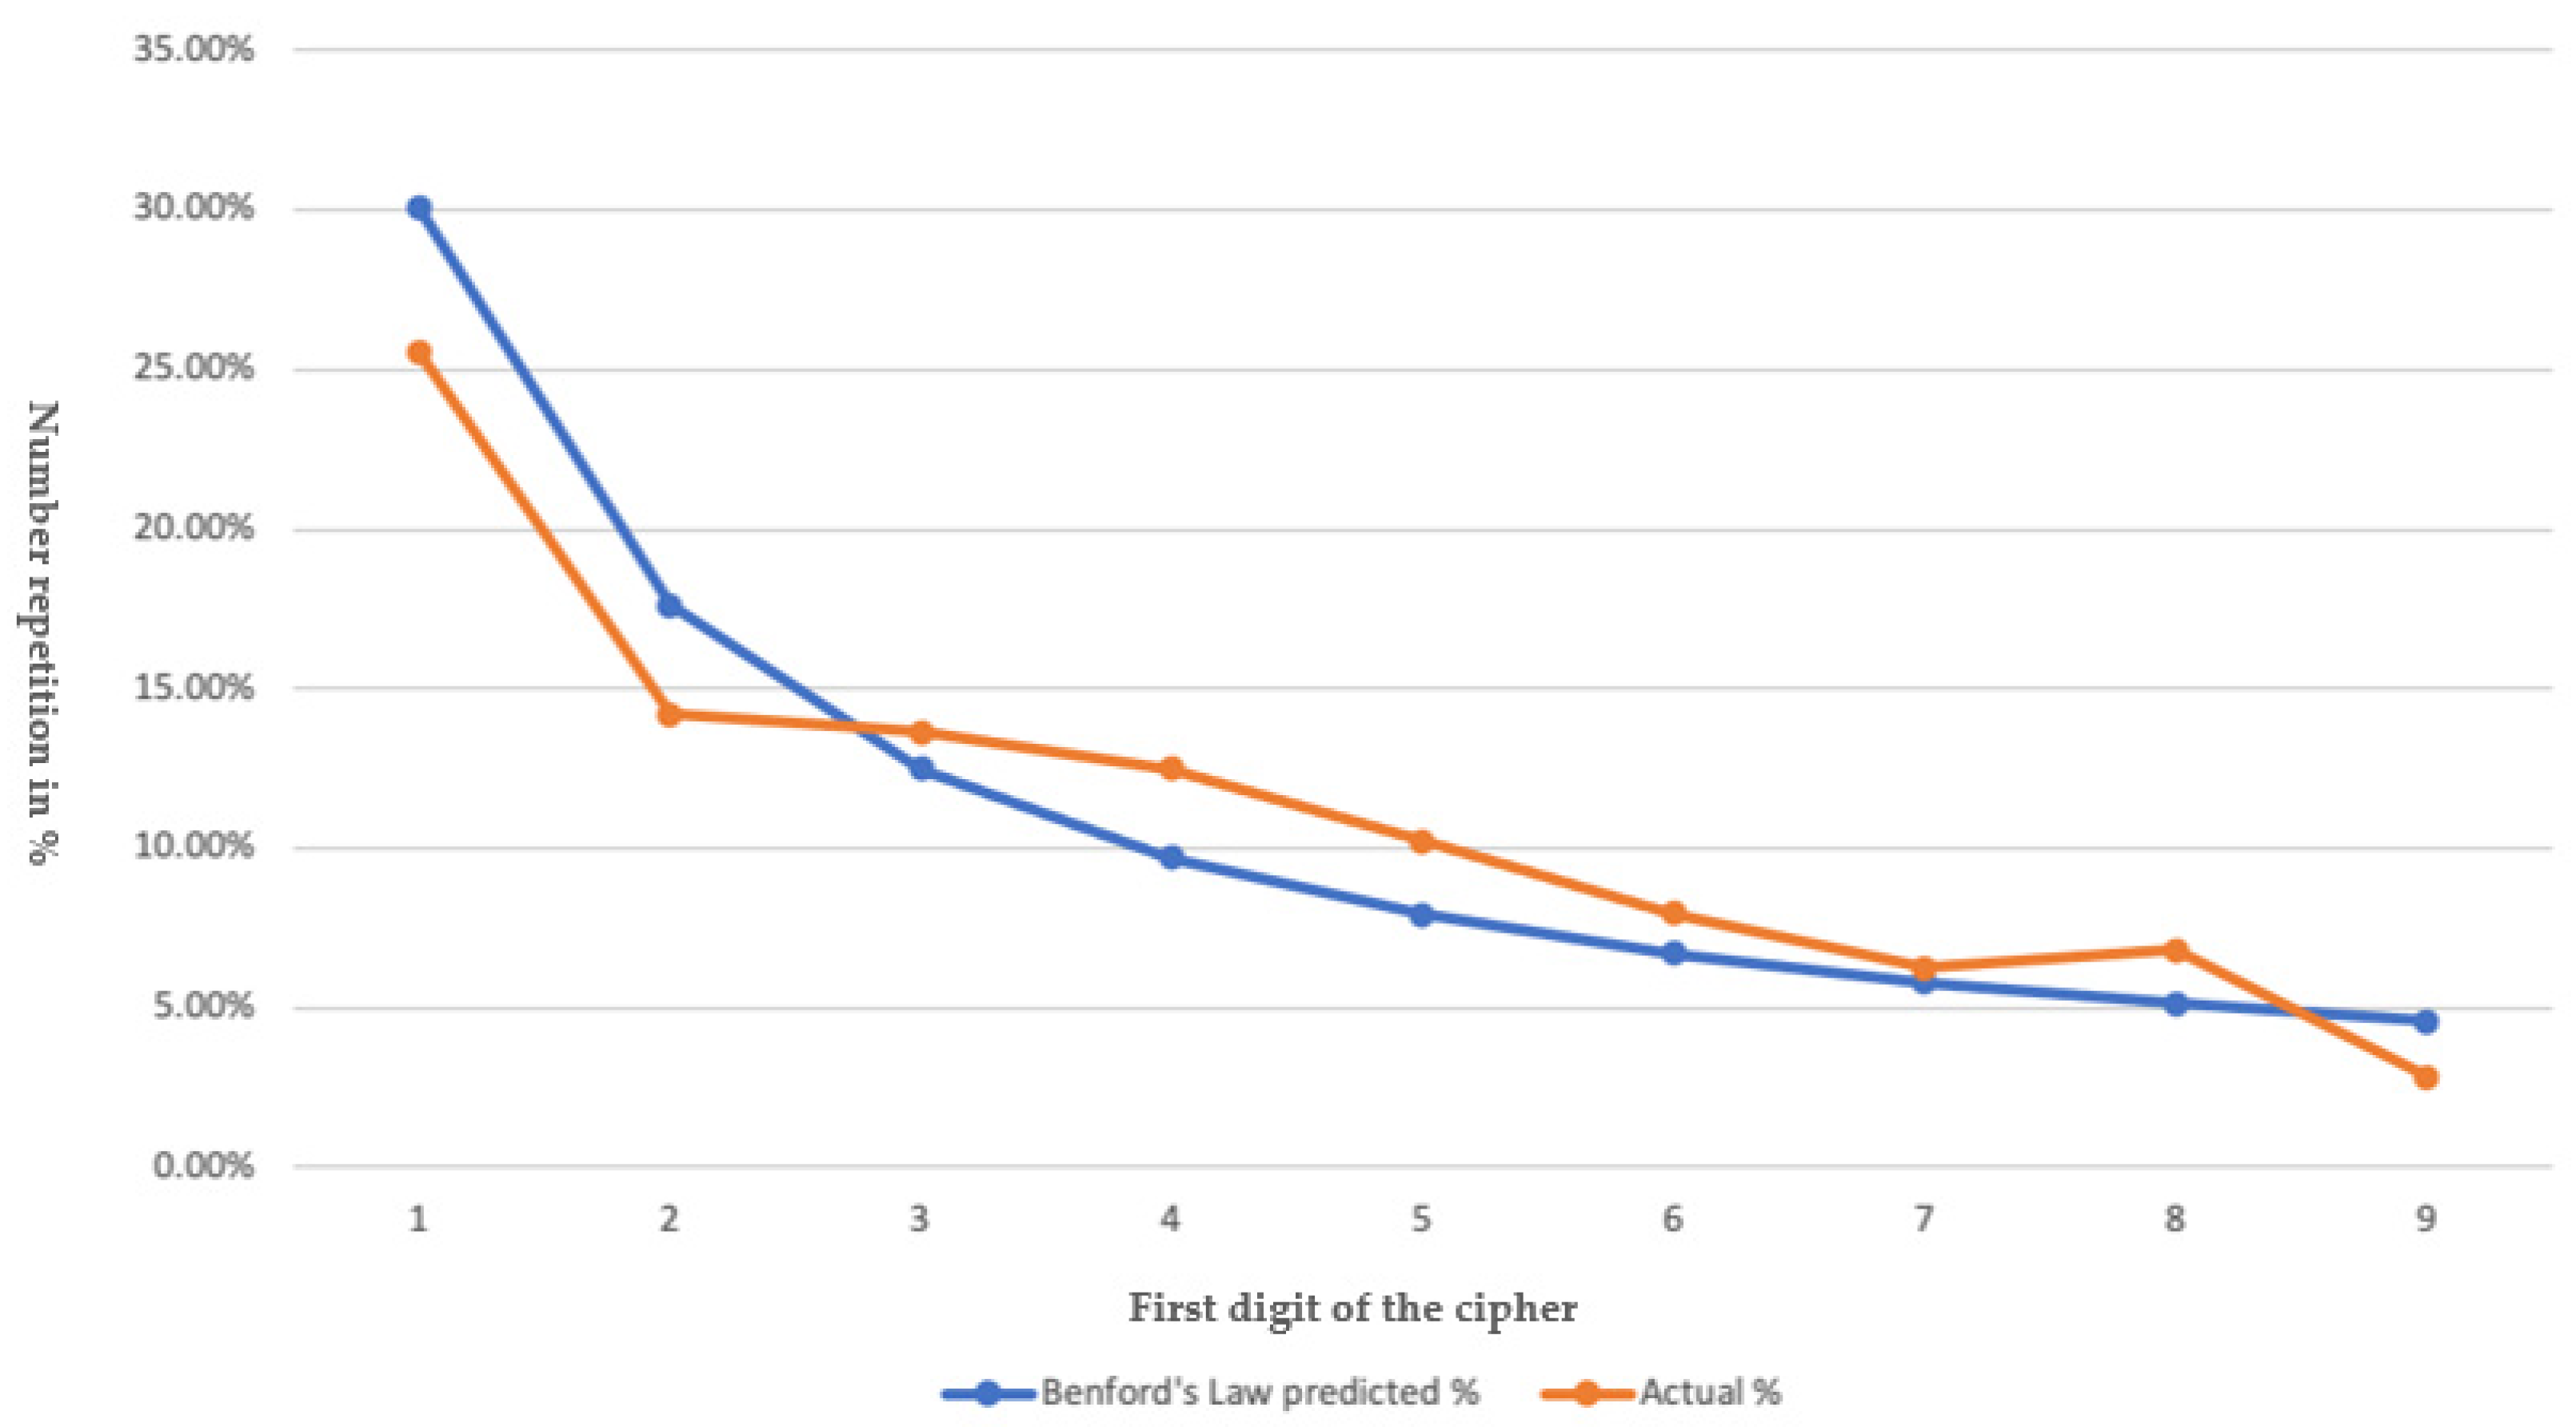
3.3. Bedford’s Law
- Left: This function allowed the first digit to be taken to the left of the number within the “length of stay” column.
- Countif: This function allows to count the frequency of each of the digit numbers without considering 0.
3.4. Machine Learning Analysis
4. Results
5. Discussion
6. Conclusions
Author Contributions
Funding
Institutional Review Board Statement
Informed Consent Statement
Data Availability Statement
Acknowledgments
Conflicts of Interest
Appendix A

| Variable | Description |
|---|---|
| Edad | Age |
| Género | Gender (Female/Male) |
| Grupo etario | Grupo etario |
| HAS | Defined by two levels according to the 2017 American College of Cardiology/American Heart Association (ACC/AHA) guidelines: (1) Elevated blood pressure, with a systolic pressure (SBP) between 120—129 mm Hg and diastolic pressure (DBP) less than 80 mm Hg, and (2) stage 1 hypertension, with a SBP of 130 to 139 mm Hg or a DBP of 80 to 89 mm Hg |
| DM | Diagnosis by meeting any of the criteria: Fasting glucose ≥126 mg/dL (7.0 mmol/L). Fasting is defined as the absence of caloric intake for at least 8 h OR 2 h postprandial glucose ≥200 mg/dL (11.1 mmol/L). The test should be performed as described by the WHO, using a glucose load containing the equivalent of 75 g of anhydrous glucose dissolved in water. OR Glycated hemoglobin ≥6.5% (48 mmol/mol). The test must be performed in a laboratory using a method that is certified by NGSP and standardized for the DCCT assay. OR In a patient with classic symptoms of hyperglycemia or hyperglycemic crisis, a random plasma glucose ≥ 200 mg/dL (11.1 mmol/L). |
| ECV | Neurological alteration is characterized by its sudden onset, generally without warning, with symptoms lasting 24 h or more, causing sequelae and death. |
| Hepaticas | Primary or secondary diseases that affect liver tissue. |
| SNC | Central Nervous System. |
| Neumopatía | Lung disease is a generic term to describe diseases that affect the lungs. It should not be confused with the term pneumonia, which specifically refers to infection of the lung by a virus or bacteria. |
| Cancer | Any of a large number of diseases characterized by the development of abnormal cells that divide uncontrollably and have the ability to infiltrate and destroy normal body tissue. |
| Inmunosupresión | Suppression or reduction of immune reactions. It may be due to the deliberate administration of immunosuppressive drugs used in the treatment of autoimmune diseases or in recipients of transplanted organs to avoid rejection. It can also be secondary to pathological processes such as immunodeficiencies, tumors, or malnutrition. |
| Obesidad | A condition characterized by the excessive accumulation and storage of fat in the body and which in an adult is typically indicated by a body mass index of 30 or more. |
| Otros | Other types are of diseases not classifiable in the previous variables. |
| Comorbilidades | A concomitant but unrelated disease process or disease; is commonly used in epidemiology to indicate the coexistence of two or more disease processes. |
| Otros Especificar | Other types are of diseases not classifiable in the previous variables, where the type is specified. |
| Fiber | Temperature above the normal range due to an increase in the body temperature set point. There is no agreed upper limit for normal temperature with sources using values between 37.2 and 38.3 °C (99.0 and 100.9 °F) in humans. |
| Mialgias/arthralgias | Muscle or joint pain. |
| Fatigue | Difficulty starting or maintaining physical or mental activity voluntarily. |
| Odinofagia/ardor faringeo | Feeling of pain when swallowing. |
| Tos | Sudden and acute expulsion of air from the lungs that acts as a protective mechanism to clear the airways or as a symptom of a pulmonary disorder. |
| Disnea | Difficulty breathing. |
| Dolor toracico | Localized chest pain, regardless of its etiology. |
| Congestión nasal | A feeling of blockage or obstruction in the nasal cavity and/or sinuses due to inflammation of the mucous lining of the nose. |
| Rinorrea | Flow or abundant emission of fluid from the nose. |
| Expectoración | Expulsion through coughing or sputum or other secretions formed in the respiratory tract. |
| Diarrhea | It consists of the expulsion of three or more liquid stools, with or without blood, in 24 h, which adopt the shape of the container that contains them. |
| Nausea | Feeling sick or sick in the stomach that may appear with an urgent need to vomit. |
| Anorexia | It is used to denote lack of appetite or lack of appetite that can occur in very different circumstances. |
| Vómito | Violent expulsion through the mouth of what is contained in the stomach. |
| Cefalea | They are painful and disabling primary disorders such as migraine, tension headache, and cluster headache. |
| Mareo | Feeling of vertigo and instability in the head and discomfort in the stomach that can lead to the urge to vomit and loss of balance. |
| Hyposmia/Anosmia | Decreased or absent sense of smell. |
| Ageusia | Decreased or absent sense of taste. |
| Conjunctivitis | Inflammation or irritation of the conjunctiva. |
| Saturación >90 | Oxygen saturation in ambient air >90%. |
| Saturación 80–90% | Oxygen saturation in ambient air of 80–90%. |
| Saturación <80% | Oxygen saturation in ambient air <80%. |
| Leucopenia | Reduction in circulating white blood cell count <4000/mcL. |
| Leukocytosis | A white blood cell count greater than 11,000/mm3, |
| Neutropenia | When the neutrophil numbers are below 1500–1800 per mm3. |
| Neutrophilia | Neutrophil blood values equal to or less than 7700/microL. |
| Linfopenia | Total lymphocyte count <1000/mcL. |
| Linfocitosis | When the lymphocyte count is greater than 4000 per microliter. |
| Eosinopenia | Reduction in circulating eosinophils <0.01 × 10⁹/L. |
| Eosinophilia | A count of more than 500 eosinophils per microliter of blood. |
| Thrombocytopenia | Decrease in the absolute number of platelets in the peripheral blood below 150,000 per µL. |
| Trombocitosis | Platelet count greater than 600,000 per µL. |
| TP normal | TP in blood with a range of 11 to 13.5 s. |
| TP alargado | TP in blood >13.5 s. |
| INR normal | INR with a value between 0.9 to 1.3. |
| INR Alto | INR with a value >1.3. |
| TTP normal | APTT in blood in a range of 25 to 35 s. |
| TTP alrgado | APTT in blood >35 s. |
| Creatinine normal | The normal range for creatinine is 0.7 to 1.3 mg/dL (61.9 to 114.9 µmol/L) for men and 0.6 to 1.1 mg/dL (53 to 97.2 µmol/L) for women. |
| Creatinine alta | Values >1.3 mg/dL for men and >1.1 mg/dL for women. |
| Ferritin normal | The range of normal values for ferritin are: Men: 12 to 300 nanograms per milliliter (ng/mL) Women: 12 to 150 ng/mL. |
| ferritin alta | Ferritin values in Men of >300 nanograms per milliliter (ng/mL), in women >150 ng/mL. |
| Dimero D normal | The normal range for D-dimer is less than 0.5 micrograms per milliliter. |
| Dimero D Alto | D-dimer >0.5 micrograms per milliliter. |
| Fibrinogen normal | The normal range for fibrinogen is 200 to 400 mg/dL (2.0 to 4.0 g/L). |
| Fibrinogeno Alto | Fibrinogen value >400 mg/dL. |
| PCR normal | 0 y 5 mg/dl |
| PCR alta | above 5 mg/dl |
| Procalcitonina normal | Normal blood procalcitonin values are less than 0.5 ng/mL |
| Procalcitonina alta | Procalcitonin values in blood >0.5 ng/mL |
| Troponina normal | Troponin in blood, within the reference limit up to 0.04 ng/mL. |
| Tropoonina alta | Troponin in blood >0.04 ng/mL. |
| CPK normal | Normal values for creatine phosphokinase (CPK) are between 32 and 294 U/L for men and 33 to 211 U/L for women. |
| CPK alta | CPK values greater than 294 U/L for men and greater than 211 U/L for women |
| CK-MB normal | CK-MB blood values within a range of 5 to 25 IU/L. |
| CK-MB alta | CK-MB blood values >25 IU/L. |
| Albumina baja | Albumin in blood <3.4 g/dL. |
| Albumina normal | Albumin in blood with a range of 3.4 to 5.4 g/dL. |
| Bilirrubina total normal | Total blood bilirubin values of 3–1.9 mg/dL |
| Bilirrubina total alta | Total blood bilirubin values >1.9 mg/dL |
| ALT/TGP normal | ALT blood values in a range of 10–40 IU/L. |
| ALT/TGP alta | ALT blood values >40 IU/L. |
| AST/TGO normal | AST blood values in a range of 10–34 IU/L. |
| AST/TGO alta | AST blood values >34 IU/L. |
| DHL normal | DHL blood value in a range of 105–333 IU/L |
| DHL alta | DHL blood value >333 IU/L. |
| DHL > 1000 | DHL > 1000 |
| Fostasa alcalina normal | Alkaline phosphatase blood value in a range of 44–147 IU/L |
| Fosfatasa alcalina alta | Alkaline phosphatase blood value >147 IU/L. |
| POSITIVA | PCR sample for COVID-19 positive. |
| MODERADO | Clinical or radiographic evidence of lower respiratory tract disease, with an oxygen saturation greater than or equal to 94%. |
| GRAVE | Oxygen saturation <94%, respiratory rate > or equal to 30 breaths/minute, pulmonary infiltrates >50%. |
| Oseltamivir | A drug that selectively inhibits the neuraminidase enzyme found in influenza A and B viruses, preventing infected cells from releasing viral particles. Its action is greater against influenza A viruses. |
| Ceftriaxone | Antibiotic of the third generation cephalosporin class, which has broad-spectrum actions against Gram-negative and Gram-positive bacteria. |
| Claritromicina | Macrolide antibiotic active against gram positives, gram negatives, it is also active against spirochetes, Chlamydophila and several intracellular pathogens. |
| Azitromicina | Broad-spectrum antibiotic from the group of Macrolides that act against various gram-positive and gram-negative bacteria. |
| Levofloxacin | Antibacterial fluoroquinolone, used to treat infections caused by sensitive germs. |
| Otros | Other medications |
| Especificar | Specify |
| Hidroxicloroquina/Cloroquina | Commonly prescribed aminoquinoline for the treatment of uncomplicated malaria, rheumatoid arthritis, chronic discoid lupus erythematosus, and systemic lupus erythematosus. |
| Tocilizumab | Humanized monoclonal antibody that inhibits interleukin 6 receptors. |
| Esteroides | A group of chemicals classified by a specific carbon structure. Steroids include drugs used to relieve inflammation, such as prednisone and cortisone. |
| Pronación | Anatomical position of the human body characterized by: Body position lying face down and head on its side. |
| Responder | That responds to a stimulus. |
| Responder parcial | That responds little to a stimulus. |
| No respondedor | Non responder |
| Alta por mejoría | Discharge for improvement |
| Defunción | Death |
| Días de estancia hospitalaria | Days of hospital stay. |
References
- Helmy, Y.A.; Fawzy, M.; Elaswad, A.; Sobieh, A.; Kenney, S.P.; Shehata, A.A. The COVID-19 pandemic: A comprehensive review of taxonomy, genetics, epidemiology, diagnosis, treatment, and control. J. Clin. Med. 2020, 9, 1225. [Google Scholar] [CrossRef]
- Shereen, M.A.; Khan, S.; Kazmi, A.; Bashir, N.; Siddique, R. COVID-19 infection: Origin, transmission, and characteristics of human coronaviruses. J. Adv. Res. 2020, 24, 91–98. [Google Scholar] [CrossRef]
- Guan, W.J.; Ni, Z.Y.; Hu, Y.; Liang, W.H.; Ou, C.Q.; He, J.X.; Liu, L.; Shan, H.; Lei, C.L.; Hui, D.S.; et al. Early Transmission Dynamics in Wuhan, China, of Novel Coronavirus–Infected Pneumonia. N. Engl. J. Med. 2020, 382, 1199–1207. [Google Scholar]
- Wang, W.; Tang, J.; Wei, F. Updated understanding of the outbreak of 2019 novel coronavirus (2019-nCoV) in Wuhan, China. J. Med. Virol. 2020, 92, 441–447. [Google Scholar] [CrossRef] [PubMed] [Green Version]
- Singhal, T. A Review of Coronavirus Disease-2019 (COVID-19). Indian J. Pediatrics 2020, 87, 281–286. [Google Scholar] [CrossRef] [Green Version]
- Rothan, H.A.; Byrareddy, S.N. The epidemiology and pathogenesis of coronavirus disease (COVID-19) outbreak. J. Autoimmun. 2020, 109, 102433. [Google Scholar] [CrossRef]
- Wu, Z.; Mcgoogan, J.M. Characteristics of and Important Lessons from the Coronavirus Disease 2019 (COVID-19) Outbreak in China. JAMA 2020, 323, 1239. [Google Scholar] [CrossRef] [PubMed]
- World Health Organization. WHO Coronavirus (COVID-19) Dashboard. 2021. Available online: https://covid19.who.int/ (accessed on 15 August 2021).
- World Health Organization. Estimating Mortality from COVID-19. Scientific Brief. 2020. Available online: https://apps.who.int/iris/bitstream/handle/10665/333642/WHO-2019-nCoV-Sci_Brief-Mortality-2020.1-eng.pdf?sequence=1&isAllowed=y (accessed on 10 May 2020).
- Secretaría de Salud. COVID-19 Tablero México. COVID-19 Tablero México. 2020. Available online: https://coronavirus.gob.mx/datos/ (accessed on 16 August 2021).
- Yadaw, A.S.; Li, Y.C.; Bose, S.; Iyengar, R.; Bunyavanich, S.; Pandey, G. Clinical predictors of COVID-19 mortality. medRxiv 2020. Available online: https://pubmed.ncbi.nlm.nih.gov/32511520/ (accessed on 11 July 2021).
- Yao, H.; Zhang, N.; Zhang, R.; Duan, M.; Xie, T.; Pan, J.; Peng, E.; Huang, J.; Zhang, Y.; Xu, X.; et al. Severity Detection for the Coronavirus Disease 2019 (COVID-19) Patients Using a Machine Learning Model Based on the Blood and Urine Tests. Front. Cell Dev. Biol. 2020, 8, 683. Available online: https://0-www-ncbi-nlm-nih-gov.brum.beds.ac.uk/pmc/articles/PMC7411005/ (accessed on 11 June 2021). [CrossRef] [PubMed]
- Alyasseri, Z.A.A.; Al-Betar, M.A.; Doush, I.A.; Awadallah, M.A.; Abasi, A.K.; Makhadmeh, S.N.; Alomari, O.A.; Abdulkareem, K.H.; Adam, A.; Damasevicius, R.; et al. Review on COVID-19 Diagnosis Models Based on Machine Learning and Deep Learning Approaches. Expert Systems; John Wiley and Sons Inc.: Hoboken, NJ, USA, 2021; Available online: https://0-www-ncbi-nlm-nih-gov.brum.beds.ac.uk/pmc/articles/PMC8420483/ (accessed on 11 June 2021).
- Li, W.T.; Ma, J.; Shende, N.; Castaneda, G.; Chakladar, J.; Tsai, J.C.; Apostol, L.; Honda, C.O.; Xu, J.; Wong, L.M.; et al. Using machine learning of clinical data to diagnose COVID-19: A systematic review and meta-analysis. BMC Med. Inform. Decis. Making 2020, 20, 247. [Google Scholar] [CrossRef]
- Guan, X.; Zhang, B.; Fu, M.; Li, M.; Yuan, X.; Zhu, Y.; Peng, J.; Guo, H.; Lu, Y. Clinical and inflammatory features based machine learning model for fatal risk prediction of hospitalized COVID-19 patients: Results from a retrospective cohort study. Ann. Med. 2021, 53, 257–266. [Google Scholar] [CrossRef] [PubMed]
- Delafiori, J.; Navarro, L.C.; Siciliano, R.F.; de Melo, G.C.; Busanello, E.N.B.; Nicolau, J.C.; Sales, G.M.; de Oliveira, A.N.; Val, F.F.A.; de Oliveira, D.N.; et al. COVID-19 Automated Diagnosis and Risk Assessment through Metabolomics and Machine Learning. Analytical Chemistry. Am. Chem. Soc. 2021, 93, 2471–2479. [Google Scholar] [CrossRef]
- Allam, M.; Cai, S.; Ganesh, S.; Venkatesan, M.; Doodhwala, S.; Song, Z.; Hu, T.; Kumar, A.; Heit, J.; COVID-19 Study Group. COVID-19 Diagnostics, Tools, and Prevention. Diagnostics 2020, 10, 409. [Google Scholar] [CrossRef]
- Assaf, D.; Gutman, Y.; Neuman, Y.; Segal, G.; Amit, S.; Gefen-Halevi, S.; Shilo, N.; Epstein, A.; Mor-Cohen, R.; Biber, A.; et al. Utilization of machine-learning models to accurately predict the risk for critical COVID-19. Intern. Emergency Med. 2020, 15, 1435–1443. [Google Scholar] [CrossRef] [PubMed]
- Naseem, M.; Akhund, R.; Arshad, H.; Ibrahim, M.T. Exploring the Potential of Artificial Intelligence and Machine Learning to Combat COVID-19 and Existing Opportunities for LMIC: A Scoping Review. J. Primary Care & Community Health 2020, 11, 215013272096363. [Google Scholar] [CrossRef]
- Arga, K.Y. COVID-19 and the Futures of Machine Learning. OMICS A J. Integr. Biol. 2020, 24, 512–514. [Google Scholar] [CrossRef]
- Majhi, R.; Thangeda, R.; Sugasi, R.P.; Kumar, N. Analysis and prediction of COVID-19 trajectory: A machine learning approach. J. Public Aff. 2020, e2537. [Google Scholar] [CrossRef]
- Van Der Schaar, M.; Alaa, A.M.; Floto, A.; Gimson, A.; Scholtes, S.; Wood, A.; McKinney, E.; Jarrett, D.; Lio, P.; Ercole, A. How artificial intelligence and machine learning can help healthcare systems respond to COVID-19. Mach. Learn. 2020, 10, 1–14. [Google Scholar] [CrossRef]
- Das, A.K.; Mishra, S.; Saraswathy Gopalan, S. Predicting COVID-19 community mortality risk using machine learning and development of an online prognostic tool. PeerJ 2020, 8, e10083. [Google Scholar] [CrossRef]
- Swapnarekha, H.; Behera, H.S.; Nayak, J.; Naik, B. Role of intelligent computing in COVID-19 prognosis: A state-of-the-art review. Chaos Solitons Fractals 2020, 138, 109947. [Google Scholar] [CrossRef]
- Silva, L.; Figueiredo Filho, D. Using Benford’s law to assess the quality of COVID-19 register data in Brazil. J. Public Health 2020, 43, 107–110. [Google Scholar] [CrossRef]
- Lee, K.; Han, S.; Jeong, Y. COVID-19, flattening the curve, and Benford’s law. Phys. A Stat. Mech. Appl. 2020, 559, 125090. [Google Scholar] [CrossRef] [PubMed]
- Panorama Epidemiologico. Enfermedades No Transmisibles. Secretaría de Salud. 2018. Available online: https://epidemiologia.salud.gob.mx/gobmx/salud/documentos/pano-OMENT/Panorama_OMENT_2018.pdf (accessed on 17 November 2021).
- Petrova, D.; Salamanca-Fernández, E.; Rodríguez Barranco, M.; Navarro Pérez, P.; Jiménez Moleón, J.; Sánchez, M. La obesidad como factor de riesgo en personas con COVID-19: Posibles mecanismos e implicaciones. Atención Primaria 2020, 52, 496–500. [Google Scholar] [CrossRef]
- Monteagudo, D.E. La obesidad: Posibles mecanismos que explican su papel como factor de riesgo de la COVID-19. Revista Cubana de Alimentación y Nutrición 2020, 30, 12. [Google Scholar]
- Pérez-Martínez, P.; Carrasco Sánchez, F.J.; Carretero Gómez, J.; Gómez-Huelgas, R. Resolviendo una de las piezas del puzle: COVID-19 y diabetes tipo 2. Rev. Clin. Esp. 2020, 220, 507–510. [Google Scholar] [CrossRef]
- Giralt-Herrera, A.; Rojas-Velázquez, J.; Leiva-Enríquez, J.; Giralt-Herrera, A.; Rojas-Velázquez, J.; Leiva-Enríquez, J. Relación entre COVID-19 e Hipertensión Arterial. Scielo.sld.cu. Available online: http://scielo.sld.cu/scielo.php?pid=S1729-519X2020000200004&script=sci_arttext&tlng=en (accessed on 18 November 2020).
- Di Castelnuovo, A.; Bonaccio, M.; Costanzo, S.; Gialluisi, A.; Antinori, A.; Berselli, N.; Blandi, V.; Bruno, R.; Guaraldi, G. Common cardiovascular risk factors and in-hospital mortality in 3,894 patients with COVID-19: Survival analysis and machine learning-based findings from the multicentre Italian CORIST Study. Nutr. Metab. Cardiovasc. Dis. 2020, 30, 1899–1913. [Google Scholar] [CrossRef]
- De Souza, F.S.H.; Hojo-Souza, N.S.; Dos Santos, E.B.; Da Silva, C.M.; Guidoni, D.L. Predicting the disease outcome in COVID-19 positive patients through Machine Learning: A retrospective cohort study with Brazilian data. Front. Artif. Intell. 2021, 4, 579931. Available online: https://www.medrxiv.org/content/10.1101/2020.06.26.20140764v1 (accessed on 22 February 2021). [CrossRef] [PubMed]
- Comunicado de Prensa No. 10. Coneval.org.mx. 2019. Available online: https://www.coneval.org.mx/SalaPrensa/Comunicadosprensa/Documents/2019/COMUNICADO_10_MEDICION_POBREZA_2008_2018.pdf (accessed on 22 February 2021).
- Hopkins, J. Mortality Analyses-Johns Hopkins Coronavirus Resource Center. Johns Hopkins Coronavirus Resource Center. 2021. Available online: https://0-coronavirus-jhu-edu.brum.beds.ac.uk/data/mortality (accessed on 21 February 2021).
- Cao, Y.; Hiyoshi, A.; Montgomery, S. COVID-19 case-fatality rate and demographic and socioeconomic influencers: Worldwide spatial regression analysis based on country-level data. BMJ Open 2020, 10, e043560. [Google Scholar] [CrossRef] [PubMed]


| Authors. | Year | Objective | Learners | Metrics | Novelties |
|---|---|---|---|---|---|
| Li WT et al. [14]. | 2020 | Classification | XGBoost | sensitivity of 92.5% and a specificity of 97.9% | Novel associations between clinical variables, including correlations between being male and having higher levels of serum lymphocytes and neutrophils. We found that COVID-19 patients could be clustered into subtypes based on serum levels of immune cells, gender, and reported symptoms. |
| Guan X et al. [15] | 2020 | Prediction | XGBoost | >90% precision and >85% sensitivity, as well as F1 scores >0.90 | Proposed disease severity, age, serum levels of hs-CRP, LDH, ferritin, and IL-10 as significant predictors for death risk of COVID-19, which may help to identify the high-risk COVID-19 cases. |
| Delafiori J et al. [16] | 2021 | Diagnosis and risk assesment | gradient tree boosting (GDB) ADA tree boosting | 96.0% of specificity and 83.1% of sensitivity 80.3% of specificity and 85.4% of sensitivity | Propose machine learning techniques to determine from databases the five main challenges in responding COVID-19 and how to overcome these challenges to save lives. |
| Allam M et al. [17] | 2020 | Diagnosis and prediction | Neural Networks | 100% sensitivity and 99.9% specificity | The Abbott antibody test (SARS-CoV-2 IgG assay) has shown 100% sensitivity and 99.9% specificity thus far. The Abbott test finds whether the patient has IgG antibodies for COVID-19, which can stay for months to years after a person has recovered. |
| Assaf D et al. [18] | 2020 | Prediction | Classification and Regression Tree (CRT) model | Sensitivity, specificity, PPV, NPV and accuracy of 88.0%, 92.7%, 68.8%, 97.7% and 92.0%, respectively, with ROC AUC of 0.90. | The analysis of the database in this study found that most contributory variables to the models were APACHE II score, white blood cell count, time from symptoms to admission, oxygen saturation and blood lymphocytes count. Machine-learning models demonstrated high efficacy in predicting critical COVID-19 compared to the most efficacious tools available. |
| Naseem M et al. [19] | 2020 | Detection | Neural Networks | sensitivity of 90% and specificity of 96% respectively | Results were synthesized and reported under 4 themes. (a) The need of AI during this pandemic: AI can assist to increase the speed and accuracy of identification of cases and through data mining to deal with the health crisis efficiently, (b) Utility of AI in COVID-19 screening, contact tracing, and diagnosis: Efficacy for virus detection can a be increased by deploying the smart city data network using terminal tracking system along-with prediction of future outbreaks, (c) Use of AI in COVID-19 patient monitoring and drug development: |
| Arga KY [20] | 2020 | Prediction and diagnosis | Apache, Gleason and PASI | - | Machine learning is considered to help reduce diagnostic errors and unnecessary use of diagnostic tools through the development of rational algorithms. Indeed, the COVID-19 pandemic showed that digital health is invaluable, feasible, and not too far. |
| Majhi R et al. [21] | 2020 | Prediction | Nonlinear Regression (NLR), Decision Tree (DT) based regression, and random forest (RF) models | Evaluation metrics obtained using the Mean Absolute Percentage Error (MAPE). NLR = 0.24% DT = 0.18% RF = 0.02% | The algorithm predict the number of positive cases in India. In essence, the paper proposes a machine learning model that can predict the number of cases well in advance very effectively and also suggest some key inputs. |
| van der Schaar M et al. [22] | 2020 | Prediction | - | . | This paper summarizes the use of machine learning techniques in different studies to manage limited healthcare results, developing personalized treatment, informing policies and able effective collaboration and expediting clinical trials. |
| Das AK et al. [23] | 2020 | Prediction | Linear Regression | For liner regression (area under ROC curve = 0.830), calibration (Matthews Correlation Coefficient = 0.433; Brier Score = 0.036). | In this study, according to the random forest algorithm, age was the most important predictor followed by exposure, sex and province, whereas this order was sex, age, province and exposure as per logistic regression |
| Swapnarekha H et al. [24] | 2020 | Prognosis | Support Vector Machine (SVM), Rannom Forest RF, K-Means, XGBoost and linear regression | 0.933 true positive rate, 0.74 true negative rate and 0.875 accuracy. | This article obtained good metrics for COVID-19 prediction. On the other hand, mentioned machined learning techniques used for classification and prediction to reduce the spread of coronavirus and understand the limitation of machine learning analysis, being: lack of information, accuracy of predictions, usage of advanced approaches, providing feasible solutions for developing countries and necessity of advance intelligent systems on symptom based identification of COVID-19. |
| Gender | % | Kg-m2 | SpO |
|---|---|---|---|
| Women | 39.46% | <6.1 kg/m2 | >95% |
| Men | 60.54% | <8.5 kg/m2 | >95% |
| Benford’s Law | Actual | R.E. * |
|---|---|---|
| Tijuana cases 1 | ||
| 30.10% | 25.57% | −15.01% |
| 17.61% | 14.20% | −19.30% |
| 12.49% | 14.00% | 9.12% |
| 9.69% | 12.50% | 22.89% |
| 7.92% | 10.23% | 29.16% |
| 6.69% | 7.95% | 18.83% |
| 5.80% | 6.25% | 7.75% |
| 5.12% | 6.82% | 33.20% |
| 4.58% | 2.84% | 1.73% |
| Learner | Configuration for Learners |
|---|---|
| RF | A number of trees: 10, minimum subsets split: 5, maximum tree depth: unlimited. |
| kNN | Number of neighbors: 3, metric: Euclidean, weight: uniform |
| SVM | Type: SVM Regression, C = 1, ε = 0.1, Kernel= Radial Basis Function (RBF), exp (−auto|x − y|2), numerical tolerance: 0.001 |
| MLPNN | Hidden layers: 100, activation: ReLu, solver: Adam, alpha: 0.0001, maximum iterations: 200, replicable training: True. |
| NB | |
| AB | Base estimator: tree, number of estimators: 50, algorithm (classification): Samme. r, loss (regression): Linear |
| DT | Type: binary tree, internal nodes < 5, maximum depth: 100, splitting: 95%. |
| Method | Algorithm |
|---|---|
| Gain Ratio | |
| Gini | |
| X2 | |
| ReliefF | |
| FCBF |
| Dataset | Target HAS |
|---|---|
| Dataset 1 | Edad, género, grupo etario, DM, ECV, Hepáticas, SNC, Neumopatía, Cáncer, Inmunosupresión, Obesidad, Otros (1), Comorbilidades, Fiebre, Mialgias/artralgias, Fatiga, Odinogafia/ardor faringeo, Tos, Disnea, Dolor Toracico, Congestión Nasal, Rinorrea, Expectoración Diarrea, Náusea, Anorexia, Vómito, Cefalea, Mareo, Hispomia/Anosmia, Ageusia, Conjuntivitis, Saturación >90, Saturación 80–90%, Saturación < 80%, Leucopenia, Leucocitosis, Neutropenia, Neutrofilia, Linfopenia, Linfocitosis, Eosinopenia, Trombocitopenia, Trombocitosis, TP normal, TP alargado, INR normal, INR Alto, TTPa normal, TTPa alargado, Creatinina normal, Creatinina alta, Ferritina normal, Ferritina alta, Dímero D normal, Dímero D Alto, Fibrinógeno normal, Fibrinógeno Alto, PCR normal, PCR alta, Procalcitonina normal, Procalcitonina alta, Troponina normal, Troponina alta, CPK normal, CPK alta, CK-MB normal, CK-MB alta, Albúmina baja, Albúmina normal, Bilirrubina total normal, Bilirrubina total alta, ALT/TGP normal, ALT/TGP alta, AST/TGO normal, AST/TGO alta, DHL normal, DHL alta, DHL > 1000, Fosfatasa alcalina normal, Fosfatasa alcalina alta, Muestra, POSITIVA, Mayor 50%, Moderado, Grave, Oseltamivir, Ceftriaxona, Claritromicina, Azitromicina, Levofloxacino, Otros (2), Hidroxicloroquina/Cloroquina, Tocilizumab, Esteroides, Pronación, Respondedor, Respondedor parcial, No respondedor, Alta por mejoría, Defunción, Días de estancia hospitalaria. |
| Dataset 2 | Comorbilidades, Edad, Tos, CK-MB Normal, INR Alto, DM, Cefalea, Neutrofilia, Dímero, Leucocitos, Neumopatía, Obesidad, Días de estancia, CPK alta, Saturación 90, Eosinopenia, TP Alargado y Odinofagia |
| Dataset 3 | Comorbilidades, Edad, CK-MB Normal, CK-MB Alto, DM, Neutrofilia, Dímero D Alto, Leucocitosis, Neumopatía, Obesidad, Dias de estancia, Otros (1) |
| Dataset | Target DM |
|---|---|
| Dataset 1 | Edad, género, grupo etario, HAS, ECV, Hepáticas, SNC, Neumopatía, Cáncer, Inmunosupresión, Obesidad, Otros (1), Comorbilidades, Fiebre, Mialgias/artralgias, Fatiga, Odinogafia/ardor faringeo, Tos, Disnea, Dolor Toracico, Congestión Nasal, Rinorrea, Expectoración Diarrea, Náusea, Anorexia, Vómito, Cefalea, Mareo, Hispomia/Anosmia, Ageusia, Conjuntivitis, Saturación > 90, Saturación 80–90%, Saturación < 80%, Leucopenia, Leucocitosis, Neutropenia, Neutrofilia, Linfopenia, Linfocitosis, Eosinopenia, Trombocitopenia, Trombocitosis, TP normal, TP alargado, INR normal, INR Alto, TTPa normal, TTPa alargado, Creatinina normal, Creatinina alta, Ferritina normal, Ferritina alta, Dímero D normal, Dímero D Alto, Fibrinógeno normal, Fibrinógeno Alto, PCR normal, PCR alta, Procalcitonina normal, Procalcitonina alta, Troponina normal, Troponina alta, CPK normal, CPK alta, CK-MB normal, CK-MB alta, Albúmina baja, Albúmina normal, Bilirrubina total normal, Bilirrubina total alta, ALT/TGP normal, ALT/TGP alta, AST/TGO normal, AST/TGO alta, DHL normal, DHL alta, DHL > 1000, Fosfatasa alcalina normal, Fosfatasa alcalina alta, Muestra, POSITIVA, Mayor 50%, Moderado, Grave, Oseltamivir, Ceftriaxona, Claritromicina, Azitromicina, Levofloxacino, Otros (2), Hidroxicloroquina/Cloroquina, Tocilizumab, Esteroides, Pronación, Respondedor, Respondedor parcial, No respondedor, Alta por mejoría, Defunción, Días de estancia hospitalaria. |
| Dataset 2 | Edad, Neutropenia, Comorbilidades, Cáncer, Claritromicina, HAS, linfocitosis, Ferritina normal, Hepáticas, SNC, Leucopenia, Inmunosupresión, eosinofilia, ferritina alta, Troponina normal, vómito, INR alto, CM-KB alta, Disnea, TTP alargado, Levofloxacino, Fatiga, AST/TGO alta, bilirrubina total alta, fiebre, creatinina alta, INR normal, Diarrea, Augesia. |
| Dataset 3 | Edad, Género, HAS, Obesidad, Otros (1), Comorbilidades, Leucocitosis, Creatinina normal, Creatinina alta, Procalcitonina alta, Levofloxacino, Hidroxicloroquina |
| Dataset | Target Obesity |
|---|---|
| Dataset 1 | Edad, género, grupo etario, HAS, DM, ECV, Hepáticas, SNC, Neumopatía, Cáncer, Inmunosupresión, Otros (1), Comorbilidades, Fiebre, Mialgias/artralgias, Fatiga, Odinogafia/ardor faringeo, Tos, Disnea, Dolor Toracico, Congestión Nasal, Rinorrea, Expectoración Diarrea, Náusea, Anorexia, Vómito, Cefalea, Mareo, Hispomia/Anosmia, Ageusia, Conjuntivitis, Saturación > 90, Saturación 80–90%, Saturación < 80%, Leucopenia, Leucocitosis, Neutropenia, Neutrofilia, Linfopenia, Linfocitosis, Eosinopenia, Trombocitopenia, Trombocitosis, TP normal, TP alargado, INR normal, INR Alto, TTPa normal, TTPa alargado, Creatinina normal, Creatinina alta, Ferritina normal, Ferritina alta, Dimero D normal, Dimero D Alto, Fibrinogeno normal, Fibrinogeno Alto, PCR normal, PCR alta, Procalcitonina normal, Procalcitonina alta, Troponina normal, Troponina alta, CPK normal, CPK alta, CK-MB normal, CK-MB alta, Albumina baja, Albumina normal, Bilirrubina total normal, Bilirrubina total alta, ALT/TGP normal, ALT/TGP alta, AST/TGO normal, AST/TGO alta, DHL normal, DHL alta, DHL > 1000, Fosfatasa alcalina normal, Fosfatasa alcalina alta, Muestra, POSITIVA, Mayor 50%, Moderado, Grave, Oseltamivir, Ceftriaxona, Claritromicina, Azitromicina, Levofloxacino, Otros (2), Hidroxicloroquina/Cloroquina, Tocilizumab, Esteroides, Pronación, Respondedor, Respondedor parcial, No respondedor, Alta por mejoría, Defunción, Días de estancia hospitalaria |
| Dataset 2 | Saturación 80–90, Edad, Cefalea, Género, Levoflaxina, GRAVE, Hisponia/asmonia, Linfopeni, a Neumopatía, Fosfatasa alcalina normal, Creatinina normal, días de estancia, PCR alta |
| Dataset 3 | Saturación 80–90, Edad, Género, Levoflaxina, GRAVE, Hisponia/asmonia, Linfopenia Neumopatía, Fosfatasa alcalina normal |
| Model | AUC | CA | F1 | Precision | Recall |
|---|---|---|---|---|---|
| Tree Decision | 0.814 | 0.784 | 0.784 | 0.784 | 0.784 |
| SVM | 0.867 | 0.762 | 0.762 | 0.762 | 0.762 |
| Random Forest | 0.866 | 0.784 | 0.784 | 0.784 | 0.784 |
| Neural Network | 0.876 | 0.773 | 0.773 | 0.773 | 0.773 |
| Naive Bayes | 0.832 | 0.757 | 0.755 | 0.761 | 0.757 |
| Logistic Regression | 0.910 | 0.800 | 0.800 | 0.801 | 0.800 |
| AdaBoost | 0.860 | 0.811 | 0.811 | 0.811 | 0.811 |
| Model | AUC | CA | F1 | Precision | Recall |
| Tree | 0.867 | 0.881 | 0.878 | 0.882 | 0.881 |
| SVM | 0.934 | 0.886 | 0.885 | 0.886 | 0.886 |
| Random Forest | 0.877 | 0.849 | 0.847 | 0.847 | 0.849 |
| Neural Network | 0.871 | 0.816 | 0.812 | 0.813 | 0.816 |
| Naive Bayes | 0.849 | 0.838 | 0.838 | 0.838 | 0.838 |
| Logistic Regression | 0.912 | 0.892 | 0.888 | 0.897 | 0.892 |
| AdaBoost | 0.827 | 0.843 | 0.844 | 0.844 | 0.843 |
| Model | AUC | CA | F1 | Precision | Recall |
|---|---|---|---|---|---|
| Tree | 0.700 | 0.876 | 0.869 | 0.864 | 0.876 |
| SVM | 0.643 | 0.838 | 0.831 | 0.824 | 0.838 |
| Random Forest | 0.807 | 0.903 | 0.872 | 0.912 | 0.903 |
| Neural Network | 0.834 | 0.914 | 0.899 | 0.906 | 0.914 |
| Naive Bayes | 0.793 | 0.865 | 0.845 | 0.833 | 0.865 |
| Logistic Regression | 0.778 | 0.881 | 0.856 | 0.851 | 0.881 |
| AdaBoost | 0.697 | 0.881 | 0.879 | 0.876 | 0.881 |
Publisher’s Note: MDPI stays neutral with regard to jurisdictional claims in published maps and institutional affiliations. |
© 2021 by the authors. Licensee MDPI, Basel, Switzerland. This article is an open access article distributed under the terms and conditions of the Creative Commons Attribution (CC BY) license (https://creativecommons.org/licenses/by/4.0/).
Share and Cite
Castillo-Olea, C.; Conte-Galván, R.; Zuñiga, C.; Siono, A.; Huerta, A.; Bardhi, O.; Ortiz, E. Early Stage Identification of COVID-19 Patients in Mexico Using Machine Learning: A Case Study for the Tijuana General Hospital. Information 2021, 12, 490. https://0-doi-org.brum.beds.ac.uk/10.3390/info12120490
Castillo-Olea C, Conte-Galván R, Zuñiga C, Siono A, Huerta A, Bardhi O, Ortiz E. Early Stage Identification of COVID-19 Patients in Mexico Using Machine Learning: A Case Study for the Tijuana General Hospital. Information. 2021; 12(12):490. https://0-doi-org.brum.beds.ac.uk/10.3390/info12120490
Chicago/Turabian StyleCastillo-Olea, Cristián, Roberto Conte-Galván, Clemente Zuñiga, Alexandra Siono, Angelica Huerta, Ornela Bardhi, and Eric Ortiz. 2021. "Early Stage Identification of COVID-19 Patients in Mexico Using Machine Learning: A Case Study for the Tijuana General Hospital" Information 12, no. 12: 490. https://0-doi-org.brum.beds.ac.uk/10.3390/info12120490