
Service Facilities in Heritage Tourism: Identification and Planning Based on Space Syntax


1
Department of Urban Planning, School of Architecture, Southeast University, Nanjing 210096, China
2
School of Urban and Environmental Science, Huaiyin Normal University, Huai’an 223300, China
3
Department of Leisure Management, Minghsin University of Science and Technology, Hsinchu 30401, Taiwan
*
Authors to whom correspondence should be addressed.
Information 2021, 12(12), 504; https://0-doi-org.brum.beds.ac.uk/10.3390/info12120504
Submission received: 8 November 2021
/
Revised: 29 November 2021
/
Accepted: 3 December 2021
/
Published: 5 December 2021
(This article belongs to the Special Issue Techniques and Data Analysis in Cultural Heritage)
Abstract
:Improving the development level of tourism service facilities in historic areas of old cities and realizing the sustainable tourism are important strategies for urban historical protection, economic development, and cultural rejuvenation. Districts at different tourism development stages show different characteristics of tourism service facilities. This study collects location-based service data and uses space syntax to identify the correlation between the distribution of tourism service facilities and street networks, which helps decision-makers to optimize the spatial layout of tourism facilities in the planning of historic areas. Taking the southern historic area of Nanjing, China, as an example, this is an area with a rich collection of cultural heritage and many historic districts, and the study reveals that the areas with strongest street agglomeration and best accessibility, as well as the districts with most mature tourism development, are the core of the tourism facilities. The agglomeration of transportation and accommodation facilities should be set at the traffic nodes as much as possible due to the highest correlation with the street network. Instead, the entertainment, catering, and shopping facilities can be set in the nontraffic node areas under the premise of ensuring good traffic accessibility owing to the insignificantly relationship with the street network. The research results can be used as an important reference for urban decision-makers regarding the planning of historic areas.
1. Introduction
Tourism sustainability is an extension of the concept of sustainable tourism development. It is not only a long-term goal but also a dynamically changing concept [1,2]. Compared with the development of conventional industries, the development of tourism is more conductive to the sustainable development of urban society, environment, and culture [3]. The old city of Taierzhuang in China vigorously developed its tourism industry, which offset the impact of the industrial decline caused by resource depletion on the national economy [4]. Nowadays, more and more cities in the world combine the cultural heritage to develop tourism, which can not only realize economic value, but also promote the unique cultural and social identity of residents and tourists to the cities [5]. This way of using cultural heritage as a tourism resource is called the heritage tourism. To be specific, the cultural heritage includes not only the tangible cultural heritage such as monuments, and groups of buildings and sites [6], but also the intangible heritage elements such as practices, representations, expressions, knowledge, and skills [7]. Compared with that of other tourism, a reasonable and appropriate development of heritage tourism can enhance the core competitiveness of the city and is an important means for its sustainable development. According to the Charter for Sustainable Tourism, cultural heritage and traditional elements and activities should be integrated to formulate a sustainable tourism development strategy [8]. Tourism based on cultural resources can not only protect and perpetuate the historical values of cultural resources, but also bring sustained economic benefits, thereby achieving sustainable economic development [9]. The historic areas of old cities (hereafter referred to as “historic areas”) are the origin of cities’ histories, cultures, social development, and structures, and are the core manifestation of cultural heritage. The sustainability of the historic area is crucial to the livability, the development of tourism economy, and the social cohesion of the city [10,11,12]. Countries with established cultural backgrounds such as Italy, Germany, and Spain endeavored to develop cultural heritage and the revival of historic areas [13]. On the one hand, historic areas can maintain their historical and cultural values by enacting relevant laws to protect architectural heritage [14] or establishing relevant organizations to implement cultural projects to protect historical heritage [15]. On the other hand, the central area should be renovated to improve environmental quality, and integrated with the strong and active part of heritage development, i.e., holiday tourism and cultural tourism, to support the development of commercial and industrial economy [16]. The protection of historical heritage and the improvement of tourism level complement each other. Therefore, identifying the cultural value and tourist potential of historic areas, developing cultural heritage rationally, and developing cultural tourism to realize the values of cultural capital are crucial to urban economy, social and cultural rejuvenation, and environmental restoration.
The systematic analysis of the spatial characteristics of the historic area is the research focus of Sustainable Heritage Tourism [17]. The street network of the historic area is a major factor for the expression of its spatial characteristics [18]. In addition to facilitating transportation, streets are public spaces that enable economic and social activities [19]. Numerous studies were conducted on the relationship between the spatial pattern of commercial activities and urban street structure, and a consensus was reached on this topic. For example, Wu (2013) analyzed the spatial association between the distribution of attractions and shops in tourist destination and the street networks based on the field survey data using the Space Syntax and Kernel density estimation methods [20]. Han et al. (2019) used the Kernel density estimation method to study the correlation and distribution pattern of the commercial space and the urban street networks structure [16]. Based on the above spatial analysis of the relationship between commercial facilities and streets using the Space Syntax and Kernel density estimation methods, this study adopted the least-squares method to further verify the strength of correlation between tourism service facilities and street networks in historic areas from the perspective of the strength of correlation affecting the optimal layout planning of facilities. However, few studies were conducted on tourist service facilities, particularly those in historic areas. Because historic areas feature numerous traditional streets and architectural remains, historical preservation considerably restricts tourism development. If tourism is overdeveloped, tourism facilities will be overdeveloped, too. A large number of tourists exceeds the carrying capacity of historic areas, and the areas become over-commercialized [21]. In addition, tourism also harms the lifestyle and value system of residents [22]. Excessive tourism development has negative impacts on heritage protection. To strike a balance between historical preservation and tourism development in historic areas, the effect of street networks on the establishment of tourist service facilities must be considered. Thus, the distribution of new tourist service facilities in the historic areas can be planned, and the street network structure can be perfected, providing a reference for optimizing resource distribution and enabling sustainable urban development.
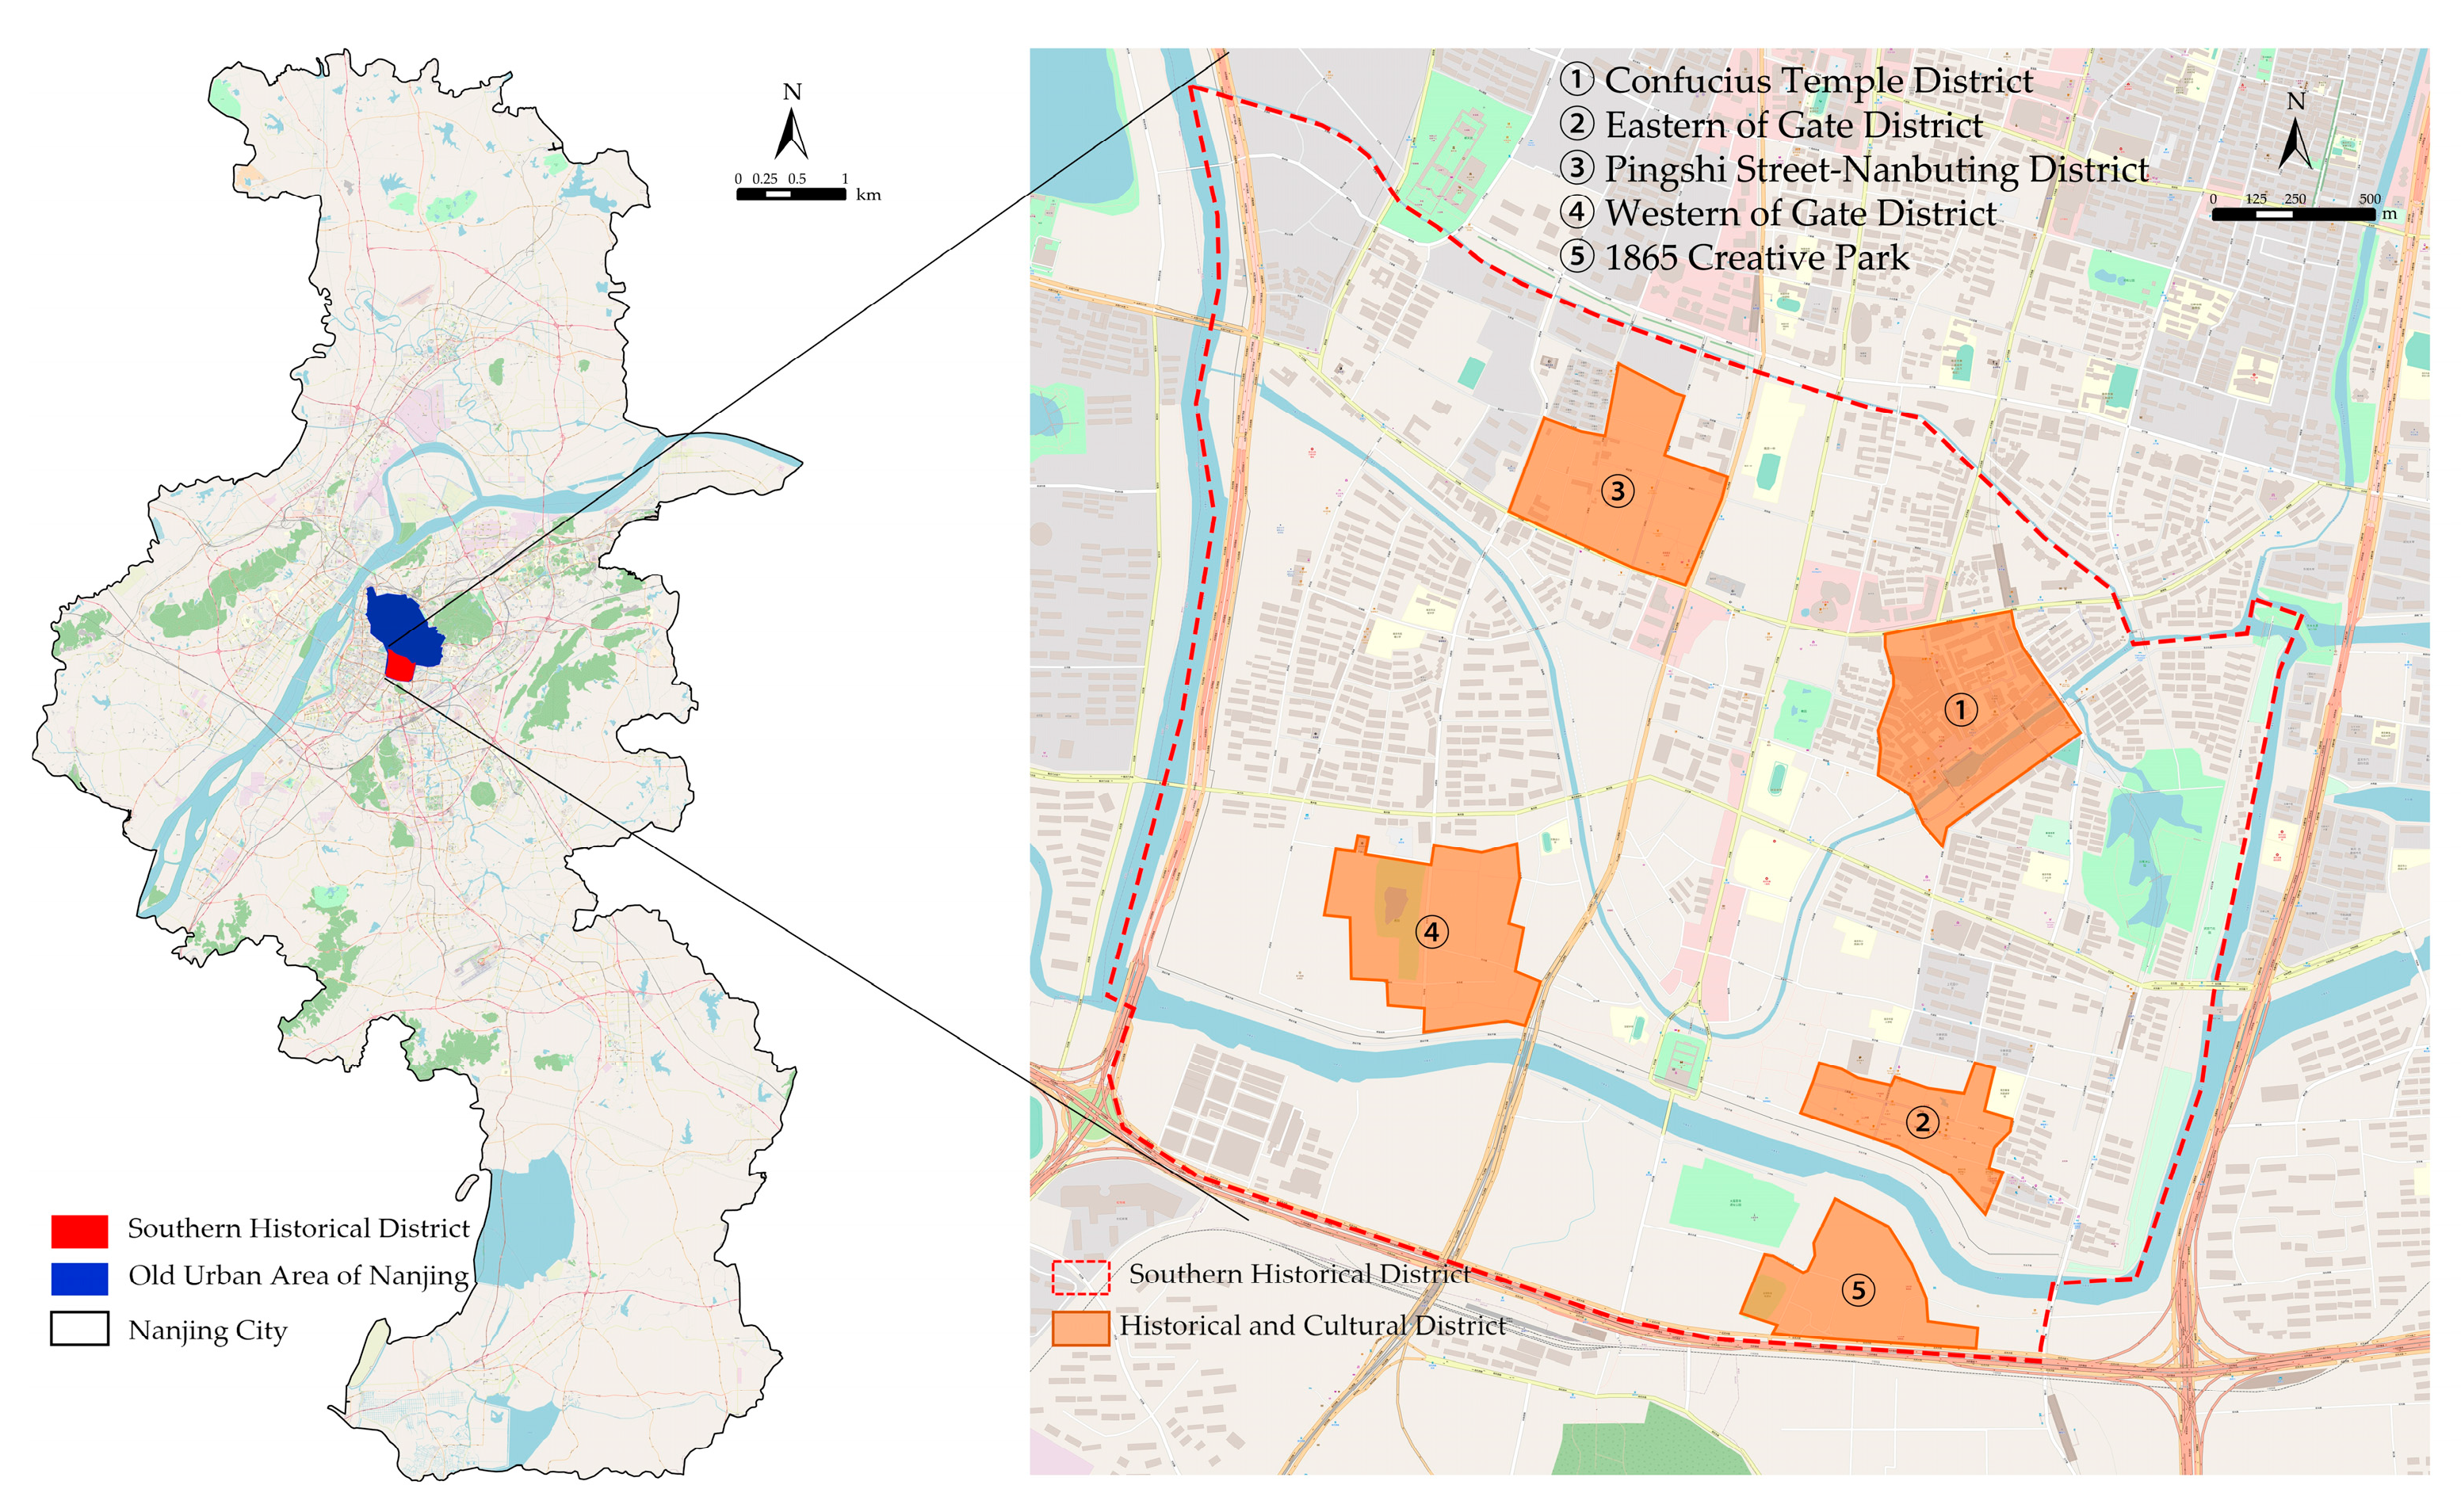
This case study focused on the southern historic area of the old Nanjing city, China. Nanjing, whose history exceeds 2500 years, is one of the four oldest cities in China [23]. The southern historic area is a residential zone with Confucius Temple as its center, delineated by Hongwu Emperor of the Ming Dynasty, during which Nanjing was the capital of China [24]. In 2006, city renovation and renewal and tourism projects were commenced in the southern historic area [25].
2. Literature Review
2.1. LBS Data: Quantification of Tourism Service Facilities
Most studies on tourist service facilities have focused on specific service categories, such as entertainment [26] and hotels [27]. Following the rapid evolution of location-based service technology, location-based service (LBS) data, such as points of interest (POIs), can be directly accessed online [28]. An increasing number of practical activities employed LBS data in various city space [29]. Based on the geographical location data of mobile phone users on LBS Platform, Baidu heat map (obtained through Baidu Map APP) describes the distribution of people in real-time through different color blocks superimposed on the network map [30].
POIs are abstract points that indicate various geographic entities, such as communities, schools, shops, and tourist attractions. POI data include the geographic information of these entities such as names, latitude and longitude coordinates, and attributes. Compared with conventional location data, most of which exhibit few sample sizes, limited sources, low accuracy, and low accessibility, POI data exhibit comprehensive sample sizes, wide coverage, high positioning accuracy, and high accessibility. POIs accurately reflect and predict the relationship between human activities and cities’ functions and spatial environments [31]. POI application became a trend in human settlement studies and practices, such as urban planning and design. For example, POIs were employed to acquire and identify functional areas in cities [31], identify built-up areas [32], and delimit the scope of urban agglomeration [33]. Most city tourism studies that applied POIs focused on tourists’ preferences or on the spatial distributions of specific types of tourist service facilities, such as tourism route planning [34], personalized travel recommendations [35], and the spatial distribution of city hotels [27] according to tourist-preferred POIs. POIs were rarely employed in quantitative studies on the tourism service facilities in historic areas.
In addition to spatial location data, Pop et al. (2017) used a descriptive statistical analysis method to conduct a spatial-temporal study on the registered urban tourist accommodation facilities in the urban areas of Romania [36]. Zhang et al. (2020) used GDP and population index forecast data to determine the optimal layout and quantity of Tourism Highway Camp Service Facilities [37]. However, the essence of no matter the emerging spatial location data analysis or the mathematical analysis of traditional data, is to study the space and quantity, thereby realizing the optimization or reasonable planning of the layout of tourist service facilities.
2.2. Street Network Structure and Space Syntax
Street network structures can be examined using space syntax. First proposed by Bill Hillier in the late 1970s and early 1980s, space syntax is used in quantitative studies on the relationship between urban spatial organization and human social activities [38,39]. The axis method, which is a basic spatial configuration analysis method, can be applied to analyze historic areas with high building density. The axis method simplifies continuous spaces as lines to express humans’ linear movements across spaces and the trends of traffic [40]. Because urban spaces are largely linear, linear matrices can be used to represent street networks. A central premise of space syntax research is that the social structure itself is spatial, and changes in space have an impact on human behavior [41]. The axis map generated by the axis method is a geometric model of the urban street networks. After being transformed into a topological graph, the space syntax can be utilized to calculate the mathematical relationship between each axis and all other axes based on the graph theory; that is, to calculate the topology depth of each axis relative to all the other axes. The axis represents the node, and the intersection of the axes represents the connection between the nodes. The direction change at each connection is a syntax step. In mathematics, connectivity is one of the basic concepts of the graph theory, describing all the direct connections between each street and other adjacent street. Control, the reciprocal of connectivity, reflects the influence of this street on the surrounding streets. Total depth is the sum of all possible steps starting from a given node to all other given streets. Global integration calculates and analyzes the degree of spatial integration of nodes to the other street spaces. The fewer syntax steps from the node to all positions in the system, the higher the integration value.
Space syntax involves the division of the spatial scale to clarify the complex topological relationships in spaces, thereby enabling architects and urban planners to simulate the effects of their designs, such as traffic [42] and architectural [43] designs and public policies [44], on society. As their scientific systems mature and their scope of application diversifies, space syntax is applied in an increasingly wide range of research on the relationship between urban forms and socioeconomic activities, such as the spatial patterns of retail stores [31], land use layouts in new urban areas [45], and the effects of urban projects on city land prices [46].
Currently, space syntax was applied mainly to investigate spatial behavior and cognition in city tourism studies, such as through visual analyses of tourists’ movement patterns in a city [47], improvements in tourism experiences through the examination of the relationship between the street network of a historic area and tourists’ spatial cognition [17], and the comprehensive application of urban forms and tourist preferences in historic heritage planning [48]. Few studies were conducted on the spatial layout of tourist service facilities. Some studies implemented space syntax to explore the structural characteristics of retail stores in tourist areas [20]. However, studies on the street network structures and tourist service system characteristics in historic areas are yet to be made.
3. Materials and Methods
3.1. Study Area and Data
The southern historic area of the old city is the most densely populated area in Nanjing. Among the 26 communities in the area, there are 6 communities with more than 1000 people and 8 with 500–1000 people [49]. In this area, the Qinhuai River connects the city walls from the east to the west, the Gate of China in the south, and the Baixia Road in the north. The total area of this region is approximately 6.9 km3, including a number of historic districts with different functions and characteristics, which embodies the traditional style of the old city of Nanjing in the Ming and Qing Dynasties. As shown in Figure 1, historic districts can be divided into three categories according to different development stages. One is the relatively mature Confucius Temple District (developed in 1984). The second is the Western Gate District (opened as a scenic spot in 2013), the Pingshi Street-Nanbuting District (developed in 2012) and the 1865 Creative Park. The third is the Western Gate District, which was not fully developed. The coexistence of different stages of tourism development in historic districts enables effective investigation of the relationship between the street networks and tourism service facilities in this area. Zhu et al. (2017) used Space Syntax to study the leisure and business districts in the Qianmen area in China [50]. Xu et al. (2020) used Space Syntax to study the historical towns along the Chinese canals [17]. Based on the support from literature, the application of Space Syntax in this empirical area is effective and feasible.
Tourist service facilities are distinct from public facilities that serve a local community. The tourist service POI data in this study were downloaded to the map data processing program Bigemap software [51]. The downloaded POI data were organized, and 2760 data related to tourism were selected. In particular, a total of 273 data on tourist attractions were identified. Because of limitations in resource characteristics, the selected attractions were primarily distributed in the districts developed as tourist districts. The districts without tourism development often have only scattered scenic spots, which do not form a cluster of open tourist attractions. A total of 2487 data on tourist service facilities were selected. According to the Industrial Classification for National Economic Activities [52], the facilities were divided into six types: accommodation, catering, shopping, culture, entertainment, and transportation (Table 1). ArcGIS software (developed by Environmental Systems Research Institute, Inc., Redlands, USA) was used to establish point data files labeled with coordinates.
A 0.51-m magnification Mercator projection was used as the basic image for the vector street network data and jointly applied with field surveys to illustrate the street axes. Humans perceive urban environments by walking and decide whether to continue walking accordingly [53]. Because historic buildings and remains are vastly distributed in historic areas, the traditional streets are narrow and mainly for the purpose of walking. A total of 1607 street axes, including all streets and pedestrian lanes, were illustrated and converted to an axial map by using Depthmap software (developed by University College London). The map was examined using Node Count, and the syntactic variables were calculated.
3.2. Spatial Variable of Street Network
Configurations constitute the cores of space syntax [54], and connectivity, control, depth, and integration values are basic syntactic variables. These variables are used to quantify the relationship between each pair of nodes and of nodes with the entire structure as well as the characteristics of the entire structure [55].
The connectivity value Ci represents the connectivity of the street i and indicates the number of streets neighboring the street i in the system. A higher Ci value indicates that the street is connected to a greater number of other streets and is more permeable. The value is calculated as follows:
where i represents a particular street in the system (i = 1, 2, …, n. n is the total number of streets). k represents the total number of streets directly neighboring the street i.
The control value represents the level of control a street exerts over its neighboring streets, reflects its influential power over neighboring streets, and is expressed as the sum of the reciprocals of all connectivity values of the neighboring streets. A higher value indicates that the street is more likely to be a traffic center in the urban street network. The value is calculated as follows:
where k indicates the total number of streets directly neighboring the street i, j (j = 1, 2, …, k) represents the streets directly neighboring i, and Ci is the aforementioned connectivity value.
The total depth indicates the location depth of a specific street and is expressed as the mean of the minimum number of steps from the street to all neighboring streets (assuming that the minimal number of steps between two neighboring streets is 1). A lower mean spatial depth indicates greater accessibility. The value is calculated as follows:
where n represents the total number of streets; represents the minimum number of steps between streets i and j.
Agglomeration represents the accessibility of a street from neighboring streets. Higher agglomeration indicates higher accessibility. Agglomeration is divided into global and partial agglomeration, according to the scope of measurement. Global agglomeration indicates the centrality of a specific street relative to other streets and is a function related to the reciprocal . Its value is calculated as follows:
where is the relative asymmetric value of the global agglomeration, is the actual relative asymmetric value of the global agglomeration, is the normalized value of the relative asymmetric value, indicates the total depth of the street i, and n is the total number of streets.
3.3. Agglomeration Characteristics of POIs
Kernel density estimation (KDE) is a crucial method for mining geographic spatial data and is applied to calculate the density of elements surrounding each output pixel. By using ArcGIS, KDE is performed to identify the distribution model for and density of POIs in an urban space [56]. A higher kernel density value indicates a higher POI density as well as greater agglomeration.
3.4. Correlation between POIs and Street Network Structure
The natural fracture method was used to divide the space syntax variables of the streets into seven levels. In ArcGIS, based on the inherent natural grouping in the data, this method was used to judge the natural turning point of variable scores as the classification boundary, group the similar values most appropriately, and maximize the difference between various classes [57,58]. In addition, the boundary is set at the maximum difference position to divide the variables into seven levels [59]. A buffer zone with a 400-m radius was established for the street axis corresponding to each level of variables [11]. The buffer distance is the number of steps a pedestrian takes in 5 min under normal circumstances and fulfills tourists’ cognition inconvenient travel. The tourist service POI density at each level of the buffer zone (i.e., the number of POIs per km2) was statistically calculated. Bivariate correlation analysis was performed on the density and the mean space syntax variable in each buffer zone. Data fitting was conducted through the least-squares method to analyze the explanatory power of the syntactic variables for the POI density [59]. Through these methods, the direction and level of street network structures and tourist service POI agglomeration can be obtained.
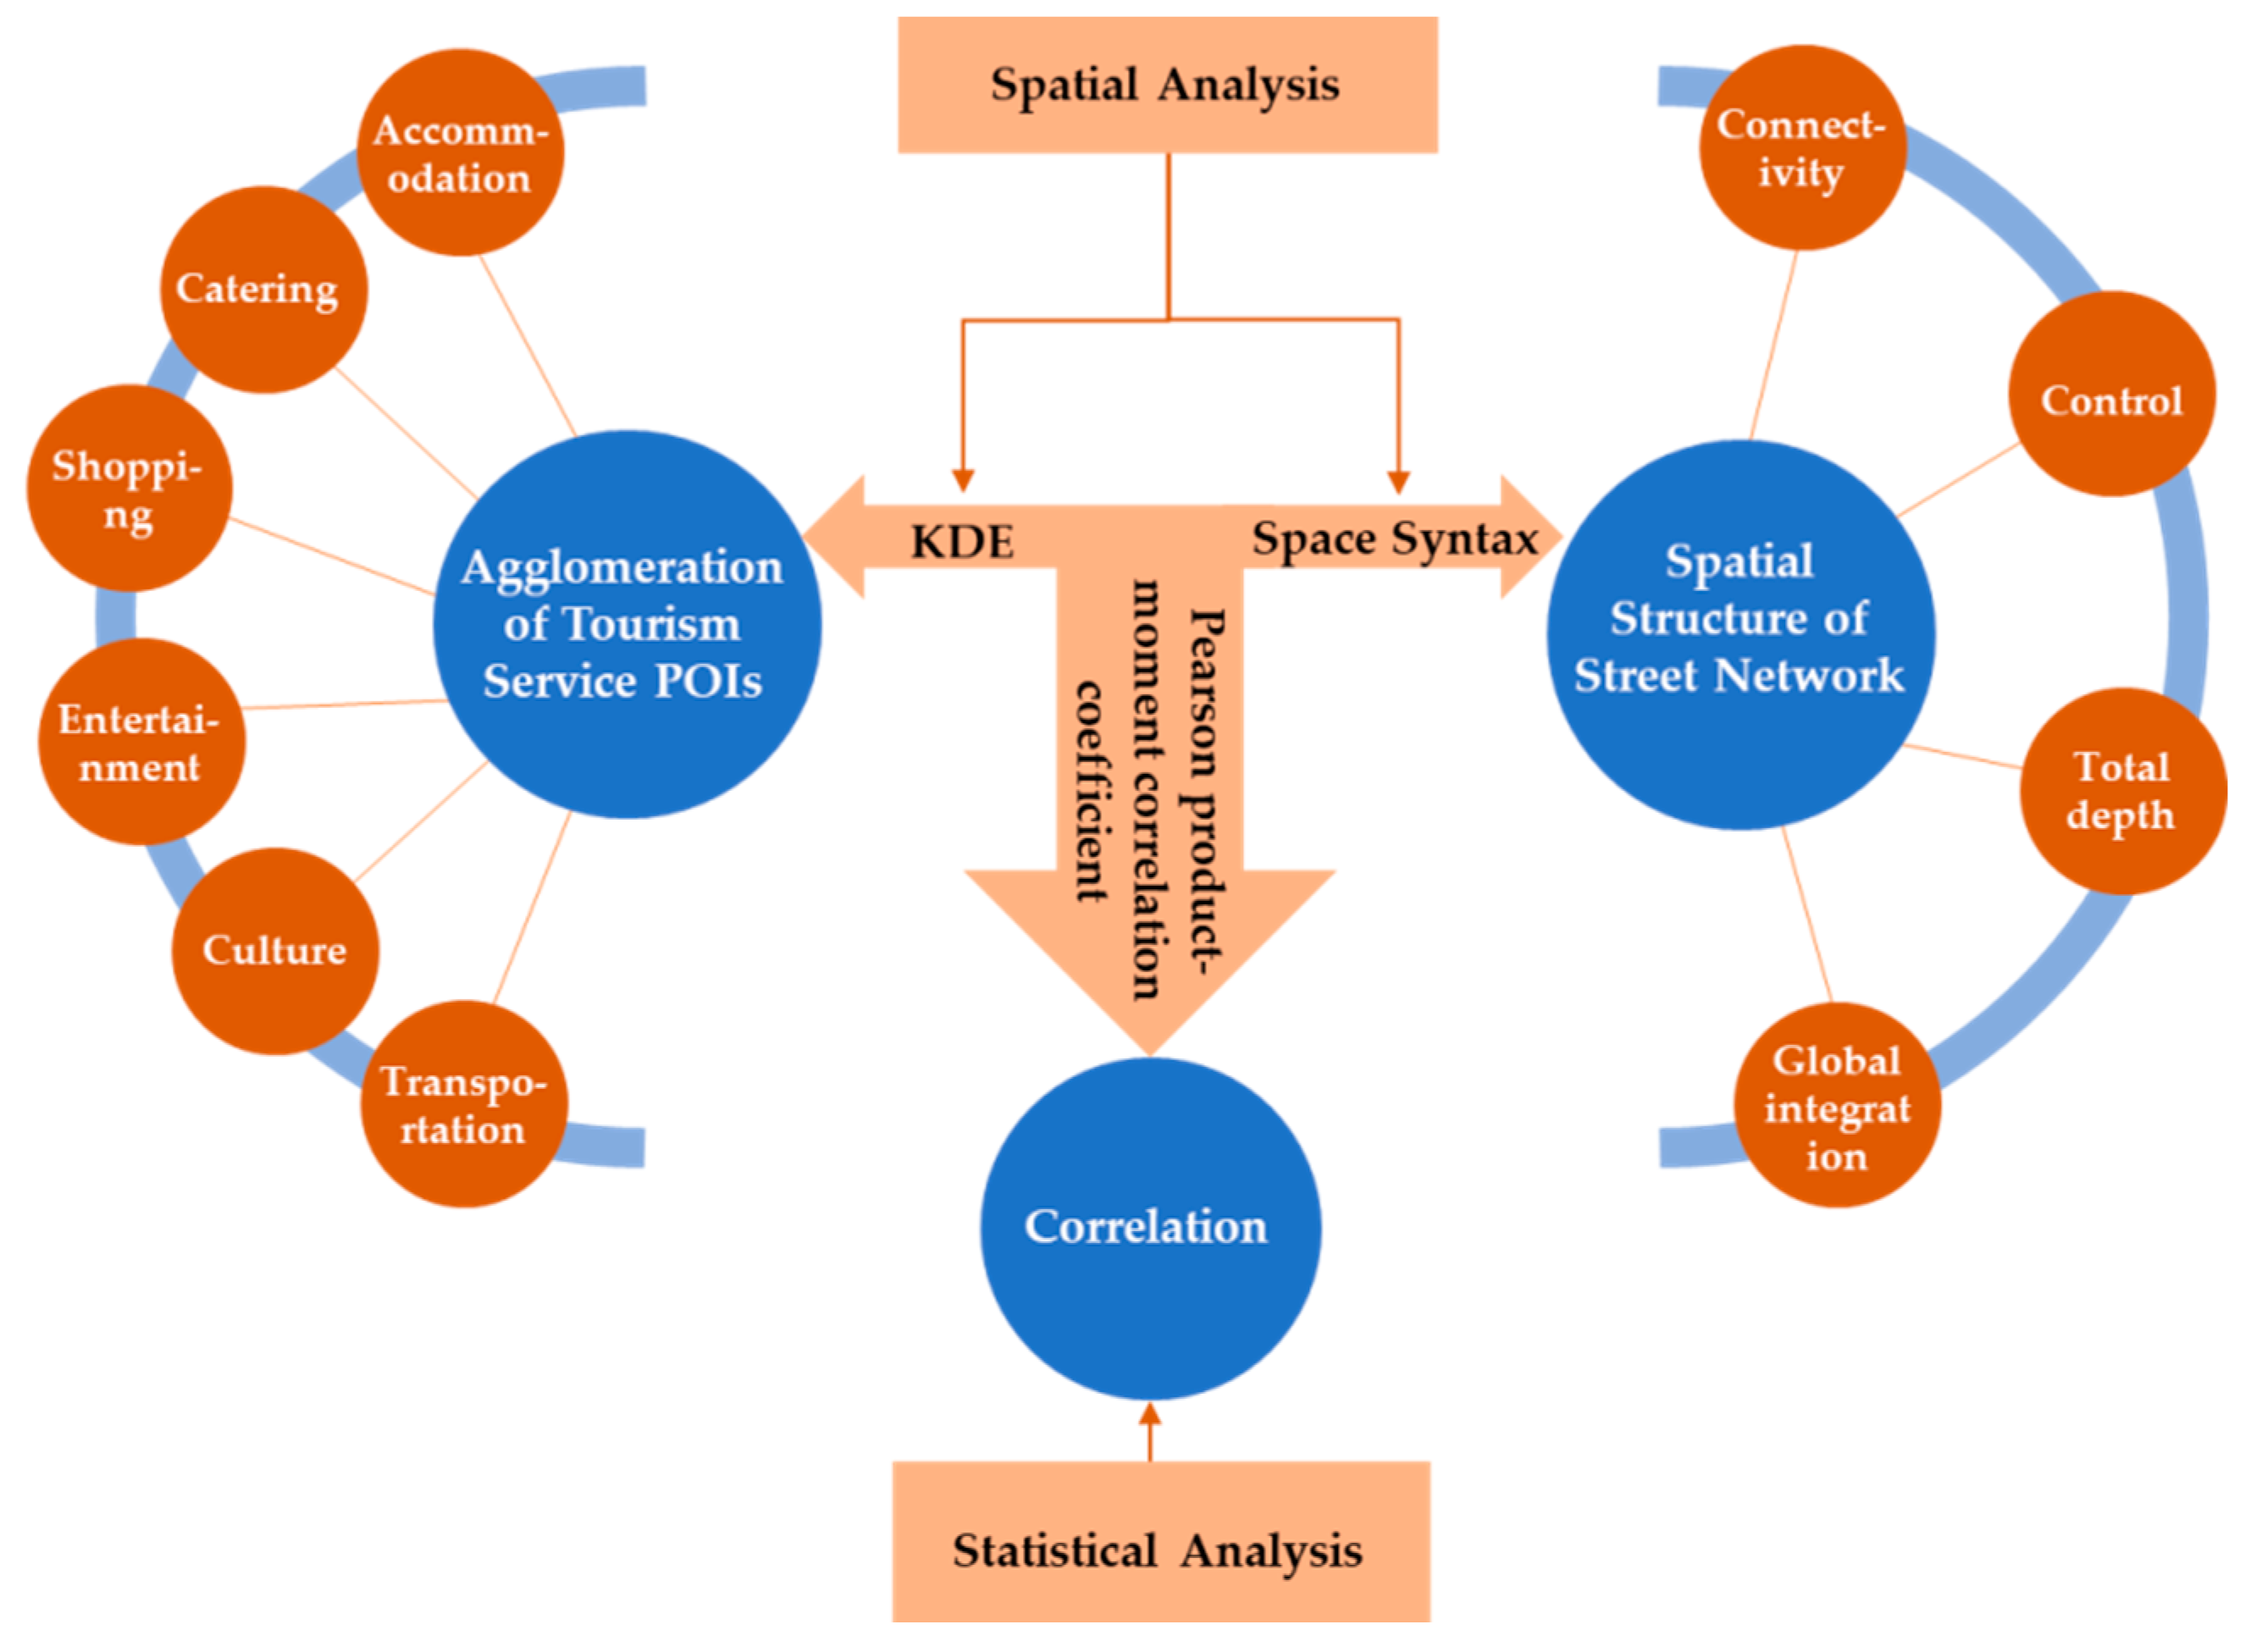
Figure 2 illustrates the research framework employed in this study.
4. Results
4.1. Agglomeration of Tourism Service POIs
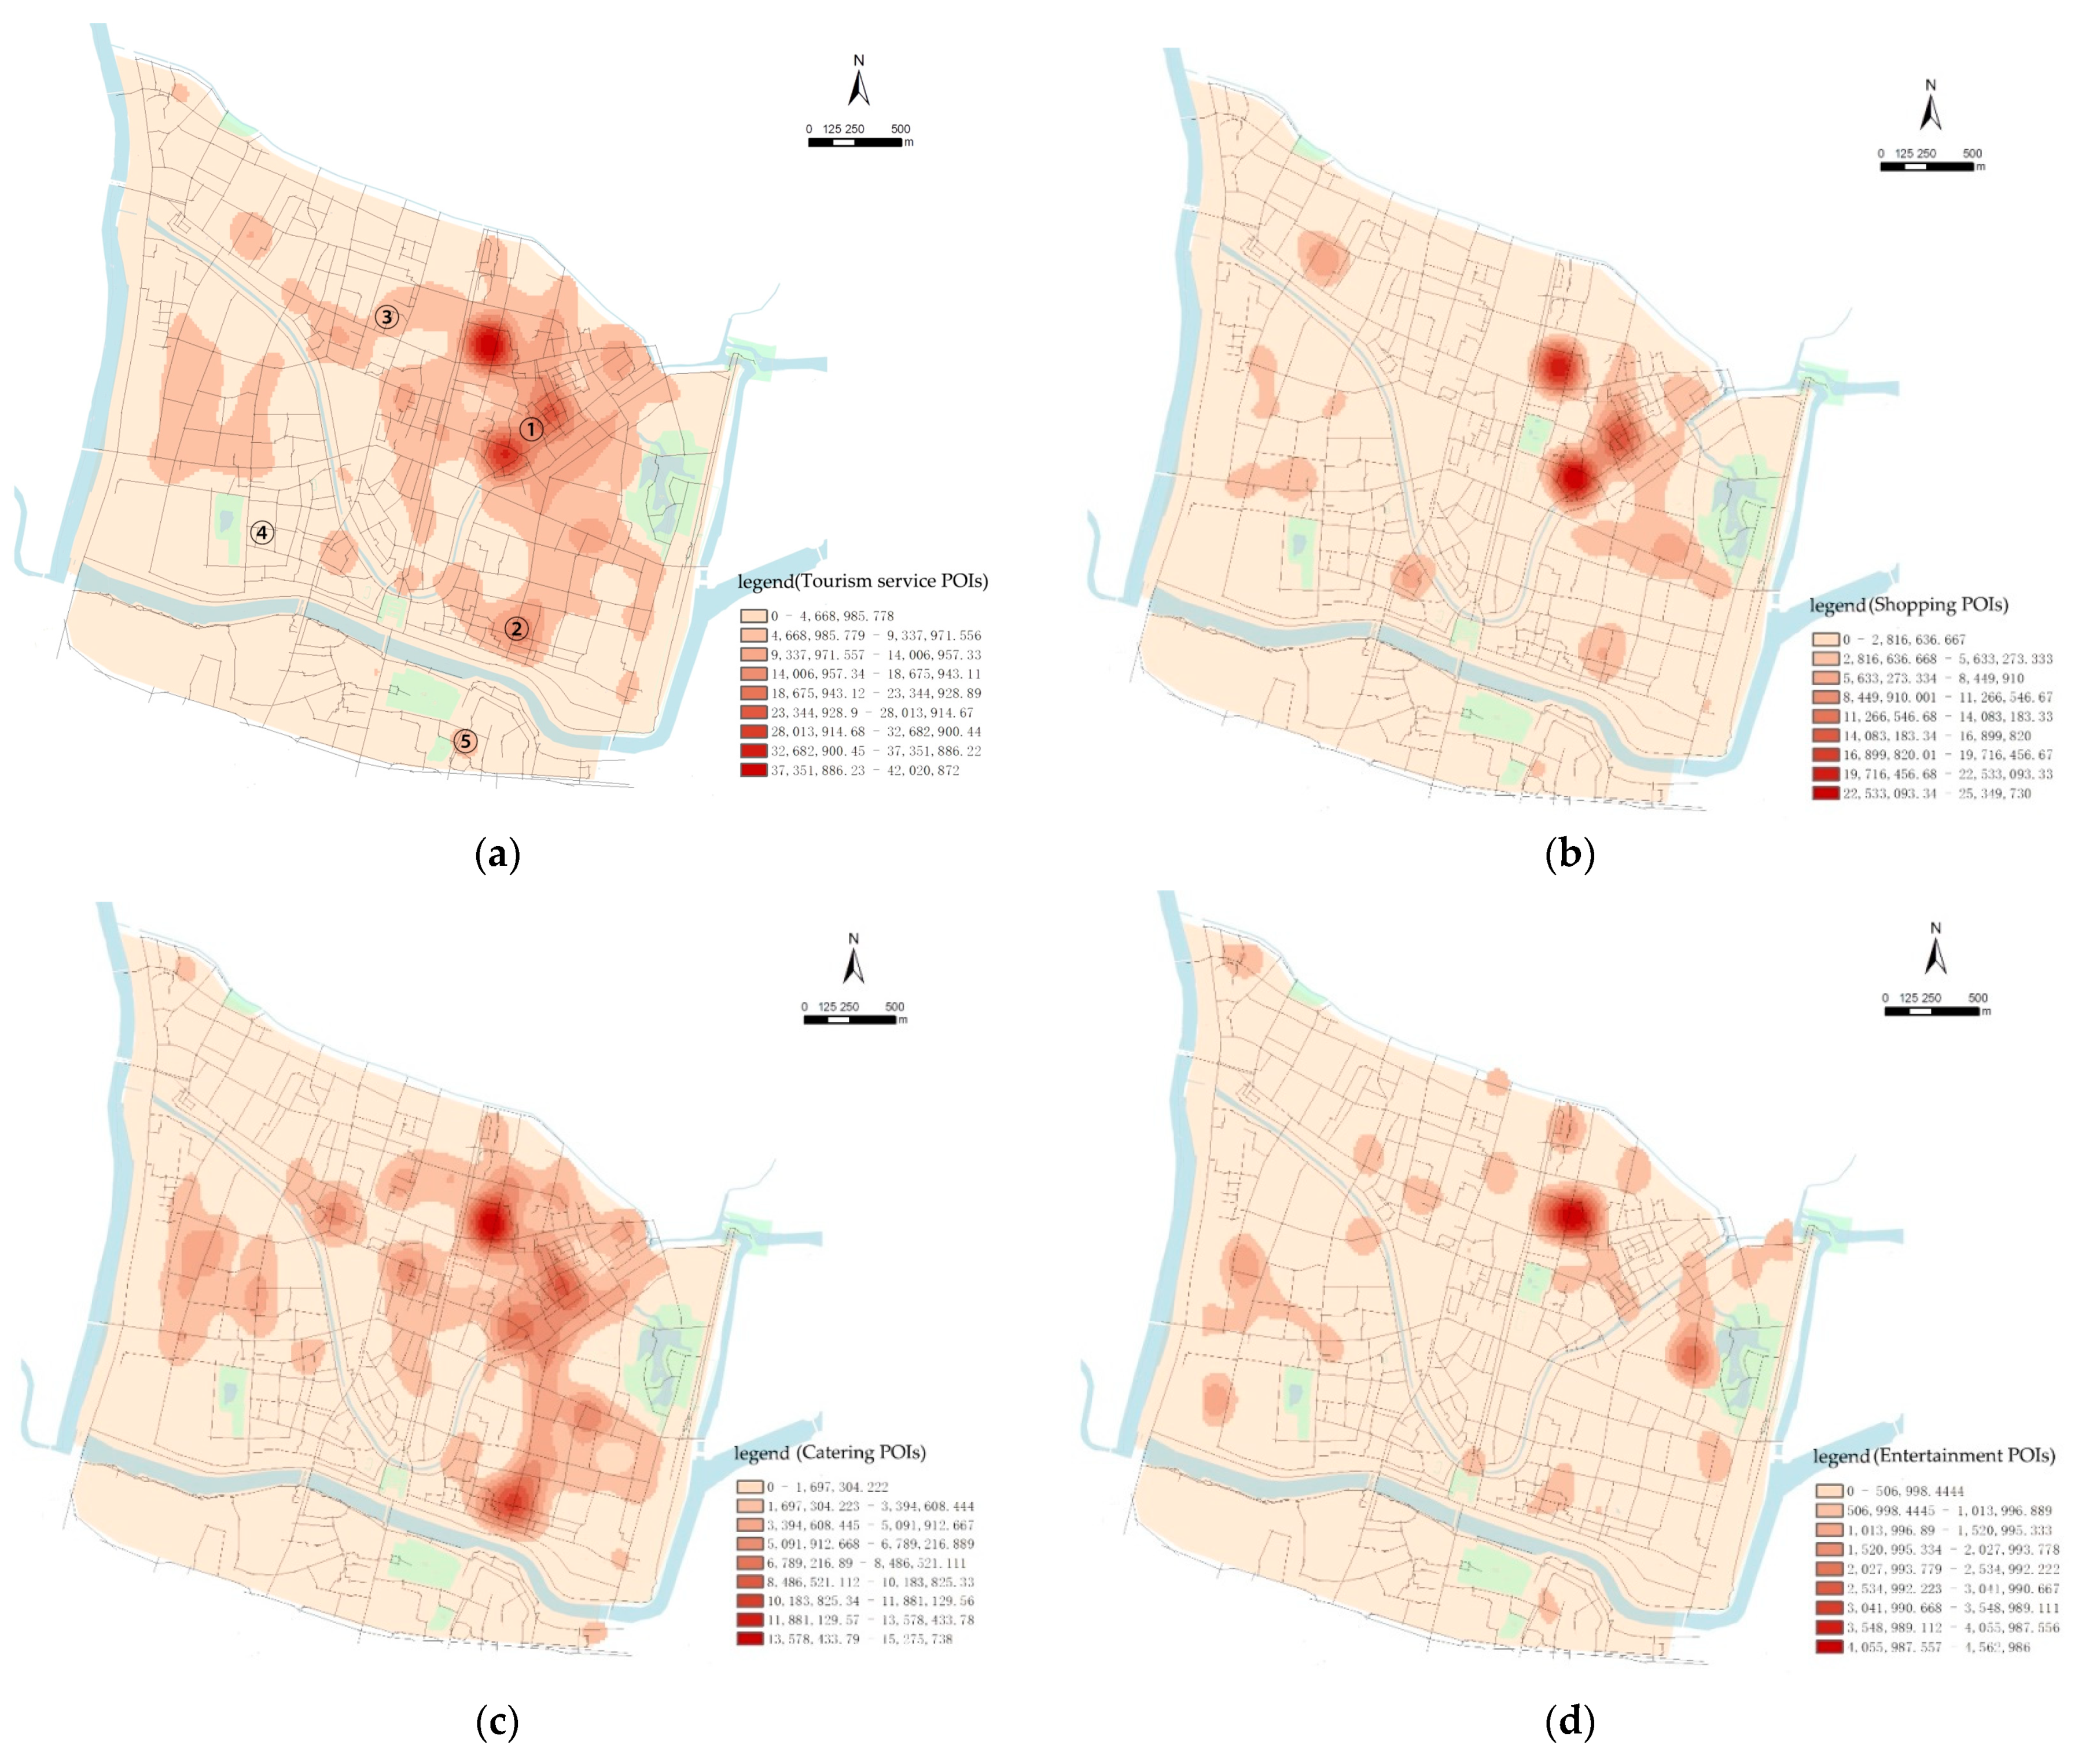
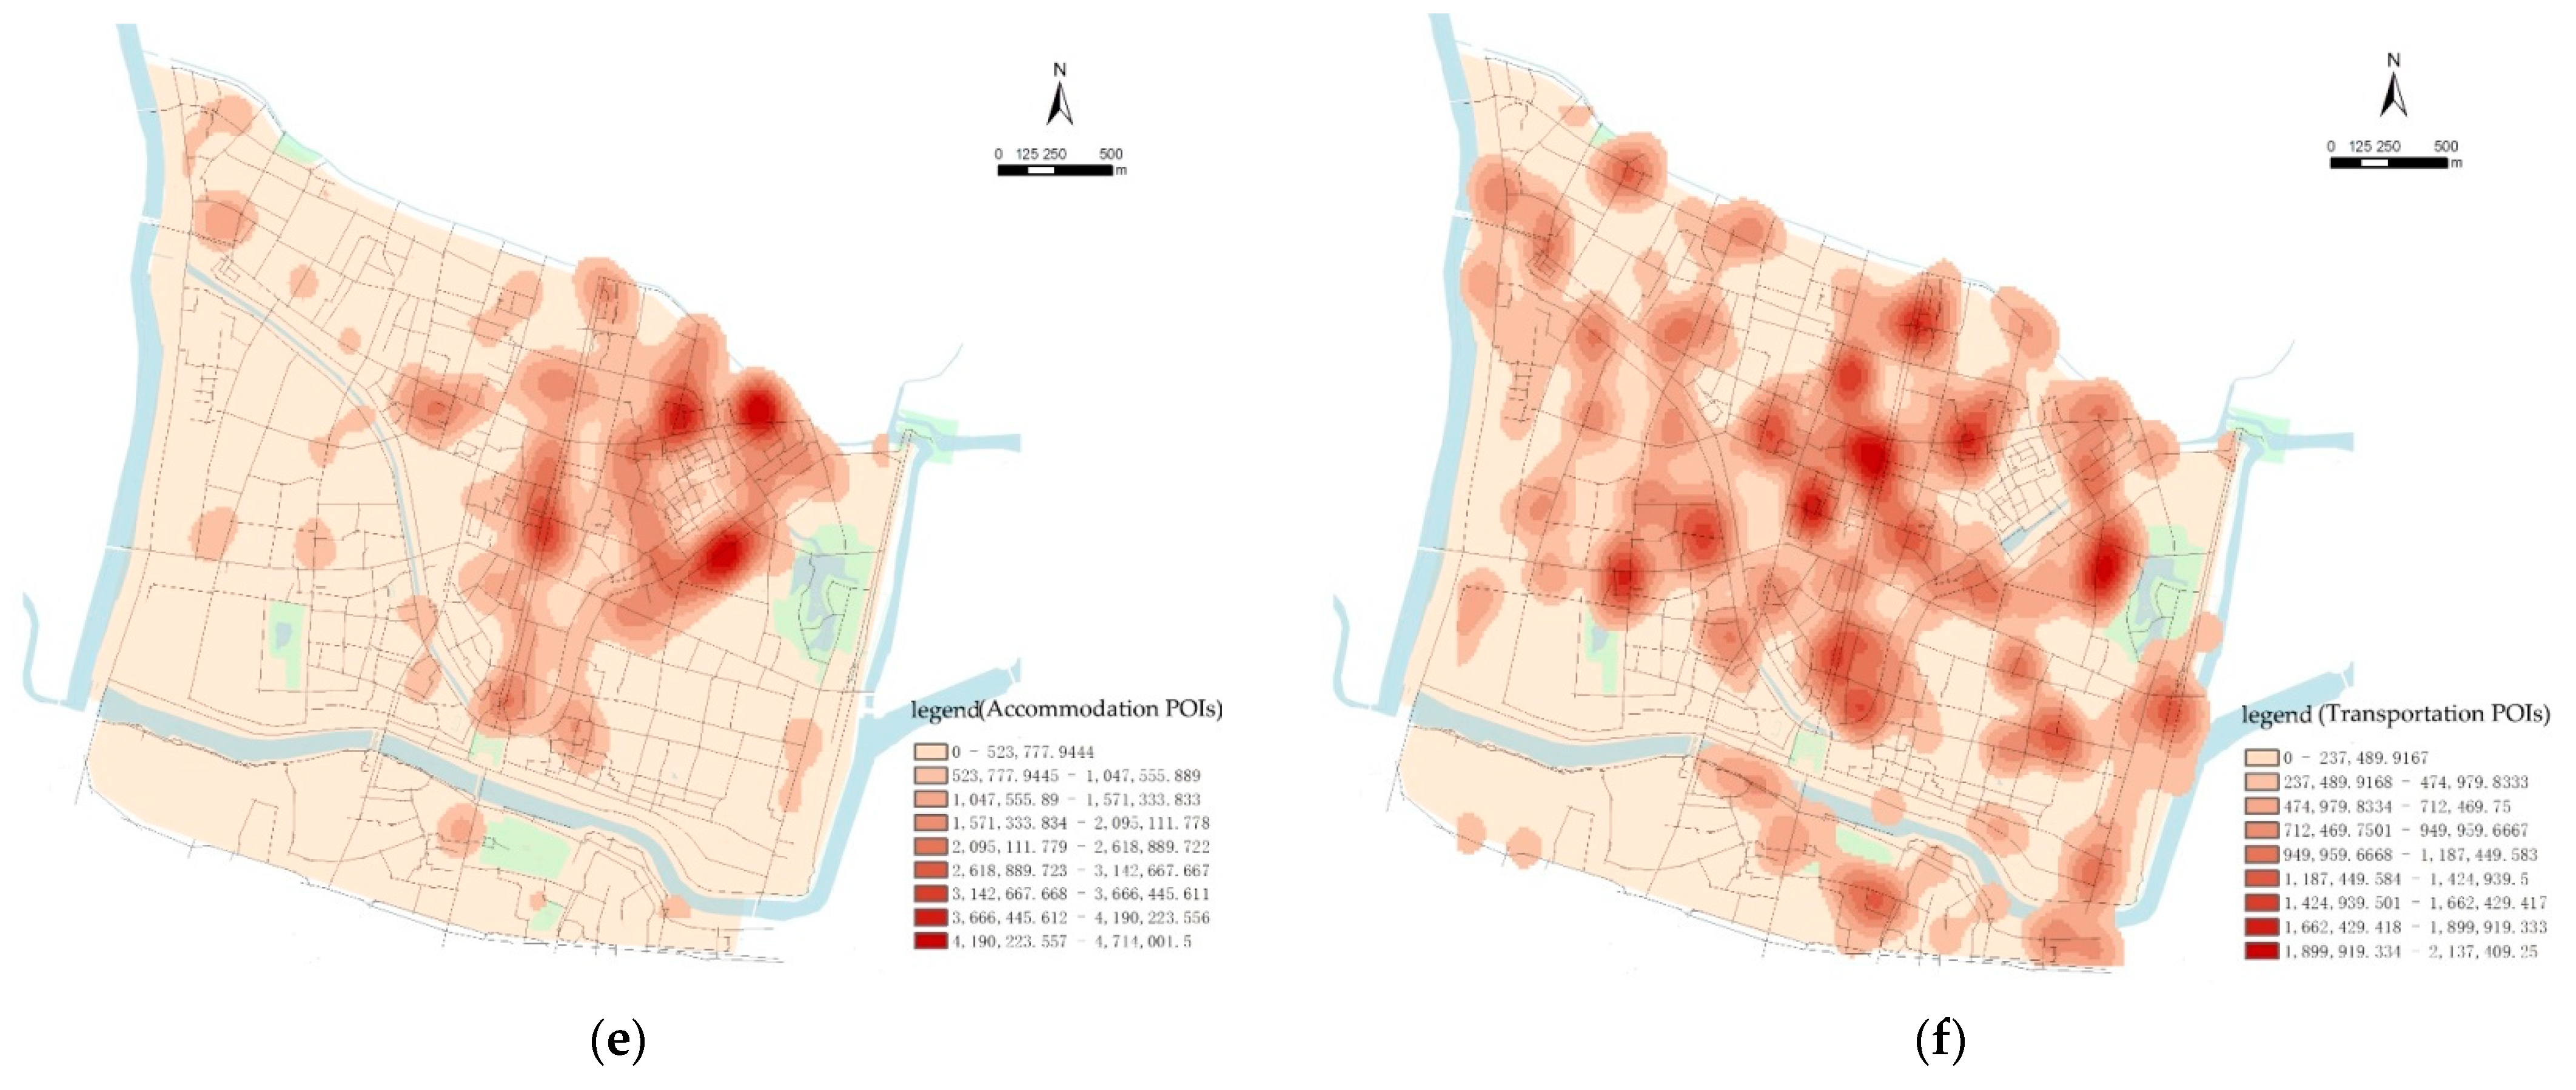
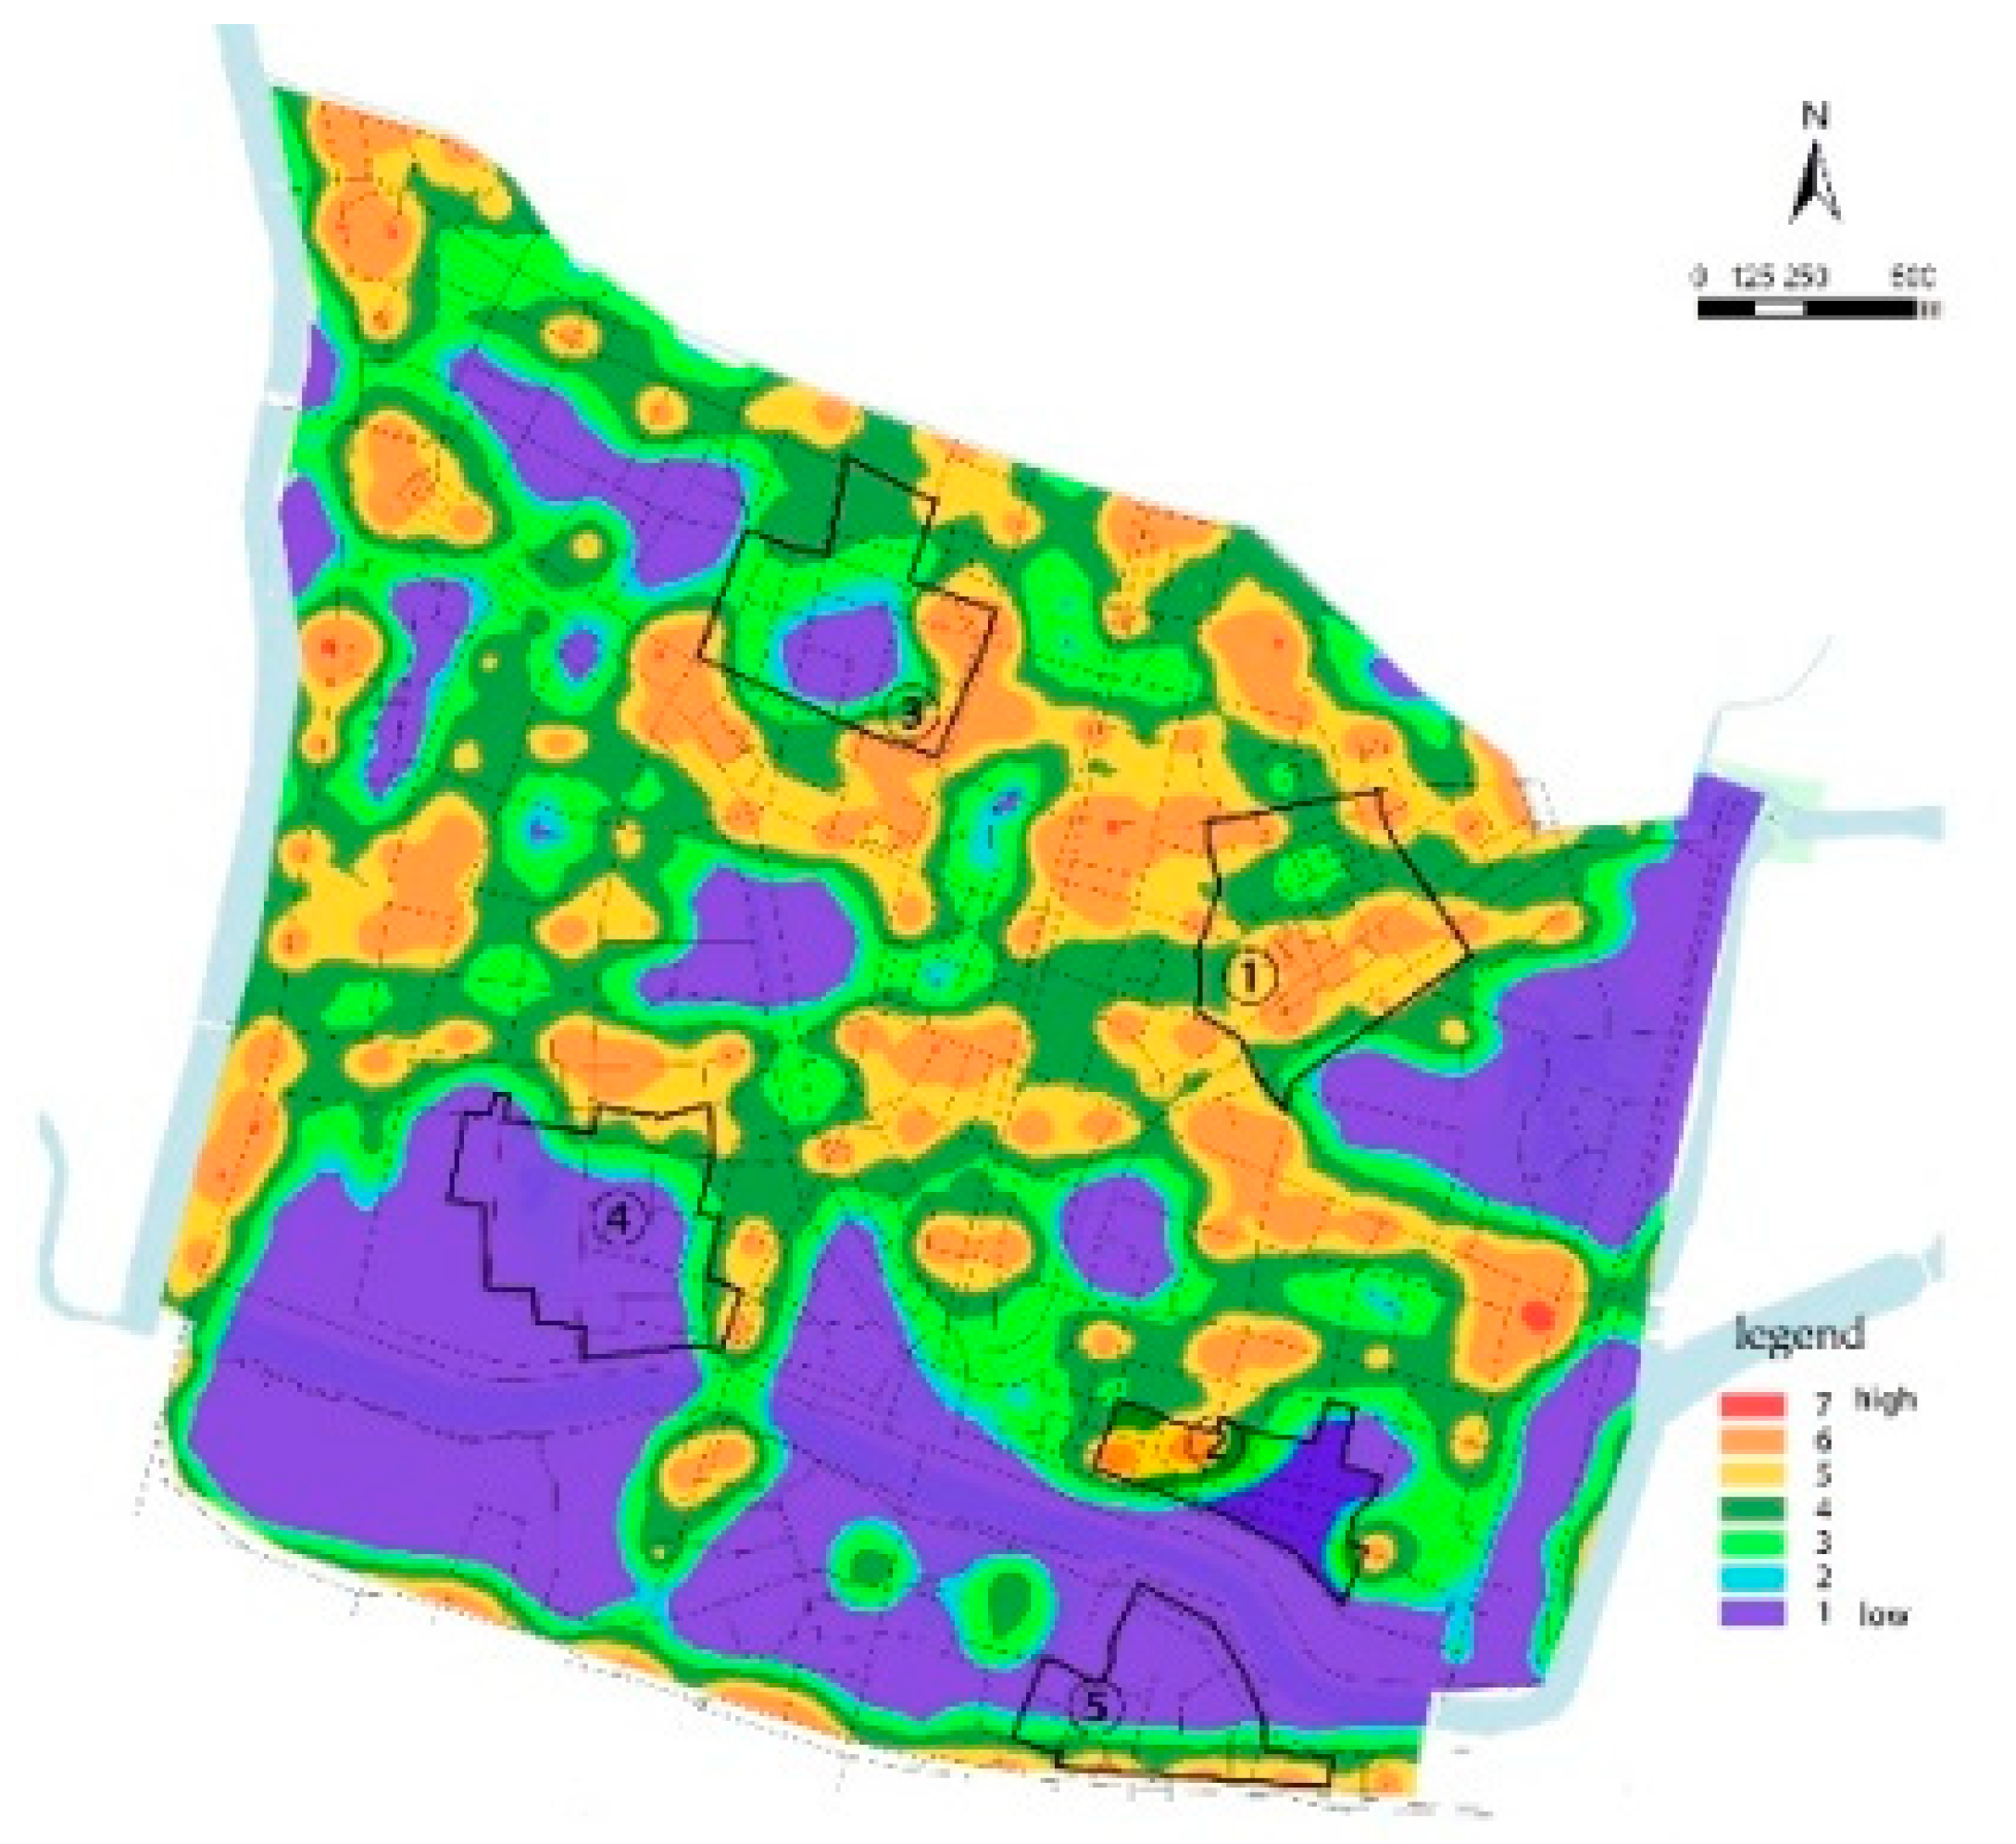
ArcGIS was used to perform KDE on tourist service POIs, and the results were classified at equal intervals (Figure 3). The service POIs almost completely covered the research area, forming a multilayer structure of core agglomeration area, secondary agglomeration area, and peripheral area. Due to the different regions and tourism development stages of historical districts, there are different distribution characteristics and agglomeration types of tourism facilities. The mature Confucius Temple District (Location ① in Figure 3a) has a high concentration of shopping, catering, entertainment, and accommodation facilities, and is the core agglomeration area of tourism service facilities in the southern historic area. The Eastern Gate District (Location ② in Figure 3a) and the Nanbuting District (Location ③ in Figure 3a) were completely renovated and opened to foreign visits recently and are the secondary agglomeration area with lower POI (i.e., shopping, catering, and entertainment facilities) density than the core agglomeration area. The peripheral area is located in the Western Gate District, where the tourism has not been completely developed (Location ④ in Figure 3a), and the 1865 Creative Park, which mainly focuses on office functions (Location ⑤ in Figure 3a). The peripheral area exhibits the lowest number and density of tourist service POIs. Numerous scattered transportation POIs form multiple secondary cores, which are evenly distributed in the southern historic area, providing residents with convenient daily travel and tourist services. The cultural POIs are sparse and not agglomerated. According to Figure 3, most tourist service POIs are agglomerated around tourist attractions; therefore, there is a correlation between the distribution of tourism service POIs and the distribution of tourist attractions.
Through the heat map at noon on 1 October 2021, it is found that the concentration degree of people in different historic districts is consistent with the perfection of facilities.
Figure 4 shows that during China’s National Day holiday, residents and foreign tourists travel more, and the population concentration in the south of the old city is high. The highest concentration is located in the southeast subway station and several comprehensive shopping centers. From the perspective of tourists, the Confucius Temple District has the highest reputation and the most abundant and perfect facilities, so it is the most attractive to tourists and has the highest concentration of people. The second highest concentration is in the Eastern Gate District. People gather in the west of the district with many entertainment, shopping, and catering service facilities. Similarly, in the Nanbuting District, people gather in the eastern part where accommodation, catering, and entertainment facilities assemble. However, the Western Gate District and 1865 Creative Park are less crowded due to the undeveloped blocks and the positioning of the business function.
4.2. Structure of Street Network
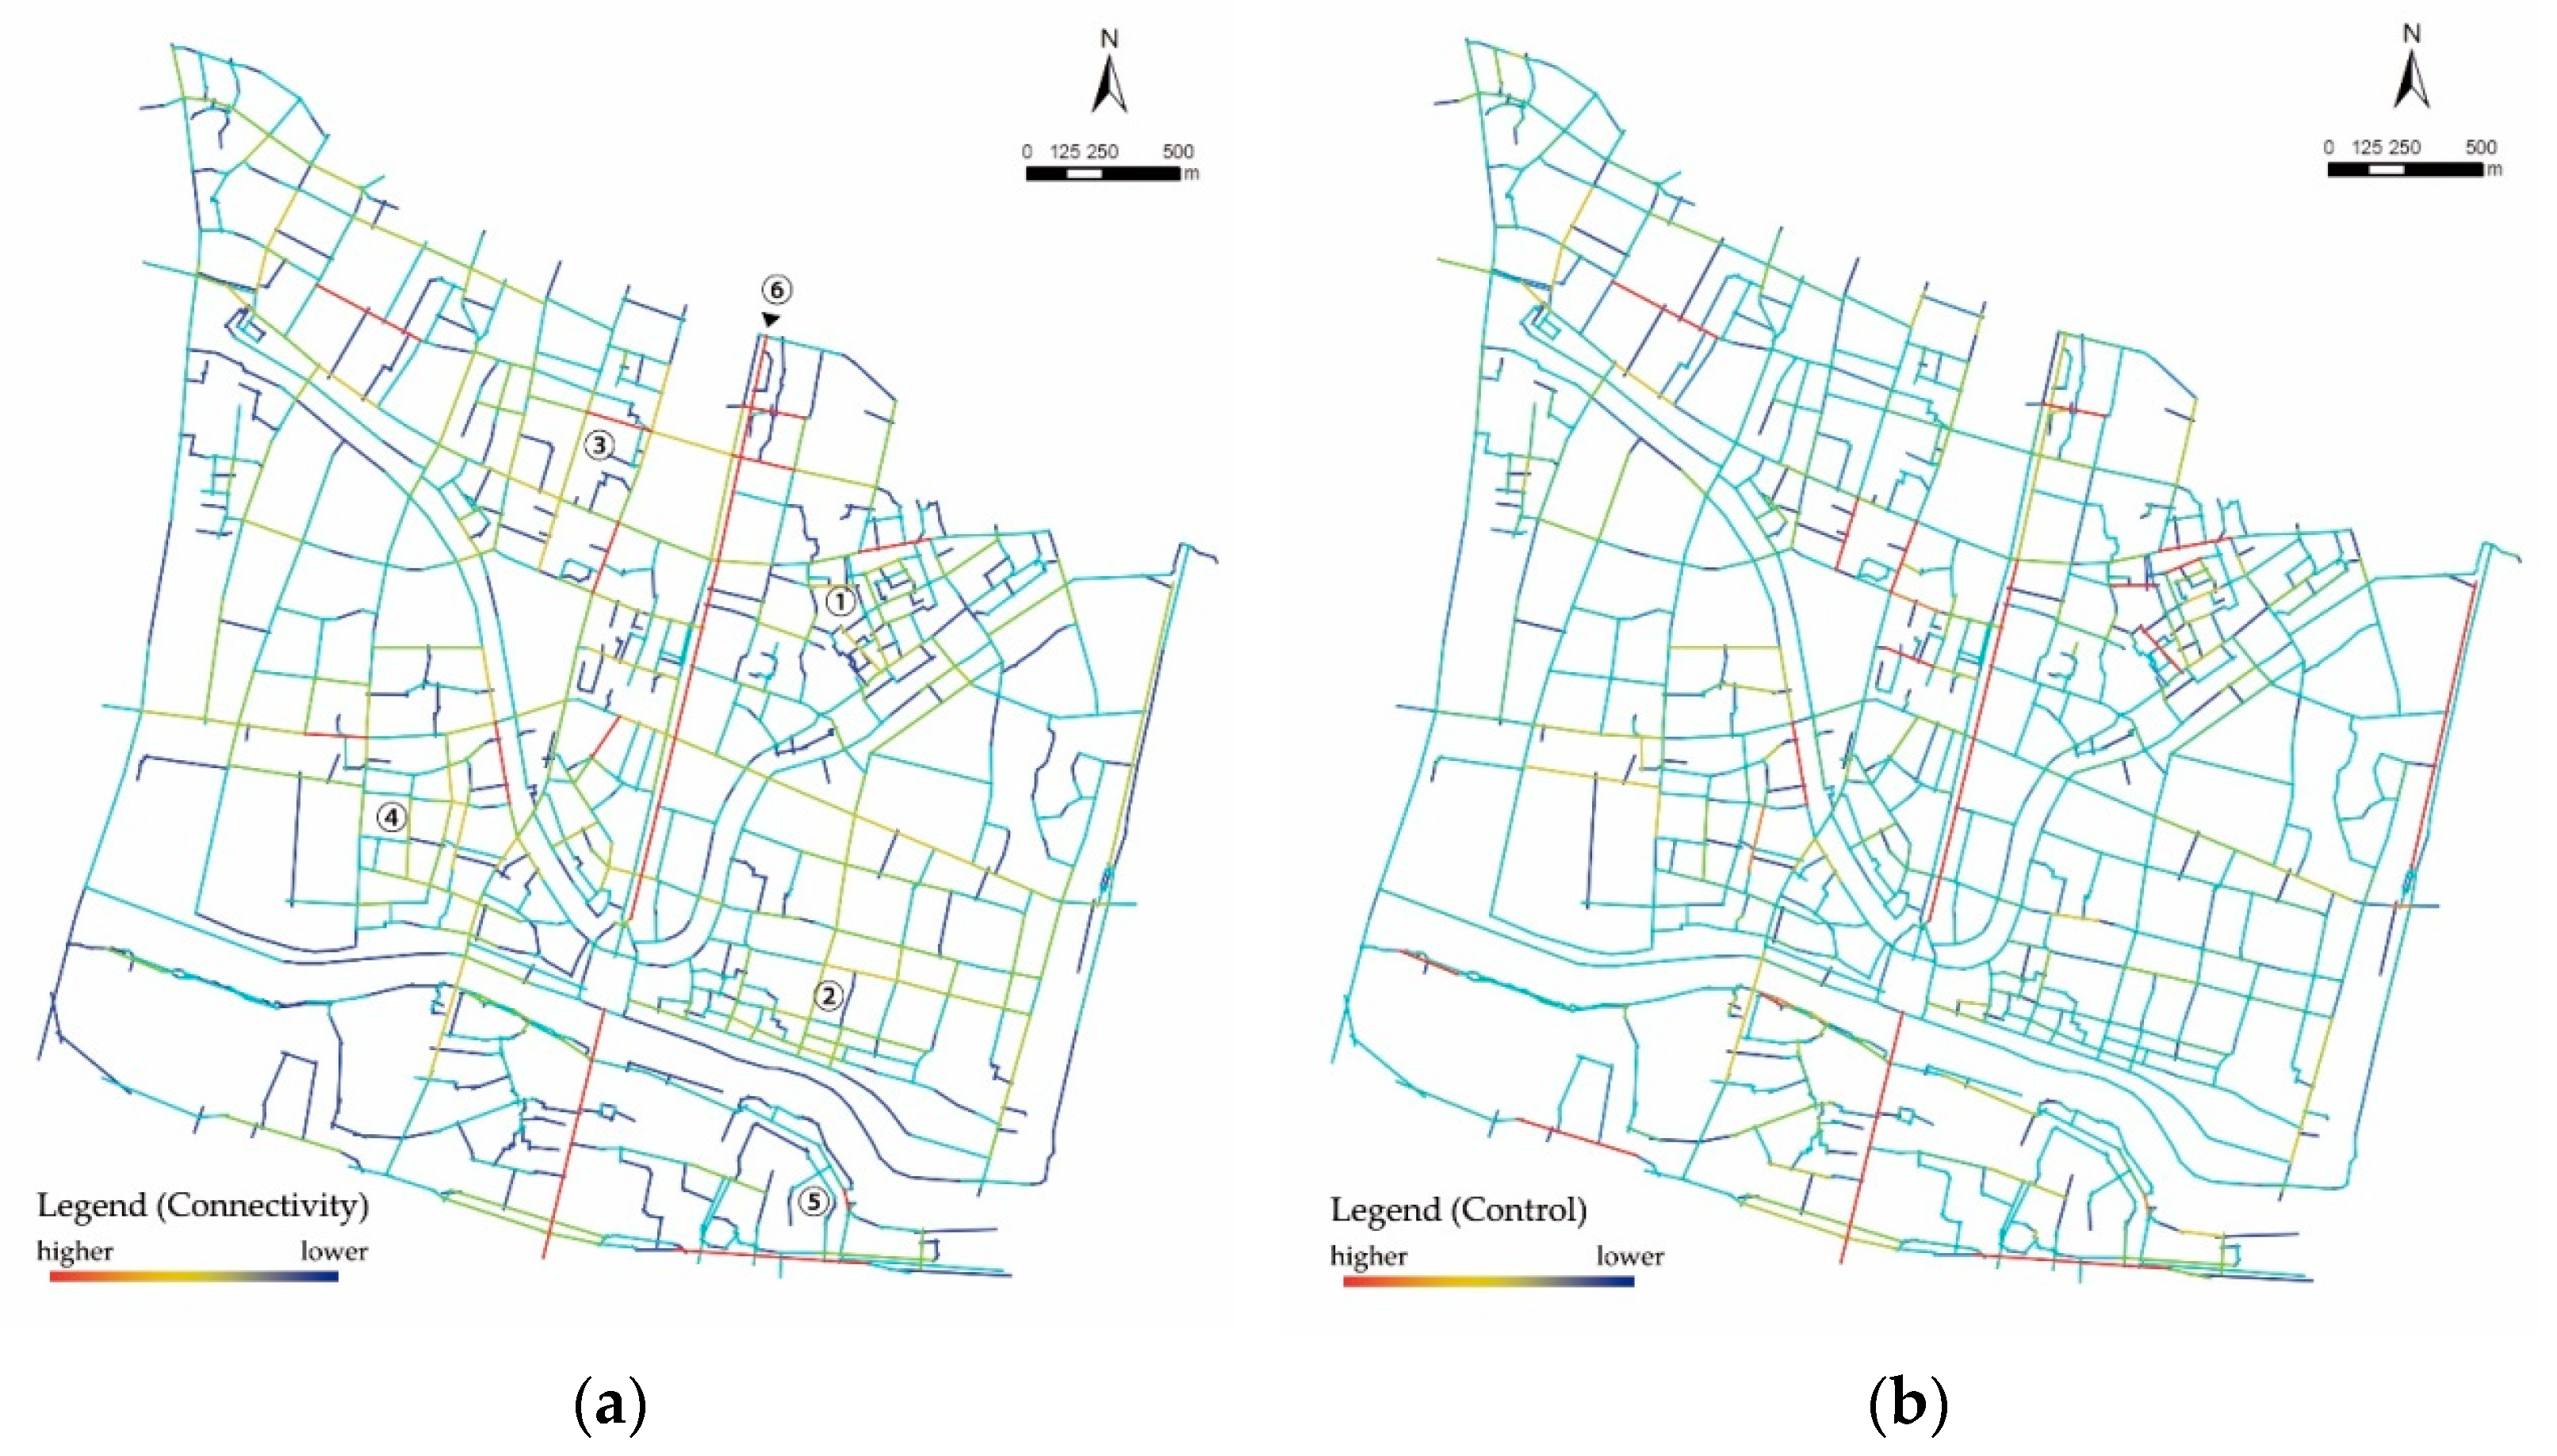
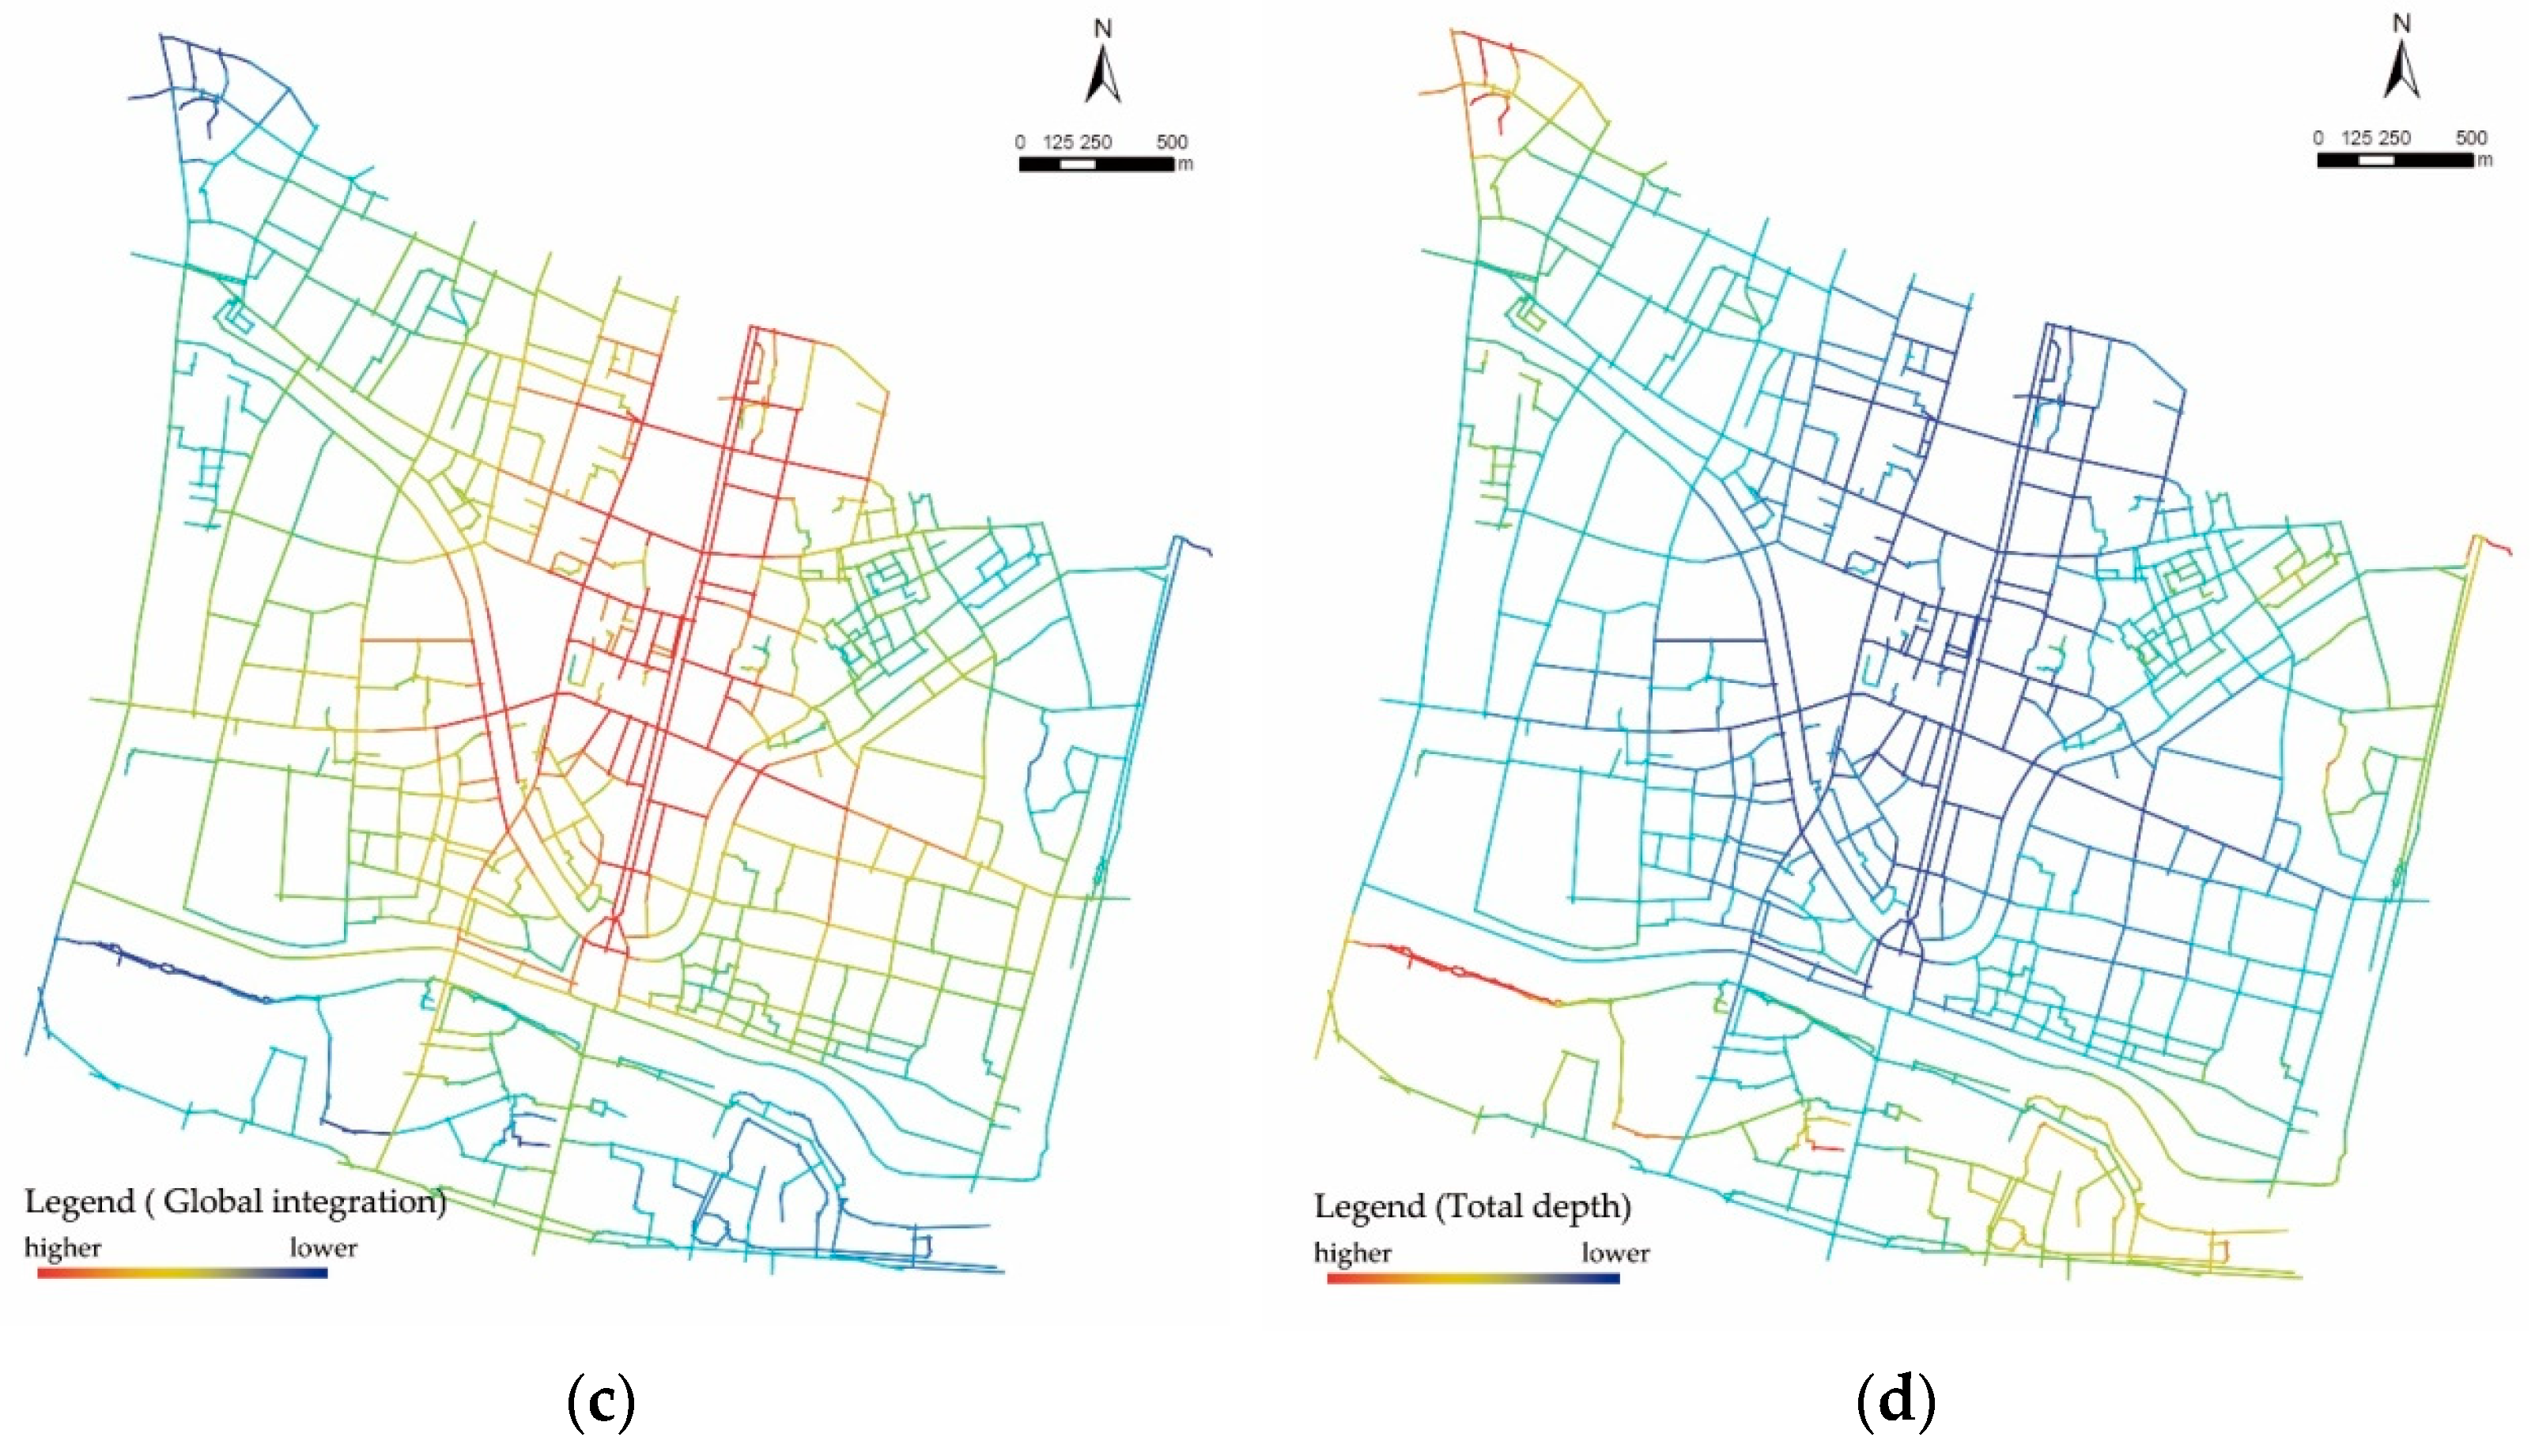
According to Equations (1)–(5), Depthmap was employed to calculate the syntactic variable of each street. As shown in Figure 5, Zhonghua Road (Location ⑥ in Figure 5a) exhibits the highest connectivity, the highest control value, and the greatest influence on its neighboring streets. According to the Nanjing City Master Plan [60] Zhonghua Road is designated a key street and a historical axis in the major urban public space system, and the main historic districts such as the Confucius Temple, the Nanbuting, and the Eastern Gate District are located on both sides of the axis. This also corresponds to the status as a traffic node according to the space syntax analysis. The low total depth areas and high global integration areas are distributed along Zhonghua Road, constituting the core region of the historic area as well as the core agglomeration area of the tourist service POIs. Because of historical preservation and scenic development, this region exhibits high street network density and a complex street network structure; this means that Zhonghua Road exerts great influence over its neighboring streets, a high level of development and accessibility, and satisfactory spatial penetration. The peripheral area, which exhibits numerous external traffic nodes, allows for rapid internal and external traffic connections and is thus highly accessible. Accordingly, some of the streets in this area exhibit high connectivity and control values. In the entire the southern historic area, no significantly high connectivity and control value cores are identified.
There are 186 axes in the Confucius Temple, 83 in the Eastern Gate, 90 in the Nanbuting, 73 in the Western Gate District, and 51 in the 1865 Park. The highest average connectivity and control value is the Nanbuting District. This is because this district is closest to the core area of integration, mainly large areas of traditional houses, with the most regular road network, strong connectivity, and compact space. In the 1865 Park, due to the small number of roads, few connections, and twists and turns, the connectivity was poor, the space was scattered, and the spatial identifiability was poor. Therefore, the average connectivity and control value is the lowest and is not in the high global integration area. Although the stages of tourism development are different, most of the streets in the districts are traditional streets. In the process of urban renewal, the main structure of the street network will hardly be changed for the continuation of the historical features. Therefore, the street network structures are similar, and there is little difference in their accessibility and permeability.
4.3. Correlations between Tourism Service and Street Network
International Business Machines Corporation Statistical Product and Service Solutions software (IBM SPSS) was applied to calculate the general correlation between POIs and the spatial variables of street networks. As shown in Table 2, the POIs are significantly and positively correlated with the connectivity, control, and global integration of the street network. As revealed through a comparison between Figure 3 and Figure 4, a high-to-high agglomeration pattern is present in the spatial relationship between the POIs and connectivity, control, and global integration. The POIs are significantly and negatively correlated with total depth, facilitating a high-to-low agglomeration pattern. The spatial variable most strongly correlated with the POIs is global integration, and the spatial variable with the weakest correlation is connectivity. The relatively weak correlation of connectivity and control values with the POIs is due to their high-to-high distribution pattern in the core agglomeration area and high-to-low distribution pattern in the peripheral area, which markedly influence the correlation analysis. Combining the five historic blocks, the global integration of the streets in the tourism facility agglomeration area of all districts, except the 1865 Park, is at the upper-middle level of 4 or higher. The layout of tourism service facilities is in the area with strongest agglomeration and best accessibility, which further proves the high correlation between the global integration and the distribution of service facilities.
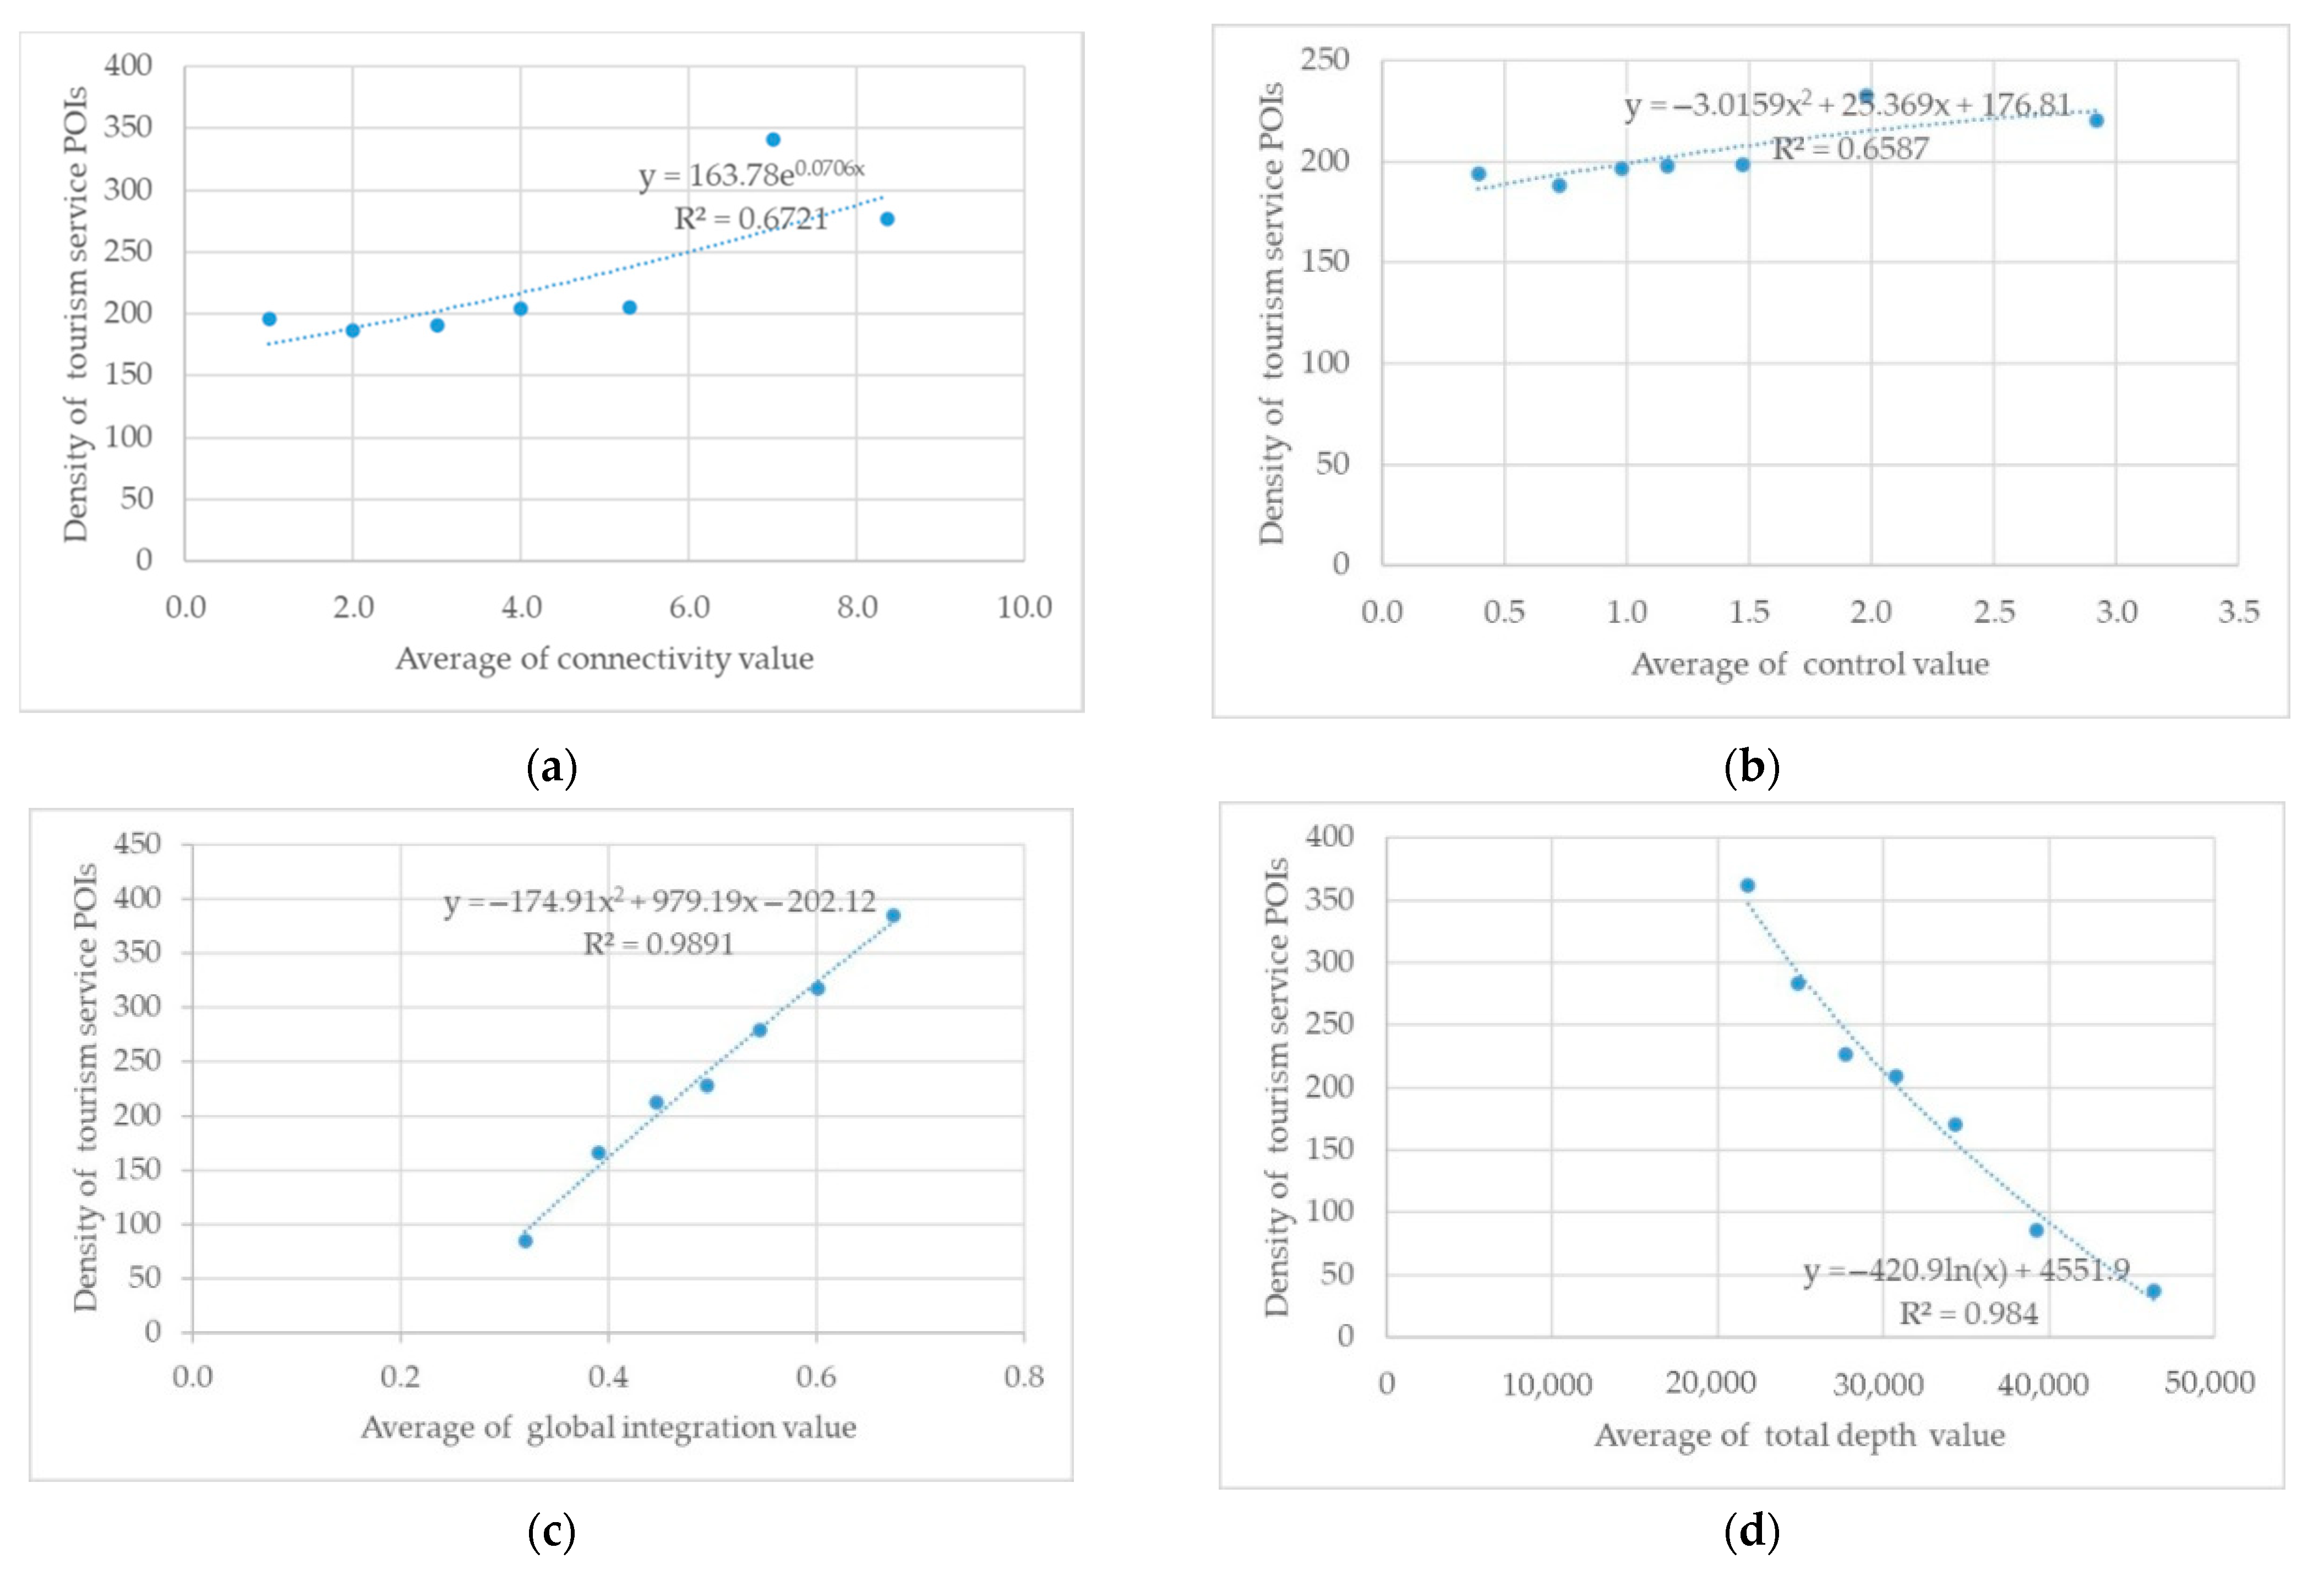
According to Figure 6, the coefficients of determination (R2) are 0.6721, 0.6587, 0.9891, and 0.984 for connectivity, control, global integration, and total depth, respectively. This indicates satisfactory fit. The trend of the fit curves is consistent with the correlation analysis results in Table 2. As illustrated in Figure 5a,b, notable fluctuation can be identified in the scatter dots and fit curves. The buffer zone with Level 6 connectivity and control values differed considerably from the other buffer zones in POI density; in particular, the POI density in this buffer zone is higher than in the Level 7 buffer zone. This is because no notable agglomeration cores of connectivity and control values are identified. The street distribution in the Level 6 buffer zone is relatively scattered, and the buffer zone covers most of the agglomeration areas. The Level 7 buffer zone covers a smaller area of the agglomeration areas than the Level 6 buffer zone does. Therefore, the number and density of streets in the Level 6 buffer zone are considerably higher than those in the Level 7 buffer zone.
A considerable difference was noted between the analysis results for the correlations between different types of facilities and spatial variables and the analysis results for the overall correlation between POIs and space syntax. The correlations between the agglomerations of different types of POIs and street network structures are not completely consistent.
As shown in Table 2, global integration is most significantly and positively correlated with each type of POIs, exhibiting a high-to-high agglomeration pattern. All of the POIs are significantly and negatively correlated with total depth, facilitating a high-to-low agglomeration pattern. All types of POIs exhibit correlation coefficients higher than 0.9 with global integration and total depth (i.e., a close correlation). These findings resemble the general correlation between POIs and spatial variables.
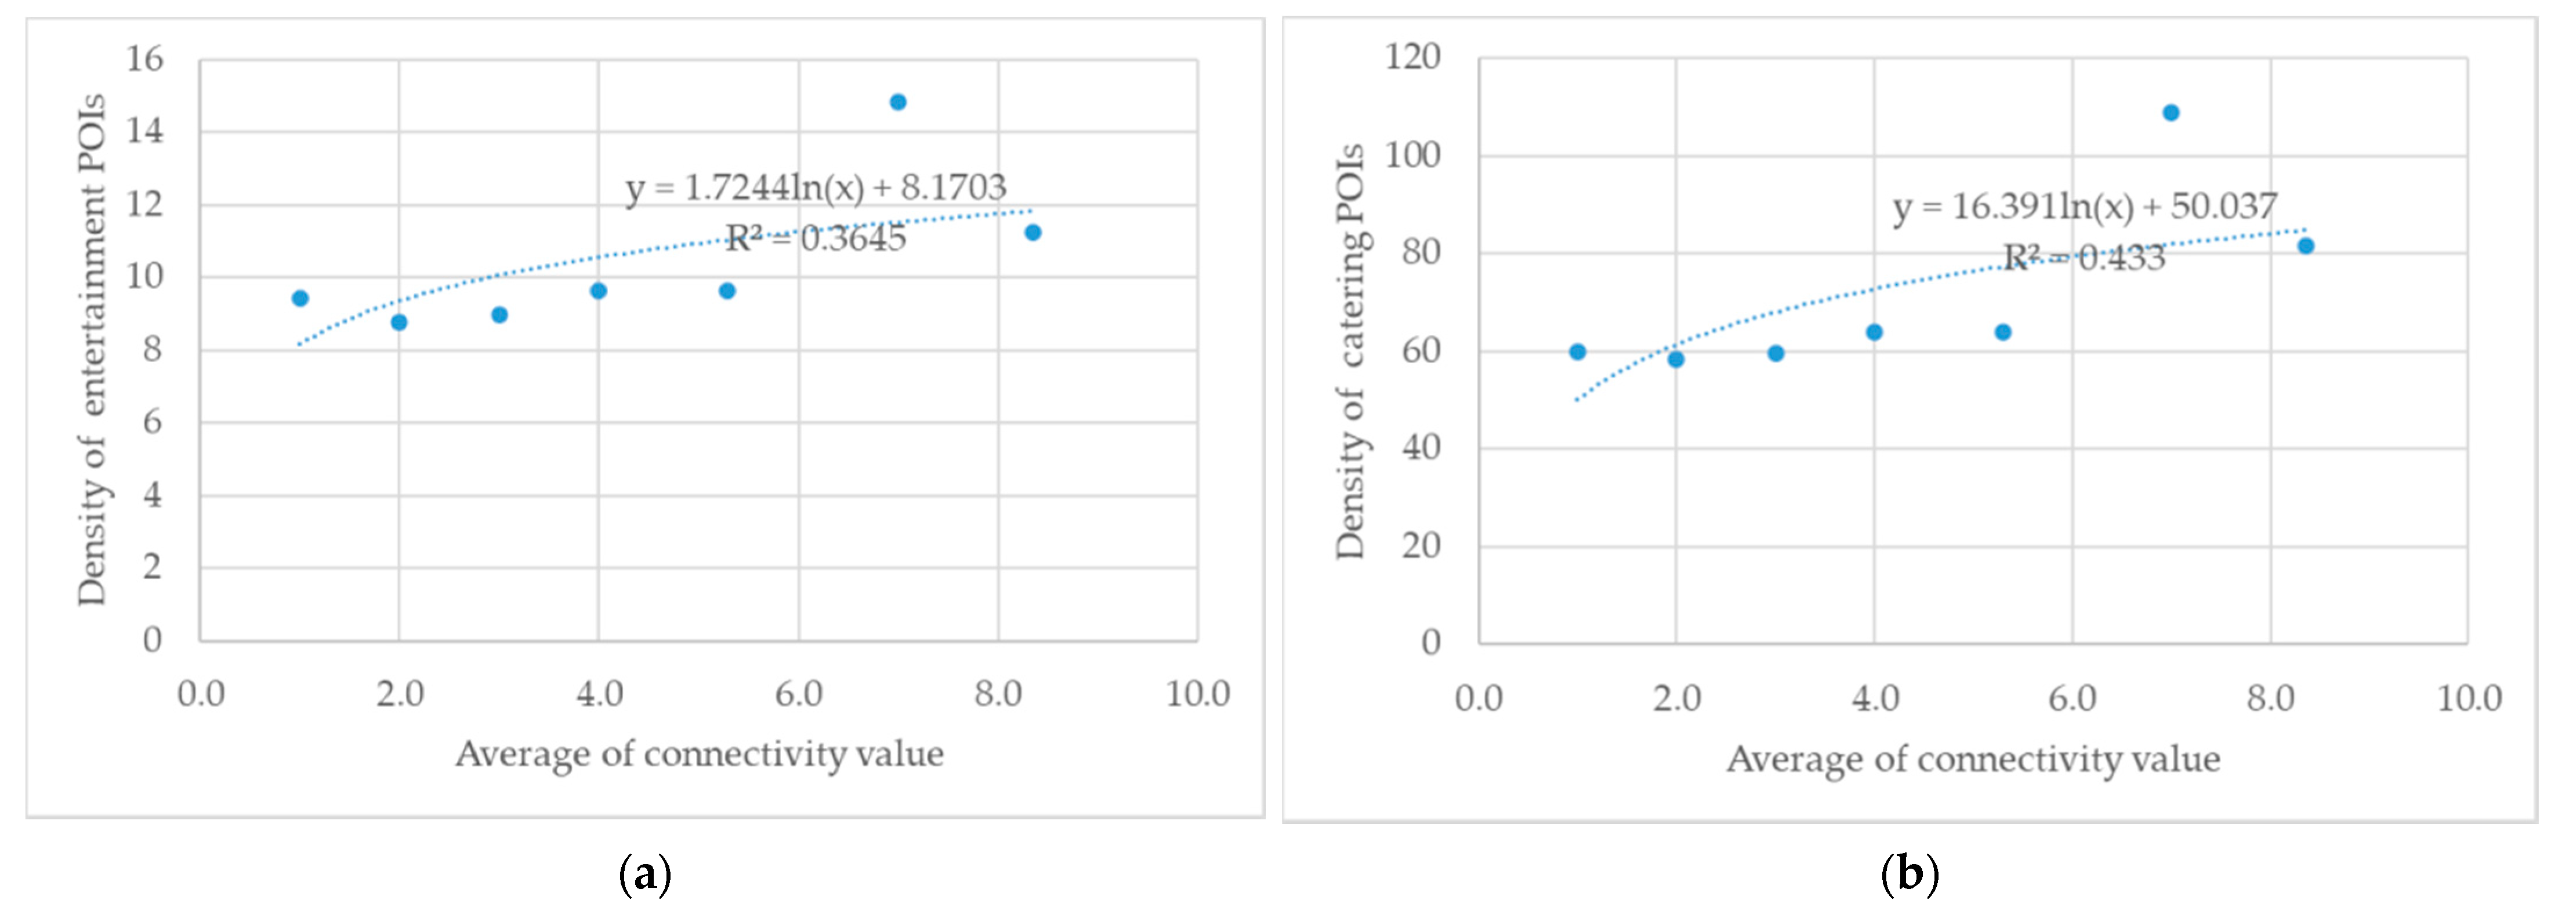
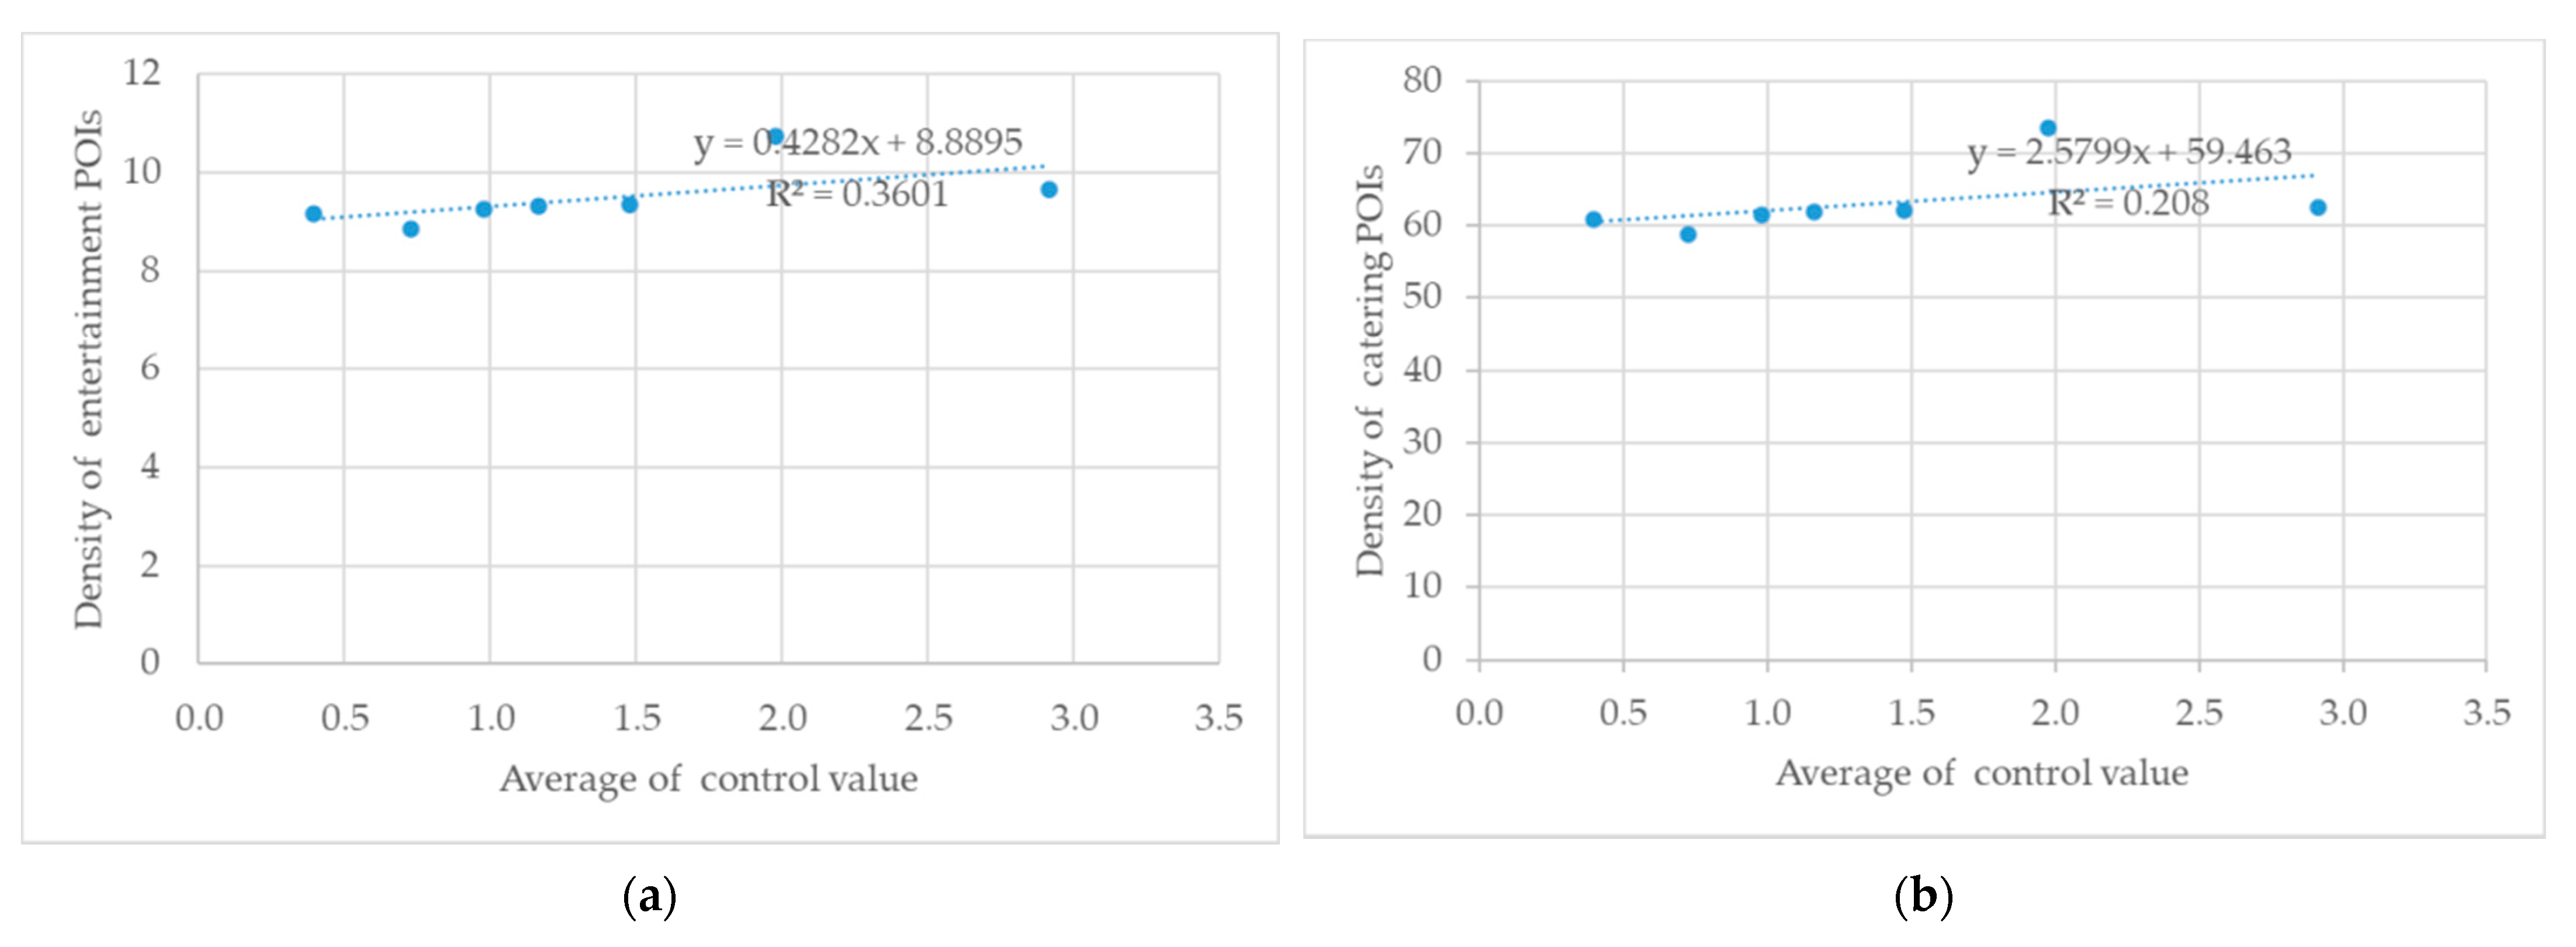
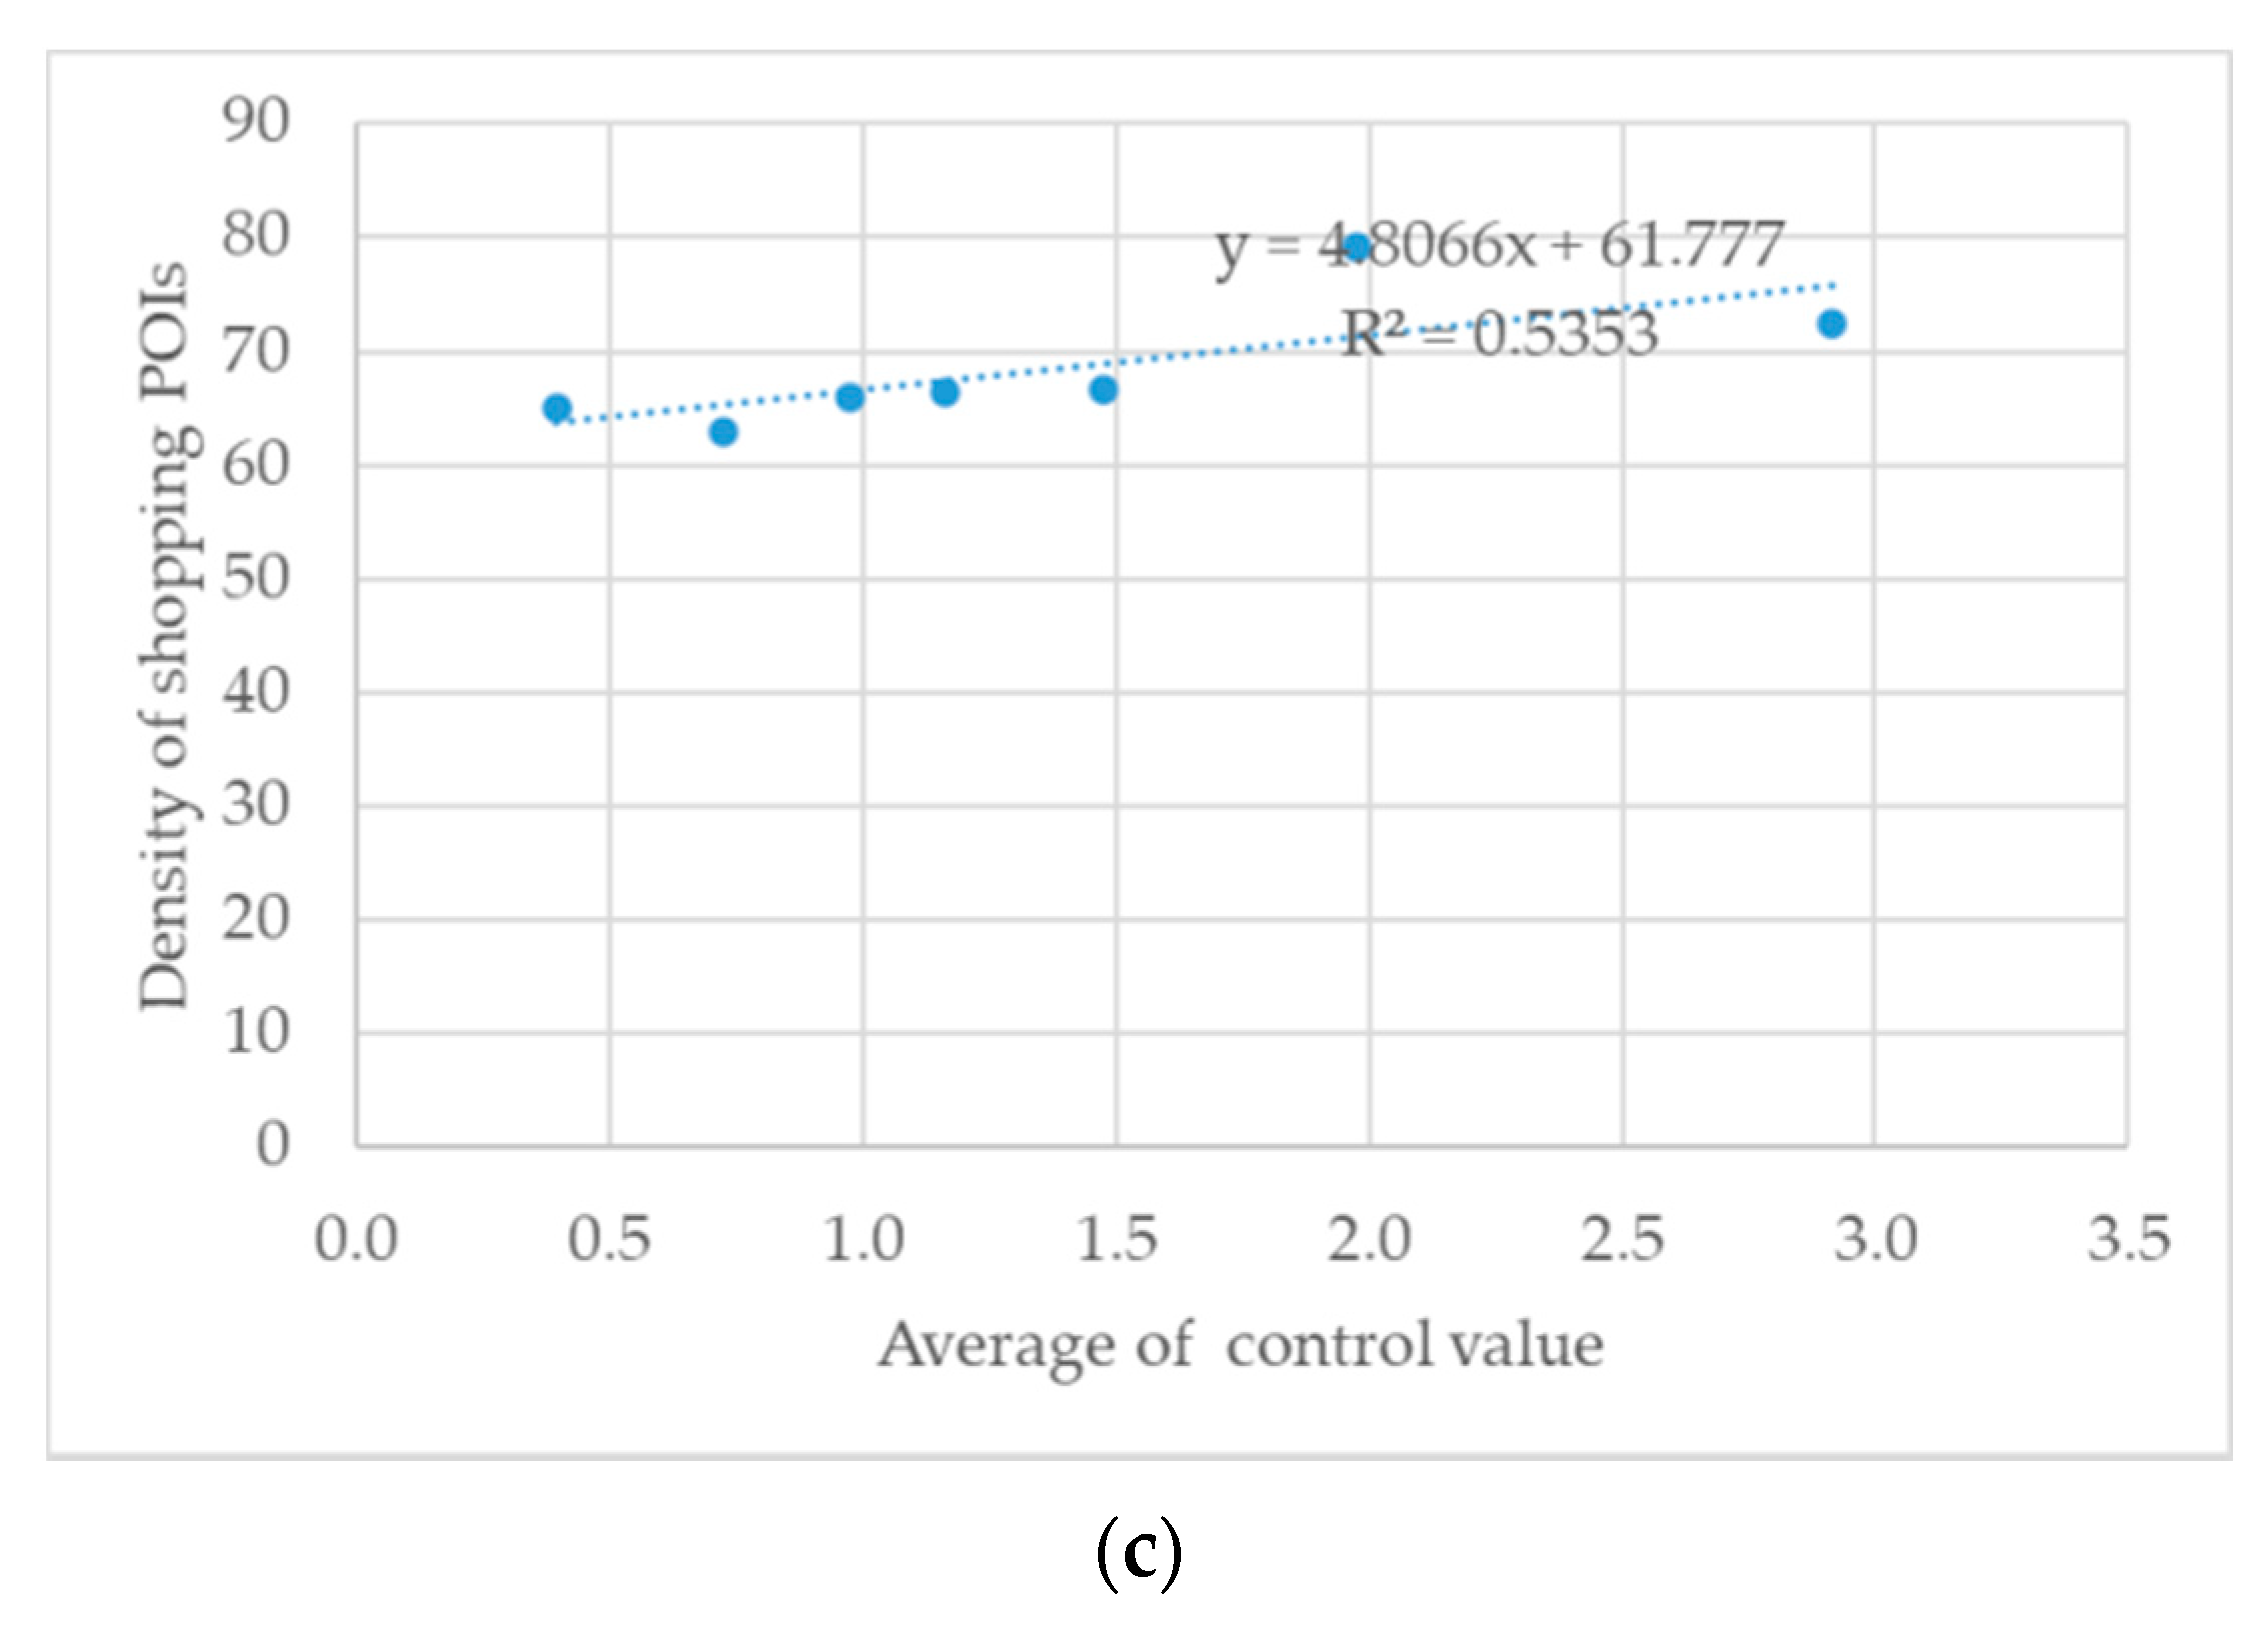
Entertainment, catering, and shopping facilities have a weak correlation with connection value and control value. No significant correlation was observed between connectivity and entertainment and catering POIs. However, in Figure 7, the density of entertainment and catering POIs increases as connectivity increases. Control is not significantly correlated with entertainment, shopping, or catering POIs. However, as per Figure 8, the densities of entertainment, shopping, and catering POIs increases following the increase in control. Accordingly, although connectivity and control are not significantly correlated with some types of POIs, their increasing trends are generally consistent with POIs’. Considering that there are only 7 sample data in this study, the correlation between entertainment, catering, and shopping facilities and connection value as well as control value cannot be completely determined. However, as the connection value and control value increase, the density of facilities shows a slight upward trend. In the future research, it will be necessary to consider increasing the number of samples to further investigate the correlation between the parameters.
Compared with the above three types of facilities, the agglomeration of transportation and accommodation facilities has the highest correlation with street spatial variables, showing a significant positive correlation. Accommodation facilities are mainly distributed along Zhonghua Road, which has a high degree of global integration. At the same time, this gathering trend mainly extends to the periphery of the Confucius Temple District. This is also because the tourism development in this district is relatively mature. The transportation facilities are mainly parking lots, which are evenly distributed in the southern historic area. However, there are more transportation facilities along Zhonghua Road than other regions, which is also due to the optimal traffic location of Zhonghua Road. During the planning and development of historic districts, most of them are positioned as pedestrian areas, and the internal streets are not open to traffic, so the parking lots are set at the periphery of these districts. However, the parking lots are also close to the streets with high global integration.
5. Discussion
Some studies confirmed a correlation between commercial facility agglomeration and urban street network structures. However, quantitative studies on the relationship between tourist service facilities and street networks in historic areas subject to tourism development remain unsatisfactory. Based on the analysis of the relationship between commercial facilities and streets in the aforementioned literature, this research focused on more diverse types of tourism service facilities, and further verified the correlation between facilities and street networks. Taking the southern historic area in Nanjing, China as the study area, a detailed field survey was conducted to calibrate the vector street network and POI data, and KDE was performed on the agglomeration of tourist service POIs. Space syntax was employed to calculate the spatial characteristics of street axes, and correlation and regression analyses were conducted to identify the correlation between POIs and street networks. The results confirmed the feasibility of employing street network space syntax to analyze tourist service POI agglomeration in historic areas. In study area, the regions with strongest street agglomeration and best accessibility, as well as the blocks with most mature tourism development, are the core of tourist facilities. The advantages of the study area lie in its good accessibility in the city. Urban managers recognized the use of cultural heritage for tourism development earlier and carried out orderly development of multiple historical districts in the process of urban development. The disadvantages lie in the obvious gap between the most mature Confucius Temple District and the subsequent development of the Western Gate and the Pingshi Street–Nanbuting District in terms of tourism facilities and population agglomeration on holidays. The challenges are that in the future regional planning and construction, tourism and cultural heritage managers need to plan different locations for different types of facilities according to the strength of the correlation with the street network, optimize the layout of facilities, and realize the comprehensive rejuvenation of the area.
Most historic areas encompass multiple historical locations, which possibly achieved maturity some time previously, recently matured, or are not yet fully mature in terms of tourism development. Tourist service POI agglomeration analysis enables decision-makers to systematically clarify the tourist service facility distribution in historic areas; for example, facility types, locations, quantities, and distribution. This provides a crucial reference for future historic cultural tourism planning.
Space syntax enables the structural characteristics of urban street networks to be effectively analyzed. The core regions with the most local accessibility can be identified through global integration and total depth analysis. Connectivity and control analysis enable the clarification of the relationship between a specific street and its neighboring streets and its status as a traffic node or lack thereof. These findings enable decision makers to adjust street networks to improve the local accessibility of certain regions and optimize traffic node distribution.
Research on the correlation between street network spatial variables and tourist service POIs clarifies the differences between the correlations that various types of tourist service facilities exhibit with spatial variables. This allows decision makers to formulate suitable strategies for regions subject to various levels of tourism development maturity and types of tourist service facilities, to deploy tourist service resources appropriately, and to thereby optimize the spatial distribution of tourist service facilities.
6. Conclusions
The findings in this study mostly support the argument that urban forms affect the distribution of commercial facilities through street network structures, thereby influencing the sustainability of a city. POI data analysis is an effective means to quantitatively analyze tourist service facilities. Rational, objective data analysis supplements the subjective cognition of decision makers. The model established in this study can be applied to assess the reasonability of tourist service facility distribution and to enable active adjustments of sustainable urban development strategies. The results of this study reveal that the agglomeration of tourist service facilities in the southern historic area is significantly correlated with the spatial characteristics of the street networks in the historic area. The results are expected to provide a valuable reference for urban planning and tourist development in historic areas.
The spatial distribution of the tourist service facilities in the southern historic area exhibits a core agglomeration area-secondary agglomeration area-peripheral area multilayer structure. The core agglomeration area is the earliest-developed tourism area, the secondary agglomeration area is the tourism area that developed fully in the recent decade, and the peripheral area represents areas that are not fully developed as tourist areas.
Tourist service facilities distribution is significantly correlated with the spatial variables of street networks, exhibiting a high-to-high spatial agglomeration pattern with connectivity, control, and global integration, but a high-to-low spatial agglomeration pattern with total depth. Regions with high global integration and low total depth are at the core of historic areas as well as being the primary agglomeration areas for tourist service facilities.
Among the spatial variables, global integration has the strongest correlation with the agglomeration of tourism service facilities, while connectivity has the weakest correlation with the agglomeration. Among all types of tourism service facilities, the agglomeration of transportation and accommodation service facilities exhibits the closest correlation with street network’s structure, while the agglomeration of entertainment and shopping facilities are not significantly correlated with the street network’s structure. In addition, the agglomeration of entertainment, catering, and shopping facilities is not significantly correlated with the street network’s control values.
According to these findings, the following suggestions are proposed for planning the spatial distribution of tourist service facilities in the historic areas of Nanjing and for promoting the sustainable development of the landscapes and the city:
- When historic street regions, not yet fully developed as tourist areas, are renovated per tourism planning, the regions with high levels of global integration and low total depth (i.e., high levels of traffic accessibility) can be prioritized in the deployment of tourist service facilities.
- Among the correlations between each type of POI and street network space syntax, the POIs related to entertainment, catering, and shopping facilities are not significantly correlated with control values. Therefore, these three types of facilities should be deployed outside traffic nodes to ensure traffic accessibility. Conversely, transportation and accommodation facilities should be established at traffic nodes.
- Land use and transportation should be developed in coordination. By connecting streets and improving the layout of transportation facilities, the accessibility of local traffic in historical districts can be improved. Thus, more locations can be provided for the setting of tourism service facilities, and the potential of urban land can be fully tapped.
This study had several limitations. Firstly, the effects of street levels and landscapes on the distribution of tourist service POIs were not considered. The width of a street and its design aesthetics may or may not affect pedestrians’ comfort and, subsequently, their preferences for tourist service facilities. Future studies should investigate other syntactic street space indices not explored in this study to comprehensively examine the effects of street networks on tourist service POI distribution. Secondly, internal economic indices such as the operating scale of tourist service facilities, the number of employees, and annual turnover were not examined in this study. Economic benefits are an internal factor affecting the distribution of tourist service facilities, and further research is required to explore this factor.
Author Contributions
Conceptualization, M.W.; data curation, M.W.; funding acquisition, M.W.; investigation, C.Z.; methodology, M.W. and J.Y.; project administration, M.W.; supervision, J.Y.; writing—original draft, J.Y.; writing—review & editing, W.-L.H. and H.-L.L. All authors have read and agreed to the published version of the manuscript.
Funding
This research was funded by “2020 Production-Study-Research Cooperation Program in Jiangsu Province, China, grant number BY2020030”, “Humanities and Social Sciences Foundation of the Chinese Ministry of Education, grant number 20YJAGAT002 and 20YJA630087”, and “Jiangsu Social Science Foundation, grant number 20EYC010”.
Institutional Review Board Statement
Not applicable.
Informed Consent Statement
Not applicable.
Data Availability Statement
The data presented in this study are available on request from the corresponding author.
Conflicts of Interest
The authors declare no conflict of interest.
References
- Cozma, A.-C.; Coroș, M.-M.; Pop, C. Mountain Tourism in the Perception of Romanian Tourists: A Case Study of the Rodna Mountains National Park. Information 2021, 12, 45. [Google Scholar] [CrossRef]
- Saarinen, J. Traditions of sustainability in tourism studies. Ann. Tour. Res. 2006, 33, 1121–1140. [Google Scholar] [CrossRef]
- Caamaño-Franco, I.; Suárez, M.A. The value assessment and planning of industrial mining heritage as a tourism attraction: The case of Las Médulas cultural space. Land 2020, 9, 404. [Google Scholar] [CrossRef]
- Bai, Y.; Liu, C. Study on the Economic driving Effect of Cultural Tourism Industry—A Case Study of Zaozhuang City. Soc. Sci. Hunan 2021, 55–61. Available online: https://kns.cnki.net/kcms/detail/detail.aspx?dbcode=CJFD&dbname=CJFDLAST2021&filename=FLSH202104009&uniplatform=NZKPT&v=bkLP1vvvWirMpxSlKWuEMOlXyoJzXaEYqljMXyOQ-s9U67qglkvtM6DhzkWQTruc (accessed on 7 October 2021).
- Naqvi, M.H.A.; Jiang, Y.; Naqvi, M.H.; Miao, M.; Liang, C.; Mehmood, S. The effect of cultural heritage tourism on tourist word of mouth: The case of lok versa festival, Pakistan. Sustainability 2018, 10, 2391. [Google Scholar] [CrossRef] [Green Version]
- Gruber, S. Convention concerning the protection of the world cultural and natural heritage 1972. In Elgar Encyclopedia of Environmental Law; Edward Elgar Publishing Limited: Cheltenham, UK, 2017; pp. 60–66. [Google Scholar] [CrossRef]
- Timothy, D.J.; Nyaupane, G.P. Cultural Heritage and Tourism in the Developing World: A Regional Perspective; Routledge: New York, NY, USA; London, UK, 2009; pp. 3–19. Available online: http://elibrary.gci.edu.np/bitstream/123456789/3473/1/Bt.430Cultural%20Heritage%20and%20Tourism%20in%20the%20Developing%20World%20%28Contemporary%20Geographies%20of%20Leisure%2C%20Tourism%20and%20Mobility%29.pdf (accessed on 7 October 2021).
- UNESCO; UNWTO; UNEP. The Charter for Sustainable Tourism. Available online: http://www.institutoturismoresponsable.com/events/sustainabletourismcharter2015/wp-content/uploads/2015/06/CharterForSustainableTourism.pdf (accessed on 7 October 2021).
- Acici, F.K.; Kose, O.; Demirel, O. Evaluation of trabzon/surmene memisaga mansion in the scope of sustainable tourism. J. Environ. Prot. Ecol. 2018, 19, 752–762. Available online: http://www.jepe-journal.info/journal-content/vol-19-no-2-1 (accessed on 7 October 2021).
- Ewing, R.; Hajrasouliha, A.; Neckerman, K.M.; Purciel-Hill, M.; Greene, W. Streetscape features related to pedestrian activity. J. Plann. Educ. Res. 2016, 36, 5–15. [Google Scholar] [CrossRef] [Green Version]
- Garau, C.; Annunziata, A.; Yamu, C. The multi-method tool ‘PAST’ for evaluating cultural routes in historical cities: Evidence from Cagliari, Italy. Sustainability 2020, 12, 5513. [Google Scholar] [CrossRef]
- Alkamali, N.; Alhadhrami, N.; Alalouch, C. Muscat city expansion and accessibility to the historical core: Space syntax analysis. Energy Procedia 2017, 115, 480–486. [Google Scholar] [CrossRef]
- Balsa-Barreiro, J.; Fritsch, D. Generation of visually aesthetic and detailed 3D models of historical cities by using laser scanning and digital photogrammetry. Digit. Appl. Archaeol. Cult. Herit. 2017, 8, 57–64. [Google Scholar] [CrossRef]
- Casagrande, M. Heritage, tourism, and demography in the island city of venice: The depopulation and heritagisation. Urban Isl. Stud. 2016, 2, 121–141. [Google Scholar] [CrossRef]
- Larraz, B.; García-Gómez, E. Depopulation of Toledo’s historical centre in Spain? Challenge for local politics in world heritage cities. Cities 2020, 105, 102841. [Google Scholar] [CrossRef]
- Travis, A.S. The sustainable historic city centre: Munich as a model. In Planning for Tourism, Leisure and Sustainability: International Case Studies; Cabi: Wallingford, UK, 2011; pp. 219–222. [Google Scholar] [CrossRef]
- Xu, Y.; Rollo, J.; Jones, D.S.; Esteban, Y.; Tong, H.; Mu, Q. Towards Sustainable Heritage Tourism: A Space Syntax-Based Analysis Method to Improve Tourists’ Spatial Cognition in Chinese Historic Districts. Buildings 2020, 10, 29. [Google Scholar] [CrossRef] [Green Version]
- ICOMOS. The ICOMOS Charter For the Conservation of Historic Towns and Urban Areas. Available online: https://www.icomos.org/charters/towns_e.pdf (accessed on 7 October 2021).
- Shen, Y.; Karimi, K. Urban function connectivity: Characterisation of functional urban streets with social media check-in data. Cities 2016, 55, 9–21. [Google Scholar] [CrossRef] [Green Version]
- Wu, R. Micro-scale spatial structure and spatial associations of urban historical and cultural tourism destinations: A case study of Confucius Temple, Nanjing. Geog. Res. 2014, 52, 45–54. Available online: https://academic.microsoft.com/paper/2346551012 (accessed on 7 October 2021).
- Su, M.M.; Wall, G. Chinese Research on World Heritage Tourism. Asia Pac. J. Tour. Res. 2011, 16, 75–88. [Google Scholar] [CrossRef]
- Fan, L.; Zheng, H. World Cultural and Natural Heritage site protection and tourism development. Planner 2003, 6, 26–28. [Google Scholar] [CrossRef]
- Yuan, F.; Gao, J.; Wu, J. Nanjing-an ancient city rising in transitional China. Cities 2016, 50, 82–92. [Google Scholar] [CrossRef]
- Zhou, X.; Zhang, W. The cultural value of the historical street blocks in the south part of old Nanjing city. Arch. Creat. 2010, 1, 158–164. [Google Scholar] [CrossRef]
- Shen, s.; Ai, l. Study on gentrification of tourism in historical and cultural districts of cities. China Anc. City 2018, 1, 50–56. [Google Scholar] [CrossRef]
- Mandić, A.; Mrnjavac, Ž.; Kordić, L. Tourism infrastructure, recreational facilities and tourism development. Tour. Hosp. Manag. 2018, 24, 41–62. [Google Scholar] [CrossRef]
- Lai, C.; Wu, X. A study on spatial distribution characteristics of megacity hotels based on GIS method: A data analysis based on POI data of Guangzhou hotels. Mod. Urban Res. 2019, 1, 66–74. [Google Scholar] [CrossRef]
- Jiang, S.; Alves, A.; Rodrigues, F.; Ferreira, J.; Pereira, F.C. Mining point-of-interest data from social networks for urban land use classification and disaggregation. Comput. Environ. Urban Syst. 2015, 53, 36–46. [Google Scholar] [CrossRef] [Green Version]
- Al-Kodmany, K. Improving Understanding of City Spaces for Tourism Applications. Buildings 2019, 9, 187. [Google Scholar] [CrossRef] [Green Version]
- Wu, Z.; Ye, Z. Research on urban spatial structure based on Baidu Heat map: A case study on the central city of Shanghai. City Plan. Rev. 2016, 40, 33–44. [Google Scholar] [CrossRef]
- Zhai, W.; Bai, X.; Shi, Y.; Han, Y.; Peng, Z.; Gu, C. Beyond Word2vec: An approach for urban functional region extraction and identification by combining Place2vec and POIs. Comput. Environ. Urban Syst. 2019, 74, 1–12. [Google Scholar] [CrossRef]
- Xu, Z.; Gao, X. A novel method for identifying the boundary of urban built-up areas with POI data. Acta Geogr. Sin. 2016, 71, 928–939. [Google Scholar] [CrossRef]
- Gao, X.; Xu, Z.; Niu, F. Delineating the scope of urban agglomerations based upon the Pole-Axis theory. Prog. Geogr. 2015, 34, 280–289. [Google Scholar] [CrossRef]
- Gavalas, D.; Konstantopoulos, C.; Mastakas, K.; Pantziou, G. A survey on algorithmic approaches for solving tourist trip design problems. J. Heuristics 2014, 20, 291–328. [Google Scholar] [CrossRef]
- Lim, K.H.; Chan, J.; Leckie, C.; Karunasekera, S. Personalized trip recommendation for tourists based on user interests, points of interest visit durations and visit recency. Knowl. Inf. Syst. 2018, 54, 375–406. [Google Scholar] [CrossRef]
- Pop, C.; Coros, M.M.; Balint, C. Romanian Rural Tourism: A Survey of Accommodation Facilities. Studia Univ. Babeș-Bolyai Negot. 2017, 62, 53–104. [Google Scholar] [CrossRef]
- Zhang, X.; Wang, G.; Luo, Y.; Tian, B. Macro-Layout Planning of Tourism Highway Camp Service Facilities: Taking Jilin Province as an Example. In Proceedings of the 20th COTA International Conference of Transportation Professionals, Xi’an, China, 14–16 August 2020; pp. 2250–2262. [Google Scholar] [CrossRef]
- Hillier, B. Space is the Machine: A Configurational Theory of Architecture; Cambridge University Press: London, UK, 1996; Available online: https://discovery.ucl.ac.uk/id/eprint/3881/1/SITM.pdf (accessed on 7 October 2021).
- Hillier, B.; Hanson, J. The Social Logic of Space; Cambridge University Press: London, UK, 1984. [Google Scholar] [CrossRef]
- Turner, A.; Penn, A.; Hillier, B. An algorithmic definition of the axial map. Environ. Plann. B Urban Anal. City Sci. 2005, 32, 425–444. [Google Scholar] [CrossRef]
- Nes, A.v.; Yamu, C. Introduction to Space Syntax in Urban Studies; The Registered Company Springer Nature: Cham, Switzerland, 2021; pp. 35–50. [Google Scholar] [CrossRef]
- Lebendiger, Y.; Lerman, Y. Applying space syntax for surface rapid transit planning. Transp. Res. Part A Policy Pract. 2019, 128, 59–72. [Google Scholar] [CrossRef]
- Tarabieh, K.; Nassar, K.; Abdelrahman, M.; Mashaly, I. Statics of space syntax: Analysis of daylighting. Front. Arch. Res. 2019, 8, 311–318. [Google Scholar] [CrossRef]
- Watts, A.; Ferdous, F.; Moore, K.D.; Burns, J.M. Neighborhood integration and connectivity predict cognitive performance and decline. Gerontol. Geriatr. Med. 2015, 1. [Google Scholar] [CrossRef] [PubMed] [Green Version]
- Alalouch, C.; Al-Hajri, S.; Naser, A.; Al Hinai, A. The impact of space syntax spatial attributes on urban land use in Muscat: Implications for urban sustainability. Sustain. Cities Soc. 2019, 46, 101417. [Google Scholar] [CrossRef]
- Duan, R.; Zheng, X. The relation of the city road structure and the land price based on the space syntax. Sci. Surv. Mapp. 2004, 29, 76–79. [Google Scholar] [CrossRef]
- Edwards, D.; Griffin, T. Understanding tourists’ spatial behaviour: GPS tracking as an aid to sustainable destination management. J. Sustain. Tour. 2013, 21, 580–595. [Google Scholar] [CrossRef]
- Li, Y.; Xiao, L.; Ye, Y.; Xu, W.; Law, A. Understanding tourist space at a historic site through space syntax analysis: The case of Gulangyu, China. Tour. Manag. 2016, 52, 30–43. [Google Scholar] [CrossRef]
- Gao, Y.; Wang, R.; Yang, Y.; Jiang, J.; Miao, J. Definition and Research on the Happiness Index of Human Settlement in Urban Historic District—Taking Ping’an Alley in the South of Nanjing as an Example. City House 2020, 27, 63–67. Available online: https://kns.cnki.net/kcms/detail/detail.aspx?dbcode=CJFD&dbname=CJFDLAST2020&filename=CSZZ202009014&uniplatform=NZKPT&v=eazigVwgYz5vZkWF2Ehn8Hy9KwOsMHTdEhOP4bTW72UCotmiNko3jRArtR7maMgn (accessed on 7 October 2021).
- Zhu, H.; Liu, J.M.; Liu, H.X.; Wang, X.B.; Ma, Y.F. Recreational Business District boundary identifying and spatial structure influence in historic area development: A case study of Qianmen area, China. Habitat Int. 2017, 63, 11–20. [Google Scholar] [CrossRef]
- BIGEMAP. Available online: http://www.bigemap.com/ (accessed on 7 October 2021).
- National Bureau of Statistics. National Economic Industry Classification. Available online: http://www.stats.gov.cn/tjsj/tjbz/hyflbz/201710/t20171012_1541679.html (accessed on 7 October 2021).
- Halu, Z.Y. Transactional approach for walkable urban spaces: Hierarchy of walking needs. J. Environ. Prot. Ecol. 2019, 20, 302–312. Available online: https://docs.google.com/a/jepe-journal.info/viewer?a=v&pid=sites&srcid=amVwZS1qb3VybmFsLmluZm98amVwZS1qb3VybmFsfGd4Ojc1ZmM5ZWQyY2JkMWE4MmM (accessed on 7 October 2021).
- Hillier, B.; Penn, A.; Hanson, J.; Grajewski, T.; Xu, J. Natural movement: Or, configuration and attraction in urban pedestrian movement. Environ. Plann. B Urban Anal. City Sci. 1993, 20, 29–66. [Google Scholar] [CrossRef] [Green Version]
- Zhang, Y.; Wang, J. Further discussion on “space syntax”. Architect 2004, 1, 33–44. Available online: https://kns.cnki.net/kcms/detail/detail.aspx?dbcode=CJFD&dbname=CJFD2004&filename=JZSS200403004&v=7DSdrOL%25mmd2Fy603bX6A7CDse2tZoARimLpAnyzoFCwMVO%25mmd2BjpFBWHY%25mmd2FqaBFS0g5xEMpF (accessed on 7 October 2021).
- Rizwan, M.; Wan, W. Big Data Analysis to Observe Check-in Behavior Using Location-Based Social Media Data. Information 2018, 9, 257. [Google Scholar] [CrossRef] [Green Version]
- Jenks, G.F. The Data Model Concept in Statistical Mapping. Int. Yearb. Cartogr. 1967, 7, 186–190. [Google Scholar]
- McMaster, R. In Memoriam: George F. Jenks (1916–1996). Cartogr. Geogr. Inf. Syst. 1997, 24, 56–59. [Google Scholar] [CrossRef]
- Han, Y.; Jiao, L.; Xu, G. Correlation analysis of road structure and commercialagglomeration in Wuhan city. Prog. Geogr. 2017, 36, 1349–1358. [Google Scholar] [CrossRef] [Green Version]
- Nanjing Government. Master Plan of Nanjing City. Available online: http://ghj.nanjing.gov.cn/ghbz/ztgh/ (accessed on 7 October 2021).
Figure 1.
Location of case study (source: Open Street Map).

Figure 2.
Methods used in this study.

Figure 3.
Spatial distribution of tourism service POIs: (a) tourism service POIs; (b) shopping POIs; (c) catering POIs; (d) entertainment POIs; (e) accommodation POIs; (f) transportation POIs.
Figure 3.
Spatial distribution of tourism service POIs: (a) tourism service POIs; (b) shopping POIs; (c) catering POIs; (d) entertainment POIs; (e) accommodation POIs; (f) transportation POIs.


Figure 4.
Vectorized and value-assigned Baidu heat map data (noon, 1 October 2021).

Figure 5.
Axial map analysis: (a) connectivity value; (b) control value; (c) global integration value; (d) total depth value.
Figure 5.
Axial map analysis: (a) connectivity value; (b) control value; (c) global integration value; (d) total depth value.


Figure 6.
Scatter plot of average of each spatial variables and density of tourism service POIs: (a) connectivity value; (b) control value; (c) global integration value; (d) total depth value.
Figure 6.
Scatter plot of average of each spatial variables and density of tourism service POIs: (a) connectivity value; (b) control value; (c) global integration value; (d) total depth value.

Figure 7.
Scatter plot of average connectivity value and each density of two types of POIs: (a) entertainment; (b) catering.
Figure 7.
Scatter plot of average connectivity value and each density of two types of POIs: (a) entertainment; (b) catering.

Figure 8.
Scatter plot of average control value and each density of three types of POIs: (a) entertainment; (b) catering; (c) shopping.
Figure 8.
Scatter plot of average control value and each density of three types of POIs: (a) entertainment; (b) catering; (c) shopping.


Table 1.
Types and ratios of tourist service facilities.
| Type | Description | Number | Ratio |
|---|---|---|---|
| Accommodation | Star hotels, apartment hotels, express hotels, and hostels | 291 | 11.70% |
| Catering | Chinese restaurants, foreign-style restaurants, snack bars, patisseries, cafés, teahouses, and bars | 863 | 34.70% |
| Shopping | Shops, supermarkets, convenience stores, and shopping malls | 925 | 37.19% |
| Entertainment | Sports fitness, Karaoke Television, leisure squares, and bathrooms | 130 | 5.23% |
| Culture | Art galleries and exhibition halls | 25 | 1.01% |
| Transportation | Parking lots and ports | 253 | 10.17% |
| Total | 2487 | 100.00% | |
Table 2.
Correlations between tourist service POIs and spatial variables.
| Connectivity | Control | Global Integration | Total Depth | ||
|---|---|---|---|---|---|
| Density of tourism service POIs | r | 0.789 * | 0.802 * | 0.994 ** | −0.981 ** |
| Sig. | 0.035 | 0.030 | 0.000 | 0.000 | |
| Density of transportation POIs | r | 0.847 * | 0.887 ** | 0.994 ** | −0.985 ** |
| Sig. | 0.016 | 0.008 | 0.000 | 0.000 | |
| Density of accommodation POIs | r | 0.837 * | 0.941 ** | 0.983 ** | −0.963 ** |
| Sig. | 0.019 | 0.001 | 0.000 | 0.001 | |
| Density of entertainment POIs | r | 0.696 | 0.600 | 0.994 ** | −0.976 ** |
| Sig. | 0.082 | 0.154 | 0.000 | 0.000 | |
| Density of shopping POIs | r | 0.801 * | 0.732 | 0.989 ** | −0.983 ** |
| Sig. | 0.030 | 0.062 | 0.000 | 0.000 | |
| Density of catering POIs | r | 0.747 | 0.456 | 0.996 ** | −0.979 ** |
| Sig. | 0.054 | 0.304 | 0.000 | 0.000 |
** Correlation is significant at 0.01 level. * Correlation is significant at 0.05 level.
Publisher’s Note: MDPI stays neutral with regard to jurisdictional claims in published maps and institutional affiliations. |
© 2021 by the authors. Licensee MDPI, Basel, Switzerland. This article is an open access article distributed under the terms and conditions of the Creative Commons Attribution (CC BY) license (https://creativecommons.org/licenses/by/4.0/).
Share and Cite
MDPI and ACS Style
Wang, M.; Yang, J.; Hsu, W.-L.; Zhang, C.; Liu, H.-L. Service Facilities in Heritage Tourism: Identification and Planning Based on Space Syntax. Information 2021, 12, 504. https://0-doi-org.brum.beds.ac.uk/10.3390/info12120504
AMA Style
Wang M, Yang J, Hsu W-L, Zhang C, Liu H-L. Service Facilities in Heritage Tourism: Identification and Planning Based on Space Syntax. Information. 2021; 12(12):504. https://0-doi-org.brum.beds.ac.uk/10.3390/info12120504
Chicago/Turabian StyleWang, Min, Jianqiang Yang, Wei-Ling Hsu, Chunmei Zhang, and Hsin-Lung Liu. 2021. "Service Facilities in Heritage Tourism: Identification and Planning Based on Space Syntax" Information 12, no. 12: 504. https://0-doi-org.brum.beds.ac.uk/10.3390/info12120504
Note that from the first issue of 2016, this journal uses article numbers instead of page numbers. See further details here.