
Latent Twitter Image Information for Social Analytics


1
Computer Science and Biomedical Informatics Department, University of Thessaly, 35131 Lamia, Greece
2
School of Electrical & Computer Engineering, National Technical University of Athens, 15780 Athens, Greece
*
Author to whom correspondence should be addressed.
Information 2021, 12(2), 49; https://0-doi-org.brum.beds.ac.uk/10.3390/info12020049
Submission received: 8 December 2020
/
Revised: 7 January 2021
/
Accepted: 18 January 2021
/
Published: 21 January 2021
(This article belongs to the Special Issue Social and Semantic Trends: Tools and Applications)
Abstract
:The appearance of images in social messages is continuously increasing, along with user engagement with that type of content. Analysis of social images can provide valuable latent information, often not present in the social posts. In that direction, a framework is proposed exploiting latent information from Twitter images, by leveraging the Google Cloud Vision API platform, aiming at enriching social analytics with semantics and hidden textual information. As validated by our experiments, social analytics can be further enriched by considering the combination of user-generated content, latent concepts, and textual data extracted from social images, along with linked data. Moreover, we employed word embedding techniques for investigating the usage of latent semantic information towards the identification of similar Twitter images, thereby showcasing that hidden textual information can improve such information retrieval tasks. Finally, we offer an open enhanced version of the annotated dataset described in this study with the aim of further adoption by the research community.
Keywords:
social labeling; Twitter; images; Google Cloud Vision API; OCR; cosine similarity; Word2Vec1. Introduction
The presence of multimedia content, namely, images and videos, is continuously increasing in the disseminating messages exchanged in the online social networks (OSNs). Since all modern mobile devices (e.g., cellular phones and tablets) integrate superior cameras and support high speed broadband connections (i.e., 4G technology), this trend is facilitated. According to [1], images in Twitter are not only disseminated in an increased fashion, but also appear in a significant portion of social posts, gaining substantially more engagement, in terms of retweets, likes, and replies, contrary to those without. Therefore, social images have transformed into an indispensable characteristic of the OSNs, complementing or often overshadowing the textual information. However, despite the well-known adage “a picture is worth a thousand words”, little attention has been paid to that type of content and to the insights they can provide for enriching the social profiles.
Until only recently, when research interest arose for the accompanying multimedia content of OSNs posts, social analytics were exclusively oriented toward the textual information. As the volume of videos and images disseminated in the OSNs is constantly increasing, these types of content should also be evaluated, as they could contain valuable latent data. As reported in [2], social images can supplement the textual information found in the posts, by containing additional context, thereby being capable of further enriching the diffused messages. As a result of the recent rise of deep neural network (DNN) architectures, several commercial products for image classification and analysis are available (Microsoft Azure Computer Vision (https://azure.microsoft.com/en-us/services/cognitive-services/computer-vision/); Google Cloud Vision API (https://cloud.google.com/vision/)) in the form of software-as-a-service (SaaS), relying on state-of-the-art machine learning (ML) pre-trained models. These services can extract a wide spectrum of information from images, including text, labels, colors, logos, objects, and emotions. Consequently, the incorporation and combination of this latent context with the established textual information of the social messages can lead to a more holistic and accurate representation of the Twittersphere.
Since the context and the information depicted in the OSNs images can be textually defined, all applications and frameworks relying on text can now be applied to that type of content as well. Such an exercise is the identification of similar images by evaluating their semantic similarity, purely relying on the textual representations of their contexts. The semantic similarity of two or more terms measures how similar their meaning is. Despite their syntactic differences, two words can have the same interpretation, such as the words “dog” and “hound”. Due to the recent advancements in the area of natural language processing (NLP), the identification of semantic similarities among individual terms or even documents is possible. Semantic similarity can be utilized in a variety of text-based tasks, including—but not limited to—classification, recommendation, summarization, synonymity identification, and clustering. The predominant technique for measuring the relevance and similarity of terms’ meanings is the Word2Vec ([3,4]) model, relying on word embeddings, where real-valued vectors in a multi-dimensional space represent words. The encoded patterns of the vectors can be represented as linear functions. As an example, the vector calculation of [v(“Athens”) − v(“Greece”) + v(“Italy”)] is closer to [v(“Rome”)] than any other term vector. Based on said model, which has been trained on a corpus of sufficient and appropriate data, the similarity scores can be calculated using the cosine similarity metric of the terms’ vector values.
There were three aims for this study. Firstly, a framework was proposed based on the latent and depicted context of Twitter images towards the enrichment of social analytics with textual information and semantics. The aforementioned image context is acquired by employing the Google Cloud Vision API along with OCR (optical character recognition) techniques for recognizing and extracting the depicted text. Our evaluation revealed that the overwhelming majority of the disseminated images contain valuable information and the dynamics of such latent information should not be ignored any longer. Secondly, this latent textual and semantic information was utilized towards the identification of images with similar semantic content. Our intention was to evaluate this type of information for further improving image search, retrieval, and recommendation tasks. Our evaluation indicated that the usage of latent labels also complemented by the OCR-derived text generate the best results, compared to the extracted OCR text alone. Thirdly, we prepared a dataset consisting of 197 Twitter accounts, classified into three broad communities (i.e., politics, celebrities, press), having 94,745 annotated images, which in turn have been classified by 7098 labels. This dataset will be available to the research community. Text extracted using OCR techniques is depicted in the majority of these images (62.2%), thereby validating our intuitions for conducting this study.
The Twitter accounts and their disseminated images and tweets described in this study can be also retrieved from InfluenceTracker (http://InfluenceTracker.com/), a publicly available website providing Twitter-related information as linked data and various social analytics. As case studies, the proposed framework was applied twice; firstly, on a community of 130 accounts related to the domain of “Politics”, and secondly, to 54 accounts characterized as “Celebrities”. In both scenarios the communities can be further split into smaller and possibly overlapping ones. In order to classify the accounts in these communities, they had firstly to be associated with the DBpedia resources (URIs) best describing them, a methodology presented in our previous work [5].
The remainder of this study is organized as follows. In the next section, we provide an overview of the related work on the analysis of image content in OSNs and its applications, and on the utilization of Word2Vec word embedding and semantic similarity techniques for a series of OSN analytics tasks. In Section 3 we analytically present the proposed framework towards the enrichment of social analytics with semantics and textual context. In Section 4 we provide an overview of the methodology towards the identification of accounts related to the examined communities (i.e., “Politics” and “Celebrities”). In Section 5 we present in detail the case studies, analyze the experimental results of our methodology, and discuss the interpretations of our findings. In Section 6 we employ word embedding techniques for investigating the best type of latent semantic information towards the identification of similar images. Finally, Section 7 provides the conclusions of our study by summarizing the derived outcomes while providing considerations of our future directions.
2. Related Work
2.1. Utilization of Latent Information in Images
Recent studies have started investigating the correlations of the latent semantic relations existing among textual content and the accompanying images. This area is progressively gaining more attention, and investigations are performed for a broad range of use cases. The derived valuable insights regarding the OSNs users, their interests, and their behavioral patterns can be used for further improving a series of tasks, including classification, information enrichment, and recommendation.
As already mentioned, the study in [2] suggests that images can convey additional context not present in the accompanying text. To this end, a two-stage methodology is proposed for investigating, on a tweet level, the existence of semantic relationships between the image and the accompanying textual information. The first phase is focused on examining their semantic overlap. During the second phase, whether the image complements the textual information or provides additional context is examined. The latter is manually verified by human curators.
Similarly, the authors in [6] analyzed a set of social images for evaluating the correlation between the disseminated post and its accompanying image. The authors concluded that there are two types of social posts: those using the images exclusively for increasing other OSN users’ engagement with their messages, and those acting complementarily, thereby having a high semantic overlap between the text and the image.
Nowadays, several commercial products for image classification and analysis are available in the form of SaaS (e.g., Microsoft Azure Computer Vision (https://azure.microsoft.com/en-us/services/cognitive-services/computer-vision/) and Google Cloud Vision API (https://cloud.google.com/vision/)) and consequently, research studies progressively rely on them for related tasks. Specifically, the predictive value of Instagram pictures’ features for users’ personalities was investigated in [7]. To this end, two sets of features were identified, the visual ones, including saturation and hue, and the content ones, namely, entities and concepts portrayed in the images. These features were identified by analyzing the images using the Google Cloud Vision API. The authors concluded that the information contained in both visual and content features can be exploited for personality prediction.
The study in [8] describes a framework for analyzing the geo-spatial sentiment of disaster-related OSNs images and messages. Since the majority of the classifiers employed for the sentiment analysis task are unable to analyze images without faces, the Google Cloud Vision API was employed for addressing this limitation. The service extracted the content of the images, and upon the extraction of terms the sentiment classifiers were applied.
The Google Cloud Vision API was also employed by the authors of [9] for annotating Twitter images shared by state-sponsored accounts. The aim of the study was the identification of the OSN users’ tendencies to disseminate “fake news” and the evaluation of images’ role in increasing the credibility of and engagement with such messages.
The authors in [10] present a framework towards the generation of a knowledge base consisting of Twitter entities, along with their disseminated textual and multimedia content. The Google Cloud Vision API was employed for extracting the contents of the images, which were then used for the enrichment of the “traditional” Twitter metadata, including users, social entities, and relationships.
OSN content was utilized in [11] for evaluating its efficiency in supporting traffic management systems. To this end, a synthesis of methods was applied on tweets related to traffic information, including entity extraction on their images, derived from the Google Cloud Vision API, and NLP techniques on those tweets. The authors conclude that it is infrequent for the OSNs users to report the required traffic details, such as queue length or car flow, which are important criteria to real-time signal timing and traffic management systems.
The study in [12] performed a qualitative analysis on the labels of a specific domain’s OSNs images, which were derived from Google Cloud Vision API and human annotators. Evaluation results revealed that the former is more efficient in such kinds of tasks. Specifically, humans provided fewer and often vague labels, and a bias was observed towards the examined domain. Moreover, the classifier trained on the Google Cloud Vision API annotations resulted in greater accuracy compared to the one annotated by humans.
A density-based spatiotemporal analysis framework incorporating an image classifier based on pre-trained DNNs models is proposed in [13]. This study extends the authors’ previous one by classifying the images of geo-tagged tweets as relevant to an emergency, in terms of time and locality.
Finally, a two-step gender classification framework for Twitter users is presented in [14], by analyzing the users’ latest posts, both in textual and multimedia aspects. A support vector machine (SVM) binary classifier calculates the gender probability based on the analyzed text, and the social images are classified against a predefined set of categories according to their identified objects and the estimated gender tendencies for these objects.
Compared to the related literature, our study differentiates in two important aspects. Firstly, our proposed framework towards the enrichment of social analytics with textual information and semantics is based on all types of latent contextual features of Twitter images (i.e., labels and OCR-derived text), rather than a subset of them (i.e., labels). Our analysis revealed that the overwhelming majority of the images disseminated in OSNs depict text, and our experimental results on social communities revealed the dynamics of this kind of latent information, which should not be ignored any longer. Secondly, since the latent context and depicted text of Twitter images are represented by textual information, all document-based applications can now be applied on this type of multimedia content, which was not possible before. Therefore, we utilize this latent textual and semantic information towards the identification of images with similar semantic content. Our intention is to evaluate this type of information for further improving image searching, retrieval, and recommendation tasks.
2.2. Utilization of Word2Vec in OSNs
The recent advancements in the area of NLP enabled the evaluation of semantic similarities on a term or document level, utilized in a variety of tasks, including sentiment analysis, classification, recommendation, summarization, synonymity identification, and clustering. Despite the rise of newer efficient word embeddings models (BERT, ELMo, fastText), Word2Vec ([3,4]) is the predominant technique for performing semantic similarity tasks, as it was the seed for this research direction.
In [15], a three-phase framework is presented for analyzing the sentiments of Twitter messages as a binary classification task (positive or negative sentiment). During the first phase, two types of features are extracted from the tweets, relying on the existence of verbs and adjectives, and during the second phase these features are processed by a pre-trained Word2Vec model, and the feature matrix is constructed. Finally, this matrix is used for classifying the tweets. The study concluded that the verb feature leads to higher accuracy scores. Similarly, the word embeddings derived from Word2Vec models were also used in [16] for both sentiment analysis and classification tasks on OSNs messages.
A binary classifier is also described in [17], relying on Word2Vec and cosine similarity for determining the relevance of tweets in respect to a predefined set of festivals, represented as topics. Instead of representing each tweet by the average value of each word-embedding, the vector value of its word is actually used. Finally, the most relevant tweets to each event are discovered by calculating the cosine similarity scores of the vectors of topics and tweets.
The authors in [18] evaluated the performance of multiple convolutional neural networks (CNNs) for classifying news articles and tweets as related and unrelated ones. Specifically, three types of CNNs were created: one relying on the continuous bag-of-words (CBOW) word embedding algorithm of Word2Vec, one relying on the Skip-gram, and one without any word embedding models. The experimental results revealed that the incorporation of the Word2Vec model significantly improved the accuracy of the classification process.
The authors in [19] developed a hashtag recommendation system for assisting users to select the most suitable hashtags for their posts, by relying on the semantic similarities of the terms included and the contents of other tweets. Based on a pre-trained word embedding model, each tweet is represented by its weighted averaging value of its individual word embeddings. These features are then combined with the DBSCAN clustering algorithm for creating groups of semantically similar tweets. Finally, by computing the cosine similarity between a tweet and each of the centroids of the clusters, the most relevant hashtags are recommended.
Word2Vec embeddings are also used for content summarization tasks. Such an extractive summarization framework is described in [20]. Initially, the document is divided into sentences, which in turn are split into their individual terms. Based on the Word2Vec model, each term is represented as a vector. Then the weight of each word and sentence is calculated based on the TF-IDF metric, the word–sentence relationships, and a ranking model based on the PageRank algorithm. In the end, the summary is generated by combining the derived sentence vector and the weight of the sentence.
The authors in [21] utilized Word2Vec embeddings in order to represent terms and their WordNet descriptions as vectors and then assess their semantic similarities. The similarity was calculated using the cosine similarity function. In cases wherein a piece of text consisted of more than one term, then the average value of the individual word-embedding vectors of the terms was used.
In the same direction, the study in [22] investigated the similarity of English words using the Word2Vec representation technique. The model was trained on English Wikipedia pages, and the cosine similarity method was employed for determining the similarity values. The results were compared against multiple human annotated gold data with similarity relationships among words.
The authors in [23] proposed a methodology towards the automatic correction of misspelled terms in tweets by utilizing the Word2Vec word embeddings. The misspelled words are identified during the pre-processing phase using a public dictionary. For each such word, a list of candidates for the correct one is extracted using a variation of the cosine similarity metric, which also considers the characters’ similarity. Finally, the misspelled word is replaced by the one with the highest similarity value from the candidates list, thereby correcting the original post.
The authors in [24] proposed an LDA-based framework for detecting the latent interests of OSN users in a hierarchical form. This hierarchy is generated based on a probabilistic distribution of the identified interests as derived from the users’ tweets and social relationships. Moreover, the Word2Vec model was utilized for obtaining the semantic similarities of the terms in the tweets, thereby improving the identification of the interests.
Finally, a methodology relying on word embeddings is presented in [25], towards the unsupervised detection of communities in Twitter, applied to posts disseminated from a predefined geographic region. The authors suggest that analysis of the interests of the resulting communities can facilitate the understanding of several social geospatial phenomena. Each user’s tweets were transformed into individual vectors by employing the Word2Vec model, and the number of clusters was derived from the application of the gap statistic technique based on those vectors. Finally, the most frequent terms were identified for each cluster, thereby representing a topic.
3. Automatic Analysis of Social Images: Our Approach
In this section, we present an overview of the architecture of the proposed service towards the automatic analysis of OSNs image content. Moreover, we describe the Google Cloud Vision API platform employed for labeling Twitter images and extracting text using OCR techniques.
3.1. Service Architecture
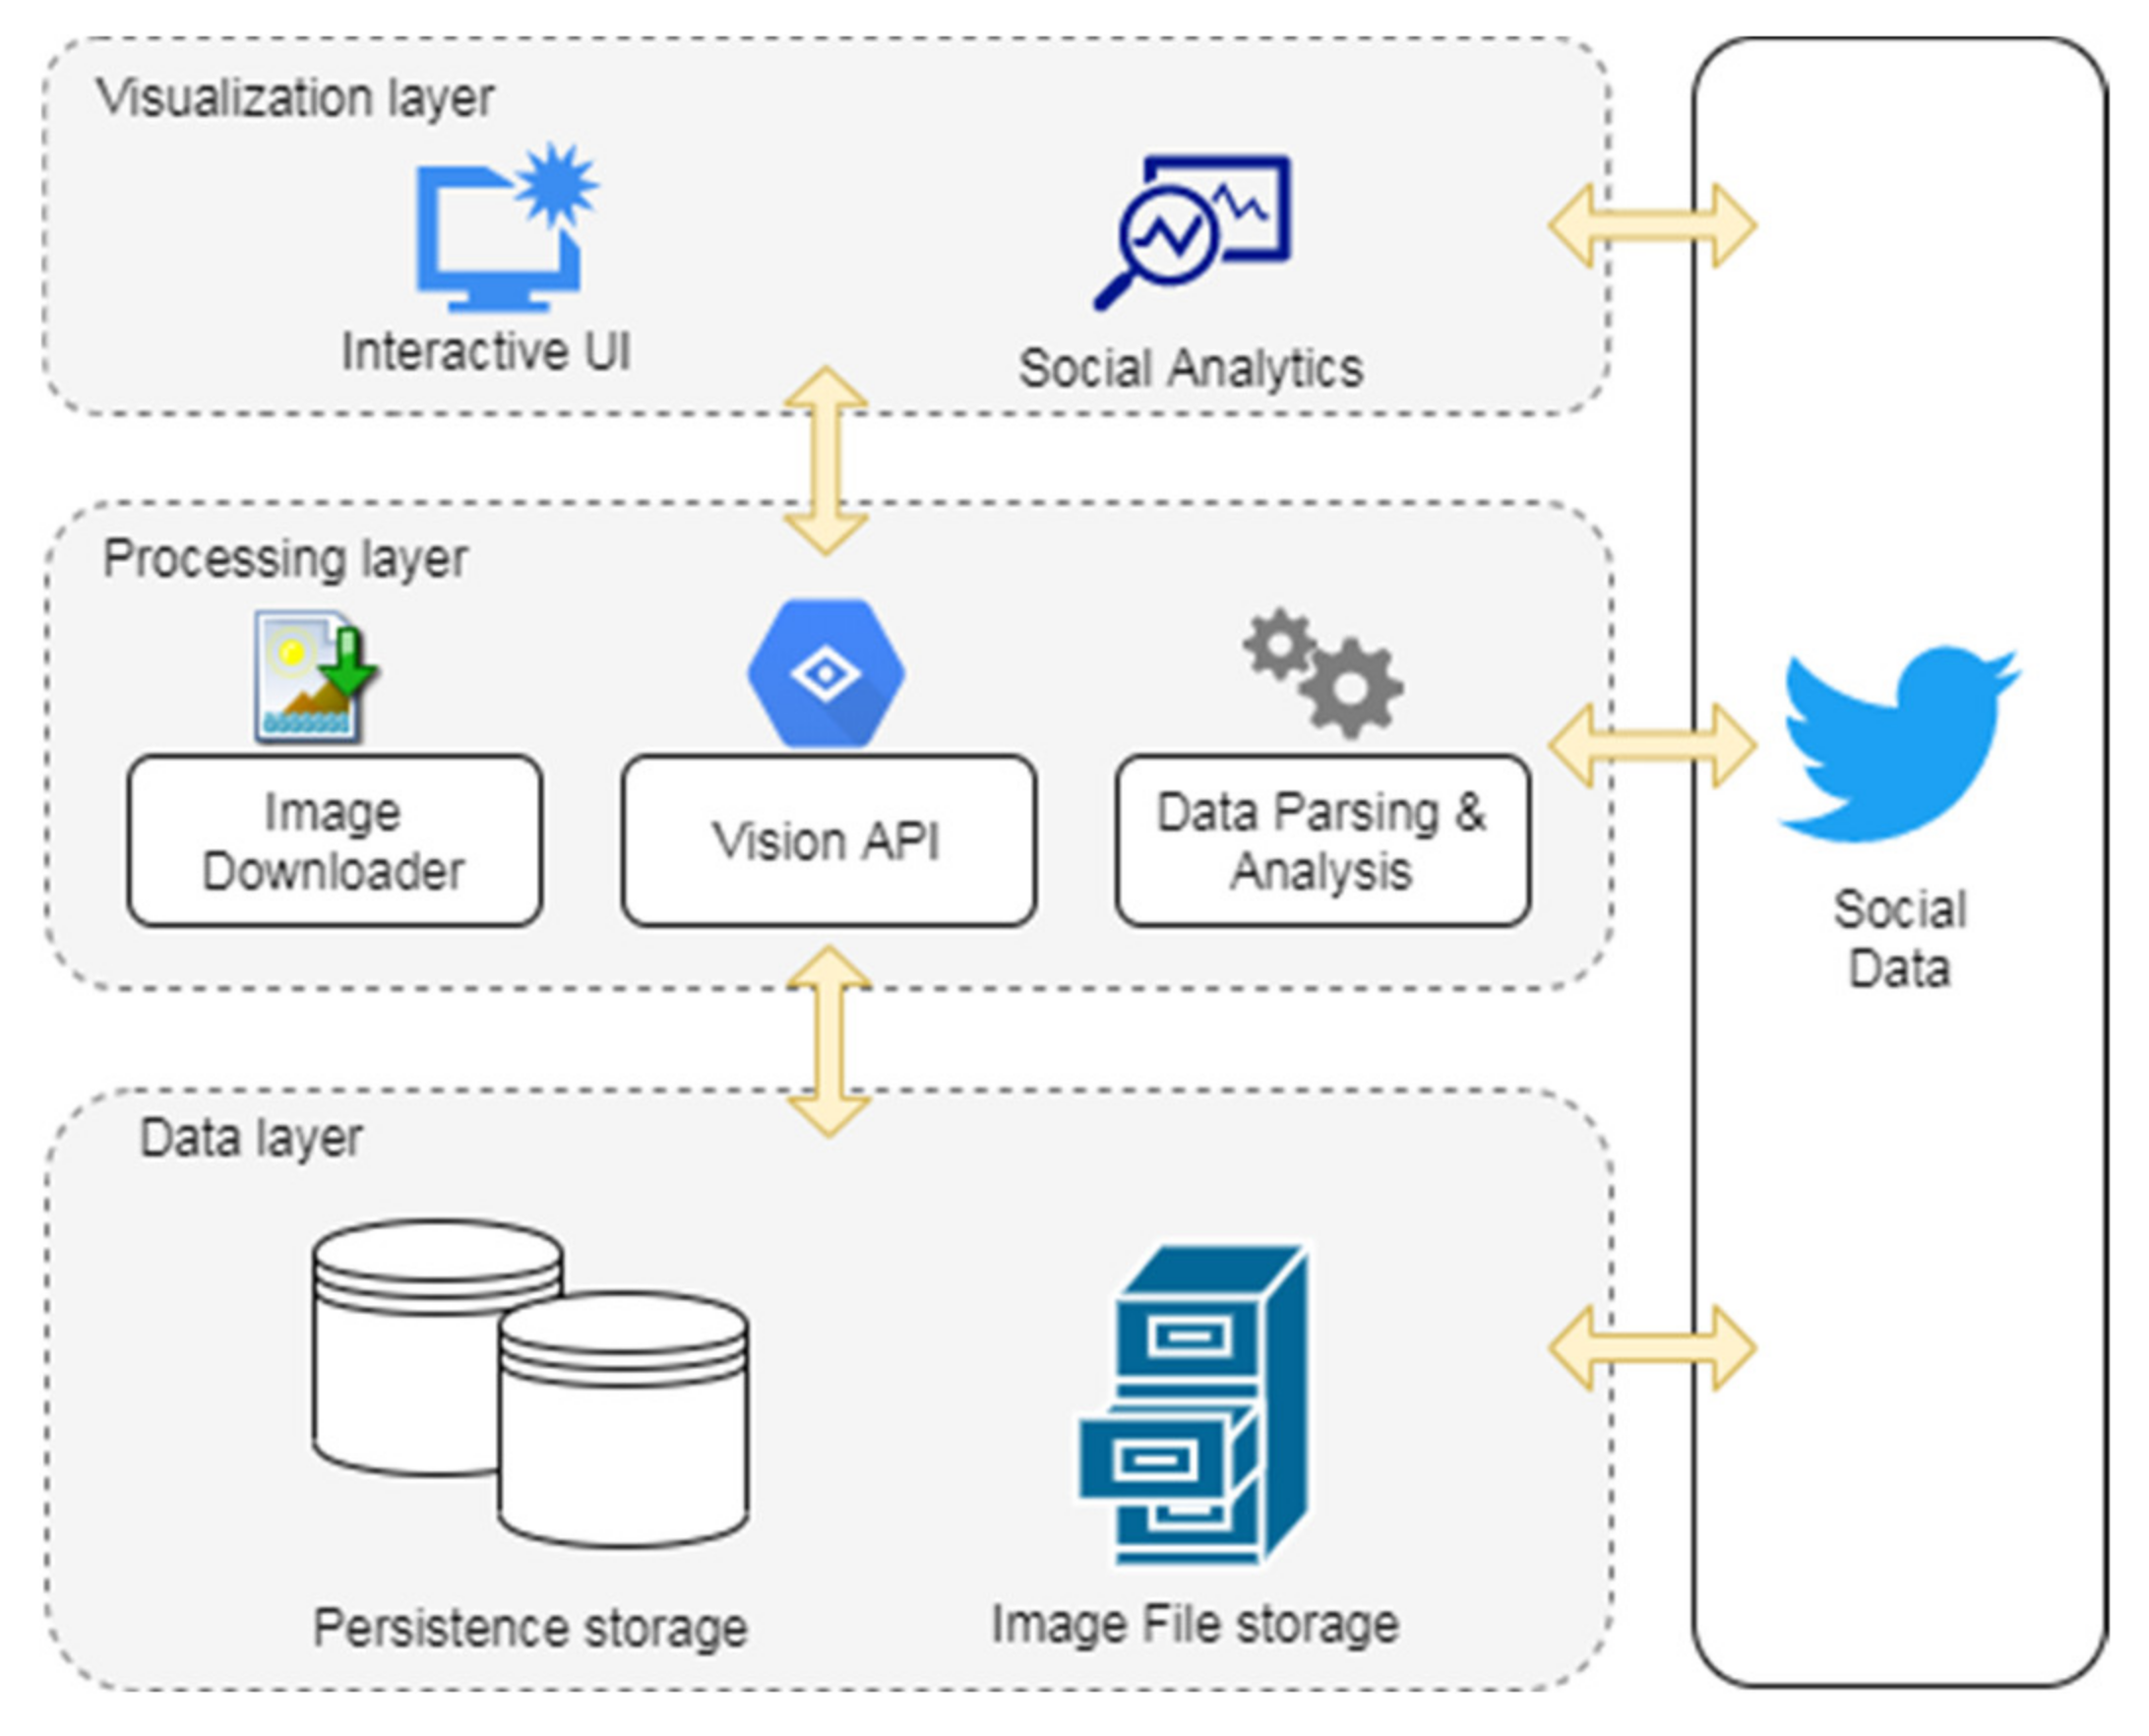
Figure 1 presents the three-layered architecture of the proposed service along with its relevant data flows. Due to the complex nature of our service and the number of its components, this architecture design enables its easier maintenance due to the low coupling between the layers; the addition of new functionality is facilitated by the decoupling; and finally, all dependencies are kept local in every layer. Specifically, the “Data” layer is responsible for (re)structuring, storing, and accessing the social information to and from the dedicated “Persistence storage” component, consisting of a relational database (MySQL Server). Furthermore, an integral part of this layer is the “Image File storage” component, where the harvested social images are stored for future reference and analysis.
The “Processing” layer is responsible for data retrieval and processing tasks, and for the conversion of the raw social information (e.g., Twitter accounts, disseminated images) to a standardized format, in order to be available for parsing and analysis in subsequent phases. Therefore, this layer consists of three components: (a) the “Google Cloud Vision API” one (Section 3.2), responsible for the analysis, labeling, and semantic enrichment of the images; (b) the “Data Parsing and Analysis” one, for converting the raw social data and the response data from the Google Cloud Vision API into the proper format as defined by the “Persistence storage” and “Social Analytics” components; and (c) the “Image Downloader” one, for retrieving and storing the actual OSN images to the “Image File storage” system. If a tweet contains an image or a video, the Twitter API response provides a URL which redirects to either the actual image or the thumbnail of the video. In both cases, these images are retrieved by the aforementioned component. Evidently, in the event of an image being shared by different accounts, it is only downloaded once and associated with them.
Finally, the “Social Analytics” component of the service provides valuable insights regarding the behavioral patterns of the OSN users with respect to their disseminated multimedia content and their latent information, which can be accessed via the web-based “Interactive User Interface (UI)” component, constituting the “Visualization” layer. Furthermore, administrative aspects of the service can also be accessed, providing details regarding the status and progress of the processes (the downloading of the images, Google Cloud Vision API requests, and so on), and access to the database or file storage content.
As presented in Figure 1, all service layers can access the harvested or processed Twitter data, in order for the original or enriched social information to be analyzed, if necessary, by the required components.
3.2. Google Cloud Vision API
In Reference [12], the authors describe a qualitative analysis of the labels of social images as derived from the Google Cloud Vision API and human annotators. It revealed that Google Cloud Vision API is more efficient in image labeling and classification tasks, as humans provided fewer and often vague labels, and in many cases biases were not avoided. Considering the above, and that the majority of related works employed the Google Cloud Vision API, we decided to use it for the purposes of this work over other similar APIs (e.g., Microsoft Azure Computer Vision API).
Eventually, all Twitter images collected by the “Image Downloader” component were submitted to the Google Cloud Vision API via the appropriate REST APIs, requiring user authentication. Consequently, the visual and latent contents of the images were automatically analyzed, while in parallel certain features or entities were recognized, including labels, popular logos, faces along with the sentiments, text, related web pages, objects, and colors. The platform relies on pre-trained models leveraging vast libraries, which have been trained by state-of-the-art DNN ML algorithms. In the context of this research, the Google Cloud Vision API was employed for two purposes; (a) to automatically classify the social images against a large taxonomy of predefined labels (animal, person, car, and so on), where the recognized entities are complemented with their corresponding confidence scores (where score ∈ (0, 1]), and (b) to automatically detect the text and language depicted in the social images, by leveraging the available OCR techniques.
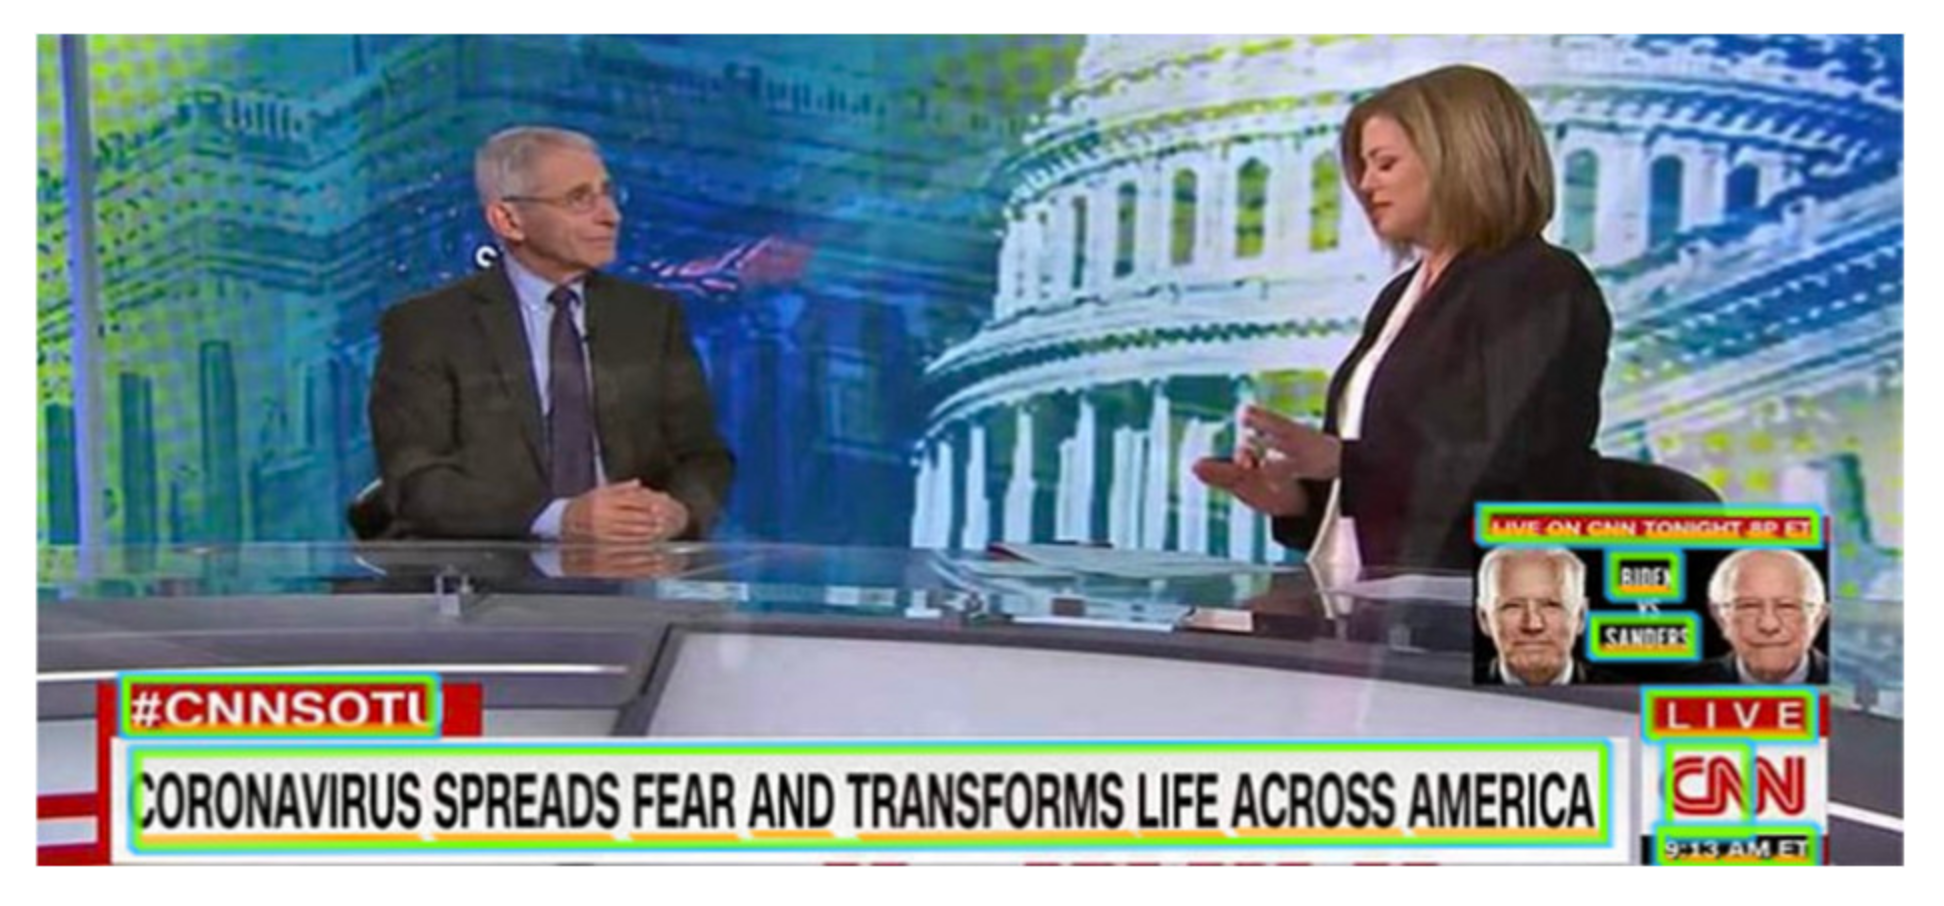
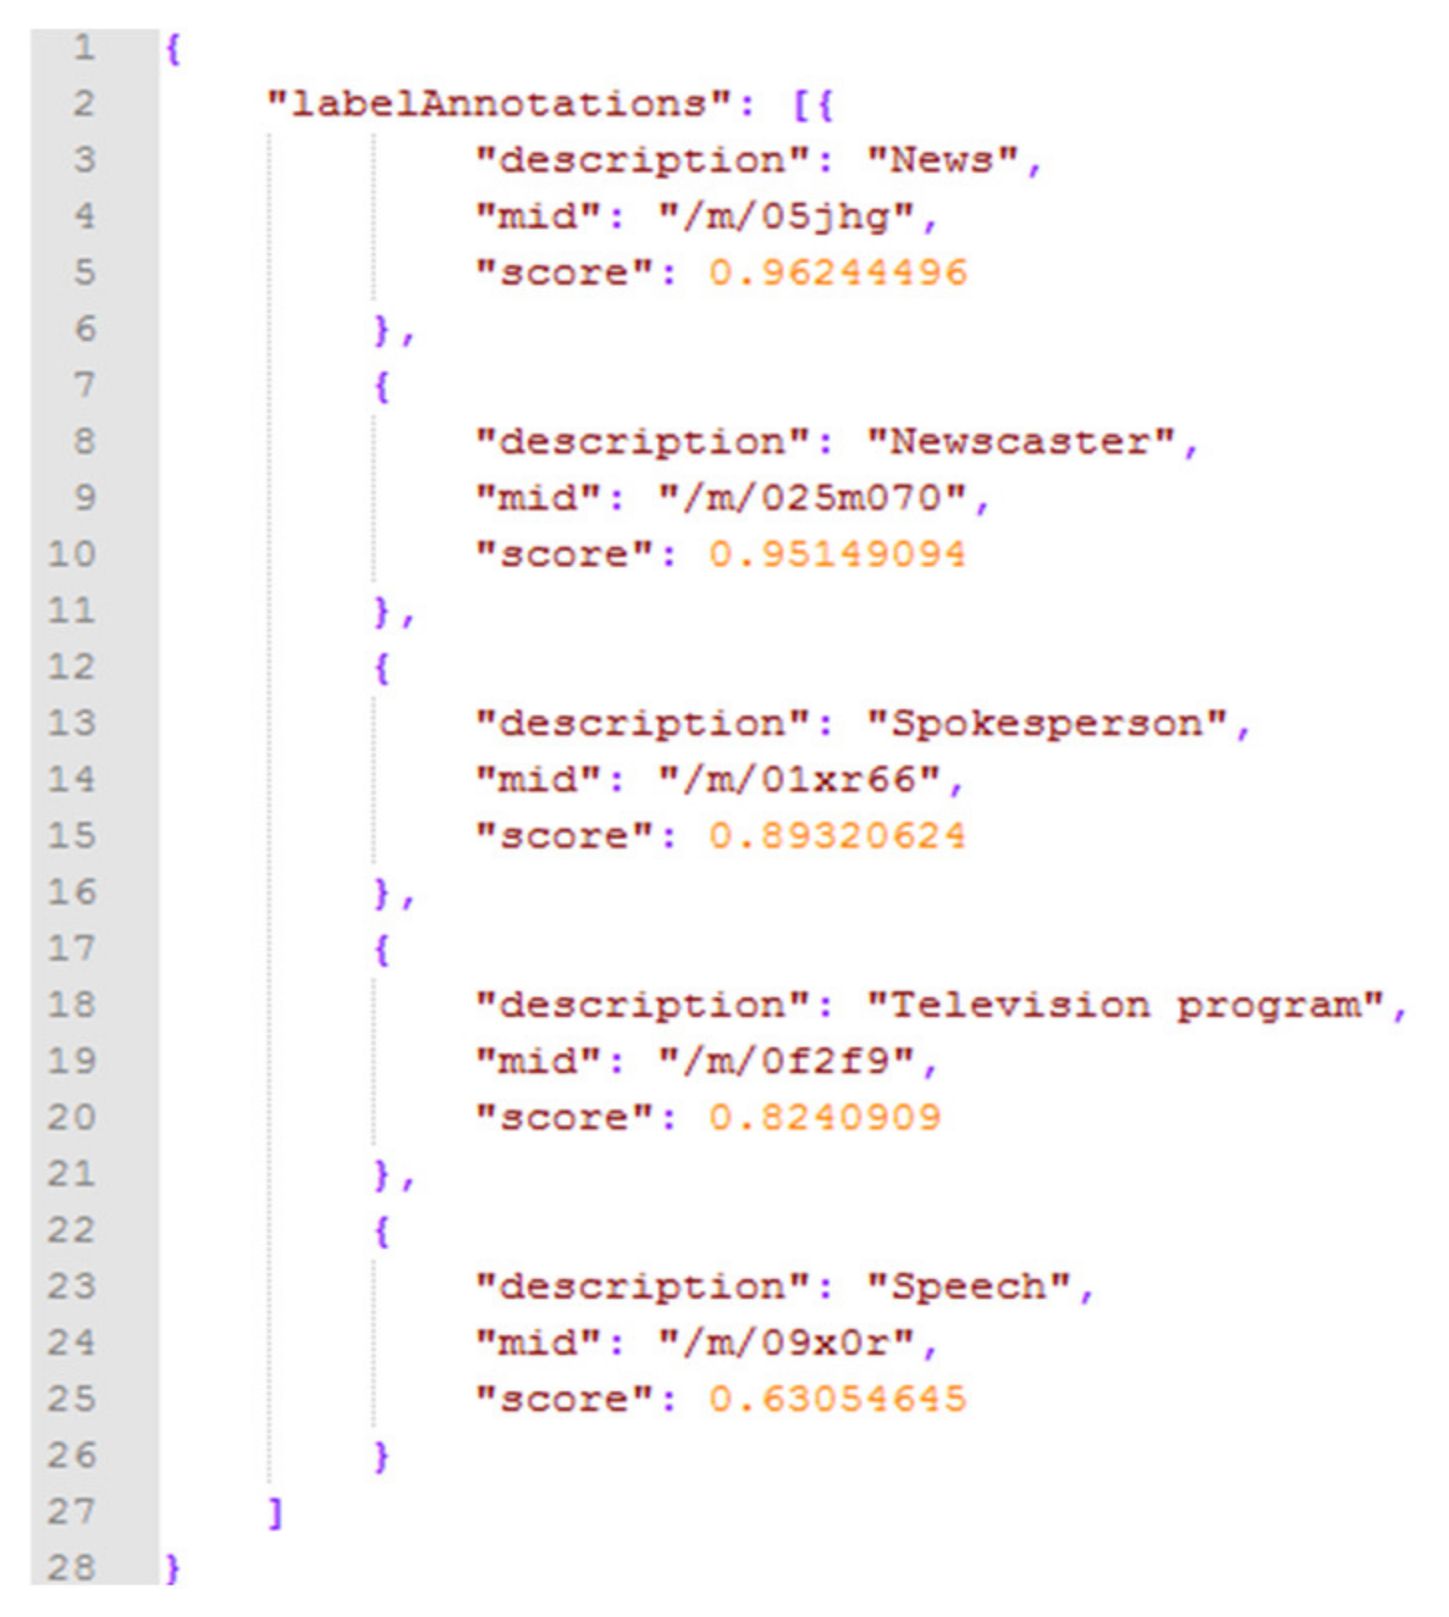
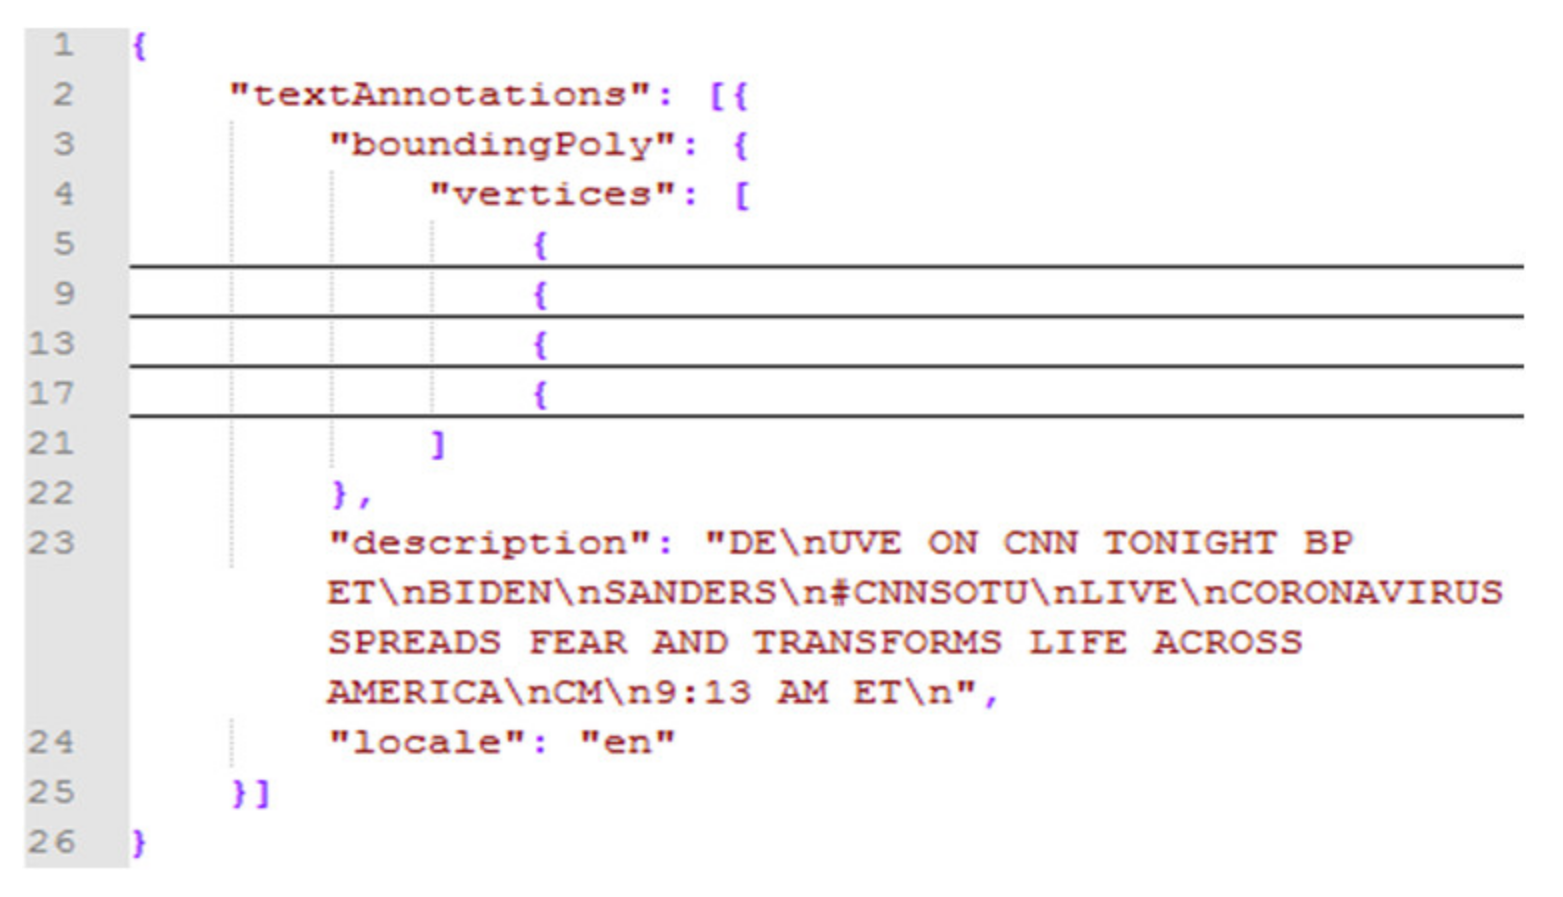
Each of these services is considered as a distinct request per image to the Google Cloud Vision API, whereas the programmatic response is always a single JSON file per request. Two such sample files containing the weighted labels and extracted text of Figure 2 can be found in Figure 3 and Figure 4, respectively. The Twitter account of CNN news agency posted Figure 2 during Anthony Fauci’s interview (the director of US National Institute of Allergy and Infectious Diseases (NIAID)) about the coronavirus in 2020. As presented in Figure 3, each label (i.e., “description” key) is accompanied with a confidence score (i.e., “score” key) along with a unique identifier (i.e., “mid” key), which associates the label with an external semantic resource, such as Wikidata. As presented in Figure 4, the text (i.e., “description” key) of Figure 2 is accompanied with its language (i.e., “locale” key), as recognized in the green rectangles representing the OCR bounding boxes. Finally, the special character “\n” indicates that a piece of text belongs to another bounding box.
As is obvious, even a single social image incorporates a plethora of latent information, which can be exploited to enhance the social analytic task and lead to useful insights.
4. Classification of Twitter Accounts
As described in our previous works in [5,26], we leveraged the DBpedia knowledge base and its ontological schema towards the labeling and classification of Twitter accounts. By analyzing the wide range of these accounts, 44 thematic categories were identified, 40 of which derived directly from DBpedia, and the other four were suggested by IT (http://InfluenceTracker.com/) for reasons of information completeness. From the 40 DBpedia-based categories, 36 of them were inspired by the values of the “rdf:type” Semantic Web property of the corresponding DBpedia resources (i.e., URIs), indicating that they are instances of an ontological class, and the remaining four IT-based ones were inspired by the values of the “dbp:position” Semantic Web property, representing the political positions of the resources. The values of this property were considered for introducing new thematic categories in the cases that related DBpedia classes could not be found, thereby leading to a more complete collection of the concepts derived.
Often the ontologies introduce their own classes for semantically representing the exact or very similar concepts already existing in others. For example, the classes “dbo:Politician”, “yago:Politician110450303” and “umbel-rc:Politician” are used to represent the concept of politicians. Similarly, the classes of “dbo:Athlete”, “umbel-rc:Athlete”, “yago:Athlete109820263” and “yago:Player110439851” are used to represent the concept of athletes, independently of the individual sport (e.g., soccer or basketball). Therefore, in order for the most dominant thematic categories to be identified, we examined the ontological classes (values of “rdf:type” property) which can be categorized under a single conceptual domain, along with the numbers of occurrences of these classes in our dataset. Finally, generic classes without contextual significance were excluded, such as “owl:Thing”, “dbo:Agent” and “foaf:Person”.
In order for these thematic categories to be identified, the examined Twitter accounts had to be related to the most appropriate DBpedia semantic resources best describing them; thus, in [5,26] two approaches were presented. The first of them leverages the “Display Name” of a Twitter account, trying to match it against specific semantic properties of the resources, and the other formats the “Display Name” under specific DBpedia name pattern conventions in an effort to construct the DBpedia URI of the desired resource. Eventually, the identified DBpedia resources are linked with the semantified representations of the Twitter accounts, as stored in IT (http://InfluenceTracker.com/). The service for collecting the social information along with the “InfluenceTracker” ontology (http://www.InfluenceTracker.com/ontology) and the semantic technologies for representing the Twitter accounts, their characteristics, social relationships, and disseminated entities into Linked Data have been presented in [26,27].
5. Experimental Results and Dataset
In this section, we analytically present and discuss the results of the proposed framework presented in Section 3, towards the enrichment of the social analytics with semantics and hidden textual information. To this end, we exploit the latent information of Twitter images of the “Politics” and “Celebrities” communities, by automatically labeling them and extracting the depicted text by employing the Google Cloud Vision API platform. Despite the fact that our published dataset also contains related social information about the press, we did not analyze its results, as this category is quite generic (includes Twitter accounts related to news press agencies); thus, it cannot be further split into smaller groups, contrary to the other examined communities. In addition, the number of Twitter accounts in the “Press” community is uneven with respect to the ones labeled “Politics” and “Celebrities”.
5.1. Case Study 1: Political Accounts
The first case study is focused on a community of 130 Twitter accounts of the political domain, which can be further divided into smaller and overlapping groups, as derived from the methodology described in Section 4. For each account, up to 500 images were extracted from the tweets and downloaded, which were then submitted to the Google Cloud Vision API for labelling and text extraction, as presented in Section 3.2.
The details of the dataset used for the aims of this case study are presented in Table 2. Specifically, it consists of 39,499 annotated images, classified by 4059 unique labels, shared by these 130 accounts, which in turn can be further classified into 12 categories, a subset of the ones presented in Table 1. On average, approximately 312 images were collected for each account. Furthermore, text is depicted in 26,953 of these images, which was extracted using OCR techniques, consisting of 188,077 unique terms of several languages (e.g., Greek, English, Spanish, and French). As can be observed, the majority of the images (68.2%) contain textual information, thereby validating our intuitions for conducting this study. On average, each social image of this dataset is associated with 7.6 labels and 16.9 textual terms. Finally, 1086 of these images were shared by multiple accounts, as presented in the first row of Table 2.
The examined Twitter accounts of this case study include foreign and Greek active or ex members of parliament and political parties. On a broad level, three principal categories of political positions are considered in Greece, namely “right”, “center” and “left”; each of them can be further divided into more fine-grained groups. In order to perform our analysis and assess the existence of behavioral patterns based on the disseminated multimedia content, the accounts were grouped into the following four broad communities:
- Politics: all foreign and Greek political accounts.
- Right: Greek accounts classified as “far right”, “right wing” and “center right.”
- Center: Greek accounts classified as “center”, “center right” and “center left.”
- Left: Greek accounts classified as “left wing” and “center left.”
Our investigation is oriented toward the latent context of the accounts’ disseminated images. Therefore, two types of analyses were performed on these four communities of accounts—firstly on the labels as derived from the Google Cloud Vision API, and secondly, on the extracted by OCR techniques text.
As presented in Section 3.2, each assigned label is complemented with a corresponding confidence score, where score ∈ (0, 1]. In order for the most dominant ones to be calculated, a formula was employed relying both on the values of the confidence score and the number of occurrences. In Equation (1) the “” measurement is introduced, deriving as the multiplication of the sum of a label’s confidence score values by the label’s number of occurrences. The latter is adjusted according to the base-10 logarithmic scale for avoiding outlier values, properly set to preventing being equal to zero.
where n > 0 and .
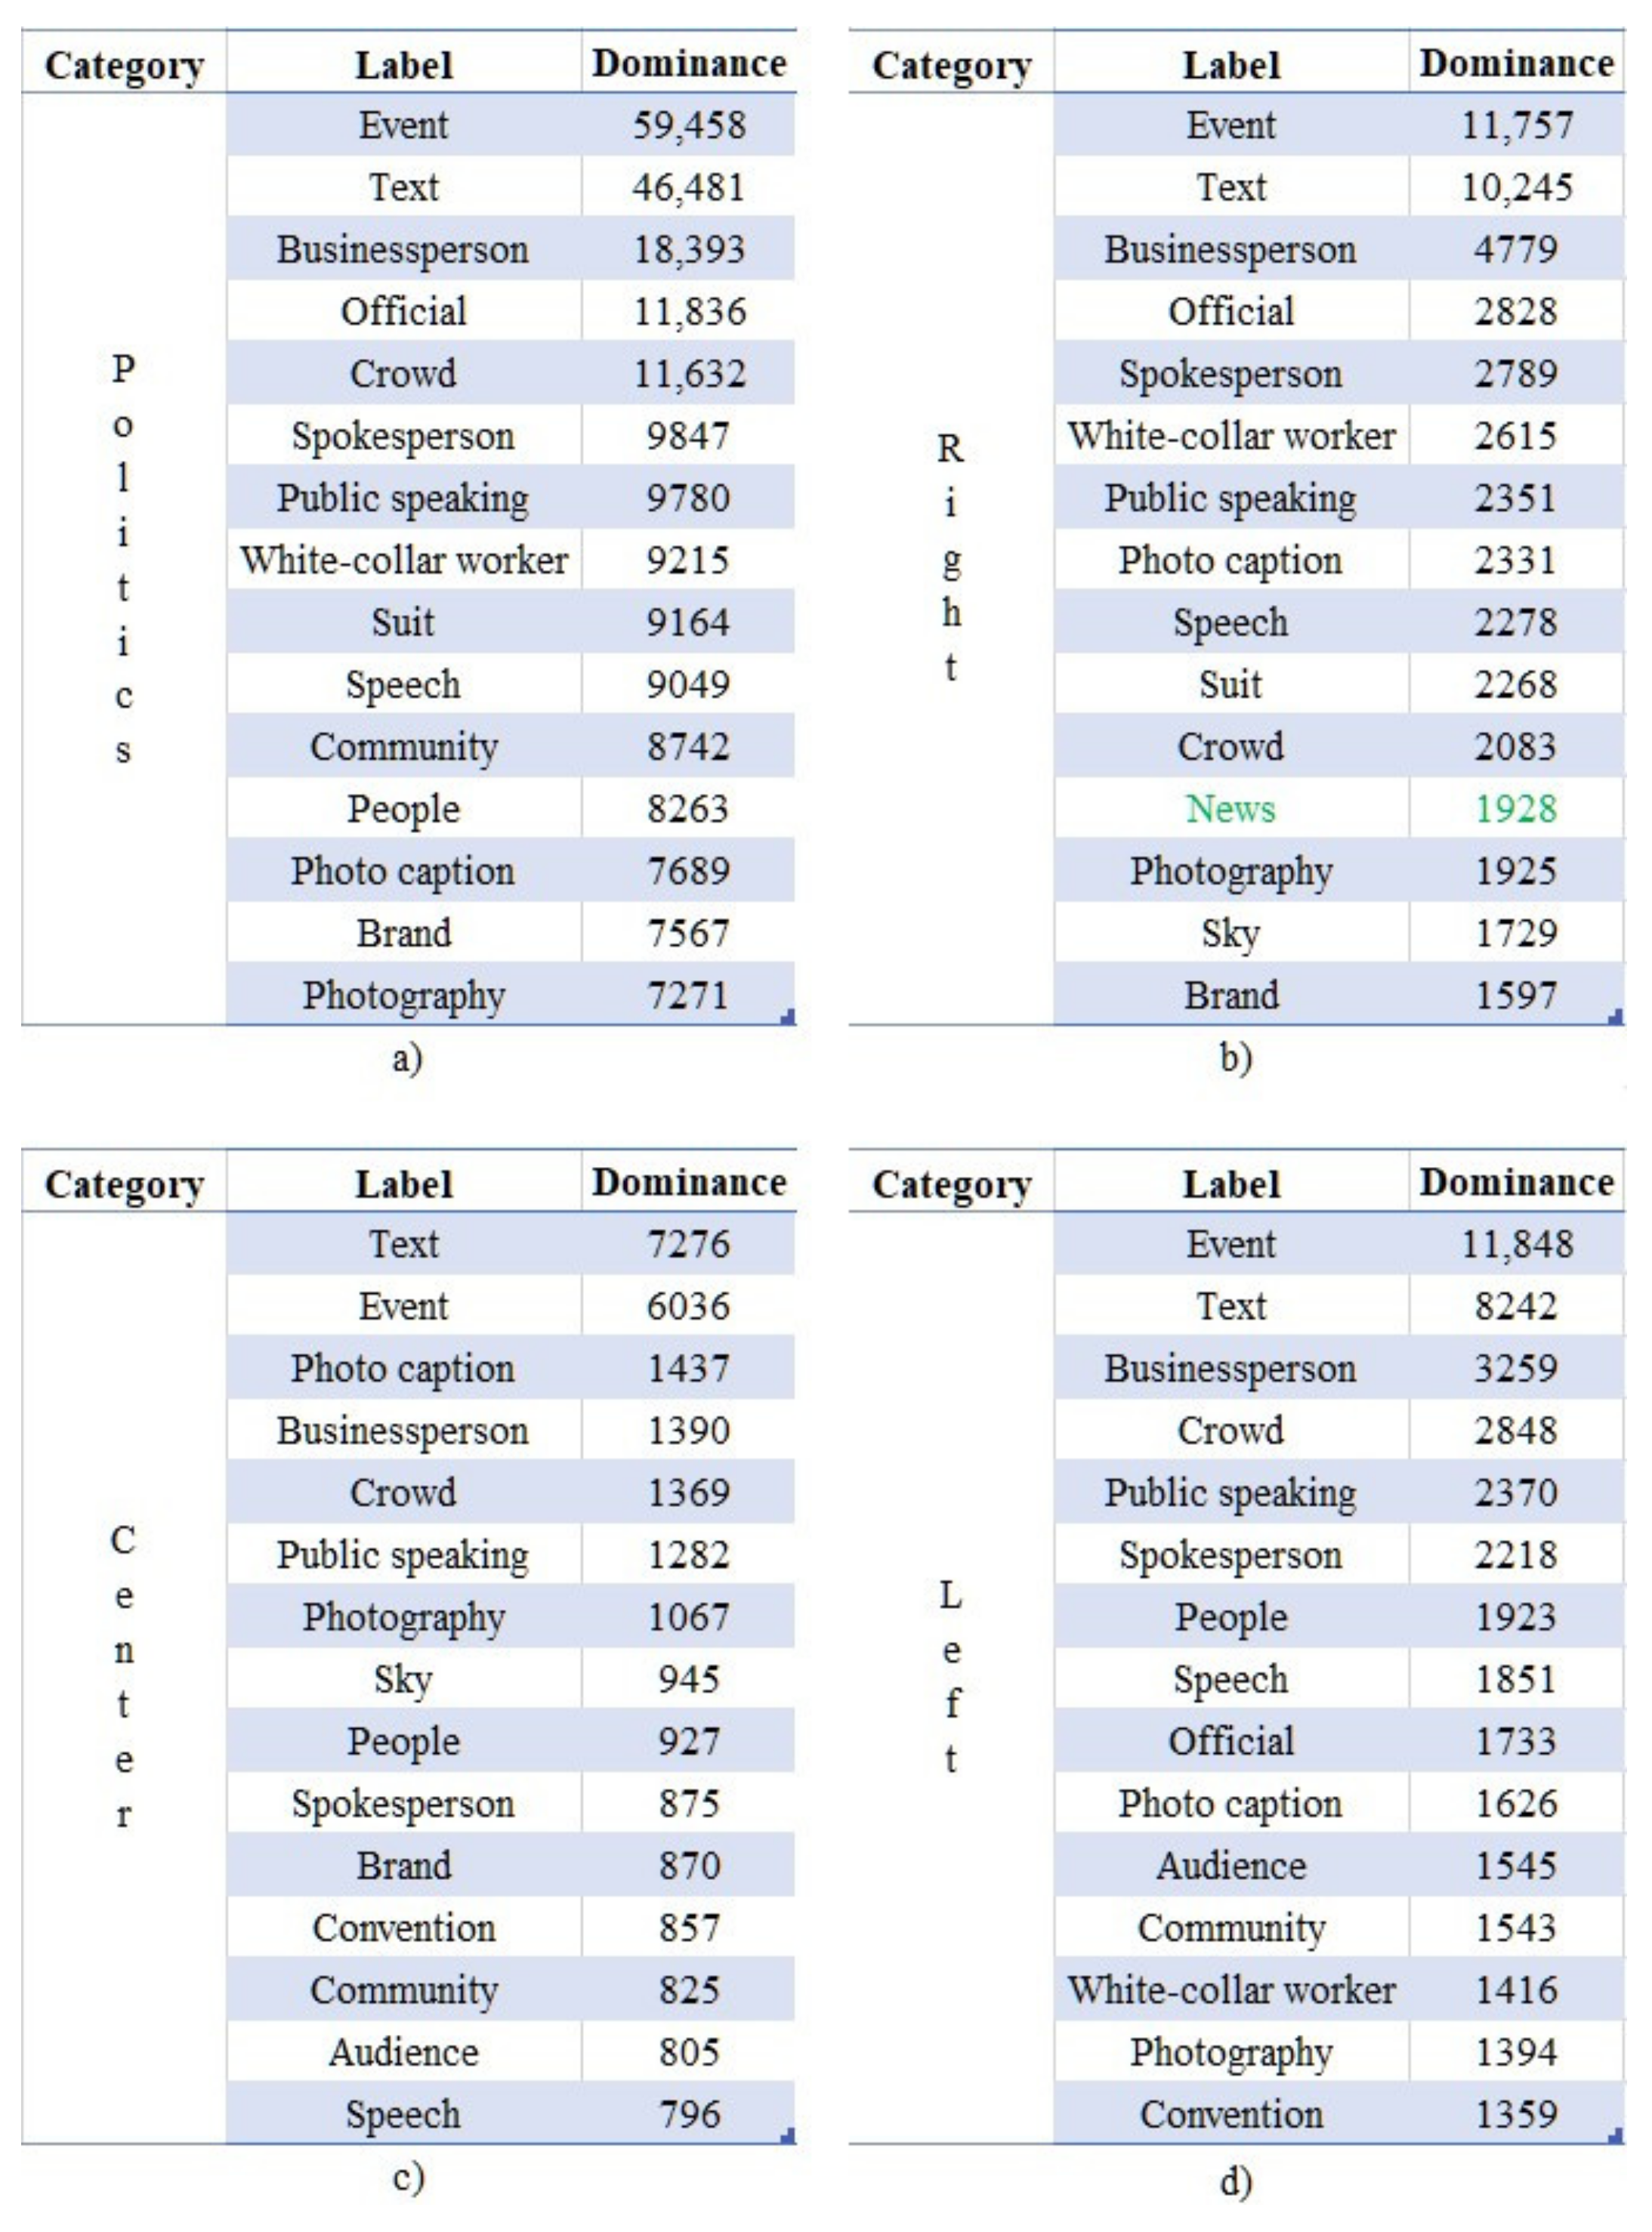
The top 15 labels of the political account’s images according to their corresponding values of “” are presented in Figure 5a–d. As can be observed, all four communities are associated with the labels “Text” and “Photo caption”, indicating the rich textual information existing in those images. Furthermore, since politicians often give public speeches or interviews, the generic label “Event” appears, along with several related labels, such as “Crowd”, “Speech” and “Spokesperson”. Finally, the concepts of “Businessperson” and “White-collar worker” appear as a result of the formal dress code applied in such events.
A more in-depth investigation of these labels unveiled the existence of patterns in the latent context of the social images of accounts belonging to broad or overlapping communities. Specifically, 60% of the top 15 most dominant labels (i.e., 9 out of 15) can be found in all communities, even with interchanged ranks, while 93% of those labels (i.e., 14 out of 15) can be found at least in three communities. The only exception is the label “News”, appearing only once (highlighted in green in Figure 5b), due to interviews of news agencies (similarly to the case of Figure 3). This fact showcases the strong ties of the underlying patterns of the latent information shared among these overlapping groups.
An interesting fact has been revealed regarding the behavioral patterns of the members of the subcommunities “right” and “left”, which are considered to be opposite in terms of their political views and ideas. Specifically, the label “Sky” is associated with the first group, and the second one with the label “Convention”. Our investigation revealed that the members of the first group gave speeches in open spaces, and those of the second in convention centers.
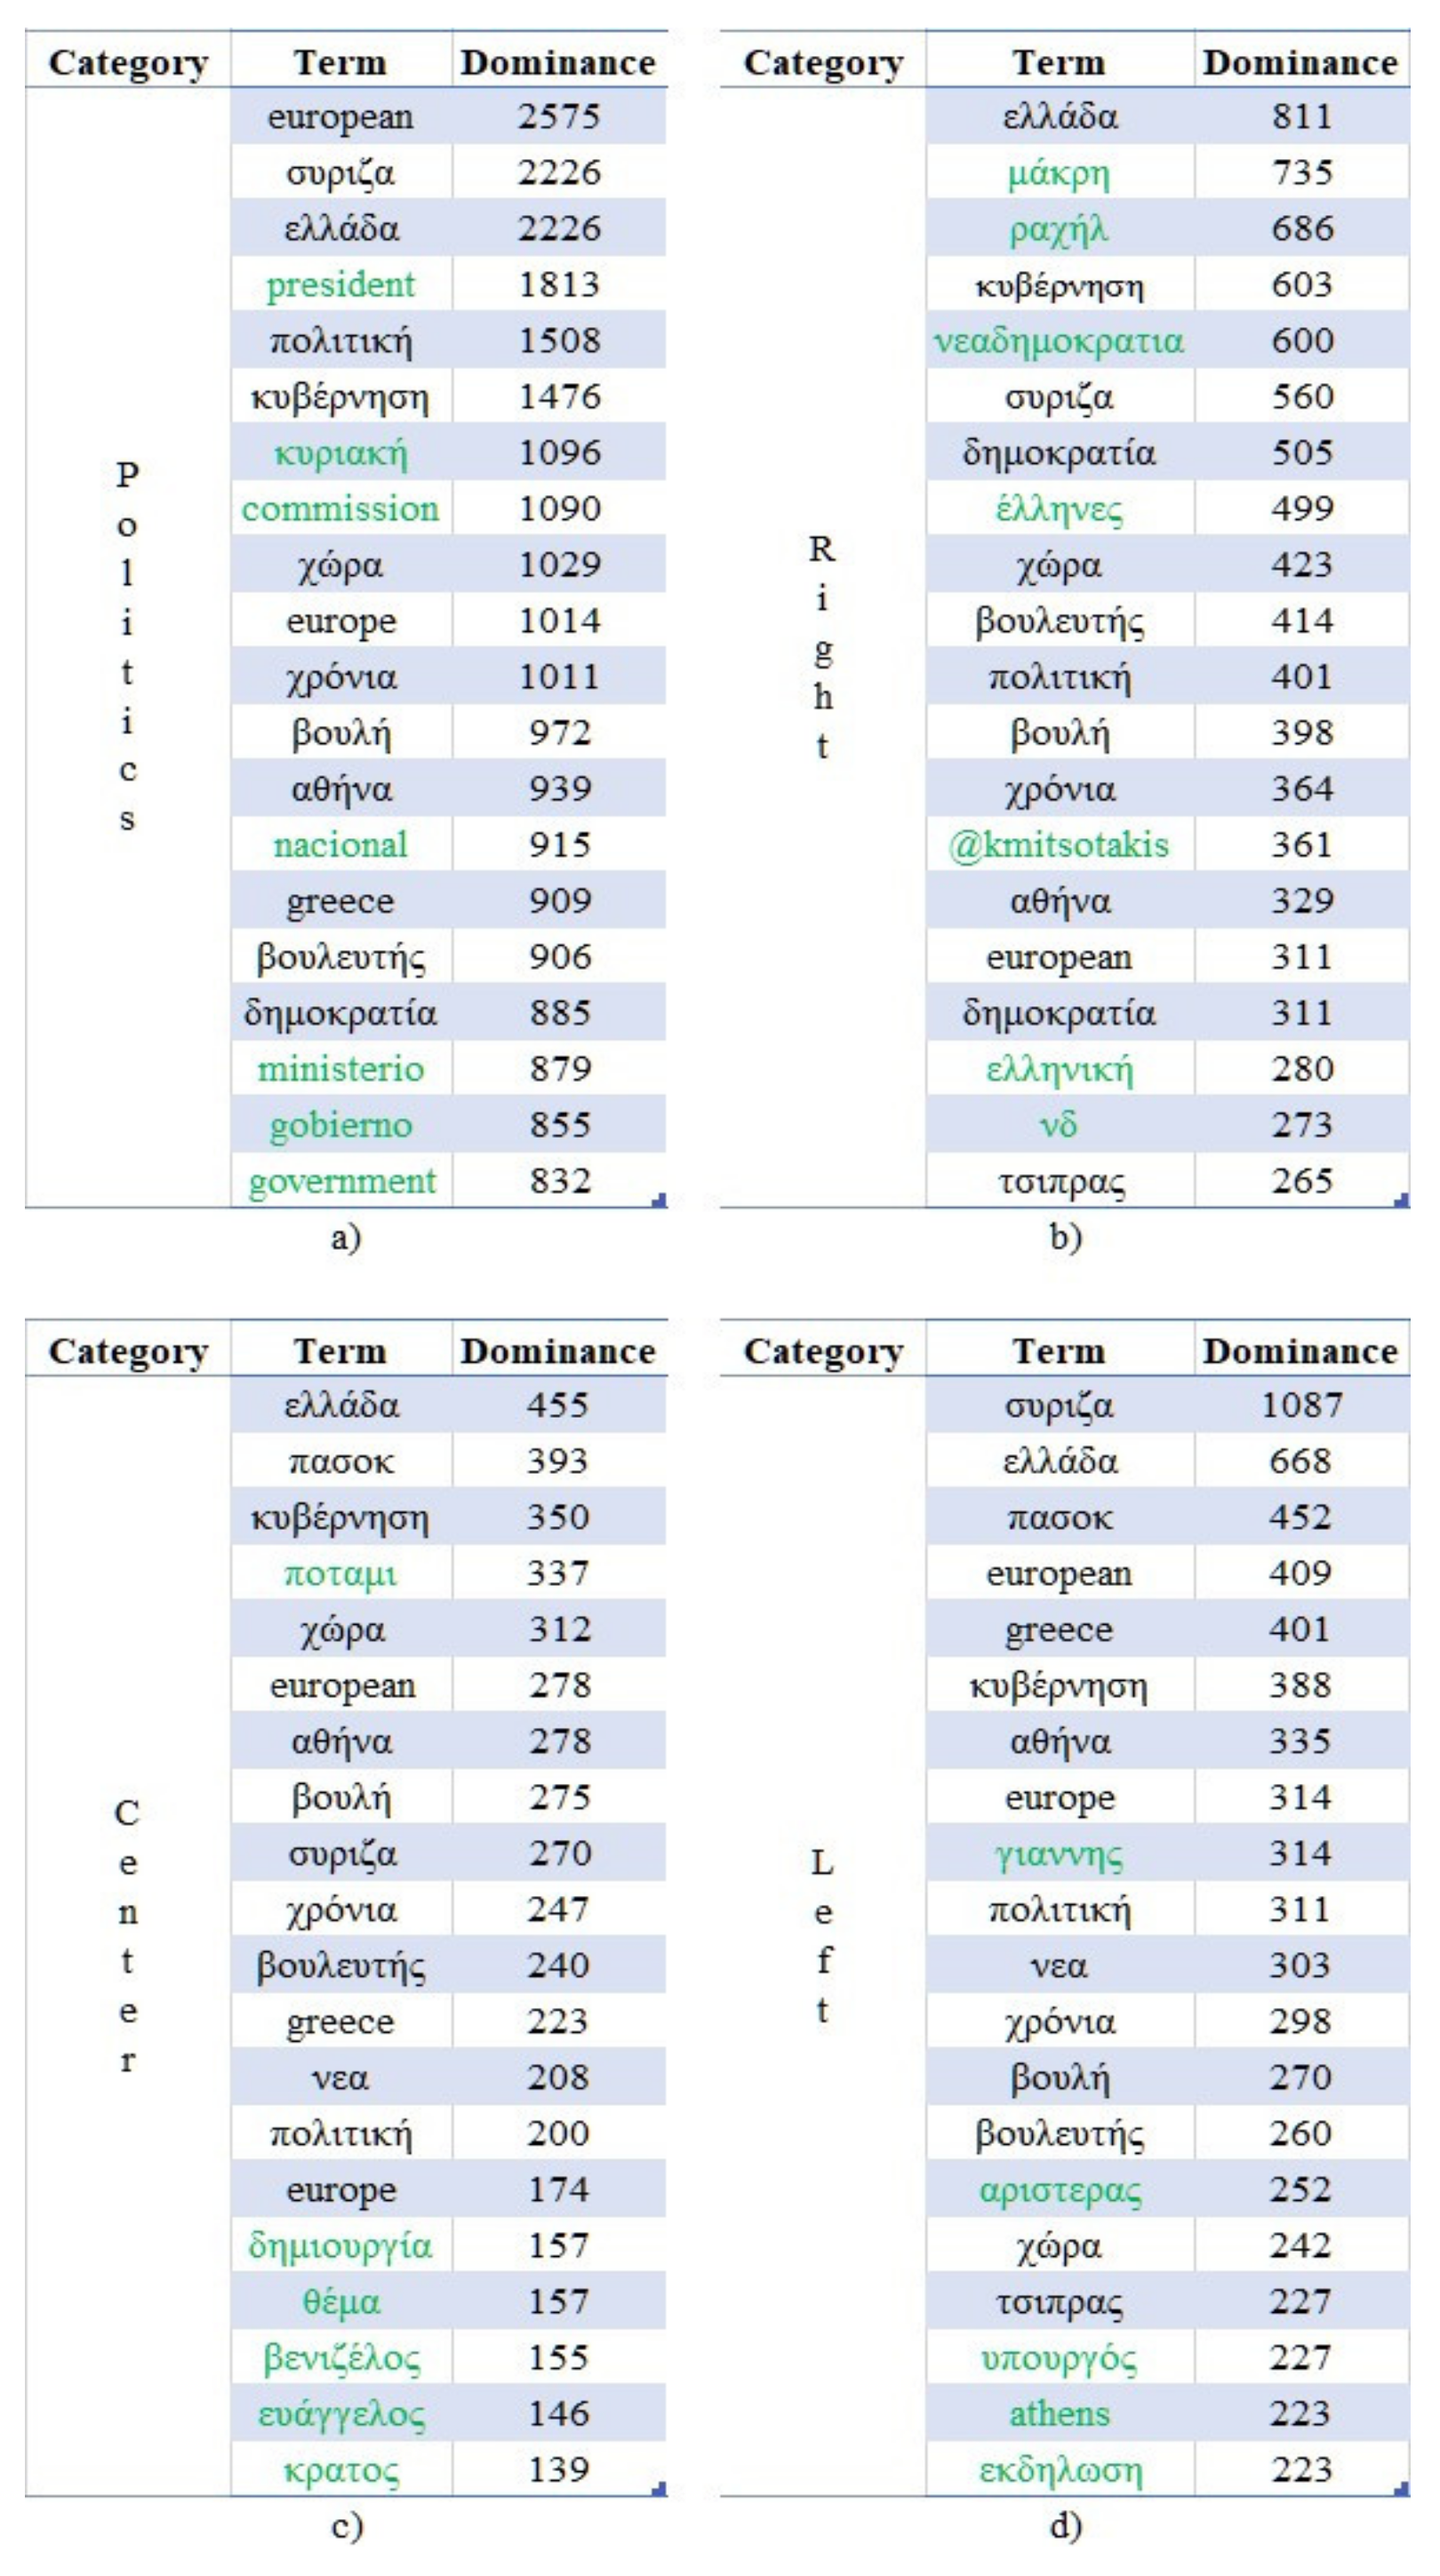
The top 20 terms of the extracted using OCR techniques text are presented in Figure 6a–d, as ranked by a variation of the aforementioned “.” Specifically, in Equation (2) the “” measurement is described. In this case, the sum of the confidence score values has been replaced by the number of images in which a specific term appeared (i.e., the score is set as equal to one). Prior to measuring the dominance of the terms, all were transformed to lowercase and the Greek, English, Spanish, German, and French stopwords were removed. The investigation revealed that 68.7% of the most dominant terms (i.e., 55 out of 80) can also be found in other communities as well. The unique terms are highlighted in green.
where n > 0 and .
As can be seen, most of the dominant terms are in Greek, since the majority of the accounts belonged to Greek politicians. However, terms in the Spanish (e.g., “gobierno”, “ministerio”) and English (e.g., “government”, “commission”) languages can also be found in the generic “Politics” community, being highly related to the examined domain. Moreover, a more thorough analysis on the other communities reveals the strong correlations of the dominant terms and the represented political positions.
Indicative examples include the following cases:
- The terms “νεαδημοκρατια”, “δημοκρατια”, “νδ” and “@kmitsotakis” which directly reference the right wing “New Democracy” political party and the Twitter account of its leader (Kyriakos Mitsotakis) respectively;
- The terms “πασοκ”, “ευάγγελος”, and “βενιζέλος” which directly reference the center-left wing “PASOK” political party and of one its members (specifically, his first and last names, Evangelos Venizelos) respectively;
- The terms and “συριζα”, “τσιπρας”, “αριστερας” and “γιαννης” of which the first three directly reference the left wing political party “SYRIZA”, its leader (Alexis Tsipras), and the left political position respectively, and the fourth term indirectly references Yanis Varoufakis, an ex-member.
As in the case of the labels, an in-depth investigation of the depicted text of the images also unveiled the existence of patterns in the latent information of the social images of accounts belonging to broad or overlapping communities, thereby being capable of enriching the context of the social analytics.
5.2. Case Study 2: Celebrities’ Accounts
As an effort to further validate our experimental results, an additional case study was conducted focusing on a community of 54 different Twitter accounts belonging to famous celebrities which can also be further divided into smaller and overlapping groups. Similarly to the first scenario, this community can also be further divided into three groups; for each account up to 500 images were extracted, downloaded, and finally processed by the Google Cloud Vision API.
Table 3 presents the details of the dataset used in this case study. Specifically, 22,331 images were annotated and classified by 3790 unique labels; they were shared by these 54 accounts, and in turn can be further classified into 10 categories, subsets of the ones presented in Table 1. On average, approximately 415 images were collected for each account. Furthermore, text is depicted in 13,138 of these images, consisting of 46,243 unique terms, the overwhelming majority of which are in the English language. As in our previous case, the majority of the images (58.8%) contain textual information. On average, each social image of this dataset is associated with 8.2 labels and 6.8 textual terms. Finally, 62 of these images were shared by multiple accounts, as presented in the first row of Table 3.
Comparing the characteristics of the two “Politics” and “Celebrities” datasets, it is evident that both groups rely on images for complementing their social posts. However, while the members of the first group shared almost 100 fewer images on average (312 vs. 415), the text depicted was significantly richer and more diverse compared to that of the second group. This is not only showcased by the approximately 10 percentage units of difference (68.2% vs. 58.8%) in the images containing text, but also by the 2.5 times greater average number of the textual terms per image (16.9 vs. 6.8). The direct comparison of the latent context of the disseminated images of these communities provides us with further insights regarding the underlying behavioral patterns.
As already mentioned, the examined celebrities’ Twitter accounts of this case study can be further divided into more fine-grained groups. In order to analyze the content and assess the existence of behavioral patterns based on the disseminated multimedia content, these accounts were grouped into the following four communities:
- Celebrities: all accounts of this dataset;
- Athlete: accounts owned by professional sports players (basketball, soccer, tennis, etc.);
- Music: accounts owned by singers;
- TV: accounts owned by actors and tv personas.
In order to investigate the latent context of the disseminated images by the accounts belonging to these four communities, the same methodology as in the previous case study (Section 5.1) was applied.
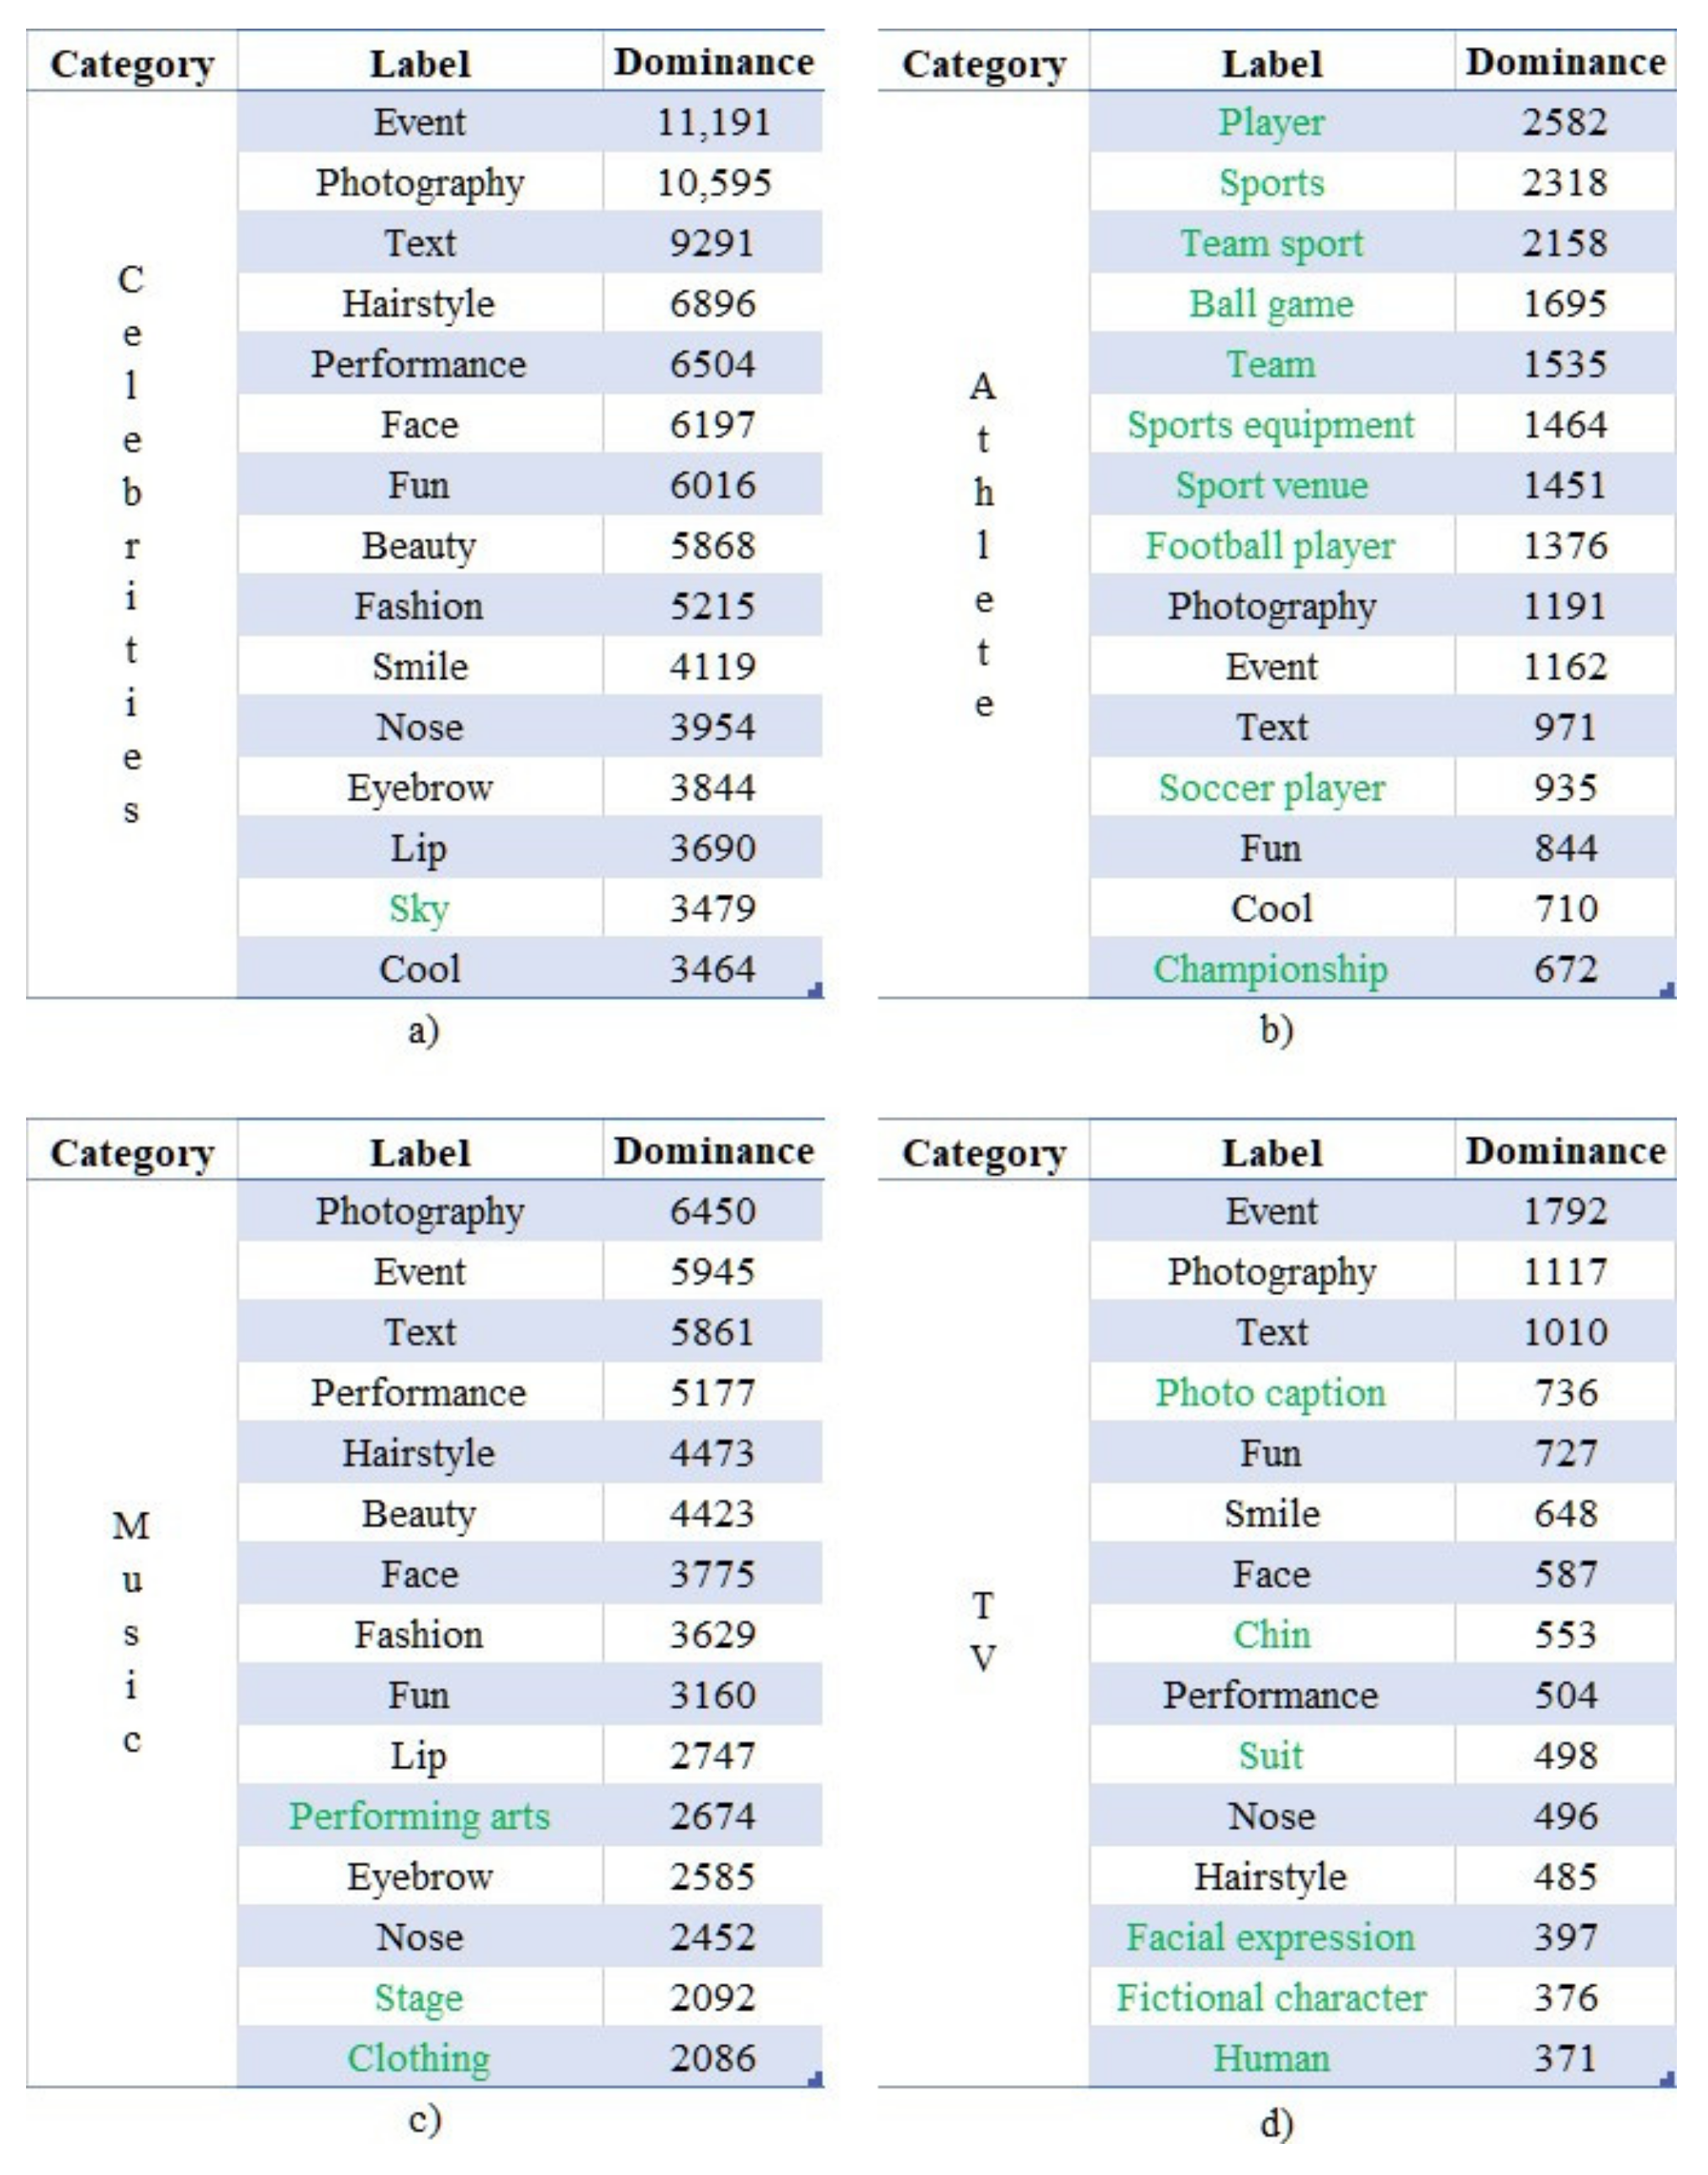
The top 15 labels of the examined accounts’ images according to their corresponding values of “” are presented in Figure 7a–d. As can be observed, all four communities are associated with the label “Text”, indicating the rich textual information existing in those images. Furthermore, since celebrities participate in several types of happenings, the generic label “Event” appears, along with related labels, such as “Fun” and “Performance”. Finally, a plethora of concepts related to physical appearance are present, such as “Face”, “Hairstyle”, “Nose” and “Lip”, since a celebrity’s appearance is usually central in the social images.
As in the case of the previous case study, a more in-depth investigation of these labels unveiled the existence of patterns. Specifically, 27% of the top 15 most dominant labels (i.e., 4 out of 15) could be found in all communities, while 58% of them (i.e., 8 out of 15) at least in three. Despite the fact that these numbers are lower compared to the respective ones of the first use case, the fact that the three subcommunities of “Athlete”, “Music”, and “TV” do not overlap showcases the existence of strong ties regarding the underlying patterns of the latent information shared by the community of celebrities.
An interesting fact is the correlation of the context of the labels appearing only in one of the aforementioned three subcommunities with the activities of their members. Specifically, the labels “Sports equipment” and “Sport venue” are related to the “Athlete” group; the labels “Performing arts” and “Stage” to the “Music” group (since it mainly consists of singers); and the labels “Fictional character” and “Facial expression” with the “TV” group (since it mainly consists of actors). The labels appearing only once are highlighted in green in Figure 7a–d.
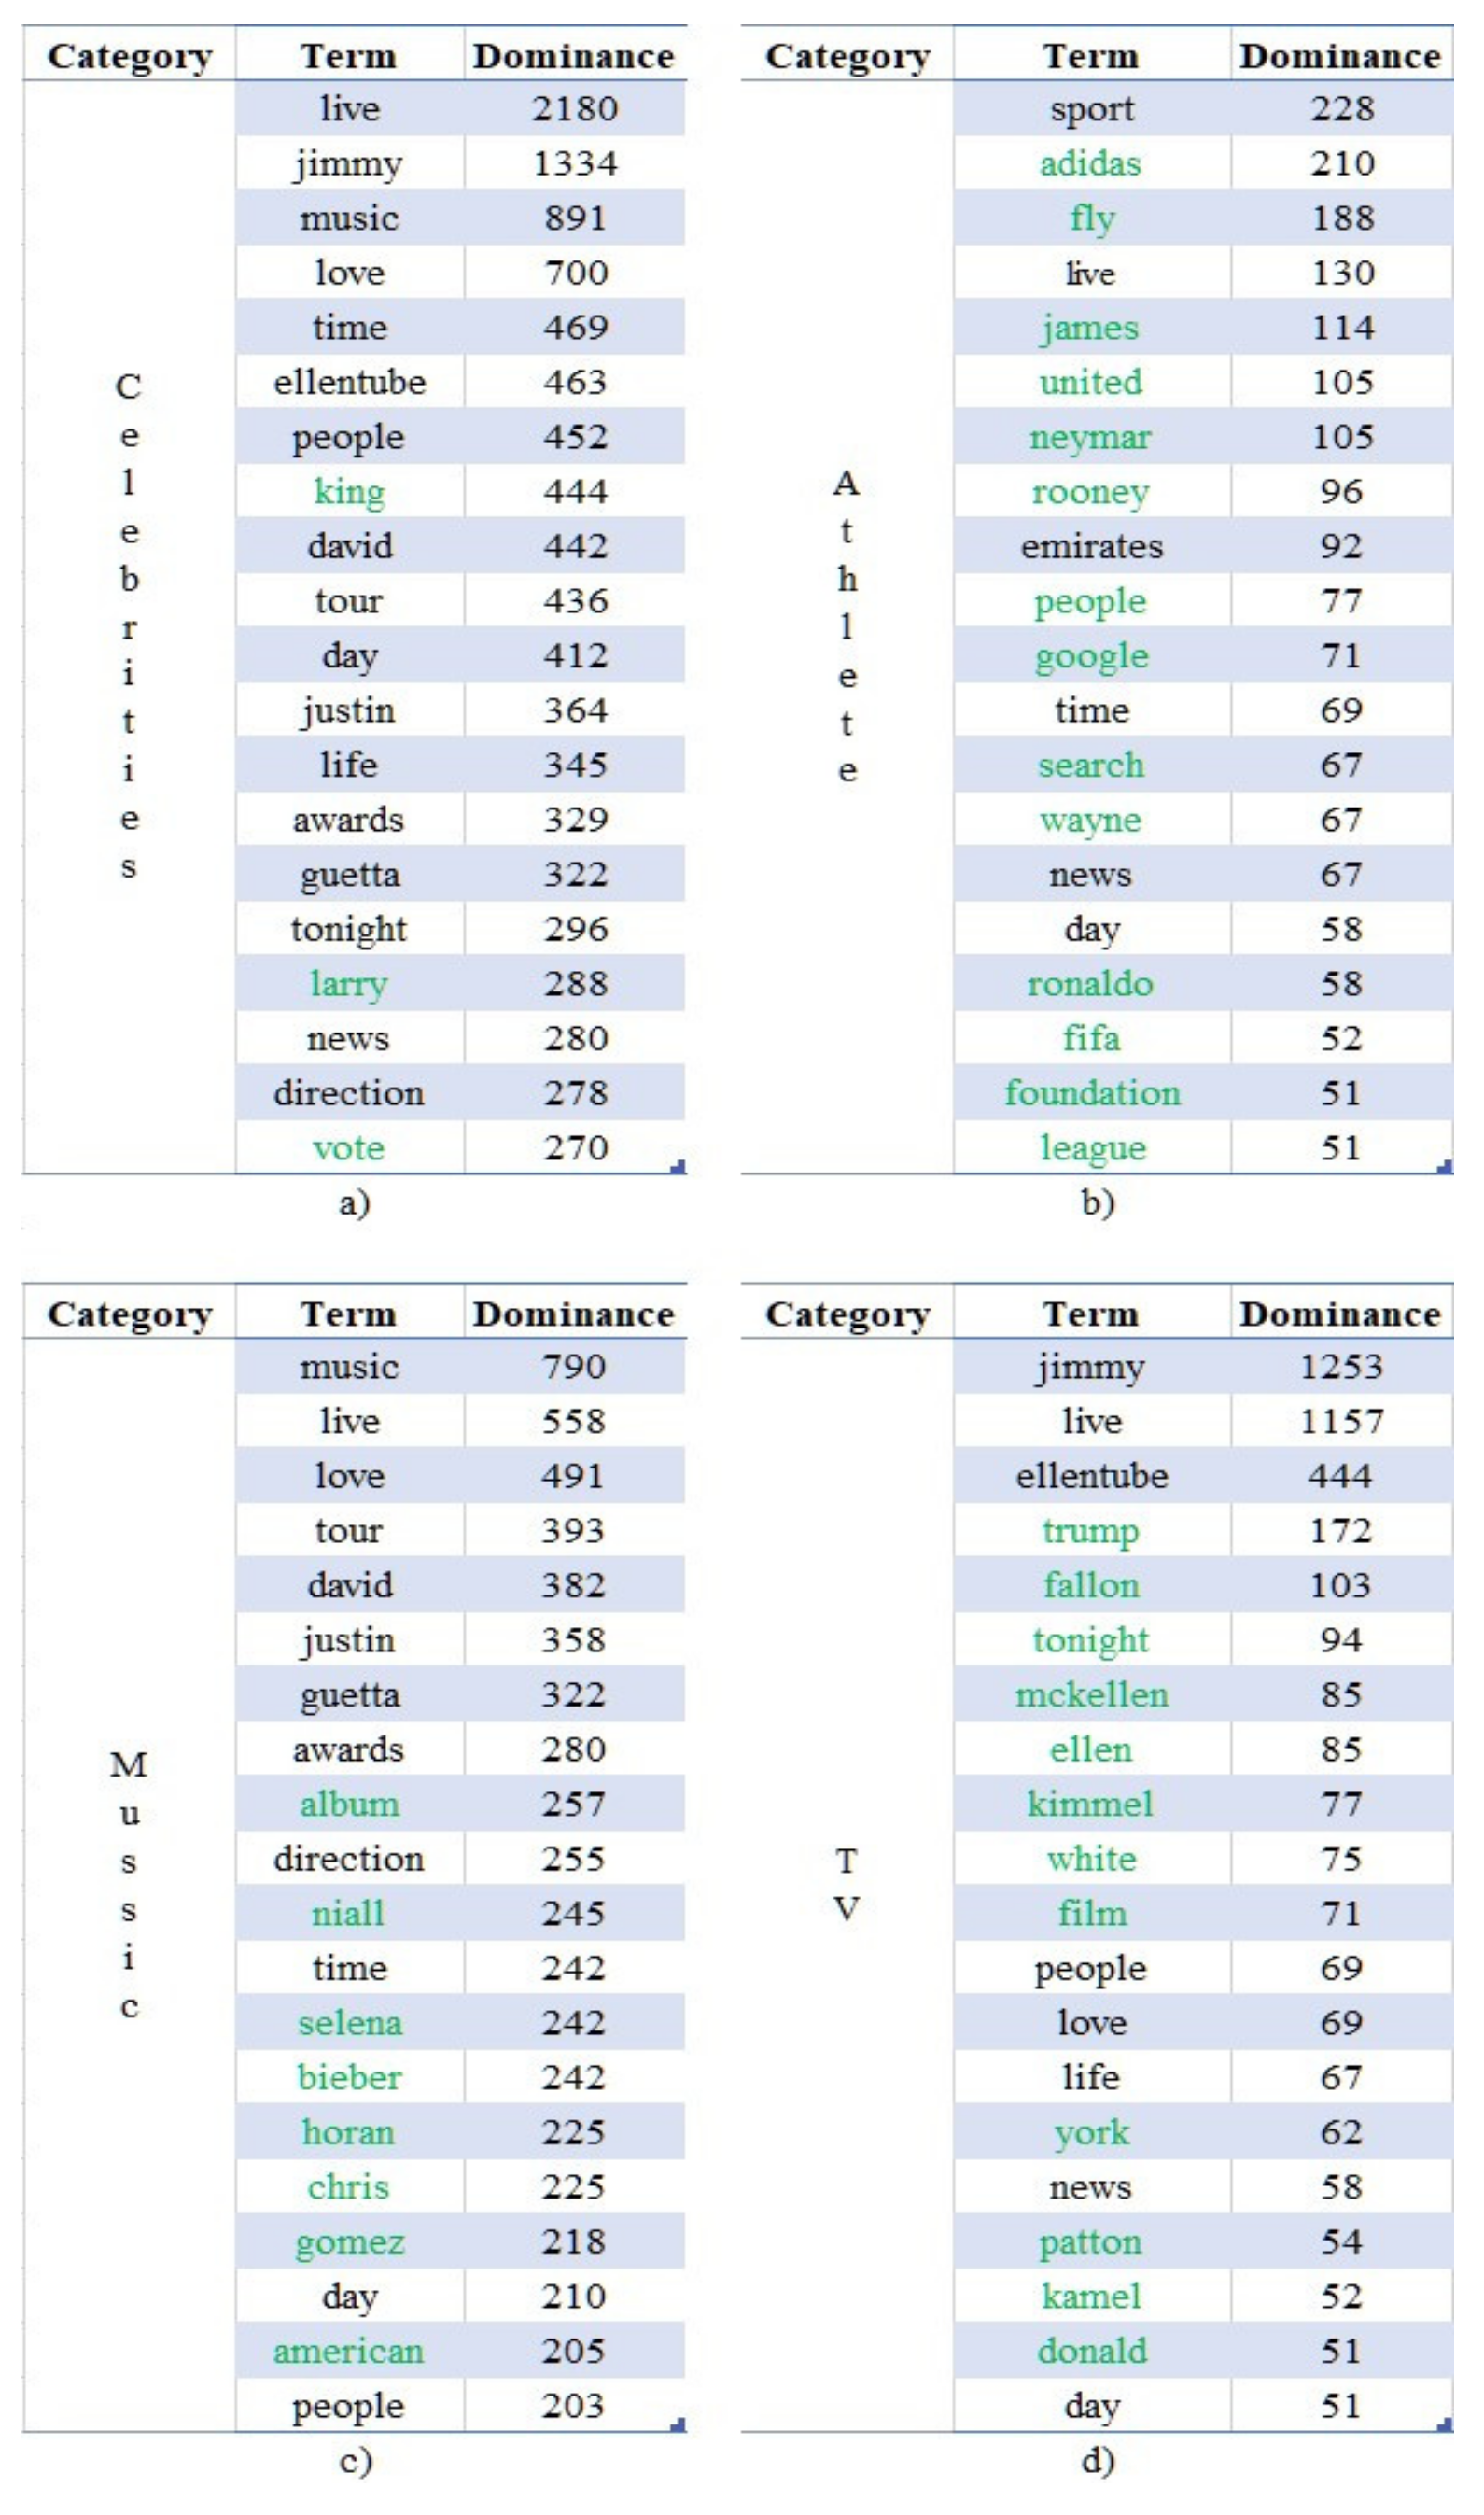
The top 20 terms of the extracted using OCR techniques text according to their corresponding values of “” are presented in Figure 8a–d. The investigation revealed that 53.8% of the most dominant terms (i.e., 43 out of 80) can also be found in other communities as well. The unique terms are highlighted in green. A thorough analysis on the other communities revealed the strong correlations of the dominant terms and the context of the analyzed communities. Indicative examples include the following cases:
- The terms “james”, “ronaldo”, “rooney” and “fifa”, which directly reference the famous athletes and the football federation respectively;
- The terms “bieber”, “guetta”, “gomez” and “awards”, which directly reference the surnames of three popular singers who participated in a music award show;
- The terms “tonight”, “jimmy” and “fallon”, which directly reference the “The Tonight Show” television show along with its presenter (Jimmy Fallon);
- The terms “sport”, “music” and “film” which accurately describe the context of the communities they were mostly used, namely, “Athlete”, “Music” and “TV” respectively.
Finally, the purely political terms “vote”, “donald” and “trump” appear in the communities of “Celebrities” and “TV”, but are seemingly not relevant to the overall context. However, the investigation of the images revealed that these communities ran campaigns via Twitter in order to urge the US citizens to vote in the imminent (during the data collection period) US elections of November 2020, while commenting mostly negatively against the active president Donald Trump. The interpretation of these findings is threefold:
- Firstly, social communities should not be regarded as static but rather as evolving structures acquiring new characteristics and behaviors compared to the expected ones, which can lead them to be further divided into smaller groups or also become members of others.
- Secondly, communities or individuals with high social authority and reach have the ability to influence their direct and indirect social peers deliberately or not.
- Thirdly, the dynamics of OSNs are continuously increasing and evolving, escaping from the narrow boundaries of typical interaction and information exchange, and can be used for mass misinformation and manipulation, as also mentioned in [28].
As in the case of the labels, an in-depth investigation of the text depicted in the images also unveiled the existence of patterns in the latent information of the social images of accounts belonging to broad or overlapping communities, thereby being capable of enriching the context of the social analytics.
5.3. Published Dataset
Recently, the domain of artificial intelligence has attracted much research and corporate interest, especially its ML domain. However, the development of efficient ML models requires a huge volume of data for training, testing, and validation purposes. Since these models rely on algorithms to actually learn the patterns of the input, the existence of qualitative datasets with abundances of data is crucial and fundamental.
As already mentioned, we published the dataset (https://0-www-doi-org.brum.beds.ac.uk/10.34740/kaggle/ds/732777) used in this study, which has been greatly extended compared to the one from our previous work [26]. We believe that it can prove valuable to our research community for a series of applications and tasks, such as the development of image or OSNs accounts multi-label classification models, the automatic generation of description for images, the fine-tuning of OCR systems, and the improvement of information retrieval or recommendation systems. The published dataset consists of a folder with the downloaded images, and a MySQL database export file containing all the information acquired from the Google Cloud Vision API, the Twitter accounts, their labels, images, and interconnections. Table 4 presents the details of the full dataset, a subset of which has been used for the purposes of the presented case studies.
6. Identifying Similar Images Using Latent Contextual Features
As described in Section 3, the Google Cloud Vision API has been employed for labeling Twitter images and extracting their depicted text using OCR techniques. As a result, OSN images are represented with textual information; thus, all document-based applications and frameworks can now be applied on this type of multimedia content, which was not possible before. As a second research direction of this study, we investigated the identification of similar images by evaluating their semantic similarity, relying on the aforementioned extracted contextual features.
Towards this aim, the Word2Vec [3,4] model was employed, relying on word embeddings, where real-valued vectors in a multi-dimensional space represent words. The encoded patterns of the vectors can be represented as linear functions, and the similarity scores can be calculated using the cosine similarity metrics of the terms’ vector values. It should be noted that the semantic similarity of two terms measures how similar their meanings are, despite their any syntactic differences (e.g., “dog” and “hound”). In our study, the pre-trained word-embedding model (https://code.google.com/p/word2vec/) of [4] was used. It was trained on a part of the Google News dataset of approximately 100 billion words. The resulting model contains the vectors of approximately three-million unique English words and phrases, in a 300-dimensional space.
Our investigation was based on 5000 images of our dataset, and three types of experiments were performed, one for each latent contextual type of information. Specifically, we considered the factors of (a) the extracted labels, transformed into a concatenated string sequence (the space character was inserted between each label), (b) the extracted via OCR text, and (c) the combination of the concatenated labels with the extracted text. Our aim was to evaluate the merits of each latent-type factor on the semantic similarity scores.
Each of these factors are provided as input to a Word2Vec function, for being represented into a single word-embedding vector. If a factor consists of more than one term, then the average value of the individual vectors of the terms is derived. Since all factors of the images are represented by their corresponding real-valued vectors, the cosine similarity metric can be employed for measuring the semantic similarities of the images. The similarity values produced by the employed Word2Vec model range from −1 to 1, where 1 is the highest value. Euclidean distance measures the magnitude of two points in a multi-dimensional space by considering the length of the straight line between them. Contrary, cosine similarity relies on the angle between two points with vertex at zero, thereby considering the directions of the vectors and not their magnitudes, and therefore is able to identify terms with opposing meanings. In this study, we are mostly interested in the orientations of the vectors; thus, cosine similarity is preferred in the domain of similarity identification. Assume that the interests of two users regarding books are represented by the vectors V1 and V2 respectively, and the function SIM(V1,V2) measures the similarity of their tastes; then:
- SIM(V1,V2) = 1: if the users have exactly the same interests (i.e., V1 = V2);
- SIM(V1,V2) = 0: if there is no correlation between the users’ interests (e.g., do not read any common books);
- SIM(V1,V2) = −1: if users have opposing interests (e.g., rated the same book in an opposite way).
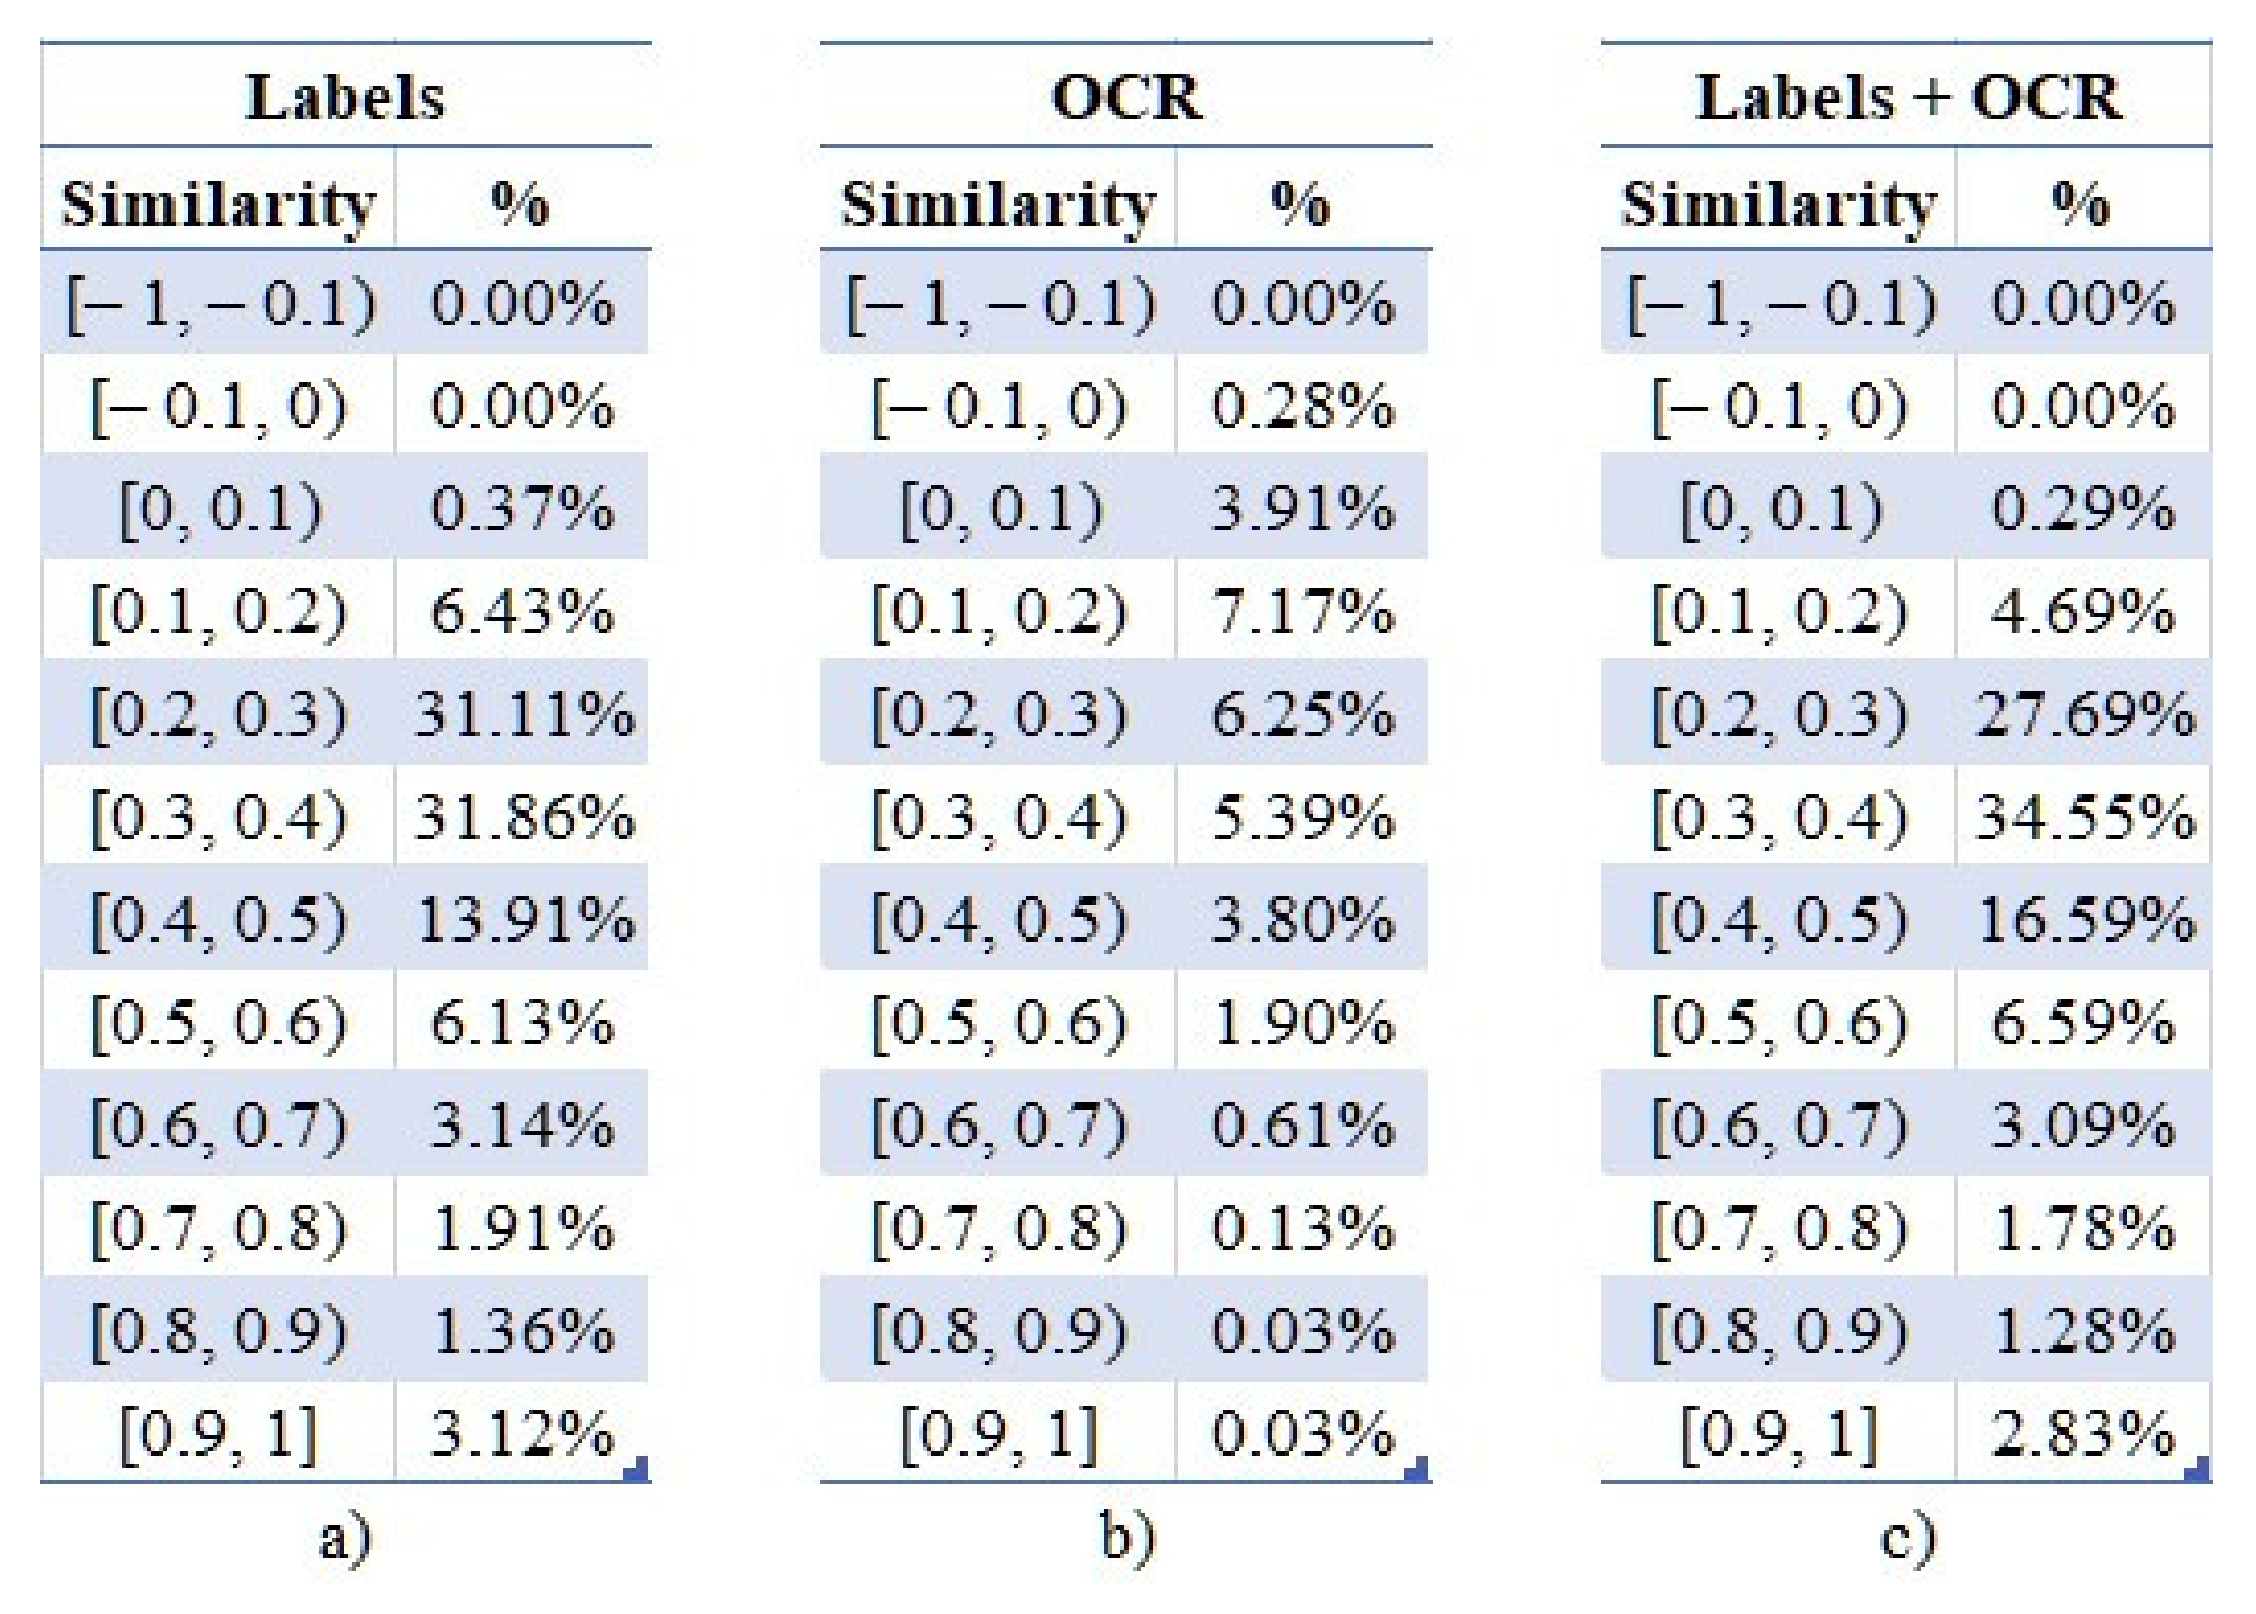
Using the cosine similarity, the vectors representing the latent textual information of an examined image are compared against the respective ones of the others. Consequently, a square similarity matrix of order N is created, where N is the number of the examined images, containing the derived similarity scores ranging from −1 to 1. In our case, 12,497,500 unique values were derived, namely, those above the main diagonal of the matrix. These values were then assigned to 20 groups ranging between [−1, 1], with an incremental step of 0.1, whose distributions are presented in Figure 9a–c.
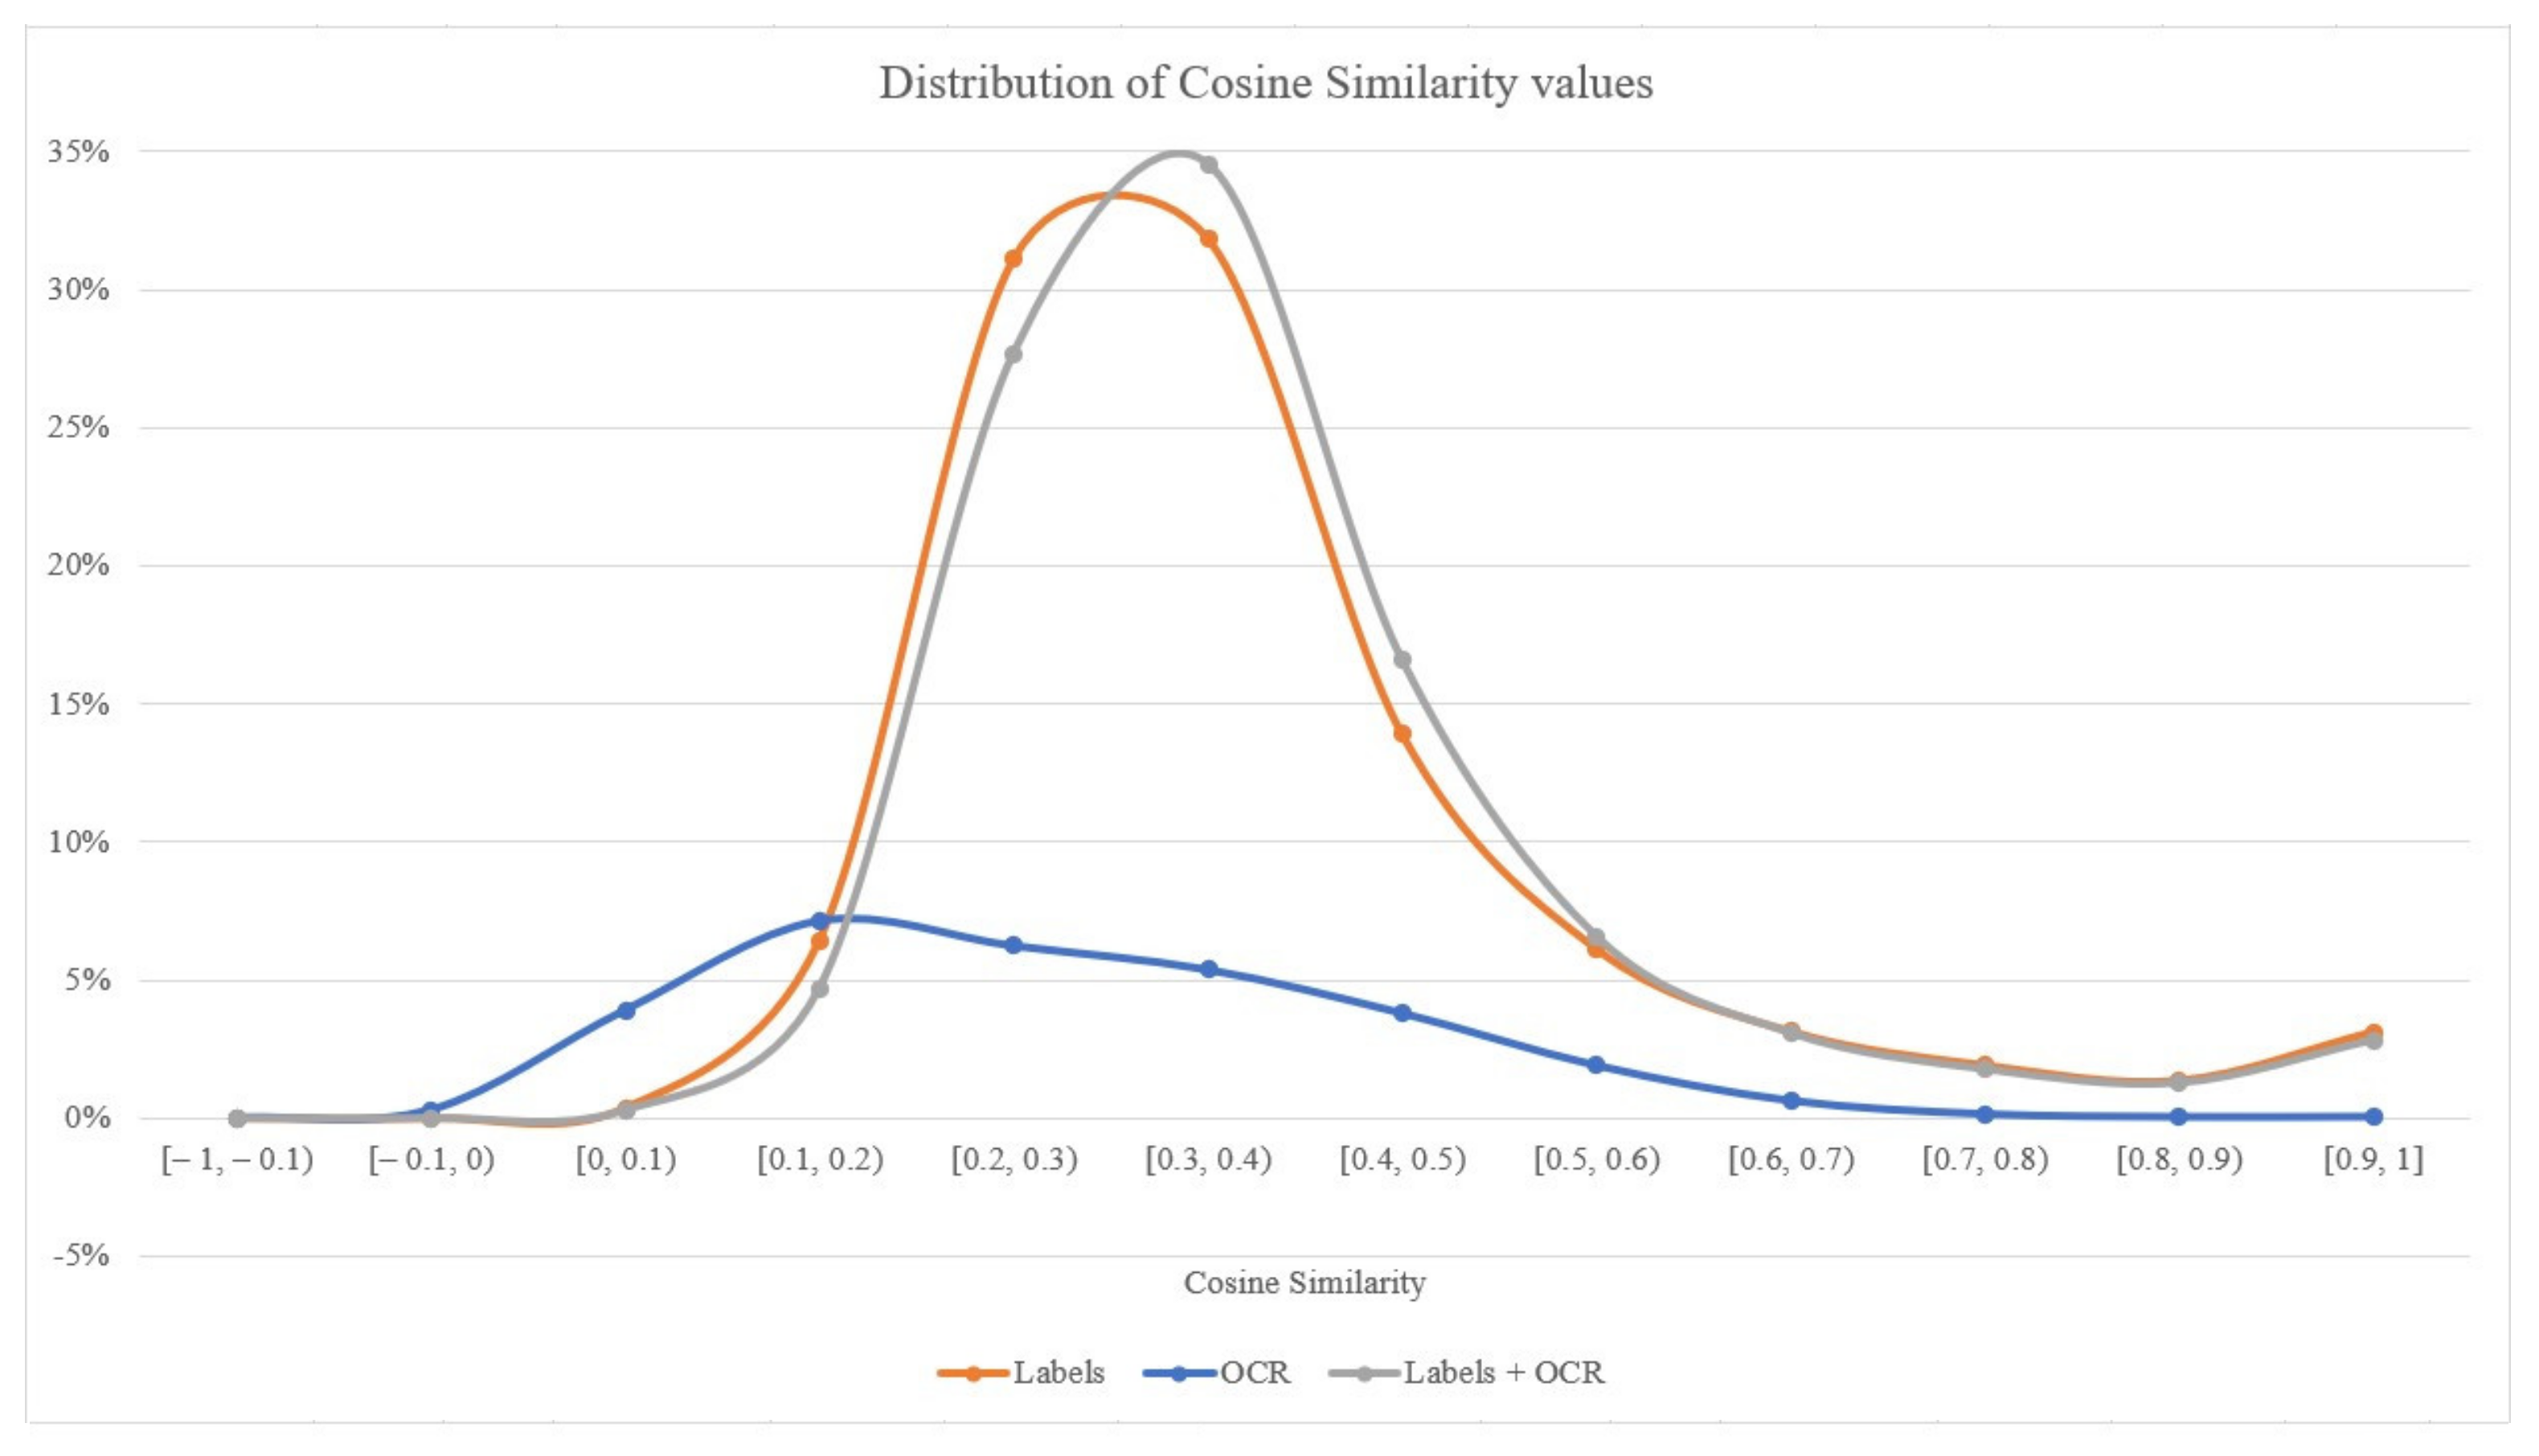
Two main observations can be derived from Figure 9. Firstly, only 30% of the text extracted using OCR techniques has been useful during this process, whereas in the cases of labels the percentage exceeds 99%. As the investigation revealed, misrecognized characters lead to erroneous terms that could not be transformed into vectors, since they do not exist in the pre-trained word embeddings model. Secondly, as also visible in the visual representation of the aforementioned distributions of Figure 10, the majority of images lie in the range of [0.1, 0.5], meaning that no correlations have been identified in the evaluated content. Typically, values of cosine similarity greater than 0.5 mean that the examined word vectors have similar meanings.
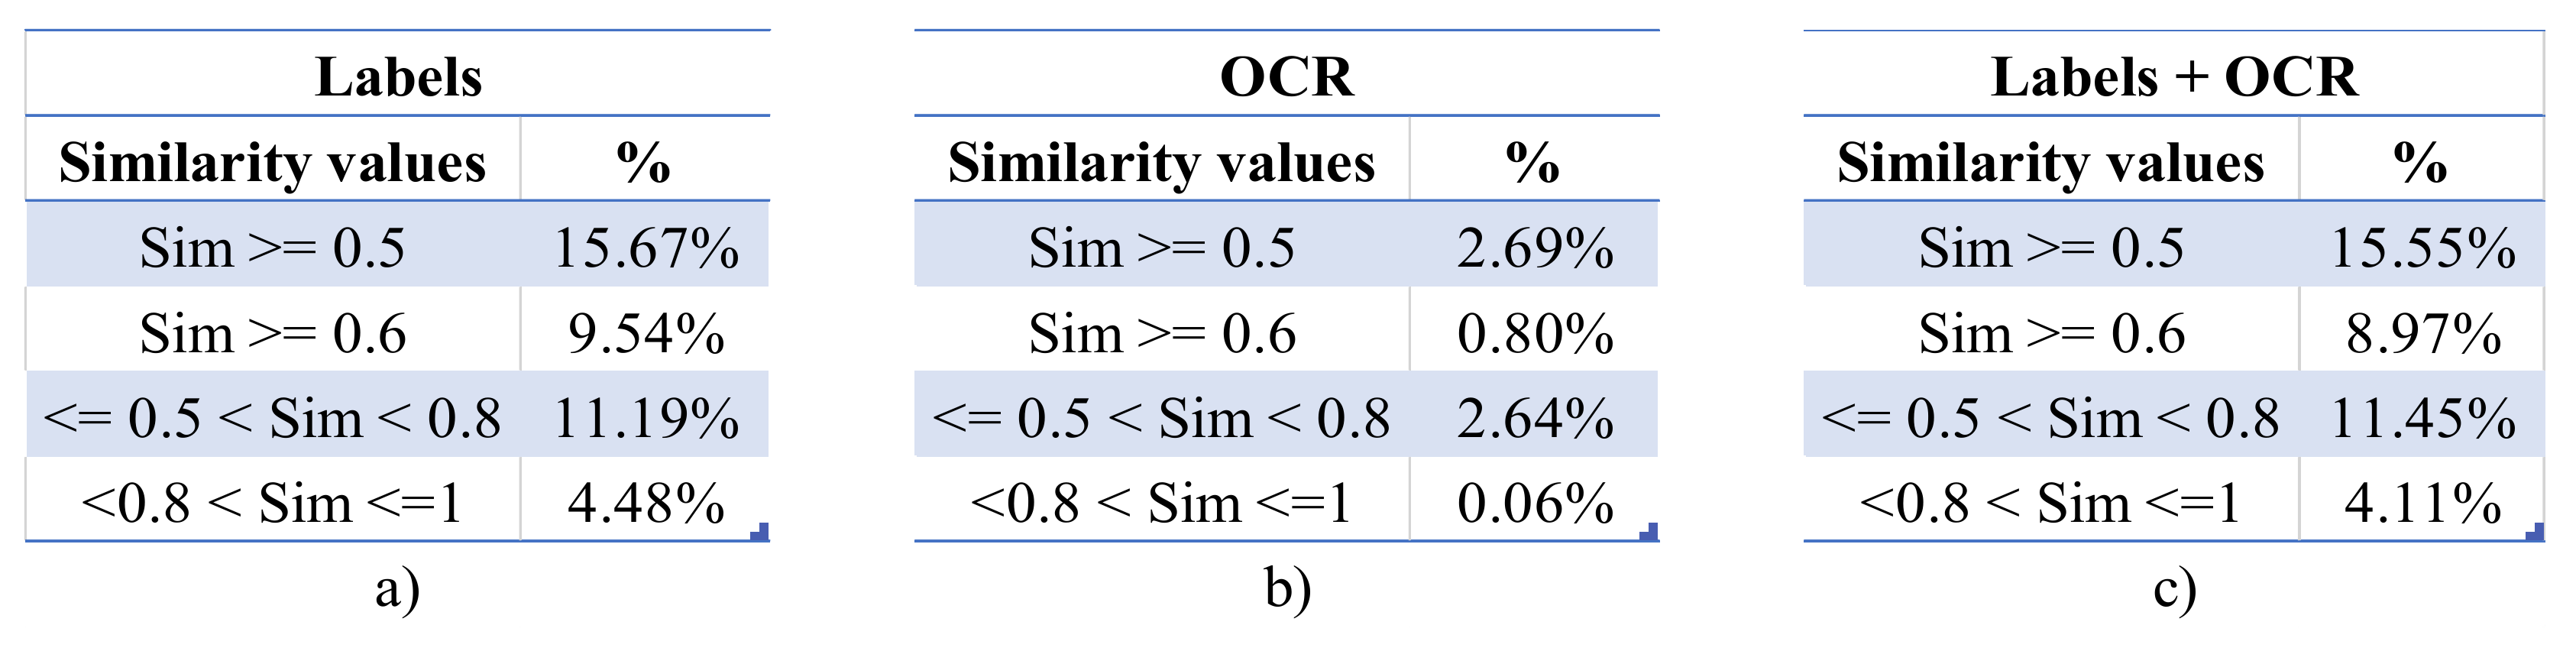
A more in-depth analysis of these values is presented in Figure 11a–c, where the distribution values of four groups are available. Specifically, the first two rows present the distributions of the similarity values greater than 0.5 and 0.6 respectively, and the last two the distribution values ranging between 0.5 and 0.8 (medium level similarity) and 0.8 and 1 (high level similarity) respectively.
As can be observed in Figure 11b, there are cases of the OCR-derived text wherein the value of the semantic similarity of images was negative, indicating the presence of slightly opposing opinions in the depicted content. Moreover, the OCR text by itself does not seem suitable for a similarity identification task, as only 2.64% of the images were identified as slightly similar, and a mere 0.06% as highly similar. Contrarily, the similarities derived from the usage of labels and their combinations with the OCR text led to greatly improved results, as seen in Figure 11a,c. Despite the distribution values being very close, the percentage of images having similarity values equal to or greater than 0.5 was approximately 7.7% higher in the case of labels only, and 6.3% higher when the values of 0.6 or more were evaluated. Similarly, 2.3% fewer medium similarity values (i.e., ranging between 0.5 and 0.8) appeared in the case of labels only, compared to the joint usage of labels and OCR text. Finally, 9% more OSN images were identified as highly similar (i.e., semantic similarity greater than 0.8) when only the labels were considered.
Our evaluation indicates that when OSN content is examined towards the identification of semantic similarities, the usage of labels only tends to generate the best results, despite the fact that the labels joint with the OCR text led to quite similar results. Thus, the semantic context of the OCR extracted text should not be ignored, as in other scenarios where more qualitative text can be extracted (e.g., captions in figures of scientific publications), its consideration could greatly improve this information retrieval task. One important remark is that the labels and the extracted text of the images were not stemmed, as stemming had a negative effect on the similarity results by approximately 20%.
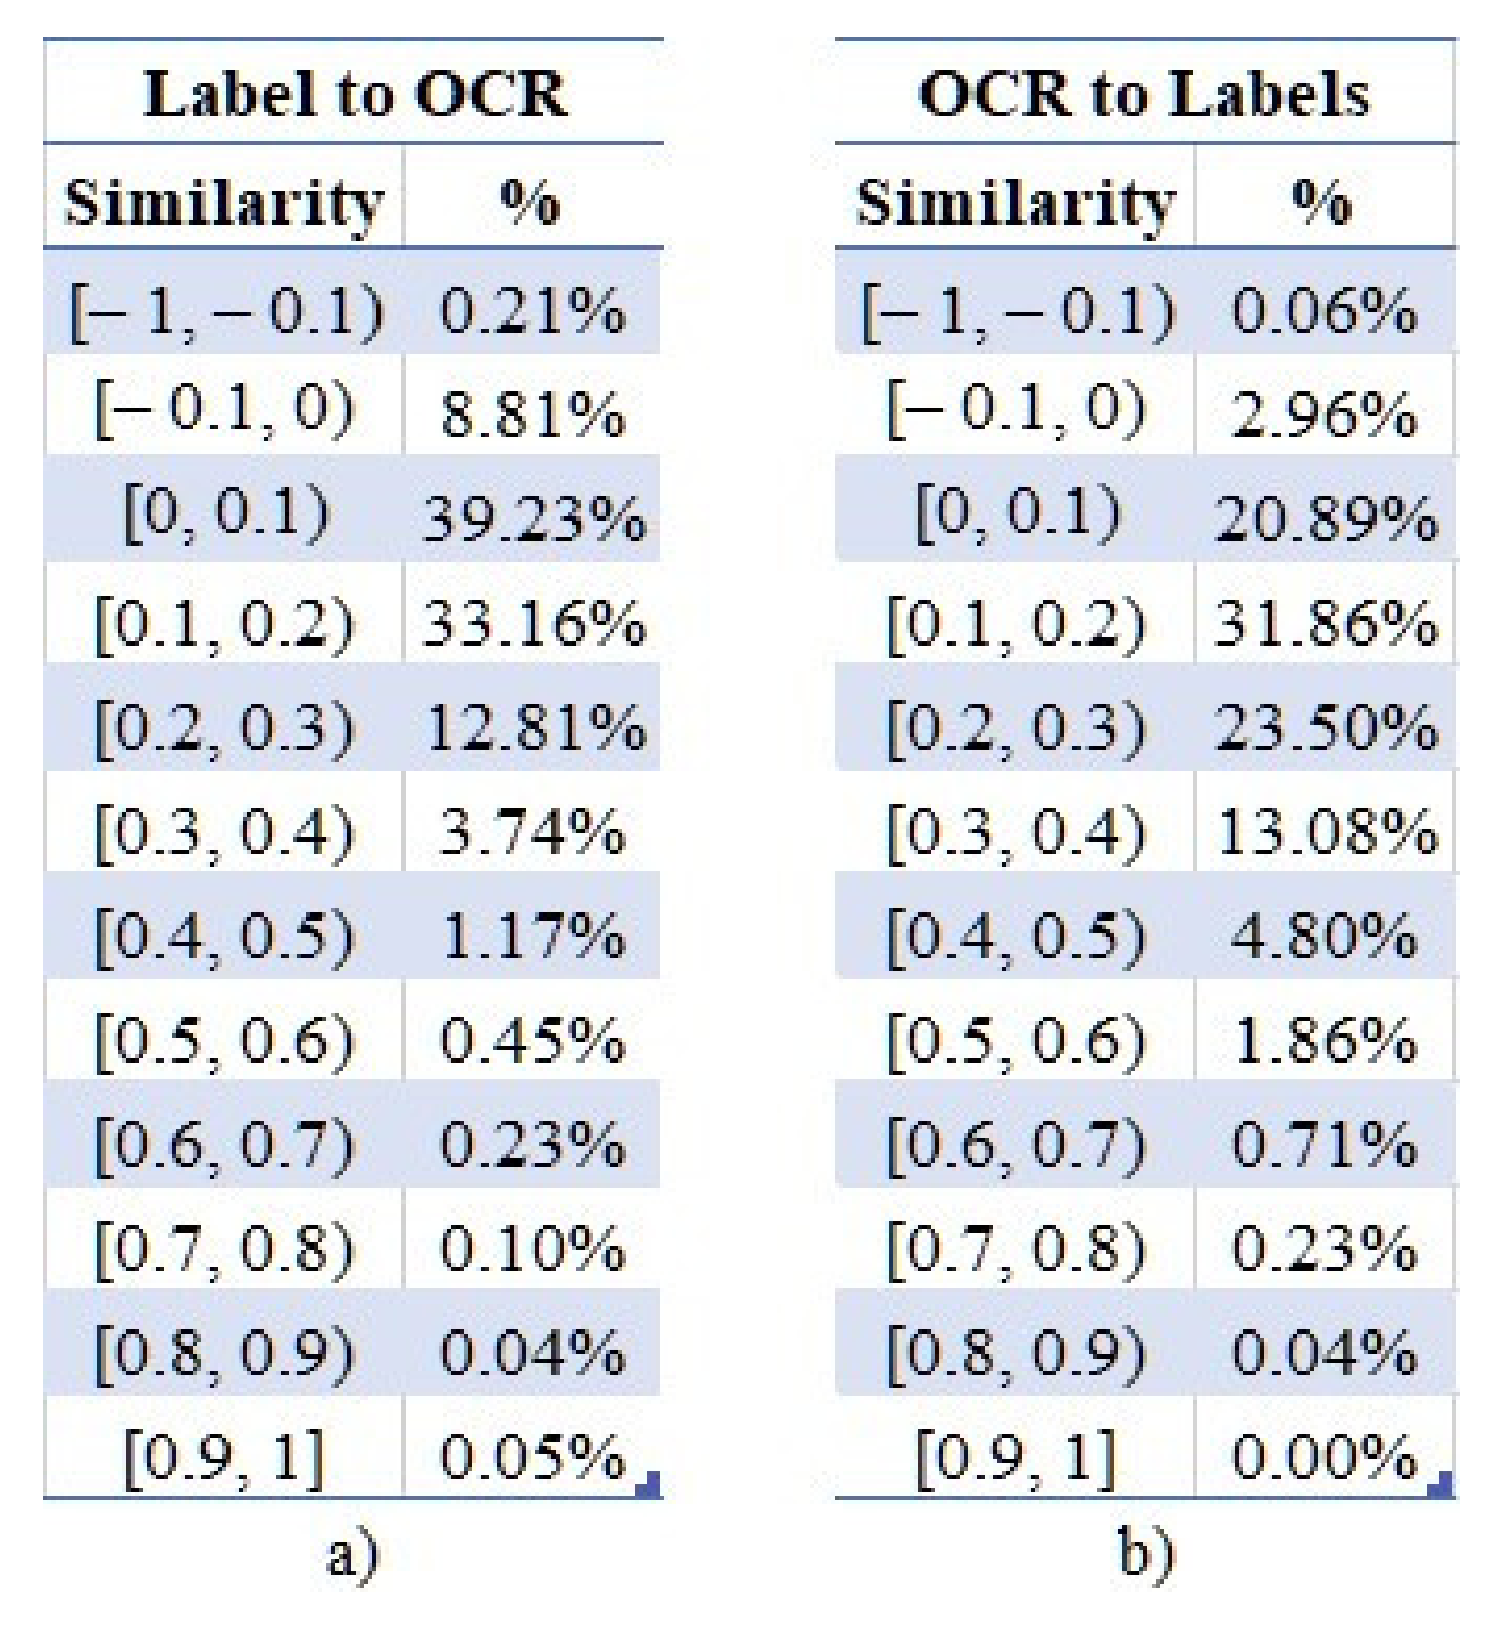
Finally, as in [6] where the authors examined the correlations between the disseminated posts and their accompanying images, we performed a similar analysis on the labels of an image and its OCR-derived text. Specifically, we wanted to investigate the correlations among these types of latent information and evaluate their degrees of complementarity. To this end, two types of semantic similarities were explored for each image in our dataset. Firstly, the similarity of each label to the OCR-derived text, and secondly the similarity of all labels, as a concatenated string sequence (the space character was inserted between each label), compared to the OCR-derived text. However, as presented in Figure 12a,b, the results indicate that the vast majority of the labels, the individual and the concatenated ones, do not correlate with the text. Specifically, less than 0.01% of the extracted OCR texts have a semantic similarity greater than 0.5 with the assigned individual labels (Figure 12a), and approximately 0.03% with the concatenated ones (Figure 12b).
Our experiment revealed that on the one hand, the text depicted in OSN images does not describe the represented entities, but rather provides information about a specific context. Such a case is Figure 2, where an abstract description of the image could be “a news report and people discussing it” (as also implied by the labels); however, the depicted text is in a different context, providing additional information about the interview and specifically about the effects of coronavirus in the USA. However, on the other hand, image classification systems tend to completely ignore the latent semantic information existing in the images, thereby relying entirely on their represented entities. Thus, the incorporation of these semantics could provide a more complete representation of an image.
7. Conclusions and Future Work
In this paper we proposed a framework which leverages the latent context of Twitter images deriving from the Google Cloud Vision API platform, aiming to enrich the social analytics with semantics and textual information. Furthermore, we employed OCR techniques in order to extract the text from these images. We made three contributions. Firstly, our in-depth investigation of the derived information unveiled useful insights regarding the existence of patterns in the latent context of the images which are disseminated by Twitter accounts belonging to the same or overlapping communities. The conducted case studies revealed that user-generated content, linked data, along with the latent concepts and textual information retrieved from the images, can enrich the social analytics task, revealing valuable information which was until now disregarded.
Secondly, our evaluation indicates that when OSN images are examined towards the identification of semantic similarities, the usage of latent labels tends to generate the best results, despite the fact that the labels joined with the OCR text led to quite similar results. Thus, we suggest that the semantic context of the OCR extracted text should not be ignored, as in other scenarios where more qualitative text can be extracted (e.g., captions in figures of scientific publications), its consideration could greatly improve this information retrieval task.
Thirdly, we published the annotated dataset (https://0-www-doi-org.brum.beds.ac.uk/10.34740/kaggle/ds/732777) derived from our study with the aim of providing usefulness to our research field and community for further use and evaluation. Since the development of efficient ML models requires a sufficient volume of data, this extended dataset could prove valuable for a series of classification, information retrieval, or recommendation tasks.
Compared to the related literature, our study differentiates itself in two important aspects. Firstly, our proposed framework is based on all types of latent contextual features of Twitter images (i.e., labels and OCR-derived text), rather than a subset of them (i.e., labels). Our analysis revealed that the overwhelming majority of the images disseminated in OSNs depict text, and our experimental results on social communities (Section 5) revealed the dynamics of such latent information, which should not be ignored any longer. Secondly, since the latent context and depicted text of Twitter images are represented by textual information, all document-based applications can now be applied to this type of multimedia content. Therefore, we evaluated the merits of this latent textual and semantic information towards the identification of images with similar semantic content, for further improving image searching, retrieval, and recommendation tasks.
Moreover, by further analyzing the text which was extracted from the disseminated social images of members of seemingly distinct communities, we derived to the following findings:
- Over the course of time, social communities should be regarded as evolving structures in terms of their size, attributes, and behavior, which can lead them to be further divided into smaller groups or also participate in others;
- Communities or individuals with high social authority have the ability to influence their direct and indirect social peers deliberately or not;
- OSNs are a powerful means of information spread whose dynamics constantly increase and evolve, escaping from the narrow boundaries of typical interaction, and can be used for mass misinformation and manipulation, as also mentioned in [28].
The layered architecture of our service (Section 3.1) makes our methodology extensible by design to all types of commercial or research image classification and analysis services. Consequently, our proposed framework can be enhanced with the incorporation of Microsoft Azure Computer Vision (https://azure.microsoft.com/en-us/services/cognitive-services/computer-vision/) along with the existing Google Cloud Vision API (https://cloud.google.com/vision/), leading to an ensemble method towards the classification and analysis of social images. Multiple services should be able to analyze the social images providing the weighted labels and the depicted text. The derived information should be properly combined and can then be used in order for the proposed dominance metric values to be calculated for each latent information type. Apparently, the adoption of a different image analysis platform (or a combination of services via an ensemble scheme) would affect the results (in terms of labels’ appearances and weights); however, the application of our methodology would still be able to identify the most representative latent image information (i.e., labels and OCR-derived terms).
The added value of our study compared to the related literature can be summarized as follows. Firstly, two types of latent textual information in images are considered—the labels (i.e., semantic tags) providing the represented entities or concepts, and the actual depicted text. Our evaluation revealed that both types of latent information result in valuable insights regarding the patterns of the user-generated content disseminated by accounts of broad or overlapping communities. Secondly, the existence of semantics, both on social content and OSN account level, can be utilized for further improving tasks relevant to the analysis of behavioral patterns, identification of similar accounts, community detection, and enhancement of interest profiles. Thirdly, we investigated the identification of similar images by evaluating their semantic similarity, relying on the aforementioned latent contextual features. Specifically, the Word2Vec word embedding model was employed for transforming the text into vectors, thereby enabling us to calculate the cosine similarity of any textual information. Finally, we investigated the correlation of the two types of latent information and evaluated their degree of complementarity.
In the future, we plan to rely on the results of this study in order to enhance the methodologies proposed in our previous works [5,29]. The first one, already used as the basis for this study, involved the enrichment of Twitter accounts with thematic categories deriving from DBpedia, and the second one the identification of similar accounts based on their shared Twitter entities (e.g., mentions, URLs, hashtags). The incorporation of additional information derived from the latent contexts of their disseminated images would further improve the efficiency of these methodologies and could be transformed into a Twitter account follower recommendation system (i.e., “who to follow”). Moreover, our latent contextual-based semantic similarity image identifier could be adapted into a content recommendation system where relevant Twitter images and posts are suggested to users, based on their disseminated content. To this end, the latest data of the interested users should be considered, and due to the vast volume of the candidate social data, suitable big data techniques should be applied. Consequently, the similarities among the images should not be calculated as presented in this study (since big data analytics was outside of our research scope), but by employing scalable techniques, such as locality-sensitive hashing. Finally, we intend to analyze the extracted OCR text to a greater extent, in order to identify the mentioned entities or concepts and interconnect them with established knowledge bases (e.g., DBpedia and Wikidata), for enhancing the representational quality of the individual Twitter accounts and communities.
Author Contributions
Conceptualization, G.R. and I.A.; methodology, G.R.; software, G.T.; validation, G.R. and I.A.; formal analysis, G.R.; investigation, G.R.; resources, G.T.; data curation, G.T.; writing—original draft preparation, G.R.; writing—review and editing, I.A.; visualization, G.R.; supervision, I.A. All authors have read and agreed to the published version of the manuscript.
Funding
This research received no external funding.
Institutional Review Board Statement
Not applicable.
Informed Consent Statement
Not applicable.
Data Availability Statement
Data available in a publicly accessible repository (The data presented in this study are openly available in Kaggle at https://0-www-doi-org.brum.beds.ac.uk/10.34740/kaggle/ds/732777, reference number 732777).
Conflicts of Interest
The authors declare no conflict of interest.
References
- Lee, K. How to Tweet—New research on what drives engagement, Buffer. 2016. Available online: https://buffer.com/resources/twitter-data-1-million-tweets (accessed on 21 November 2020).
- Vempala, A.; Preoţiuc-Pietro, D. Categorizing and Inferring the Relationship between the Text and Image of Twitter Posts. In Proceedings of the 57th Annual Meeting of the Association for Computational Linguistics, Florence, Italy, 28 July–2 August 2019; pp. 2830–2840. [Google Scholar] [CrossRef]
- Mikolov, T.; Sutskever, I.; Chen, K.; Corrado, G.S.; Dean, J. Efficient estimation of word representations in vector space. arXiv 2013, arXiv:1301.3781002E. [Google Scholar]
- Mikolov, T.; Sutskever, I.; Chen, K.; Corrado, G.; Dean, J. Distributed Representations of Words and Phrases and their Compositionality. In Proceedings of the 26th International Conference on Neural Information Processing Systems—Volume 2 (NIPS ‘13); Curran Associates Inc.: Red Hook, NY, USA, 2013; pp. 3111–3119. [Google Scholar]
- Razis, G.; Anagnostopoulos, I.; Saloun, P. Thematic Labeling of Twitter Accounts using DBpedia Properties. In Proceedings of the 11th International Workshop on Semantic and Social Media Adaptation and Personalization (SMAP), Thessaloniki, Greece, 20–21 October 2016; pp. 106–111. [Google Scholar] [CrossRef]
- Chen, T.; Lu, D.; Kan, M.-Y.; Cui, P. Understanding and Classifying Image Tweets. In Proceedings of the 21st ACM International Conference on Multimedia (MM ’13); Association for Computing Machinery: New York, NY, USA, 2013; pp. 781–784. [Google Scholar] [CrossRef] [Green Version]
- Ferwerda, B.; Tkalcic, M. Predicting Users’ Personality from Instagram Pictures: Using Visual and/or Content Features? In Proceedings of the 26th Conference on User Modeling, Adaptation and Personalization (UMAP ’18); Association for Computing Machinery: New York, NY, USA, 2018; pp. 157–161. [Google Scholar] [CrossRef] [Green Version]
- Alfarrarjeh, A.; Agrawal, S.; Kim, S.H.; Shahabi, C. Geo-Spatial Multimedia Sentiment Analysis in Disasters. In Proceedings of the 2017 IEEE International Conference on Data Science and Advanced Analytics (DSAA), Tokyo, Japan, 19–21 October 2017; pp. 193–202. [Google Scholar] [CrossRef]
- Zannettou, S.; Caulfield, T.; Bradlyn, B.; Cristofaro, E.D.; Stringhini, G.; Blackburn, J. Characterizing the Use of Images in State-Sponsored Information Warfare Operations by Russian Trolls on Twitter. In Proceedings of the 14th International AAAI Conference on Web and Social Media (ICWSM 2020); AAAI Press: Palo Alto, CA, USA, 2020; pp. 774–785. [Google Scholar]
- Boselli, R.; Cesarini, M.; Mercorio, F.; Mezzanzanica, M.; Vaccarino, A. A Pipeline for Multimedia Twitter Analysis through Graph Databases: Preliminary Results. In Proceedings of the 6th International Conference on Data Science, Technology and Applications (DATA), Madrid, Spain, 24–26 July 2017; pp. 343–349. [Google Scholar] [CrossRef]
- Noaeen, M.; Far, B.H. Social Media Analysis for Traffic Management. In Proceedings of the 14th International Conference on Global Software Engineering (ICGSE ’19); IEEE Press: Piscataway, NJ, USA, 2019; pp. 72–73. [Google Scholar] [CrossRef]
- O’Neal, A.; Rodgers, B.; Segler, J.; Murthy, D.; Lakuduva, N.; Johnson, M.; Stephens, K.K. Training an Emergency-Response Image Classifier on Signal Data. 17th IEEE International Conference on Machine Learning and Applications (ICMLA). Orlando, FL, USA, 17–20 December 2018; pp. 751–756. [Google Scholar] [CrossRef]
- Sakai, T.; Tamura, K.; Kitakami, H.; Takezawa, T. Photo Image Classification using Pre-trained Deep Network for Density-based Spatiotemporal Analysis System. In Proceedings of the 2017 IEEE 10th International Workshop on Computational Intelligence and Applications (IWCIA), Hiroshima, Japan, 11–12 November 2017; pp. 207–212. [Google Scholar] [CrossRef]
- Sakaki, S.; Miura, Y.; Ma, X.; Hattori, K.; Ohkuma, T. Twitter User Gender Inference Using Combined Analysis of Text and Image Processing. In Proceedings of the Third Workshop on Vision and Language, Dublin, Ireland, 23 July 2014; pp. 54–61. [Google Scholar] [CrossRef]
- Hoai, N.T.T.; Quang, L.T.N. Twitter Sentiment Analysis with word2vec. Int. J. Adv. Res. Comput. Eng. Technol. 2019, 8, 108–112. [Google Scholar]
- Li, Q.; Shah, S.; Liu, X.; Nourbakhsh, A. Data Sets: Word Embeddings Learned from Tweets and General Data. In Proceedings of the Eleventh International Conference on Web and Social Media (ICWSM 2017), Montréal, QC, Canada, 15–18 May 2017; AAAI Press: Palo Alto, CA, USA, 2017; pp. 428–429, ISBN 978-1-57735-788-9. [Google Scholar]
- Arias, C.F.; Zúñiga, J.; Sidorov, G.; Batyrshin, I.Z.; Gelbukh, A.F. A Tweets Classifier based on Cosine Similarity. Working Notes of CLEF 2017—Conference and Labs of the Evaluation Forum, Dublin, Ireland, 11–14 September 2017; Volume 1866. [Google Scholar]
- Jang, B.; Kim, I.; Kim, J.W. Word2vec convolutional neural networks for classification of news articles and tweets. PLoS ONE 2019, 14, e0220976. [Google Scholar] [CrossRef] [PubMed] [Green Version]
- Ben-Lhachemi, A.N.; Nfaoui, E.H. Using Tweets Embeddings for Hashtag Recommendation in Twitter. Procedia Comput. Sci. 2018, 127, 7–15. [Google Scholar] [CrossRef]
- Chengzhang, X.; Dan, L. Chinese Text Summarization Algorithm Based on Word2vec. J. Phys. Conf. Ser. 2018, 976, 012006. [Google Scholar] [CrossRef] [Green Version]
- Orkpho, K.; Yang, W. Word Sense Disambiguation Using Cosine Similarity Collaborates with Word2vec and WordNet. Future Internet 2019, 11, 114. [Google Scholar] [CrossRef] [Green Version]
- Jatnika, D.; Bijaksana, M.A.; Suryani, A.A. Word2Vec Model Analysis for Semantic Similarities in English Words. Procedia Comput. Sci. 2019, 157, 160–167. [Google Scholar] [CrossRef]
- Kim, J.; Hong, T.; Kim, P. Word2Vec based Spelling Correction Method of Twitter Message. Proceedings of 34th ACM/SIGAPP Symposium on Applied Computing (SAC ‘19), Limassol, Cyprus, 8–12 April 2019; pp. 2016–2019. [Google Scholar] [CrossRef]
- Yu, D.; Wu, Y.; Sun, J.; Ni, Z.; Li, Y.; Wu, Q.; Chen, X. Mining Hidden Interests from Twitter Based on Word Similarity and Social Relationship for OLAP. Int. J. Soft. Eng. Knowl. Eng. 2017, 27, 1567–1578. [Google Scholar] [CrossRef]
- Vargas-Calderón, V.; Camargo, J.E. Characterization of citizens using word2vec and latent topic analysis in a large set of tweets. Cities 2019, 92, 187–196. [Google Scholar] [CrossRef] [Green Version]
- Razis, G.; Theofilou, G.; Anagnostopoulos, I. Enriching Social Analytics with Latent Twitter Image Information. In Proceedings of the 15th International Workshop on Semantic and Social Media Adaptation and Personalization (SMAP), Zakynthos, Greece, 29–30 October 2020; pp. 1–7. [Google Scholar] [CrossRef]
- Razis, G.; Anagnostopoulos, I. Semantifying Twitter: The Influence Tracker Ontology. In Proceedings of the 9th International Workshop on Semantic and Social Media Adaptation and Personalization (SMAP), Corfu, Greece, 6–7 November 2014; pp. 98–103. [Google Scholar] [CrossRef] [Green Version]
- Ferrara, E.; Cresci, S.; Luceri, L. Misinformation, manipulation, and abuse on social media in the era of COVID-19. J. Comput. Soc. Sci. 2020, 3, 271–277. [Google Scholar] [CrossRef] [PubMed]
- Razis, G.; Anagnostopoulos, I. Discovering similar Twitter accounts using semantics. Eng. Appl. Artif. Intell. 2016, 51, 37–49. [Google Scholar] [CrossRef] [Green Version]
Figure 1.
The three-layered architecture of our proposed framework.

Figure 2.
A Twitter image with its optical character recognition (OCR) bounding boxes, as analyzed by Google Cloud Vision API.
Figure 2.
A Twitter image with its optical character recognition (OCR) bounding boxes, as analyzed by Google Cloud Vision API.

Figure 3.
The top 5 labels of Figure 2 assigned by Google Cloud Vision API.
Figure 3.
The top 5 labels of Figure 2 assigned by Google Cloud Vision API.

Figure 4.
The extracted text of Figure 2 recognized by Google Cloud Vision API.
Figure 4.
The extracted text of Figure 2 recognized by Google Cloud Vision API.

Figure 5.
The top 15 dominant labels (a–d) per community of accounts.

Figure 6.
The top 20 dominant OCR terms (a–d) per community of accounts.

Figure 7.
The top 15 dominant labels (a–d) per community of accounts.

Figure 8.
The top 20 dominant OCR terms (a–d) per community of accounts.

Figure 9.
The distribution of cosine similarity values (a–c) per type of latent context.

Figure 10.
A visual representation of the distribution of cosine similarity values per type of latent context.
Figure 10.
A visual representation of the distribution of cosine similarity values per type of latent context.

Figure 11.
The distribution of cosine similarity values (a–c) per type of latent context.

Figure 12.
The distribution of cosine similarity values (a,b) per type of correlation.


Table 1.
Thematic categories of Twitter accounts.
| Thematic Categories | Origin | |||
|---|---|---|---|---|
| Artist | Athlete | Basketball | Center | DBpedia |
| Center Left | Center Right | Economics | Far Right | |
| Journalist | Left Wing | Music | Political Party | |
| Politics | Press | Racing | Service | |
| Soccer | Place | Tennis | TV | |
| Celebrity | Right Wing | IT | ||
| Openness | ||||
Table 2.
Politics dataset overview.
| Entity | Counter |
|---|---|
| Images (Occurrences) | 39,499 (40,585) |
| Unique Vision API Labels | 4059 |
| Labels per Image | 7.6 |
| Images with text | 26,953 (68.2%) |
| Unique OCR terms | 188,077 |
| OCR terms per Image | 16.9 |
| Twitter Accounts | 130 |
| Twitter Account Labels | 12 |
| Images per Twitter Account | 312.2 |
Table 3.
Celebrities dataset overview.
| Entity | Counter |
|---|---|
| Images (Occurrences) | 22,331 (22,393) |
| Unique Vision API Labels | 3790 |
| Labels per Image | 8.2 |
| Images with text | 13,138 (58.8%) |
| Unique OCR terms | 46,243 |
| OCR terms per Image | 6.8 |
| Twitter accounts | 54 |
| Twitter account Labels | 10 |
| Images per Twitter Account | 414.7 |
Table 4.
Full dataset overview.
| Entity | Counter |
|---|---|
| Images (Occurrences) | 94,745 (95,946) |
| Unique Vision API Labels | 7098 |
| Labels per Image | 7.8 |
| Images with text | 58,899 (62.2%) |
| Unique OCR terms | 309,014 |
| OCR terms per Image | 13.6 |
| Twitter accounts | 197 |
| Twitter account Labels | 23 |
Publisher’s Note: MDPI stays neutral with regard to jurisdictional claims in published maps and institutional affiliations. |
© 2021 by the authors. Licensee MDPI, Basel, Switzerland. This article is an open access article distributed under the terms and conditions of the Creative Commons Attribution (CC BY) license (http://creativecommons.org/licenses/by/4.0/).
Share and Cite
MDPI and ACS Style
Razis, G.; Theofilou, G.; Anagnostopoulos, I. Latent Twitter Image Information for Social Analytics. Information 2021, 12, 49. https://0-doi-org.brum.beds.ac.uk/10.3390/info12020049
AMA Style
Razis G, Theofilou G, Anagnostopoulos I. Latent Twitter Image Information for Social Analytics. Information. 2021; 12(2):49. https://0-doi-org.brum.beds.ac.uk/10.3390/info12020049
Chicago/Turabian StyleRazis, Gerasimos, Georgios Theofilou, and Ioannis Anagnostopoulos. 2021. "Latent Twitter Image Information for Social Analytics" Information 12, no. 2: 49. https://0-doi-org.brum.beds.ac.uk/10.3390/info12020049
Note that from the first issue of 2016, this journal uses article numbers instead of page numbers. See further details here.