
Online Consumers’ Brain Activities When Purchasing Second-Hand versus New Products That Are Brand-Name or Brand-Less


1
Department of Computer Science (Joint Appointment in Department of Education), National Chengchi University, Taipei City 11605, Taiwan
2
Department of Information Management, National Cheng Kung University, Tainan City 70101, Taiwan
*
Author to whom correspondence should be addressed.
Information 2021, 12(2), 56; https://0-doi-org.brum.beds.ac.uk/10.3390/info12020056
Submission received: 4 December 2020
/
Revised: 19 January 2021
/
Accepted: 22 January 2021
/
Published: 26 January 2021
(This article belongs to the Special Issue Data Analytics and Consumer Behavior)
Abstract
:It is now common to apply functional magnetic resonance imaging to explore which areas of the human brain are activated during the decision-making process. In the study of consumer behaviors, product brand has been identified as a major factor affecting consumer purchase decisions. Prior studies indicate that the brand had a significant impact on brain activation. However, it is unsure if consumers’ brain activation is also significant when purchasing brand-name second-hand products (SHPs). Therefore, the purpose of this study is to verify the areas of brain neuron activation in the context of online auctions among consumers whose purchasing decisions are affected by an SHP’s brand. The results show that a brain region (i.e., the medial prefrontal cortex) activates significantly when comparing the purchasing decision-making process between new items and SHPs. The activation of the insula is also found when an SHP purchasing decision is made. In addition, the dorsolateral prefrontal cortex is activated significantly when purchasing brand-name SHPs. However, due to consumers’ preferences for different brands, there is no significant activation in the ventromedial prefrontal cortex.
1. Introduction
The earliest web-based commercial auctions began in 1995 on platforms such as Onsale and eBay. These auctions were the first to take advantage of the technologies offered by the Web, including the use of automated bids entered through electronic forms, search engines, and clickable categories to allow bidders to locate items of interest [1]. As the Internet evolved and became a virtual sales channel, consumers have found it convenient to conduct online transactions anywhere, anytime [2]. Additionally, the technological characteristics of online auction platforms allow consumers’ to quickly filter the search conditions, using keywords to find the desired products [3]. According to Absolute Markets Insights, the average auction site usage rate in Asian-Pacific countries is 32.1% in 2020, only behind North America’s rate of 39.3% [4].
In online auctions, sellers actively provide products for sale, while buyers actively search for products, especially second-hand products (SHPs). SHPs sold in online auctions are usually cheaper than new products. According to the literature, buyers participating in auctions also consider seller reputation, product quality (i.e., valid warranty and normal functionality), the cross-platform bidding prices of the same SHP, and the timing of bidding (earlier or last-minute) to avoid “the winner’s curse” [1]. Hence, the behavior of online bidders is different from that of general online shoppers. In addition, using functional magnetic resonance imaging (fMRI) identifies the areas of the brain that influence behavioral economics and control positive and negative emotions that influence financial decisions [5,6,7]. Past research confirmed that low price is a major factor influencing consumers’ choices of SHPs [6,8]. The field of consumer behavior research comprises the study of individuals, groups, or organizations and the processes selected, secured, used, and discarded for products, services, experiences, or ideas to satisfy needs, and the impacts of these processes on society [9,10]. Online consumers’ experiences with their previous purchasing events are used to judge the value of commodities, and thus become a part of post-purchase behavior [11]. Other than the price, the brand is also a major factor affecting consumer decisions [12]. However, no study has explored the activation of consumers’ neurons during the decision-making in the context of online auctions for purchasing SHPs or brand-name SHPs. It had remained unknown the locations of brain neurons that are activated due to online consumers’ perceptions of different brands of SHPs. Therefore, the purpose of this study is to verify the areas of brain neuron activation during decision-making in the context of online auctions among consumers who have different brand preferences when purchasing SHPs.
2. Related Work
fMRI is a functional neuroimaging procedure using magnetic resonance imaging technology to measure brain activities by detecting associated changes in blood flow [13]. The primary form of fMRI uses the blood-oxygen-level-dependent (BOLD) contrast to determine different levels of neural activities. The first successful fMRI experiment, performed by Belliveau et al. [14] at Massachusetts General Hospital, did not require injections, surgery, or ingestion of medications. These conditions allow the technology to be widely used in fields such as cognitive neuroscience, economics, psychology, physiology, and sociology. Since 1991, researchers from different disciplines have begun using fMRI to explore mental functions. Investigations have continued in areas such as the exploration of mental function’s effect on behaviors and the influence of cognitive differences and mental states on motivation, behavioral intention, and actual behaviors. Studies also identified the brain’s regions associated with breathing, emotions, hunger, language, memory, thirst, touch, pain, and smell. Recently, researchers have used fMRI to discover different brain activities related to different contexts. Today, more researchers from different disciplines are using the technique to determine if certain stimuli can modulate the brain activities involved in the decision-making process [15,16,17,18]. fMRI has come to dominate brain mapping research and is an effective technology to determine differences in mental states and behavioral intention.
The relationship between consumers and brands is called brand awareness. Brand awareness includes attitude and image. Brand attitude represents consumers’ evaluation of the brand, and brand image is a brand association formed from their experiences and memories [11,19]. According to the literature, brand image can be conceptualized by exploring the relationship between the functional, symbolic, and experiential aspects [19]. The functional aspect of the brand image meets the general needs of consumers. The symbolic aspect fulfills consumers’ desires when making a purchase, such as assigning them specific roles and granting group membership. Finally, the experiential aspect provides sensory pleasure, variety, and/or cognitive stimulation to current and future consumers.
A previous brain imaging study has employed fMRI to explore the correlation between the brand of Coca-Cola® and consumer behavior [20]. When the subjects did not know which brand’s soft drink they were tasting, the brain responses were similar; however, when they did recognize the soft drink brands, differences appeared in their brain responses. The results also found that the ventromedial prefrontal cortex (VMPFC), hippocampus, dorsolateral prefrontal cortex (DLPFC), and midbrain can predict the subjects’ preferences for Coca-Cola®. Specifically, VMPFC is important in decisions involving preference, including the preference for certain brands [21]. Another study’s results showed that only when the target brand was the participant’s favorite did researchers find reduced activation in the DLPFC, posterior parietal, occipital cortices, and the left premotor area, but increased activation in the inferior precuneus and posterior cingulate, right superior frontal gyrus, right supramarginal gyrus, and, most noticeably, in the VMPFC [22]. Overall, the assumption is that consumers’ VMPFC and DLPFC will show significant differences in activation when choosing brand-name products in online auctions.
Predicting consumer behaviors can be easily achieved by investigating their brain’s neurons with the use of fMRI. This method has been adopted by more and more studies in the literature [14,22,23,24,25]. Prior studies have reported consistent results: The activation of nucleus accumbens (NAcc) correlates to consumers’ product preferences, but such activation is found in risky or disadvantageous situations [26]. The medial prefrontal cortex (MPFC) is also activated due to the product’s price differential. Additionally, greater activity in the insula may occur if the situation is associated with non-purchases due to a loss prediction or risk aversion. Overall, the BOLD signal in NAcc, MPFC, and insula are strongly predictive of the decision to purchase [6]. In addition, prior brain imaging studies have found a significant impact of brands on purchasing decisions [20,27]. Specifically, the VMPFC, hippocampus, DLPFC, and midbrain can predict preferences for brand-name products [20]. Purchasing decisions are consumers’ activities when obtaining, consuming, and disposing of products and services [28].
According to the literature from different fields, brain neurons are observable, and purchasing decisions can be predicted using fMRI. The study of Knutson et al. [6] assigned subjects to view a brand-name product and the product’s price before deciding whether to purchase the product or not. Their experiment included three stimuli: product picture, price, and choice (i.e., purchase decisions), measured the mental activity variations during purchasing decision-making, and outlined the process of balancing gains and losses when the consumers were purchasing products. Finally, the study found that the activation of MPFC was strongest when the price was at the lowest. The study also found that product preference correlates with the activation of the NAcc, while the price differential activates the MPFC. In addition, greater activity in the insula is associated with non-purchases. The NAcc appears to be involved in producing an appropriate behavioral response in risky or disadvantageous situations [26]. Overall, NAcc, MPFC, and insula are associated with consumers’ purchasing decision-making.
3. Materials and Methods
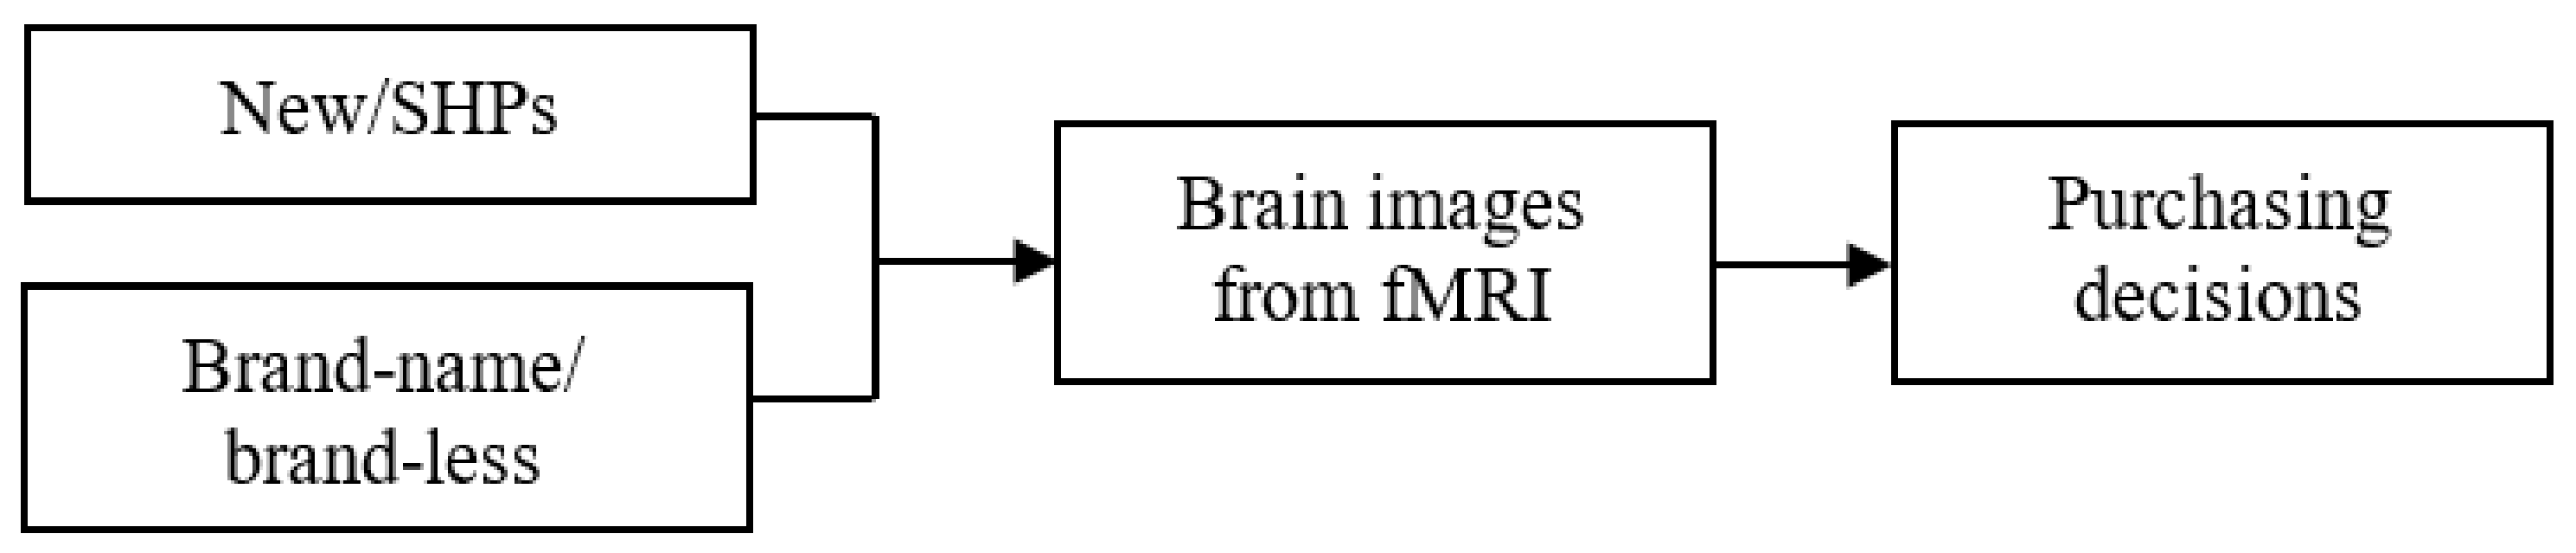
This study combines decision science and neuroscience to explore the brain activities of online consumers with different brand preferences when deciding to purchase SHPs from online auctions. The data of this study include online consumers’ brain images when making purchasing decisions. The conceptual model of this study (Figure 1) is the basis for designing the fMRI experiment. Three hypotheses were proposed in the study. Before the experiment, a short survey was conducted to determine the consumers’ brand preference.
Hypothesis 1 (H1).
Significant neuron activation exists in certain brain regions, especially the MPFC and insula, when consumers decide to purchase products involving a price differential, i.e., new vs. SHPs.
Hypothesis 2 (H2).
Significant neuron activation exists in certain brain regions, especially the VMPFC and DLPFC, when consumers decide to purchase brand-name products.
Hypothesis 3a (H3a).
A significant difference exists between consumers’ number of purchasing decisions and non-purchasing decisions when faced with new products vs. SHPs.
Hypothesis 3b (H3b).
A significant difference exists between consumers’ number of purchasing decisions and non-purchasing decisions when faced with brand-name vs. brand-less products (regardless of being new or SHPs).
3.1. Research Participants
This study uses the most popular auction websites in Taiwan: Yahoo! Kimo Auction and Ruten Auction. The participants were those who have purchased new products and/or SHPs from either auction. According to the literature, a well-designed fMRI experiment should include at least 12 subjects to reach an explanatory power of 80% [29]. To ensure the authenticity of the participants, the study invited actual bidders on Yahoo! Kimo Auction and Ruten Auction to participate in the experiment; then, these people recommended other online consumers to participate. To be noted, the gender difference was ignored in this study, so that the data collected from both the survey and the fMRI experiment could be treated as a whole, no matter if they were from females or males. However, as the brain volume of biological males tends to be larger than that of biological females, this study intended to recruit the same number of female and male participants for being reliable in reporting any significant brain activity later from the fMRI analyses.
3.2. Experimental Design
To ensure the clarity of the experimental stimuli, the auctioned products selected were standard electronic devices that were very popular on Yahoo! Kimo Auction and Ruten Auction. Many types of electronic devices have features that may influence the experimental results and increase the difficulty of explaining the study’s results. Therefore, only personal, hand-held electronic devices were included in the experiment, namely, “computer hardware/software and related devices”, “cameras and video recorders”, “cell phones and communication devices” and “games and consoles”.
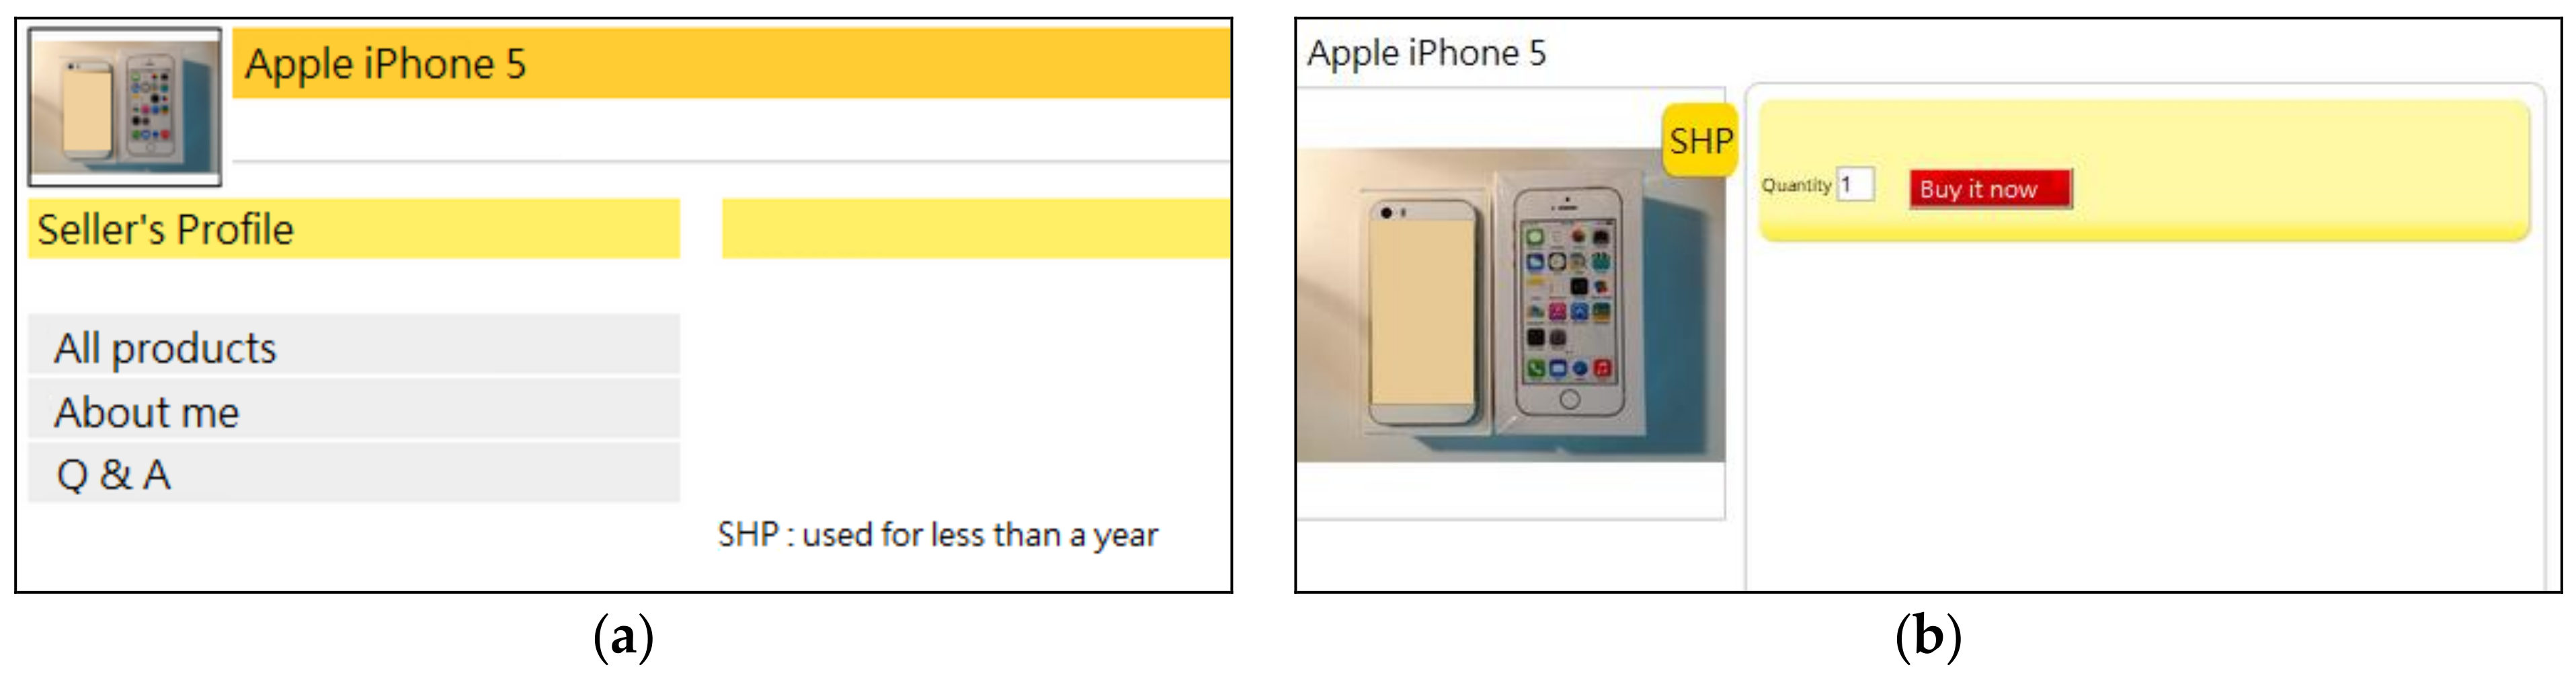
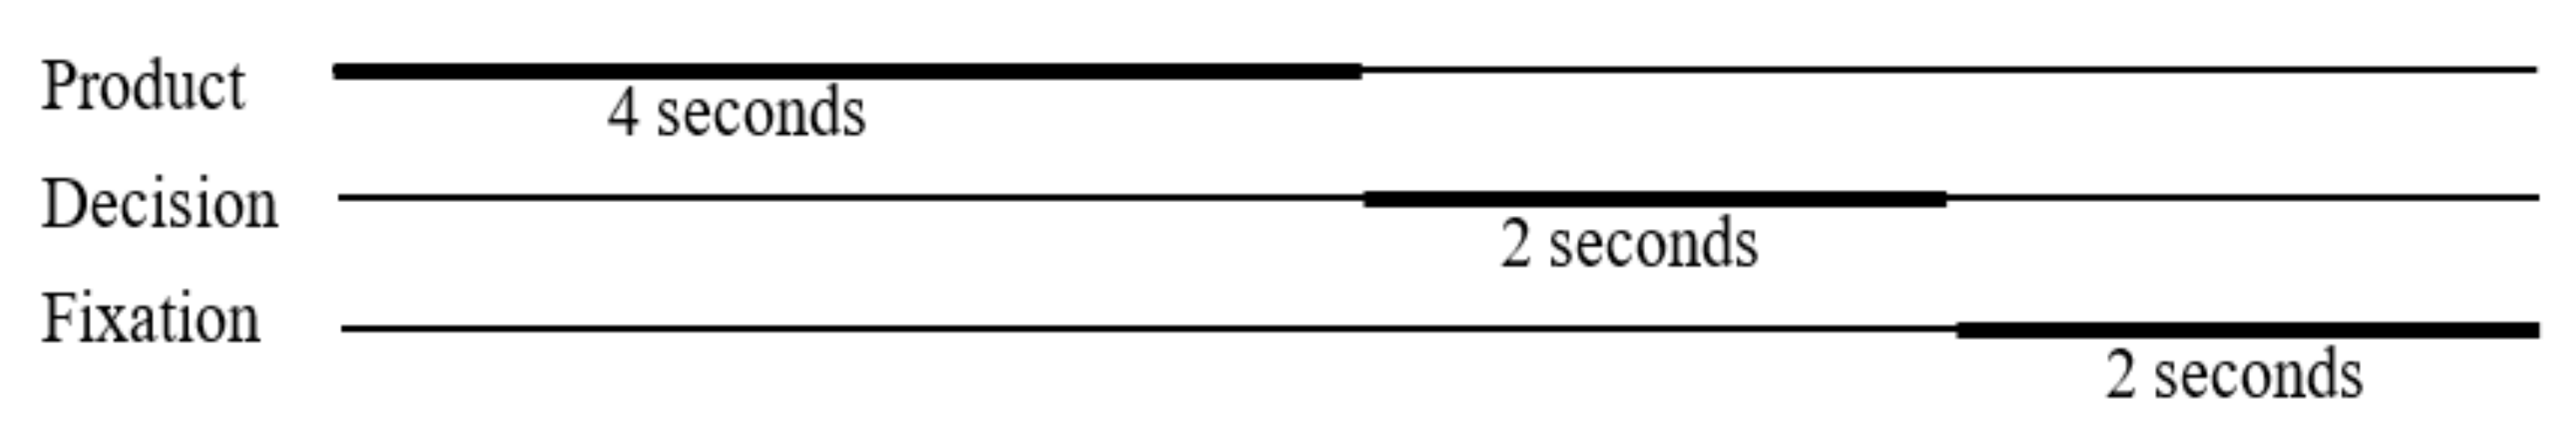
As shown in Figure 2, the experimental materials presented the product images in simulated Yahoo! Kimo and Ruten webpages as the stimuli for the participants’ brain neurons. In the experiment, the images may show the product as either new or second-hand, and either with the brand being identifiable or not (i.e., brand-name or brand-less). The two variables (new/SHP and brand-name/brand-less) formed a 2 × 2 experimental design scenarios with four possible scenario combinations of product images (new brand-name, SHP brand-name, new brand-less, SHP brand-less). Each scenario viewing, or “trial”, was divided into three segments (Figure 3). The first segment displayed a product image (4 s) from one of the four possible combinations. In the second segment, the participants made their choice by using a Lumina response pad (Cedrus, San Pedro, CA, USA) (2 s). Finally, the participants viewed a + sign for fixation (2 s). Every trial lasted 8 s. This experiment was conducted in six runs; each run included 20 trials. The first and second run randomly showed on a white blank background 40 product images that were either new or second-hand without any brand label. These two runs were designed to test the first hypothesis by identifying which brain regions would have significantly different activations when consumers decide to purchase SHPs versus new products. The third and fourth run randomly showed one set of 20 new and second-hand products with the brand label and a set of 20 new and second-hand products without any brand. Again, the images were placed on a white blank background. The purpose of these two runs was to test the second hypothesis, that is, to identify the significantly activated brain regions when deciding to buy or not to buy brand-name SHPs versus brand-less SHPs. To be noted, in the third and fourth runs, the new products with or without brand labels were compared with the SHPs with/without brand labeling, much like in the first two runs. Finally, the fifth and sixth runs randomly showed the same product images used in the first two runs, but the images were now displayed on either the simulated Yahoo! Kimo Auction website or the simulated Ruten Auction website to help verify the results obtained from the first two runs and the first hypothesis was re-verified here. Overall, there were 60 products without brand labels (these could be either SHPs or new products) and 60 with brand labels. In other words, in this study’s fMRI experiment, the participants needed to make 120 purchasing and/or non-purchasing decisions by clicking on a Lumina response pad 120 times during the fMRI scans. The third hypothesis was tested with these responses.
The experiment followed these six steps: (1) Recruiting the study participants. (2) The participants sign the experimental consent form, provide personal information, and complete a survey on brand preference. (3) The participants entered the fMRI room. (4) The scans created the structural images. (5) Stimulations appeared on the fMRI’s projector. The first screen presented to the participants was the instructional page with four statements so that they knew in which context they were situated and how to submit their purchasing decision in every trial during the experiment. They were informed by the instructional page that they owned none of the products presented in the six runs, and they were capable of consuming all types of products. They were also reminded to choose to purchase at least one product by comparing it to other products of its kind in each run. If they decided not to purchase any product in any experimental scenario, their brain image data would be considered invalid and will be removed from the analysis. This did not occur in the current study. In each trial of each run, after a few seconds, the participants provided their purchasing decision (to buy or not to buy) by using a Lumina response pad, which has four buttons on it. The participants were able to hold the pad steadily with two hands while lying down in the fMRI room. While deciding, the fMRI scanned the images of participants’ brains. If the participant decided to purchase, their left thumb would press the left button on the pad; otherwise, the right thumb would press the right button. Since all the participants were righthanded, they might have found it easier to press the right button. If they did make a purchasing decision, they had to use their left thumb to press the button. This approach helped confirm their real intention in making a purchasing decision for a certain type of product presented in the scenario. No confusion was expected, but the participants were reminded repeatedly to only press the left button on the pad when they made the purchasing decisions on the products (six times in each run, displaying the instructional page as the initial screen). (6) The researchers debriefed and thanked the participants and verified their contact information.
3.3. Survey Development
The survey developed for this study consists of four parts to examine consumers’ attitudes toward brands and the three kinds of perceived brand images (i.e., functional, experiential, and symbolic) of the auctioned products used in this study. The survey consists of 23 questions on a 7-point Likert scale ranging from “strongly disagree” to “strongly agree”. Appendix A lists the survey items of consumers’ attitudes toward brands. To be noted, after carrying out the reliability analysis, five items were removed to improve the overall consistency of the survey. Thus, the follow-up analysis results contained 18 survey items.
3.4. Data Collection and Analysis Methods
Before the experiment, the participants responded to the survey so that their brand attitude and brand image could be measured. SPSS v17.0 (IBM, Armonk, NY, USA) was used to analyze the survey data with independent samples t-test to identify gender homogeneity. Reliability analysis was conducted to determine the consistency and stability of the survey’s questions by applying Cronbach’s α [30]. The descriptive analysis yielded the means and the standard deviations for each part of the survey.
An fMRI scanner, GE MR750 (GE Healthcare, Chicago, IL, USA), scanned and collected the structural and functional images of the participants’ brains. The scans’ parameters were the default settings provided by the manufacturer. BrainVoyager QX (Brain Innovation B.V., Maastricht, The Netherlands), a software package for the analysis and visualization of brain images, provided the dataset for analyzing the fMRI output. The fMRI analysis methods used were data pre-processing and general linear model (GLM). The data pre-processing method included slice-timing correction and 3D motion correction. Slice-timing correction applied a phase shift of the time-series, while 3D motion correction validates the fMRI data. The assumption is that the variations of intensity in the same voxel between repeated measurements of a time-series are primarily due to the changes in cerebral physiology. After pre-processing the fMRI data, seeking a fit between a GLM and the time series of each voxel is a common approach for identifying the voxel to which the time series significantly correlates with a specific experimental condition. The statistical threshold for denoting the activity of a specific brain area was set to p < 0.01, while the cluster threshold was set at 10 continuous voxels [31]. ANOVA and chi-square test were performed using SPSS v17.0. The ANOVA compared the BOLD time course of a certain brain area under different experimental conditions. The chi-square test determined whether a significant difference existed in the number of purchasing decisions for SHPs and new product versus that of non-purchasing decisions for SHPs and new products (i.e., runs 1, 2, 5, 6). A chi-square test was also conducted in the scenarios regarding brand-name versus brand-less SHPs and new product purchasing decisions (i.e., runs 3, 4).
4. Results
This study recruited 12 undergraduate students with normal or corrected-to-normal vision (7 males and 5 females; 18 to 25 years of age) to participate in the fMRI experiment and respond to the survey. As a condition of this study, all participants had to have some experience in purchasing SHPs and/or new products through online auctions. All participants provided consent, and each received NT $500 (about US $16) as a token of appreciation for their participation. Before the experimental trials began, all participants completed three practice trials to ensure they understood the procedures and instructions, and could perform the tasks of reading the screen and clicking the Lumina pad.
4.1. Survey Analysis Results
The means and standard deviations of each survey construct (i.e., brand attitude and three types of perceived brand images) are shown in Table 1. Table A1 in the appendix provides the descriptive analysis results of each survey item. This study conducted an independent samples t-test for males versus females. The level of significance for gender differences in each part of the survey was above 0.05, meaning that the gender bias was not significant (Table A2). The reliability analysis was carried out and generated Cronbach’s α value. Five items were removed to improve the α value for each construct of the survey. As a result, the Cronbach’s α value of each construct was between 0.529 and 0.810, as shown in Table A3. Even though the Cronbach’s α value of one construct, i.e., the functional image of a brand, did not achieve the minimum acceptable value (0.6), the validity of the construct is still adequate [30]. Thus, this study confirmed that each measurement item within each construct had an acceptable to high degree of consistency.
4.2. Purchasing Decision Behavior—To Buy or Not to Buy
The 12 online consumers in this study were asked to make 120 decisions on whether to purchase some products. To verify whether these consumers’ purchasing decision behaviors were significantly different for the four scenarios, the number of “purchases” and “non-purchases” were compared by using the chi-square test. It was found that for brand-less products (regardless of these being new or second-hand), the average number of purchase decisions was 24.417 (SD = 3.3967), and the number of non-purchase decisions was 15.583 (SD = 3.3967). The chi-square test results revealed a significant difference between the number of purchasing decisions for SHPs and new products versus the non-purchasing decisions for SHPs and new products (chi-square value = 22.969; p < 0.05). The same was true for the brand-name products (again, regardless of being new or SHPs): the average number of purchases was 22.917 (SD = 3.8720), and the average number of non-purchases was 15.583 (SD = 3.872). The number of decisions also differed significantly for purchasing and non-purchasing brand-name and brand-less products (chi-square value = 9.919; p < 0.05). Therefore, it can be assumed that at least one brain neural activity will have significant activation after the consumer views the brand-less SHPs and new products when making a purchasing decision, which will be proved accurate by an actual decision to purchase the products. Notably, for the participants choosing to not purchase, other regions of the brain’s neural activity could still activate; however, that factor is beyond the scope of this study.
4.3. fMRI Scanning Results of Purchasing Brand-Less SHPs vs. New Products
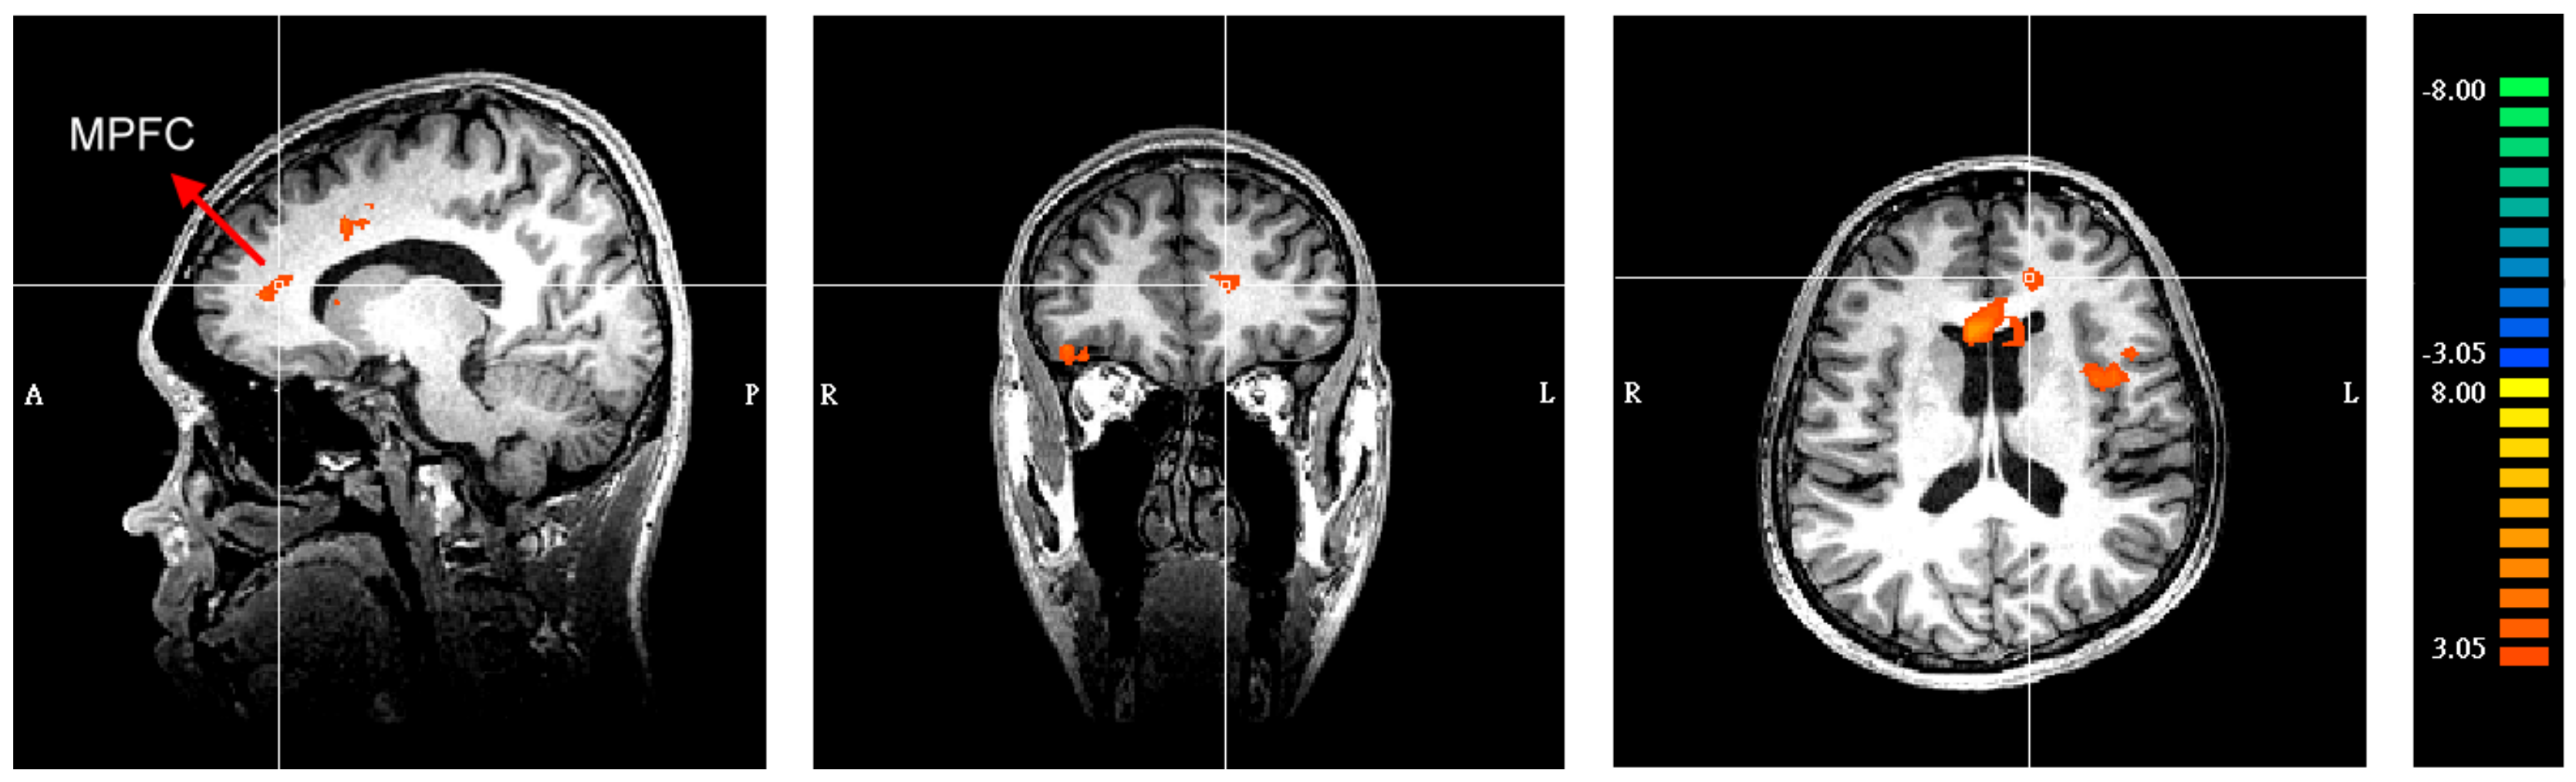
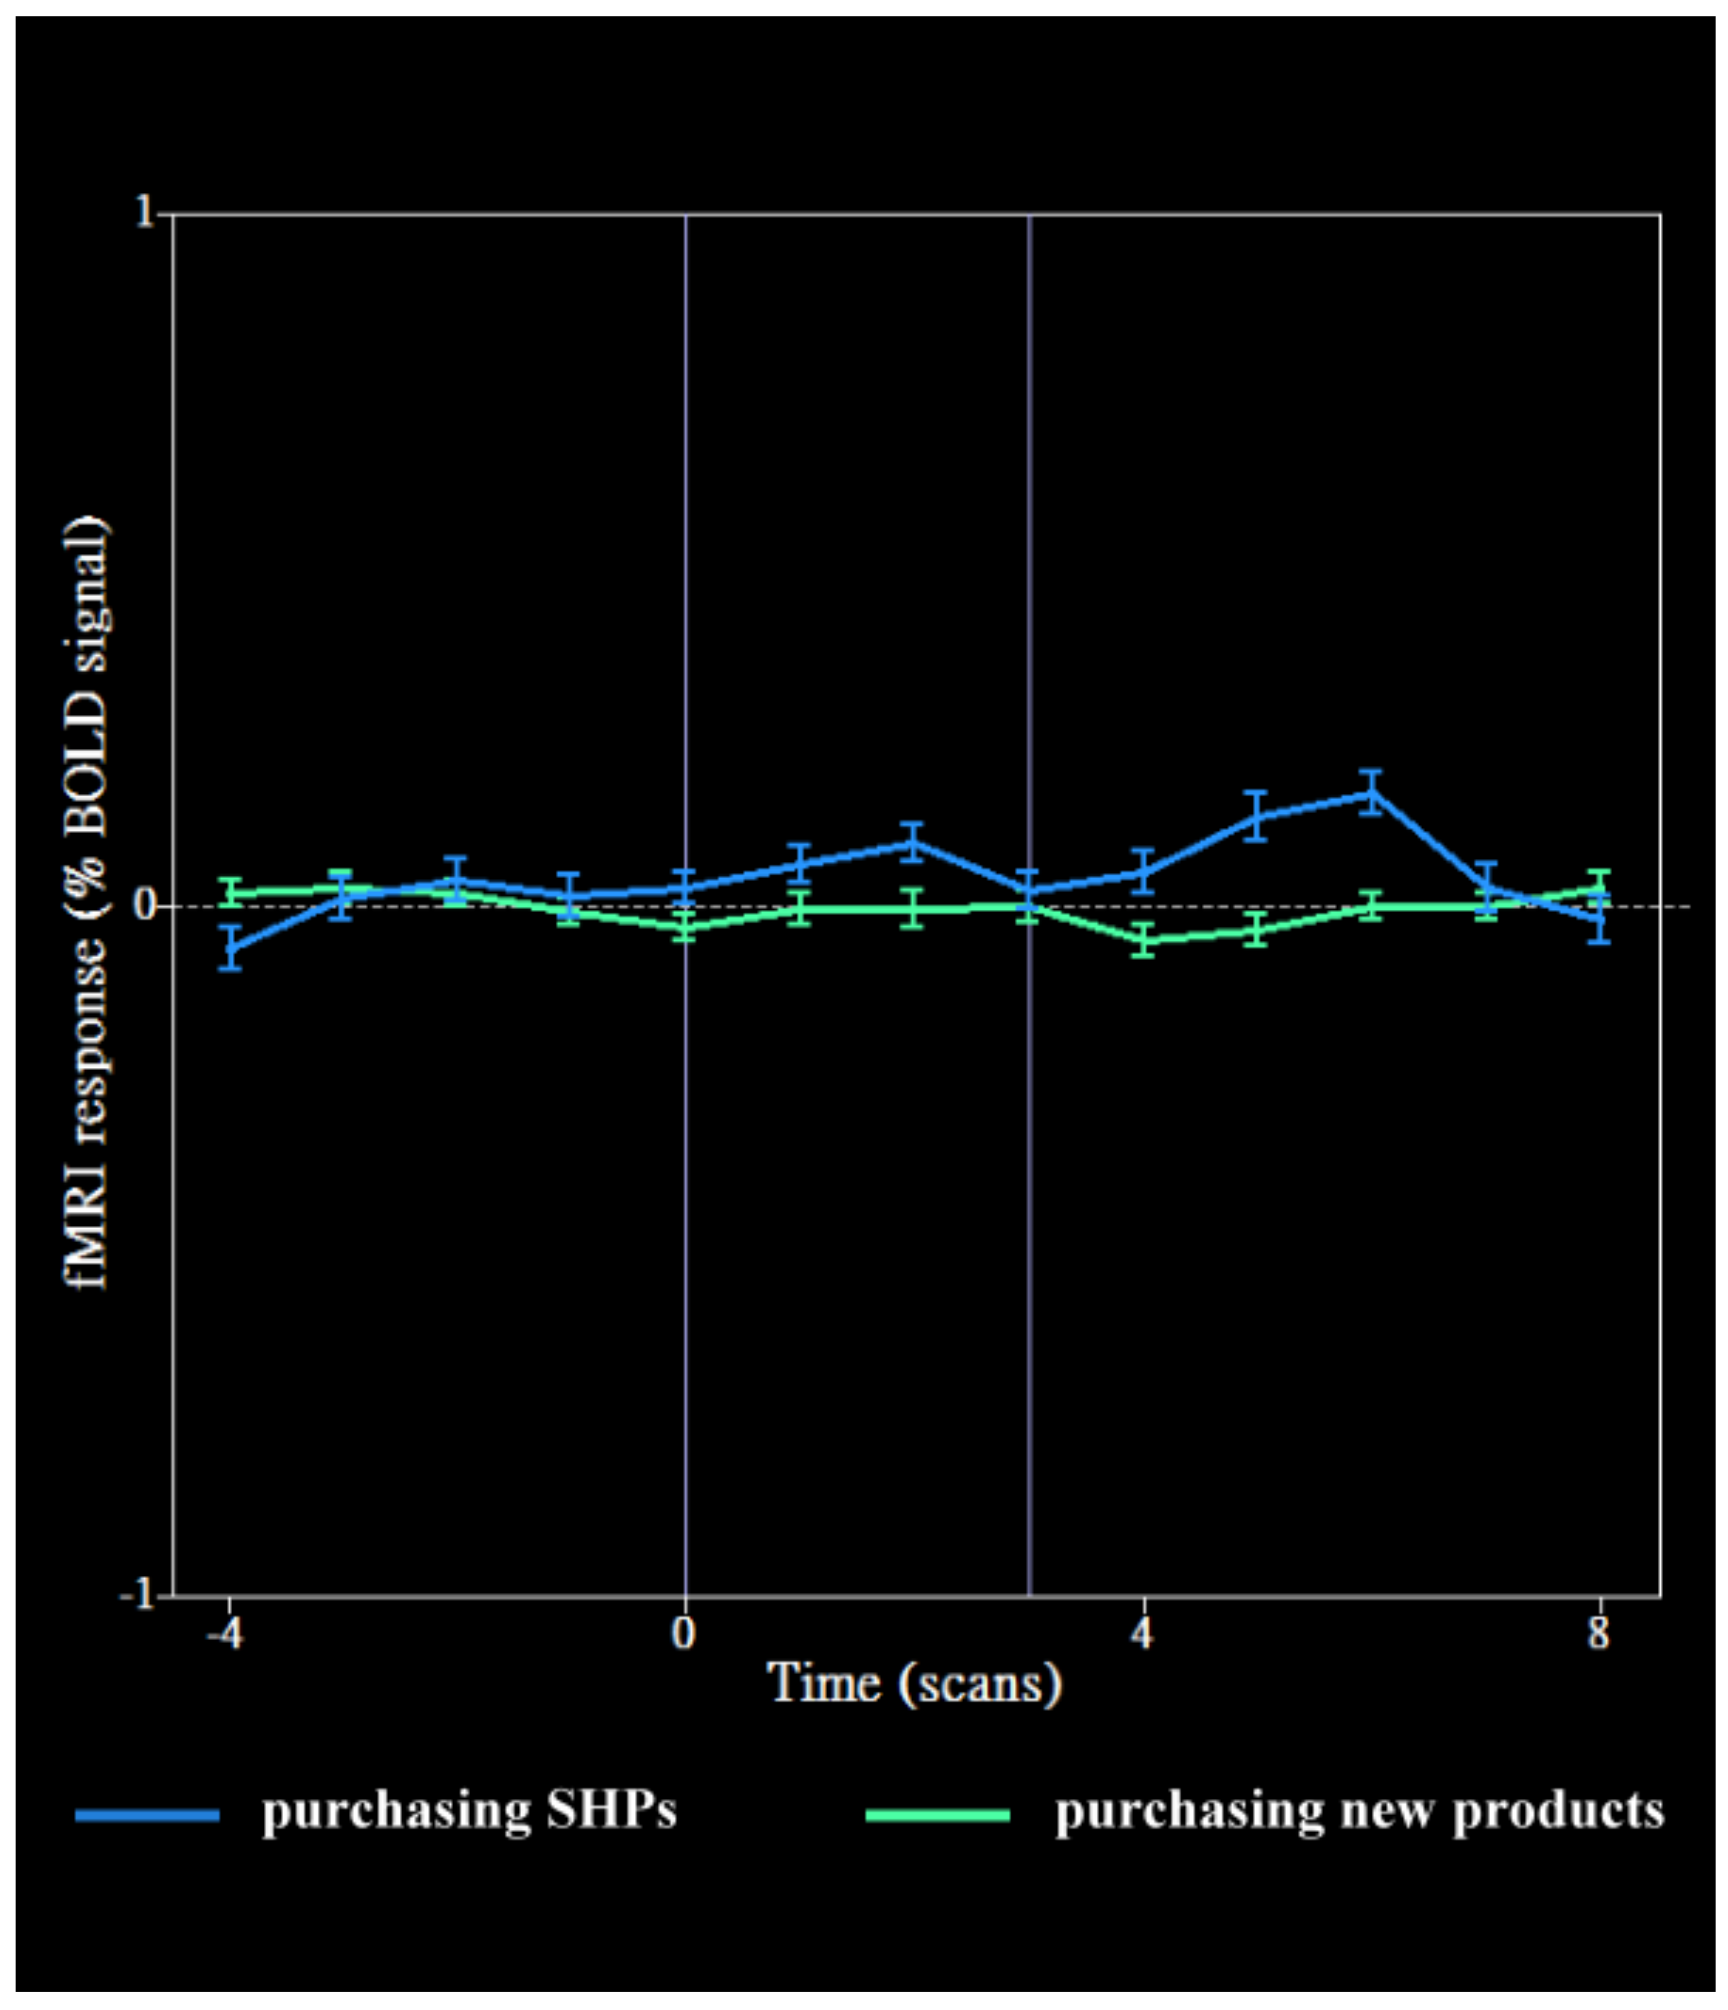
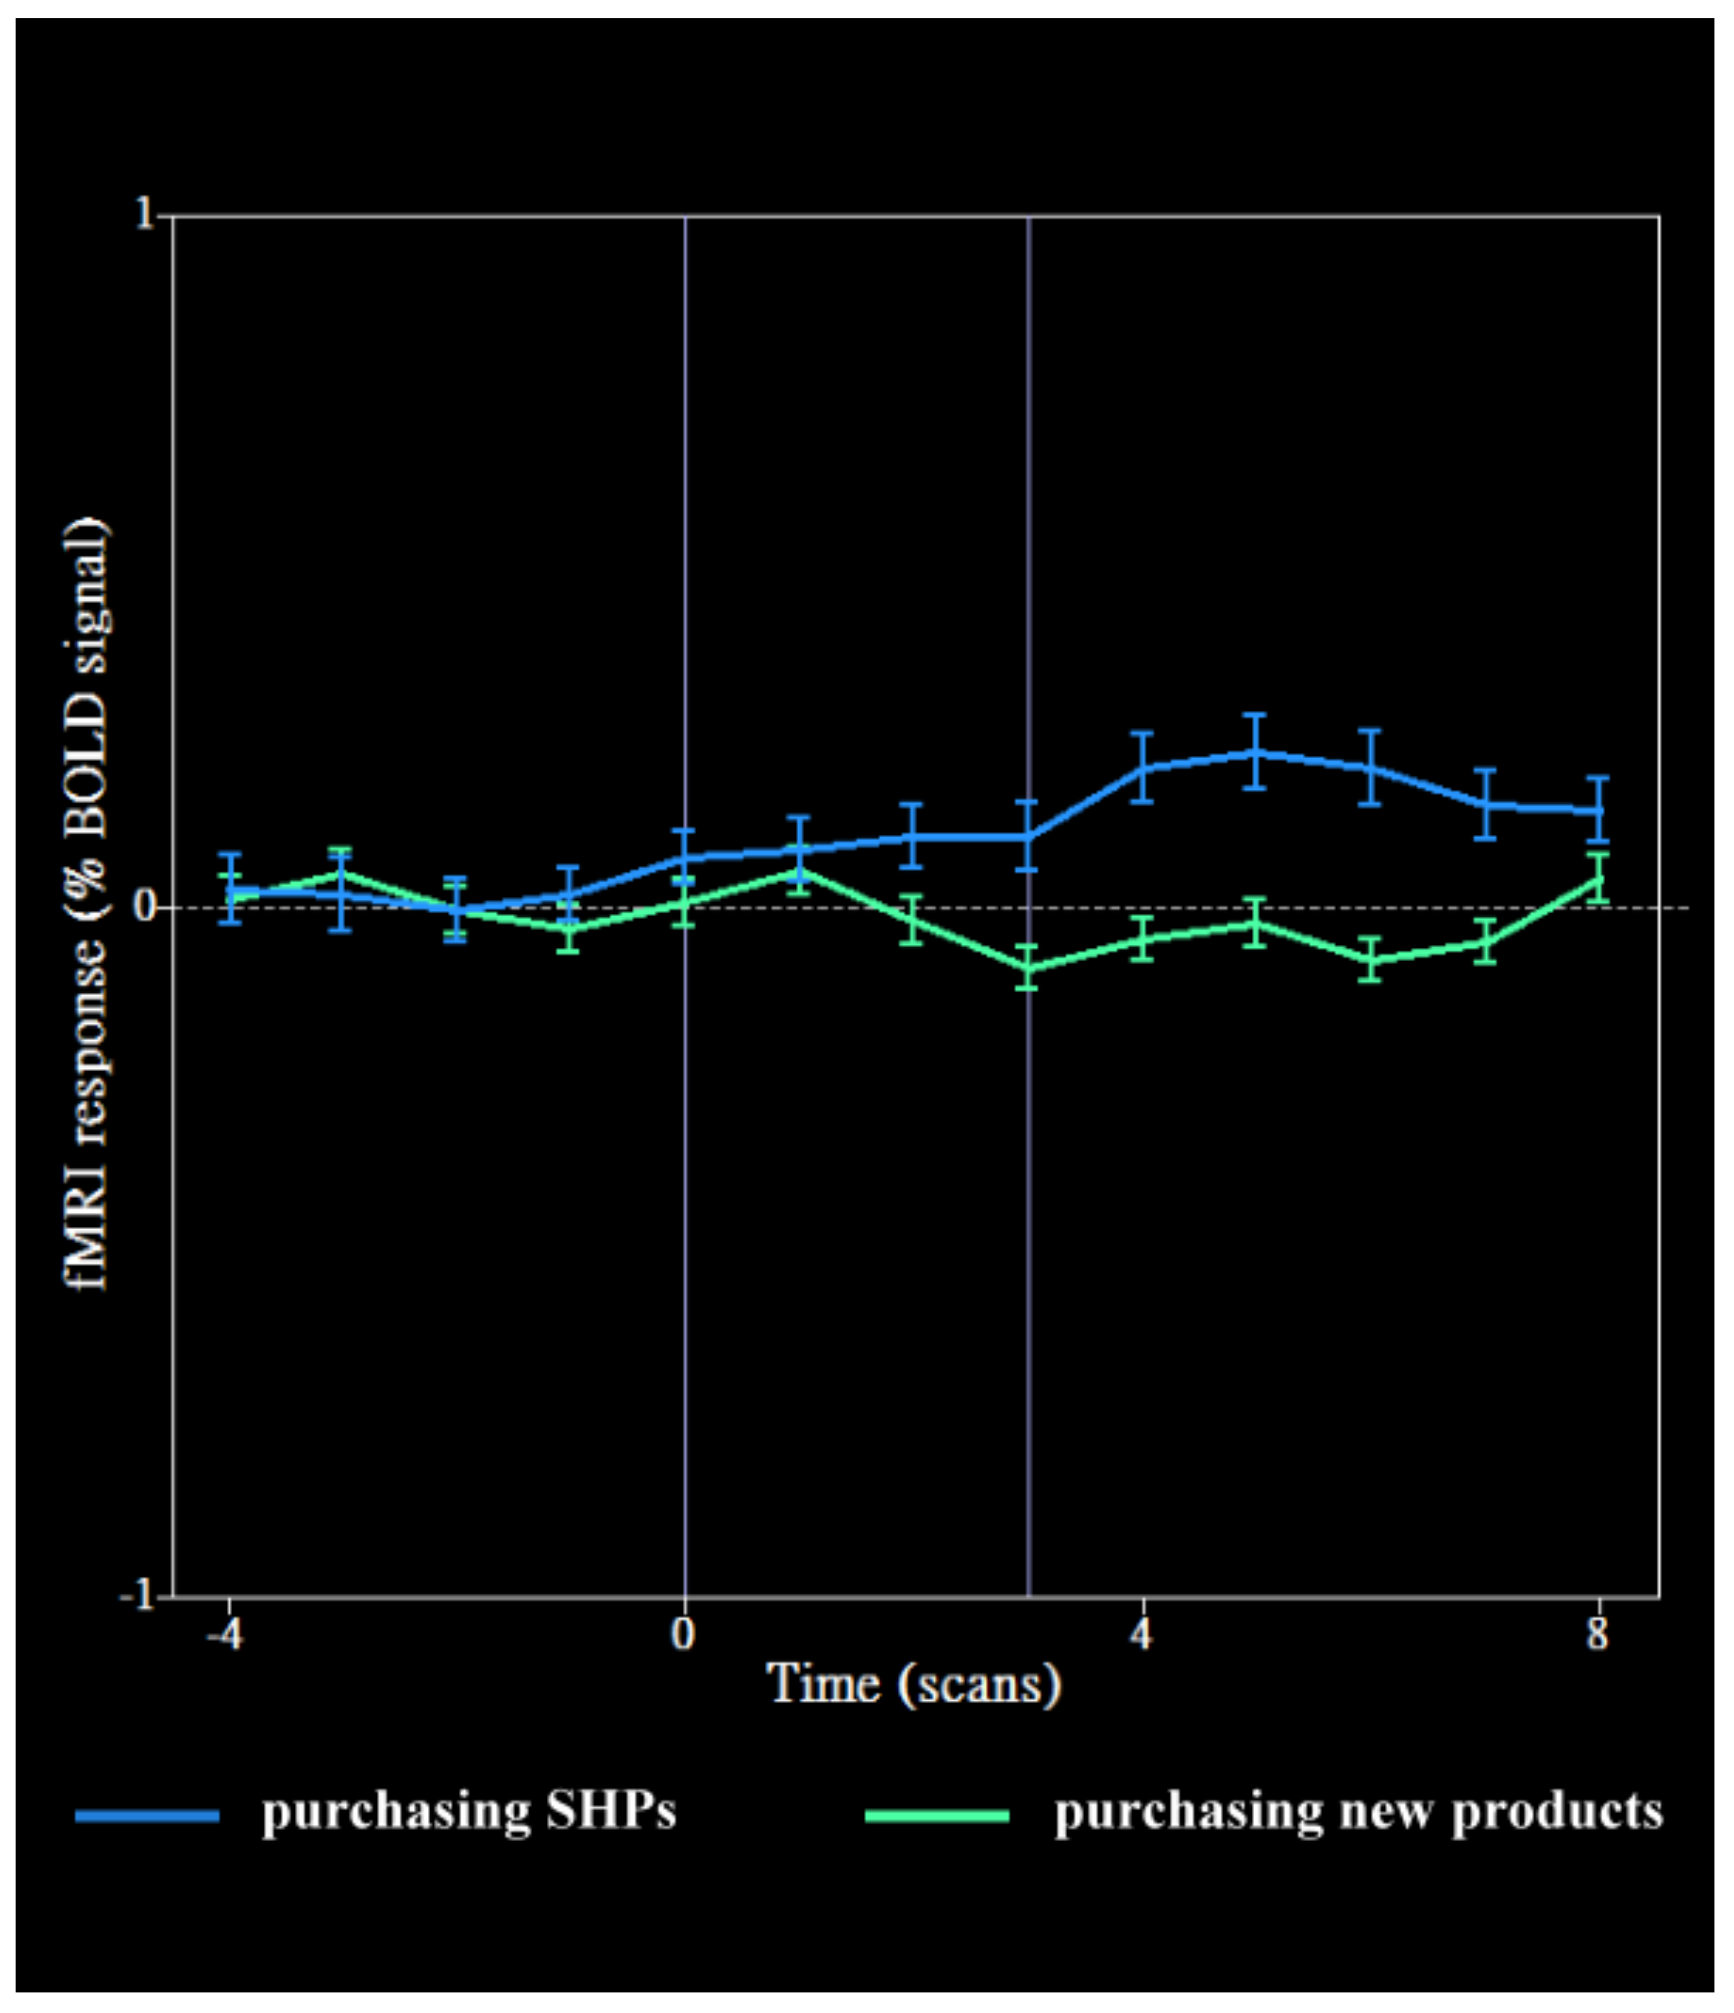
In accordance with previous reports in the literature, the current study expected that MPFC activity would increase when purchasing SHPs because of the lower price. Contrarily, insula activity would decrease in the prediction of a loss when the participants decide to purchase new products. The results of a random-effects GLM at the whole-brain level revealed significantly more activities in the MPFC of the participants while purchasing SHPs online compared with purchasing new products (degree of freedom = 11, p < 0.01, uncorrected) (Figure 4). The colors indicate the values obtained by subtracting the new product activation from the SHP activation. Therefore, this study verifies that when consumers choose to purchase SHPs, their MPFC activity differs significantly from when they purchase new products. This study also found that the right insula had more activity during SHP purchases than during new product purchases (degree of freedom = 11; p < 0.01, uncorrected) (Figure 5). The BOLD time course of both the MPFC and the insula revealed differences when online consumers purchase SHPs (Figure 6 and Figure 7).
In addition, a random-effects general linear model at the whole-brain level found several activation increases, as summarized in Table 2. The global threshold was set to p < 0.01, uncorrected, while the cluster threshold was set at 10 contiguous voxels. From the table, it can be found that more brain regions on the right side were activated when the participants were deciding on whether to purchase SHPs/new products.
4.4. fMRI Scanning Results of Purchasing Brand-Name SHPs vs. New Products
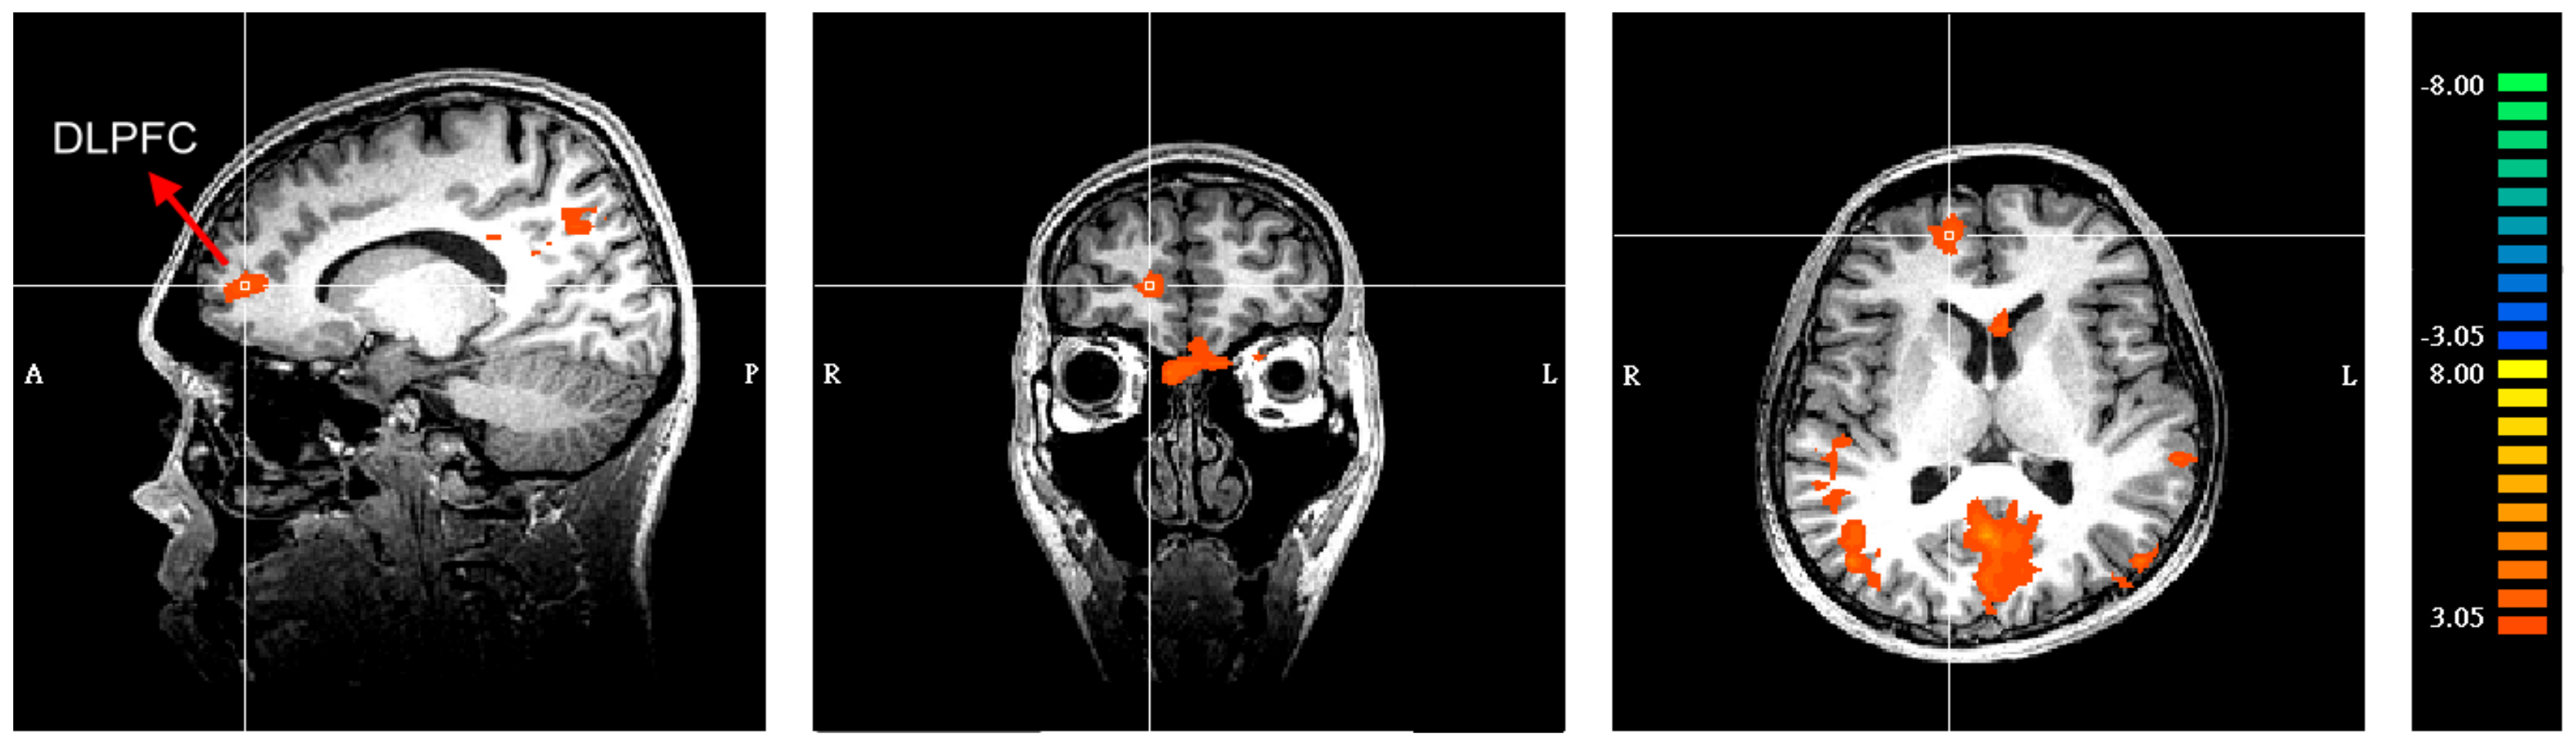
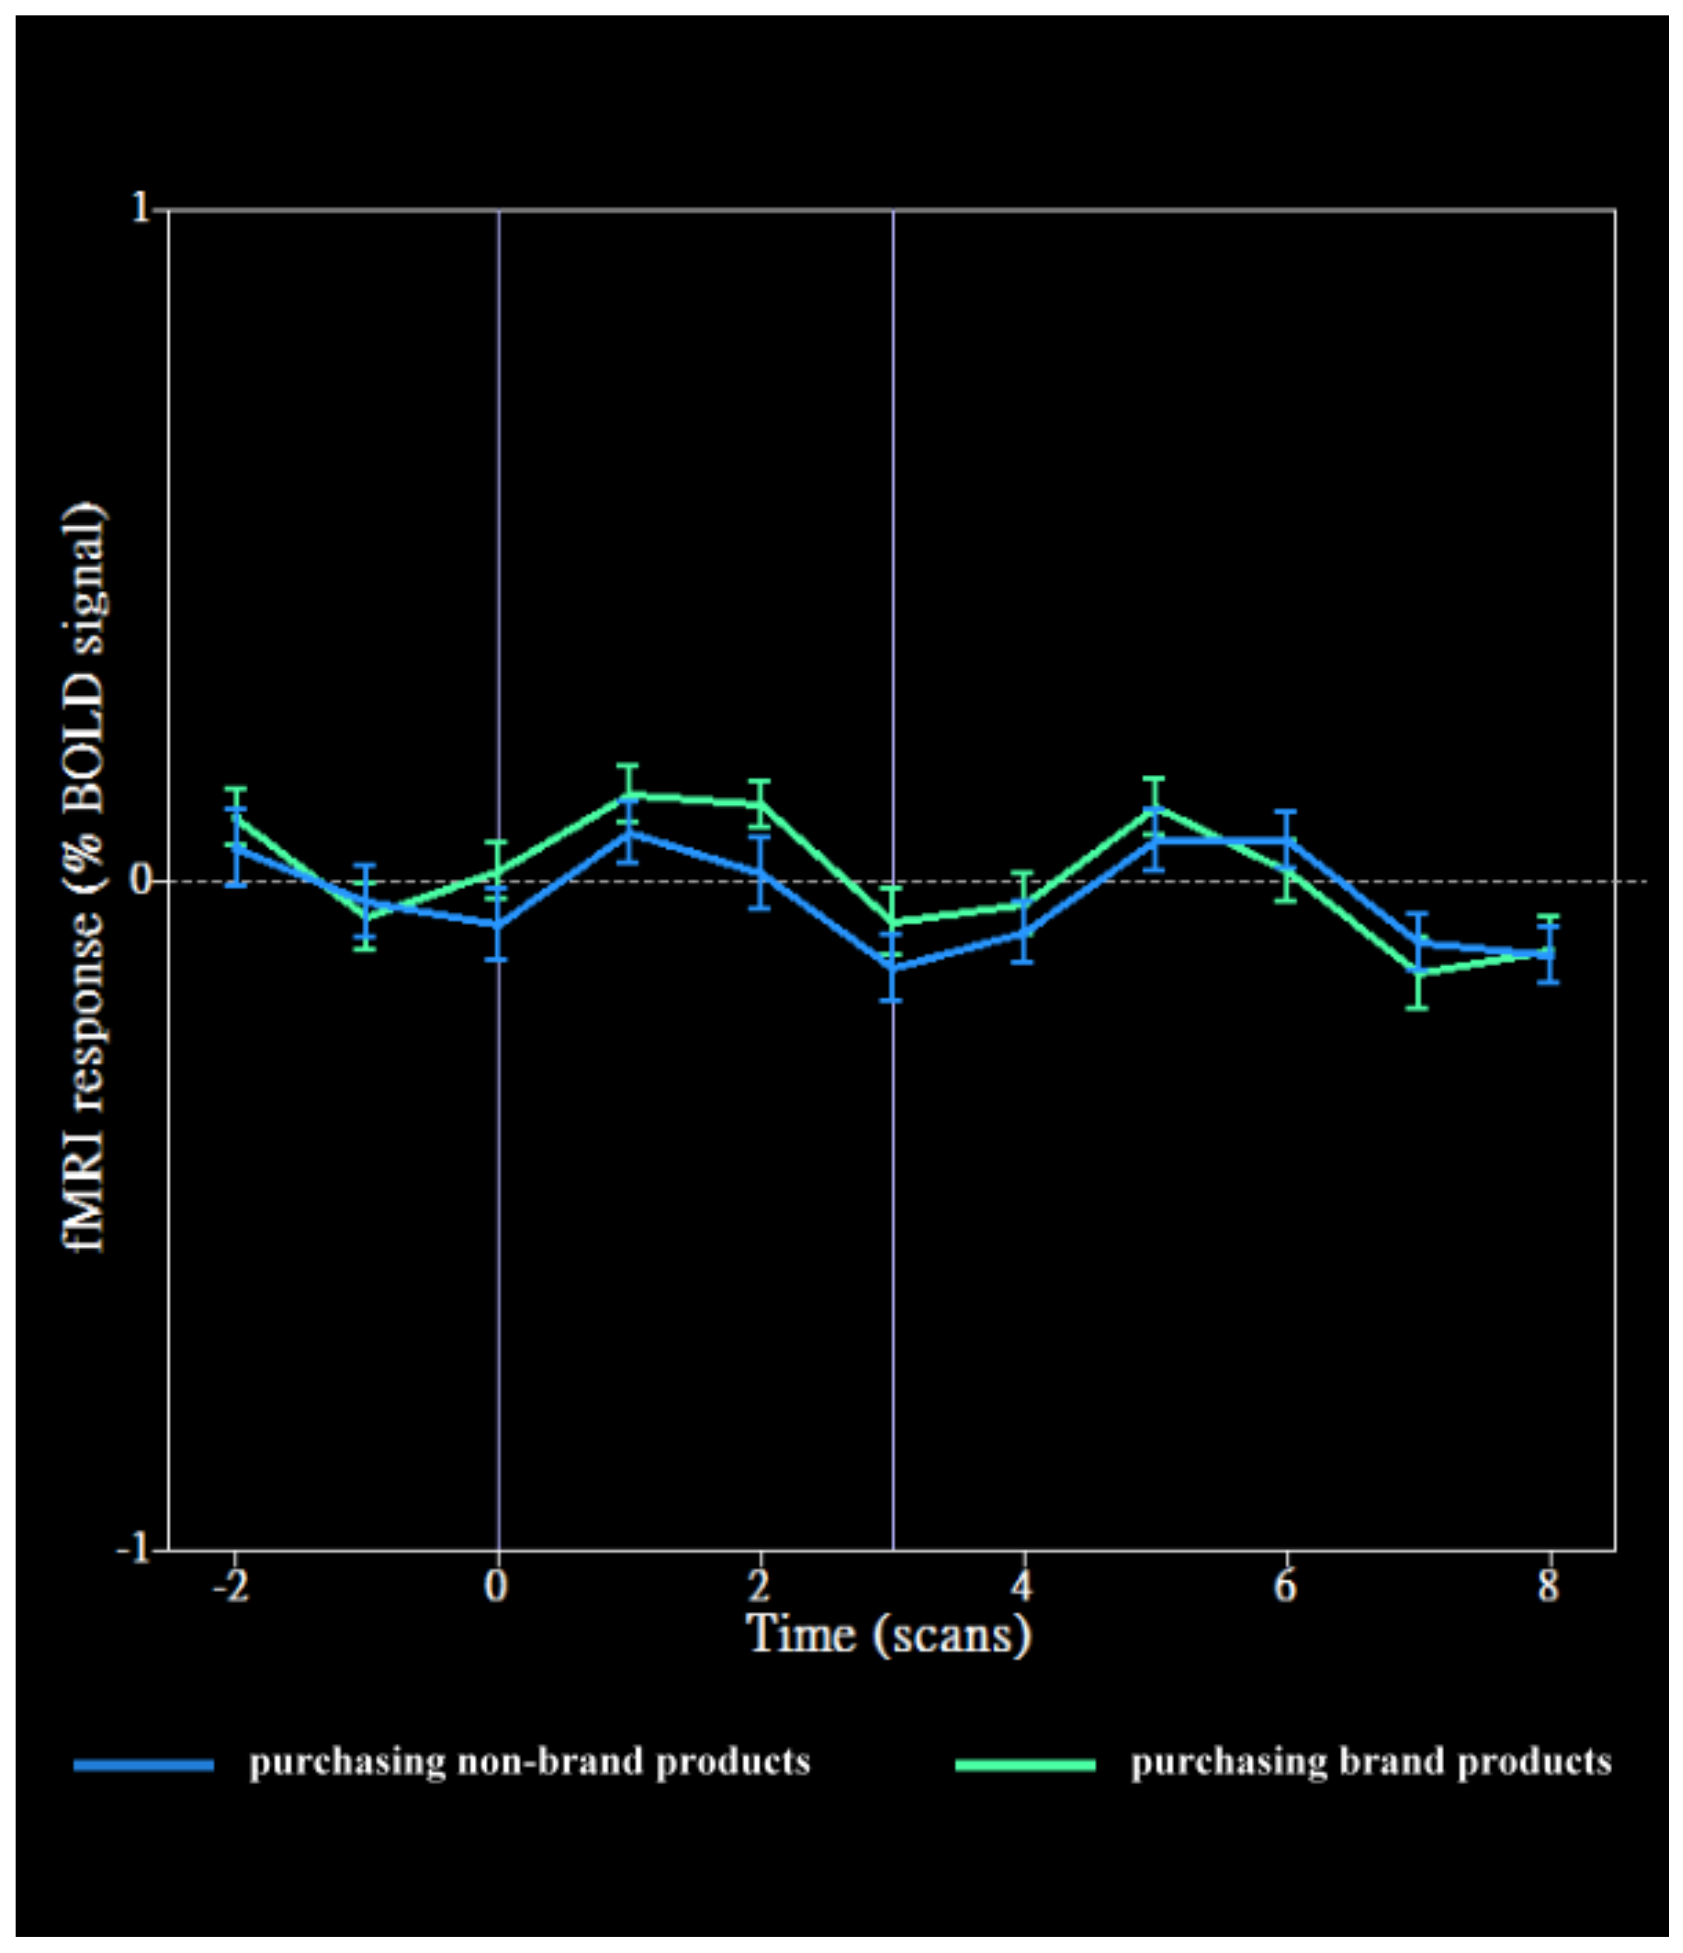
This study expected an increase in DLPFC and VMPFC activities when purchasing brand-name products. The results of a random-effects GLM at the whole-brain level revealed significant increases in DLPFC activity of the participants who purchased online brand-name products compared to brand-less products (degree of freedom = 11; p < 0.01, uncorrected) (Figure 8, Table 3). Figure 9 displays the BOLD time course of the DLPFC. The global threshold was set to p < 0.01, uncorrected, while the cluster threshold was set at 10 contiguous voxels. However, the VMPFC did not show any activity in this study.
5. Conclusions and Discussion
The survey results showed consistency in the participants’ brand attitudes and a significant difference between the number of purchasing and non-purchasing decisions. Thus, the following fMRI analysis results are reported with a high level of confidence. The results of this study showed that when purchasing online brand-less SHPs, the MPFC of consumers have significantly more mental activity than when they purchase new brand-less products [6,8,32]. However, differing from Knutson et al. [6], the current study’s findings indicate significant increases in insula activity while purchasing online SHPs compared with purchasing new products. The reason might be due to this study’s comparing the difference between purchasing SHPs and new products, and the participants feeling a loss for not seeing any benefits (e.g., purchasing a brand product) in either case. This study also found that the participants’ DLPFC displayed significant activity during online purchases of brand-name products [27,31,33,34,35]; however, the VMPFC activation appeared to be insignificant. According to the literature, brand information usually acts as an emotional-memory-based somatic marker in preference judgments. A prior study has indicated that while an active network of bilateral superior frontal gyri, hippocampus, and posterior cingulate is related to familiar brands in general, the VMPFC is not significantly activated in response to these generally familiar brands [34]. Rather, it is activated due to preferences for specific brands [21]. Besides, in the current experimental design, the stimulations for brand products were not designed for a specific brand, which may be the reason why the VMPFC was not significantly activated when online consumers purchased brand-name products in this study. More studies may be needed to explore the VMPFC and DLPFC networks [31].
Consumer decision-making is a popular subject for neuroimaging research [36,37]. Neuroimaging methods generate fundamental conceptualization and understanding of underlying conditions and processes, as well as refining the existing conceptualization of various phenomena [31,38]. The current study differs from previous studies of online auctions and combines neuroscience technology to explore online consumers’ decision-making when purchasing SHPs in online auctions. This study provides four theoretical implications. (1) This study is the first to explore the reaction of neurons when online consumers purchase SHPs and the effect of brand preferences on that reaction. (2) This study explores and predicts the activity induced by the brand in relation to online consumers’ choices. (3) This study uses fMRI to identify neural responses in different decision-making contexts. (4) The use of fMRI allows a progressive identification of neural responses. It can also present the nature of existing and new constructs by identifying whether a construct spans different brain areas [38]. Such identification is important because it allows consumer research to better understand the relationship between different brain regions and different functions [36]. Table 4 shows the brain areas activated for the different functions.
This study also provides practical implications. First, “neuromarketing” is a term that has often been used in the media in recent years and has become a recommended, important, and revolutionary form of marketing research [25,39]. Recently, interests have increased in applying neuroscientific findings and methodologies to other disciplines [37,40]. For example, Nielsen, the market research firm, founded Nielsen NeuroFocus to provide consumer neuroscience explanations in marketing practices, adding the measurement of the subconscious mind to the company’s knowledge base of the consumer. Some companies use neuroimaging techniques to solve marketing problems. For example, Delta Airlines learned what makes a fabulous travel experience, the commercials’ products and packages of Frito Lay (Pepsi) are more appealing to women than men, and Microsoft finds out how to engage Xbox users while playing the game [41]. These indicate how important neuroscience tools have become. Second, this study combined brand research with neuroscience. This study’s results might be critically useful for brand management. For example, reducing consumers’ response time to a certain brand is possible to enhance brand awareness and brand loyalty, in spite of variances in consumers’ brand preferences. Third, as consumers interact with a brand, gaining insight into the entire experience (including sight, hearing, taste, and smell) is important for establishing deeper engagement and enhancing brand identity.
This study has several limitations and suggestions for future research. This study’s participants were aged 18–25, and the sample size was small. Future studies are suggested to recruit a larger number of participants, and comparative analysis can be carried out to test the differences among the age groups. Since the study used simulated Yahoo! Kimo Auction and Ruten Auction websites, another comparative analysis can also be conducted to explore differences between the two different web platforms or among various auction websites. In addition, in the experiment, the stimuli appeared for a very short period of time. A worthy exploration would be determining whether or not online consumers are capable of real-time reactions in such a short period of time. The experimental stimuli did not include prices. A similar experimental design could encompass a real situation. Future neuroimaging studies could further explore the correlation between neural activities and consumers’ awareness of prices. In future experimental design, one more run can be added to include a specific brand and label the products as new or second-hand. Even if the newly-added run cannot generate results for other brands, a brand company can determine whether consumers consider cheaper price or brand-name products when making decisions on purchasing SHPs. This should be done by recruiting the participants without brand bias or loyalty and with an average socioeconomic status.
This study combines consumer research with neuroscience; however, previous neuroscience studies have common problems of reliability and validity, causing uncertainty in the results. Future neuroscience studies could conduct behavioral research before scanning the participants’ brain, and then use different brain imaging tools to improve data quality. In behavioral research, the participants’ levels of purchasing intention can be obtained instead of only asking them to make purchasing or non-purchasing decisions. For the sake of saving experimental time, the participants’ levels of purchasing intention can be obtained while scanning their brains by using the same Lumina pad instead of conducting behavioral research. Future studies can also adopt MRI-compatible eye trackers to double confirm if any textual cue, product brand-name, or the term SHP makes the participants have more eye fixation time and longer fixation duration [42]. Finally, depending on the specific research questions, ideally, the application of mixed methods could result in better explanations, despite that the heterogeneity of the methods might make it more difficult to generalize the results in a way that is meaningful for consumer or e-commerce research.
Author Contributions
Conceptualization, P.-H.H.; methodology, P.-H.H.; software, P.-H.H.; validation, P.-H.H. and F.-N.C.; formal analysis, F.-N.C.; investigation, F.-N.C.; resources, P.-H.H.; data curation, P.-H.H.; writing—original draft preparation, F.-N.C.; writing—review and editing, P.-H.H.; visualization, F.-N.C.; supervision, P.-H.H.; project administration, P.-H.H.; funding acquisition, P.-H.H. All authors have read and agreed to the published version of the manuscript.
Funding
This research received no external funding.
Institutional Review Board Statement
The study was conducted according to the guidelines of the Declaration of Helsinki, and approved by the National Cheng Kung University Governance Framework for Human Research Ethics (REC no. 102-097, approved on 23 January 2014).
Informed Consent Statement
Informed consent was obtained from all participants involved in the study.
Data Availability Statement
Not applicable.
Acknowledgments
We thank Mind Research and Imaging Center (MRIC) at National Cheng-Kung University for the consultation and instrument availability. MRIC is supported by the Ministry of Science and Technology of Taiwan.
Conflicts of Interest
The authors declare no conflict of interest. The funders had no role in the design of the study; in the collection, analyses, or interpretation of data; in the writing of the manuscript, or in the decision to publish the results.
Appendix A
Survey items—brand attitude (1–5), the functional image of brand (6–11), the experiential image of brand (12–17), the symbolic image of brand (18–23).
- (1)
- I love this brand.
- (2)
- (removed) I think this brand meets my needs.
- (3)
- I have a clear understanding of this brand.
- (4)
- I feel unique when I purchase this brand.
- (5)
- I think this brand is very different from the other brands.
- (6)
- The product information and functionality provided by this brand are practical.
- (7)
- The product information and functionality provided by this brand are reliable.
- (8)
- (removed) I understand the information and functionality provided by this brand.
- (9)
- I remember the information and functionality provided by this brand.
- (10)
- The product information and functionality provided by this brand are special.
- (11)
- (removed) I feel that this brand provides information and functionality that are NOT provided by other brands.
- (12)
- I feel special when I use this brand.
- (13)
- I feel happy when I use this brand.
- (14)
- I feel relaxed when I use this brand.
- (15)
- I understand my feelings when I use this brand.
- (16)
- (removed) I feel like my feelings have a connection with this brand.
- (17)
- I don’t have special feelings toward any particular brand.
- (18)
- I think I keep up with the trend when I use this brand.
- (19)
- (removed) I think the style of this brand matches mine.
- (20)
- I think people who use this brand are similar to each other.
- (21)
- I understand what kind of people use this brand.
- (22)
- I think people who use this brand are special.
- (23)
- I think people who use this brand can express their personality.

Table A1.
Descriptive statistics of each survey item.
| Item | N | Minimum | Maximum | Mean | Std. Deviation |
|---|---|---|---|---|---|
| (1) | 12 | 5.00 | 7.00 | 5.7500 | 0.62158 |
| (2) | 12 | 4.00 | 6.00 | 5.6667 | 0.65134 |
| (3) | 12 | 4.00 | 7.00 | 5.6667 | 0.98473 |
| (4) | 12 | 4.00 | 7.00 | 5.9167 | 0.99620 |
| (5) | 12 | 5.00 | 7.00 | 5.8333 | 0.71774 |
| (6) | 12 | 5.00 | 7.00 | 6.1667 | 0.57735 |
| (7) | 12 | 5.00 | 7.00 | 6.0833 | 0.66856 |
| (8) | 12 | 4.00 | 7.00 | 5.7500 | 1.05529 |
| (9) | 12 | 4.00 | 7.00 | 5.0833 | 0.99620 |
| (10) | 12 | 4.00 | 7.00 | 5.3333 | 0.88763 |
| (11) | 12 | 3.00 | 7.00 | 5.0000 | 1.27920 |
| (12) | 12 | 5.00 | 7.00 | 5.7500 | 0.86603 |
| (13) | 12 | 4.00 | 7.00 | 5.8333 | 1.11464 |
| (14) | 12 | 4.00 | 7.00 | 5.3333 | 0.98473 |
| (15) | 12 | 4.00 | 7.00 | 5.4167 | 0.90034 |
| (16) | 12 | 2.00 | 6.00 | 4.1667 | 1.02986 |
| (17) | 12 | 2.00 | 7.00 | 5.0000 | 1.34840 |
| (18) | 12 | 4.00 | 7.00 | 5.9167 | 0.90034 |
| (19) | 12 | 5.00 | 7.00 | 5.9167 | 0.79296 |
| (20) | 12 | 4.00 | 7.00 | 5.2500 | 1.13818 |
| (21) | 12 | 1.00 | 6.00 | 4.1667 | 1.33712 |
| (22) | 12 | 3.00 | 7.00 | 4.8333 | 1.11464 |
| (23) | 12 | 4.00 | 7.00 | 4.9167 | 0.99620 |
Table A2.
Independent samples t-test by gender.
| Variances Assumed Equal or Not | Levene’s Test for Equality of Variances | t-Test for Equality of Means | Homogeneity | ||||
|---|---|---|---|---|---|---|---|
| F | Sig. | t | df | Sig. | |||
| Brand attitude | Equal | 1.781 | 0.212 | 1.016 | 10 | 0.334 | Homogeneity |
| Not Equal | 1.083 | 10.000 | 0.304 | ||||
| Functional image of the brand | Equal | 1.645 | 0.229 | 0.705 | 10 | 0.497 | Homogeneity |
| Not Equal | 0.665 | 6.903 | 0.528 | ||||
| Experiential image of the brand | Equal | 5.293 | 0.044 | −0.487 | 10 | 0.636 | Homogeneity |
| Not Equal | −0.536 | 9.652 | 0.604 | ||||
| Symbolic image of the brand | Equal | 0.177 | 0.683 | 0.255 | 10 | 0.804 | Homogeneity |
| Not Equal | 0.248 | 7.801 | 0.811 | ||||
Table A3.
Independent samples t-test by gender.
| Survey Item | Item-to-Total Correlation | Cronbach’s α |
|---|---|---|
| Brand attitude (1) | 0.699 * | 0.629 (0.540 before removal) |
| (2) | 0.251 | |
| (3) | 0.780 ** | |
| (4) | 0.676 * | |
| (5) | 0.509 | |
| Functional image of brand (6) | 0.451 | 0.529 (0.183 before removal) |
| (7) | 0.466 | |
| (8) | 0.318 | |
| (9) | 0.714 ** | |
| (10) | 0.423 | |
| (11) | 0.397 | |
| Experiential image of brand (12) | 0.660 * | 0.810 (0.196 before removal) |
| (13) | 0.885 ** | |
| (14) | 0.683 * | |
| (15) | 0.461 | |
| (16) | 0.196 | |
| (17) | 0.898 ** | |
| Symbolic image of brand (18) | 0.644 * | 0.804 (0.779 before removal) |
| (19) | 0.392 | |
| (20) | 0.728 ** | |
| (21) | 0.759 ** | |
| (22) | 0.780 ** | |
| (23) | 0.790 ** |
The items in gray were removed from the survey. *: p < 0.05, **: p < 0.01.
References
- Lucking-Reiley, D. Auctions on the internet: What’s being auctioned, and how? J. Ind. Econ. 2000, 48, 227–252. [Google Scholar] [CrossRef]
- Ling, J.; Zhilin, Y.; Minjoon, J. Measuring consumer perception of online shopping convenience. J. Serv. Manag. 2013, 25, 191–214. [Google Scholar]
- Luo, J.; Ba, S.; Zhang, H. The effectiveness of online shopping characteristics and well-designed websites on satisfaction. MIS Q. 2012, 36, A1–A9. [Google Scholar] [CrossRef]
- Absolute Markets Insights. Available online: https://www.prnewswire.com/in/news-releases/online-auction-market-by-current-industry-status-growth-opportunities-top-key-players-and-forecast-till-2028-a-report-by-absolute-markets-insights-875226989.html (accessed on 28 November 2020).
- Dagher, A. Shopping centers in the brain. Neuron 2007, 53, 7–8. [Google Scholar] [CrossRef] [PubMed] [Green Version]
- Knutson, B.; Rick, S.; Wimmer, G.E.; Prelec, D.; Loewenstein, G. Neural predictors of purchases. Neuron 2007, 53, 147–156. [Google Scholar] [CrossRef] [Green Version]
- Sanfey, A.G.; Loewenstein, G.; McClure, S.M.; Cohen, J.D. Neuroeconomics: Cross-currents in research on decision-making. Trends Cogn. Sci. 2006, 10, 108–116. [Google Scholar] [CrossRef]
- Thomas, V.M. Demand and dematerialization impacts of second-hand markets. J. Ind. Ecol. 2003, 7, 65–78. [Google Scholar] [CrossRef]
- Hawkins, D.I.; Best, R.J.; Coney, K.A.; Mookerjee, A. Customer Behavior: Building Marketing Strategy, 9th ed.; McGraw-Hill Irwin: Boston, MA, USA, 2007. [Google Scholar]
- Schiffman, L.G.; Wisenblit, J.L. Consumer Behaviour, 12th ed.; Prentice-Hall: Englewood Cliffs, NJ, USA, 2019. [Google Scholar]
- Christodoulides, G.; Chernaton, L.D. Dimensionalising on- and offline brands’ composite equity. J. Prod. Brand Manag. 2004, 13, 168–179. [Google Scholar] [CrossRef]
- Ailawadi, K.L.; Keller, K.L. Understanding retail branding: Conceptual insights and research priorities. J. Retail. 2004, 80, 331–342. [Google Scholar] [CrossRef]
- Huettel, S.A.; Song, A.W.; McCarthy, G. Functional Magnetic Resonance Imaging, 3rd ed.; Sinauer Association: Sunderland, MA, USA, 2014. [Google Scholar]
- Belliveau, J.W.; Kennedy, D.N.; McKinstry, R.C.; Buchbinder, B.R.; Weisskoff, R.M.; Cohen, M.S.; Vevea, J.M.; Brady, T.J.; Rosen, B.R. Functional mapping of the human visual-cortex by magnetic-resonance-imaging. Science 1991, 254, 716–719. [Google Scholar] [CrossRef]
- Lee, T.; Liu, H.L.; Tan, L.H.; Chan, C.C.; Mahankali, S.; Feng, C.M.; Gao, J.H. Lie detection by functional magnetic resonance imaging. Hum. Brain Mapp. 2002, 15, 157–164. [Google Scholar] [CrossRef] [PubMed]
- Loubinoux, I.; Pariente, J.; Boulanouar, K.; Carel, C.; Manelfe, C.; Rascol, O.; Celsisa, P.; Chollet, F. A single dose of the serotonin neurotransmission agonist paroxetine enhances motor output: Double-blind, placebo-controlled, fMRI study in healthy subjects. Neuroimage 2002, 15, 26–36. [Google Scholar] [CrossRef] [PubMed]
- Monti, M.; Vanhaudenhuyse, A.; Coleman, M.; Boly, M.; Pickard, J.; Tshibanda, L.; Owen, A.; Laureys, S. Willful modulation of brain activity in disorders of consciousness. N. Engl. J. Med. 2010, 362, 579–589. [Google Scholar] [CrossRef] [PubMed] [Green Version]
- Zeki, S.; Romaya, J.P. The brain reaction to viewing faces of opposite-and same-sex romantic partners. PLoS ONE 2010, 5, 1–8. [Google Scholar] [CrossRef] [Green Version]
- Keller, K.L. Conceptualizing, measuring, and managing customer-based brand equity. J. Mark. 1993, 57, 1–22. [Google Scholar] [CrossRef]
- McClure, S.M.; Li, J.; Tomlin, D.; Cypert, K.S.; Montague, L.M.; Montague, P.R. Neural correlates of behavioral preference for culturally familiar drinks. Neuron 2004, 44, 379–387. [Google Scholar] [CrossRef] [Green Version]
- Santos, J.P.; Seixas, D.; Brandão, S.; Moutinho, L. Investigating the role of the ventromedial prefrontal cortex in the assessment of brands. Front. Neurosci. 2011, 5, 1–8. [Google Scholar] [CrossRef] [Green Version]
- Deppe, M.; Schwindt, W.; Kraemer, J.; Kugel, H.; Plassmann, H.; Kenning, P.; Ringelstein, E.B. Evidence for a neural correlate of a framing effect: Bias-specific activity in the ventromedial prefrontal cortex during credibility judgments. Brain Res. Bull. 2005, 67, 413–421. [Google Scholar] [CrossRef]
- Breiter, H.C.; Aharon, I.A.; Kahneman, D.; Dale, A.; Shizgal, P. Functional imaging of neural responses to expectancy and experience of monetary gains and losses. Neuron 2001, 30, 619–639. [Google Scholar] [CrossRef] [Green Version]
- Erk, S.; Spitzer, M.; Wunderlich, A.P.; Galley, L.; Walter, H. Cultural objects modulate reward circuitry. Neuroreport 2002, 13, 2499–2503. [Google Scholar] [CrossRef]
- Fortunato, V.C.R.; Giraldi, J.D.M.E.; de Oliveira, J.H.C. A review of studies on neuromarketing: Practical results, techniques, contributions and limitations. J. Manag. Res. 2014, 6, 201–220. [Google Scholar] [CrossRef] [Green Version]
- Sanfey, A.G.; Rilling, J.K.; Aronson, J.A.; Nystrom, L.E.; Cohen, J.D. The neural basis of economic decision-making in the ultimatum game. Science 2003, 300, 1755–1758. [Google Scholar] [CrossRef] [PubMed] [Green Version]
- Deppe, M.; Schwindt, W.; Kugel, H.; Plassmann, H.; Kenning, P. Nonlinear responses within the medial prefrontal cortex reveal when specific implicit information influences economic decision making. J. Neuroimaging 2005, 15, 171–182. [Google Scholar] [CrossRef] [PubMed]
- Blackwell, R.D.; Miniard, P.W.; Engel, J.F. Consumer Behavior, 10th ed.; Cengage: New Delhi, India, 2017. [Google Scholar]
- Desmond, J.E.; Glover, G.H. Estimating sample size in functional MRI (fMRI) neuroimaging studies: Statistical power analyses. J. Neurosci. Methods 2002, 118, 115–128. [Google Scholar] [CrossRef] [Green Version]
- Hair, J.F.; Black, W.C.; Babin, B.J.; Anderson, R.E. Multivariate Data Analysis, 8th ed.; Cengage: Andover, UK, 2019. [Google Scholar]
- Reimann, M.; Schilke, O.; Weber, B.; Neuhaus, C.; Zaichkowsky, J. Functional magnetic resonance imaging in consumer research: A review and application. Psychol. Mark. 2011, 28, 608–637. [Google Scholar] [CrossRef]
- Montague, P.R.; King-Casas, B.; Cohen, J.D. Imaging valuation models in human choice. Annu. Rev. Neurosci. 2006, 29, 417–448. [Google Scholar] [CrossRef] [Green Version]
- Paulus, M.P.; Frank, L.R. Ventromedial prefrontal cortex activation is critical for preference judgments. Neuroreport 2003, 14, 1311–1315. [Google Scholar] [CrossRef]
- Schaefer, M.; Rotte, M. Thinking on luxury or pragmatic brand products: Brain responses to different categories of culturally based brands. Brain Res. 2007, 1165, 98–104. [Google Scholar] [CrossRef]
- Yoon, J.H.; Minzenberg, M.J.; Ursu, S.; Walter, R.; Wendelken, C.; Ragland, J.D.; Carter, C.S. Association of dorsolateral prefrontal cortex dysfunction with disrupted coordinated brain activity in schizophrenia: Relationship with impaired cognition, behavioral disorganization, and global function. Am. J. Psychiatry 2008, 165, 1006–1014. [Google Scholar] [CrossRef]
- Dimoka, A.; Pavlou, P.A.; Davis, F.D. NeuroIS: The potential of cognitive neuroscience for information systems research. Inf. Syst. Res. 2011, 22, 687–702. [Google Scholar] [CrossRef]
- Lee, N.; Broderick, A.J.; Chamberlain, L. What is ‘neuromarketing’? A discussion and agenda for future research. Int. J. Psychophysiol. 2007, 63, 199–204. [Google Scholar] [CrossRef] [PubMed]
- Solnais, C.; Andreu-Perez, J.; Sánchez-Fernández, J.; Andréu-Abela, J. The contribution of neuroscience to consumer research: A conceptual framework and empirical review. J. Econ. Psychol. 2013, 36, 68–81. [Google Scholar] [CrossRef] [Green Version]
- Javor, A.; Koller, M.; Lee, N.; Chamberlain, L.; Ransmayr, G. Neuromarketing and consumer neuroscience: Contributions to neurology. BMC Neurol. 2013, 13, 13. [Google Scholar] [CrossRef] [PubMed] [Green Version]
- Hubert, M.; Kenning, P. A current overview of consumer neuroscience. J. Consum. Behav. 2008, 7, 272–292. [Google Scholar] [CrossRef]
- Insights—Branding and Neuromarketing. Available online: http://aerinsight.com/assets/content/Branding%20and%20Neuromarketing.pdf (accessed on 28 November 2020).
- Dospinescu, O.; Percă-Robu, A.E. The analysis of e-commerce sites with eye-tracking technologies. Broad Res. Artif. Intell. Neurosci. 2017, 8, 85–100. [Google Scholar]
Figure 1.
This study’s conceptual model.

Figure 2.
Stimulation of two fMRI (functional magnetic resonance imaging) experiments. ((a): Modified Yahoo! Kimo auction; (b): Modified Ruten auction).
Figure 2.
Stimulation of two fMRI (functional magnetic resonance imaging) experiments. ((a): Modified Yahoo! Kimo auction; (b): Modified Ruten auction).

Figure 3.
One trial procedure.

Figure 4.
Significant activity in the MPFC (medial prefrontal cortex) during the anticipation of choice of SHPs (second-hand products) compared to new products ((left) Sagittal slice; (center) Coronal slice; (right) Horizontal slice).
Figure 4.
Significant activity in the MPFC (medial prefrontal cortex) during the anticipation of choice of SHPs (second-hand products) compared to new products ((left) Sagittal slice; (center) Coronal slice; (right) Horizontal slice).

Figure 5.
Significant activity in the right insula during the anticipation of choice of SHPs compared to new products ((left) Sagittal slice; (center) Coronal slice; (right) Horizontal slice).
Figure 5.
Significant activity in the right insula during the anticipation of choice of SHPs compared to new products ((left) Sagittal slice; (center) Coronal slice; (right) Horizontal slice).

Figure 6.
BOLD (blood-oxygen-level-dependent) time course of the MPFC.

Figure 7.
BOLD time course of the insula.

Figure 8.
Significant activity in the DLPFC (dorsolateral prefrontal cortex) during anticipation of choosing brand-name products compared to brand-less products ((left) Sagittal slice; (center) Coronal slice; (right) Horizontal slice).
Figure 8.
Significant activity in the DLPFC (dorsolateral prefrontal cortex) during anticipation of choosing brand-name products compared to brand-less products ((left) Sagittal slice; (center) Coronal slice; (right) Horizontal slice).

Figure 9.
BOLD time course of the DLPFC.

Table 1.
Mean and standard deviation values of the four parts of the survey.
| Part (Number of Items) | Mean | Std. Deviation |
|---|---|---|
| 1. Brand attitude (5) | 5.7667 | 0.48116 |
| 2. Functional image of brand (6) | 5.5694 | 0.41717 |
| 3. Experiential image of brand (6) | 5.2500 | 0.67607 |
| 4. Symbolic image of brand (6) | 5.1667 | 0.73168 |
Table 2.
Brain regions that show significant differences in activation between SHPs and new products.
Table 2.
Brain regions that show significant differences in activation between SHPs and new products.
| Brain Region | HEM | x | y | z | t | Numbers of Voxels |
|---|---|---|---|---|---|---|
| Associative visual cortex | R | 41 | −59 | 12 | 5.927933 | 967 |
| Dorsal anterior cingulate cortex | R | 8 | 22 | 36 | 5.618577 | 1739 |
| Insula | R | 38 | 16 | 0 | 4.749348 | 1581 |
| Inferior frontal gyrus | R | 44 | 10 | 24 | 4.322833 | 555 |
| Medial prefrontal cortex (MPFC) | L | −13 | 43 | 33 | 6.60035 | 316 |
| Premotor cortex | L | −13 | 16 | 57 | 4.687726 | 327 |
Note: n = 12; random effects. Results are reported on a statistical level of p < 0.01. The x, y, and z coordinates are Talairach coordinates of the peak activation voxel in the identified brain region. L, Left hemisphere; R, right hemisphere.
Table 3.
Brain regions with significant activation difference between viewing brand-name products and brand-less products.
Table 3.
Brain regions with significant activation difference between viewing brand-name products and brand-less products.
| Brain Region | HEM | x | y | z | t | Numbers of Voxels |
|---|---|---|---|---|---|---|
| Anterior prefrontal cortex | L | −22 | 52 | 6 | 5.237869 | 303 |
| Associative visual cortex | R | 44 | −59 | 15 | 7.486236 | 6875 |
| Dorsolateral prefrontal cortex | R | 14 | 49 | 30 | 6.423428 | 595 |
| Inferior frontal gyrus | L | −25 | 25 | 36 | 6.119789 | 1393 |
| Middle temporal gyrus | R | 53 | −8 | −12 | 7.197165 | 744 |
| Superior temporal gyrus | R | 53 | −50 | 0 | 5.240085 | 818 |
| Supramarginal gyrus | L | −68 | −26 | 24 | 5.76774 | 1049 |
| Ventral anterior cingulate cortex | L | −1 | 25 | 21 | 7.250696 | 4463 |
| Ventral posterior cingulate cortex | L | −4 | −56 | 21 | 8.991731 | 32848 |
Note: n = 12; random effects. Results are reported on a statistical level of p < 0.01 The x, y, and z coordinates are Talairach coordinates of the peak activation voxel in the identified brain region. L, Left hemisphere; R, right hemisphere.
Table 4.
Brain areas activated for different functions.
| Brain Area Process | DLPFC | VMPFC | MPFC | NAcc | Insular |
|---|---|---|---|---|---|
| Decision-Making | ✓ | ||||
| Risk | ✓ | ||||
| Loss | ✓ | ||||
| Rewards | ✓ | ✓ | |||
| Consumer Behavior | ✓ | ✓ |
✓: activated area. DLPFC: Dorsolateral Prefrontal Cortex; VMPFC: Ventromedial Prefrontal Cortex; MPFC: Medial Prefrontal Cortex; NAcc: Nucleus Accumbens; IPC: Inferior Parietal Cortices.
Publisher’s Note: MDPI stays neutral with regard to jurisdictional claims in published maps and institutional affiliations. |
© 2021 by the authors. Licensee MDPI, Basel, Switzerland. This article is an open access article distributed under the terms and conditions of the Creative Commons Attribution (CC BY) license (http://creativecommons.org/licenses/by/4.0/).
Share and Cite
MDPI and ACS Style
Hsieh, P.-H.; Chang, F.-N. Online Consumers’ Brain Activities When Purchasing Second-Hand versus New Products That Are Brand-Name or Brand-Less. Information 2021, 12, 56. https://0-doi-org.brum.beds.ac.uk/10.3390/info12020056
AMA Style
Hsieh P-H, Chang F-N. Online Consumers’ Brain Activities When Purchasing Second-Hand versus New Products That Are Brand-Name or Brand-Less. Information. 2021; 12(2):56. https://0-doi-org.brum.beds.ac.uk/10.3390/info12020056
Chicago/Turabian StyleHsieh, Pei-Hsuan, and Fang-Ning Chang. 2021. "Online Consumers’ Brain Activities When Purchasing Second-Hand versus New Products That Are Brand-Name or Brand-Less" Information 12, no. 2: 56. https://0-doi-org.brum.beds.ac.uk/10.3390/info12020056
Note that from the first issue of 2016, this journal uses article numbers instead of page numbers. See further details here.