
From 2D to VR Film: A Research on the Load of Different Cutting Rates Based on EEG Data Processing

1
Shanghai Film Academy, Shanghai University, Shanghai 200072, China
2
Shanghai Film Special Effects Engineering Technology Research Center, Shanghai 200072, China
3
Shanghai Institute for Advanced Communication and Data Science, Shanghai 200444, China
4
School of Communication and Information Engineering, Shanghai Institute of Biomedical Engineering, Shanghai University, Shanghai 200444, China
*
Author to whom correspondence should be addressed.
Information 2021, 12(3), 130; https://0-doi-org.brum.beds.ac.uk/10.3390/info12030130
Submission received: 6 January 2021
/
Revised: 14 March 2021
/
Accepted: 15 March 2021
/
Published: 17 March 2021
Abstract
:Focusing on virtual reality (VR) and film cutting, this study compared and evaluated the effect of visual mode (2D, VR) and cutting rate (fast, medium, slow) on a load, to make an attempt for VR research to enter the cognitive field. This study uses a 2 × 3 experimental research design. Forty participants were divided into one of two groups randomly and watched films with three cutting rates. The subjective and objective data were collected during the experiment. The objective results confirm that VR films bring more powerful alpha, beta, theta wave activities, and bring a greater load. The subjective results confirm that the fast cutting rate brings a greater load. These results provide a theoretical support for further exploring the evaluation methods and standards of VR films and improving the viewing experience in the future.
1. Introduction
Electroencephalogram (EEG) can measure the brain activity non-invasively in a real environment, and the measurement results change with the level of cognitive stimulation [1]. EEG is the most direct, simple, and rich source of information to understand the phenomena related to the brain electrical activity [2], thus it is suitable for evaluating the load of films.
Virtual reality (VR) technology changes the way of the film’s shooting and production, and VR films give viewers a better immersive experience. However, there is no suitable evaluation method and criteria for VR films, which makes it difficult to judge the quality of VR films objectively. As we all know, cutting is a way of creating the film’s rhythm, while cutting is related to the audience’s psychology closely.
The solution to these problems, whether VR or traditional 2D films, produce the same degree of load. Whether different cutting rates make the audience feel different levels of load or which cutting rate allows the audience to get a better experience, is crucial to the production and evaluation of VR films.
Based on cinemetrics, we focus on the load evaluation indicators of VR films and use a simple EEG study to study films objectively and quantitatively. Specifically, we combine the EEG signal processing analysis and subjective questionnaire analysis to research: (a) Whether VR films have a stronger load compared to traditional 2D films; (b) whether the cutting rate has an impact on the audience load, and the fast cutting rate produces a stronger load?
2. Related Work
2.1. Cutting Rates
In the film, the relationship between the emotion, story, and rhythm is inseparable, and the control of cutting rhythm is the bridge between the emotion and story. A film with a proper rhythm can always give the audience a strong sense of substitution. The vast majority of films are made up of shots, and shots are completed by a momentarily interrupted cutting. The cutting rate is the length of the shot, and can also be called the shot change frequency or the shot cutting frequency. Moreover, the cutting rate controls the cutting rhythm, and becomes the key to film fluency. The cutting rate is also related to the story and temporal and spatial expression of the film. Specifically, the shorter the shots, the higher the cutting rate, and the overall rhythm of the film tends to be intense and exciting. The longer the shots, the lower the cutting rate, and the overall rhythm of the film tends to be slow and peaceful. Therefore, a full research on the film cutting rate plays an important role in film art, enhances the artistry and appreciation of films, and promotes the renewal of film language concepts. At present, there is an emerging research field named cinemetrics in European and American film studies. In 2009, based on cinemetrics, Yuri Tsivian established an online statistical software and an open professional database called Cinematrics. Cinematrics helped address some issues which were helpful to the film history and the development of film theory [3].
Some studies focus on the impact of the film cutting rate on behavior and cognition. In 2017, a study by the University of Essex in UK found that children watching films with a fast cutting rate are more likely to shift their attention to toys, and a fast-paced film affected the preschool-aged children interactions with toys [4]. In 2019, the Institute of Psychiatry, Psychology, and Neuroscience at King’s College London studied the effects of film authenticity and rate on children’s attention and response inhibition. The results show that the authenticity of stories affects the inhibitory components of children’s executive functions, while the rate of the films does not. In addition, the interaction between the film authenticity and the rate affects attention [5]. On this basis, they explored the direct consequences of films of different rates on the behavior and neural activity in the process of response inhibition. Through the ERP analysis, they found that the rhythm of the film seems to affect behavior and inhibit related neural responses [6]. However, these studies are limited to the study of children’s attention and response inhibition, and do not mention the load. Additionally, the selected experimental materials are also limited to traditional 2D films.
2.2. Load Assessment Method Based on Spontaneous EEG
There are three main types of the load evaluation method: Subjective evaluation, work performance evaluation, and physiological measurement. Subjective evaluation is used to evaluate the task load level based on the subjective feelings of experimenters when the experiment is completed. At present, many studies use the NASA task load index (NASA-TLX) scale and the load level is expressed as the score of the NASA-TLX scale. The NASA-TLX scale has many advantages such as low cost and easy management [7,8,9]. Work performance evaluation can be divided into the main task evaluation and sub-task evaluation. Current researches focus more on the design of sub-tasks. Physiological measurement methods mainly include spontaneous brain electricity [10], event-related potentials [11], electrocardiogram [12,13], functional near-infrared spectroscopy [14], skin electricity [15], respiration, and other physiological signals related to the central nervous system activity directly or indirectly.
Research based on spontaneous EEG generally studies the changes in various frequency bands under different load levels. The EEG spectrum analysis is the most common method of the EEG analysis method. The EEG spectrum analysis can separate the original EEG signal into waves of different frequency bands. Nowadays, research shows that the energy of the theta wave (4–7 Hz), alpha wave (8–13 Hz), beta wave (14–30 Hz), and other EEG frequency bands is sensitive to changes in the load.
When people are more alert and perform more difficult tasks, the main component of the brain electrical activity tends to be the beta wave frequency band, in which the beta wave’s amplitude is low, while the beta wave’s frequency is high. When people are awake with low alertness, the alpha wave activity increases. When people are sleepy, the theta wave will be enhanced significantly. Research shows that the slow waves (delta and theta waves) of the EEG signal gradually increase, and the fast waves (alpha and beta waves) decrease gradually [16], when adults change from a normal state to a fatigue state.
2.3. Research Combining VR and EEG
EEG and VR are used in various studies. Dan used EEG to examine the cognitive load associated with the task of learning paper-folding (origami) by observing 2D or stereoscopic 3D displays, and found that participants with lower spatial abilities can benefit most from a 3D virtual world [17]. Qidwai used electroencephalogram (EEG) and electromyography (EMG), combined with virtual reality (VR) for the evaluation and rehabilitation of facial palsy, and the results show that the activation of facial muscles in patients improved gradually [18]. Sang compared sports, news, and advertisements in 2D and VR visual modes through EEG. Compared to the brainwaves of viewing 2D video, he found that beta waves were statistically significant. When watching VR there were differences in beta waves according to the program genre, and videos that were fast paced and more dynamic were more likely to show stronger beta waves [19]. It is worth mentioning that the cross-field cooperation between film and cognitive neuroscience is becoming a hot issue for researchers from both sides. Hasson studied intersubject synchronization of the cortical activity during natural vision in 2004, and proposed a research method called inter-subject correlation analysis (ISC) creatively in 2008. The method applies to functional magnetic resonance imaging (fMRI) [20]. What is more, Hasson proposed the concept of neurocinematics and that the impact of films on the audience can be measured by the brain activity. The connection between film studies and cognitive neuroscience is a great impetus to find the connection between neuroscience and art [21].
To sum up, the current research on the cutting rate is not aimed at VR films. The research on VR films combined with the EEG analysis does not focus on cutting rate factors. The number of VR works that can be used for the research is limited, and the research methods are not mature yet. The research on the cutting rate of VR films requires more appropriate research methods and more objective data support.
3. VR and 2D Load Comparison Experiment Based on EEG Data
In order to study the different responses of human brain signals when watching films with different visual modes and different cutting rates, this paper sets up a set of brain electrical experiments based on the visual evoked. Due to the complexity of the experimental design, there are some problems that affect the human comfort. The participants need to wear a variety of data acquisition equipment, and stay in a closed space in summer. In order to solve these problems and minimize trial errors, we communicated with the participants when they wore the equipment, and ensured they determined the best equipment wearing state. At the same time, we also adopted some cooling and ventilation measures that did not affect the experiment. In addition, we conducted a pre-experiment with 15 participants in June 2019 to ensure that the problems are solved. In the experiment, we collected the EEG signals of 40 volunteers watching under 2D and VR viewing conditions through a test system built with Unity 2018.
Now, we introduce the experimental design in detail, and we use these experiments to obtain the required EEG data and subjective data.
3.1. Experimental Material
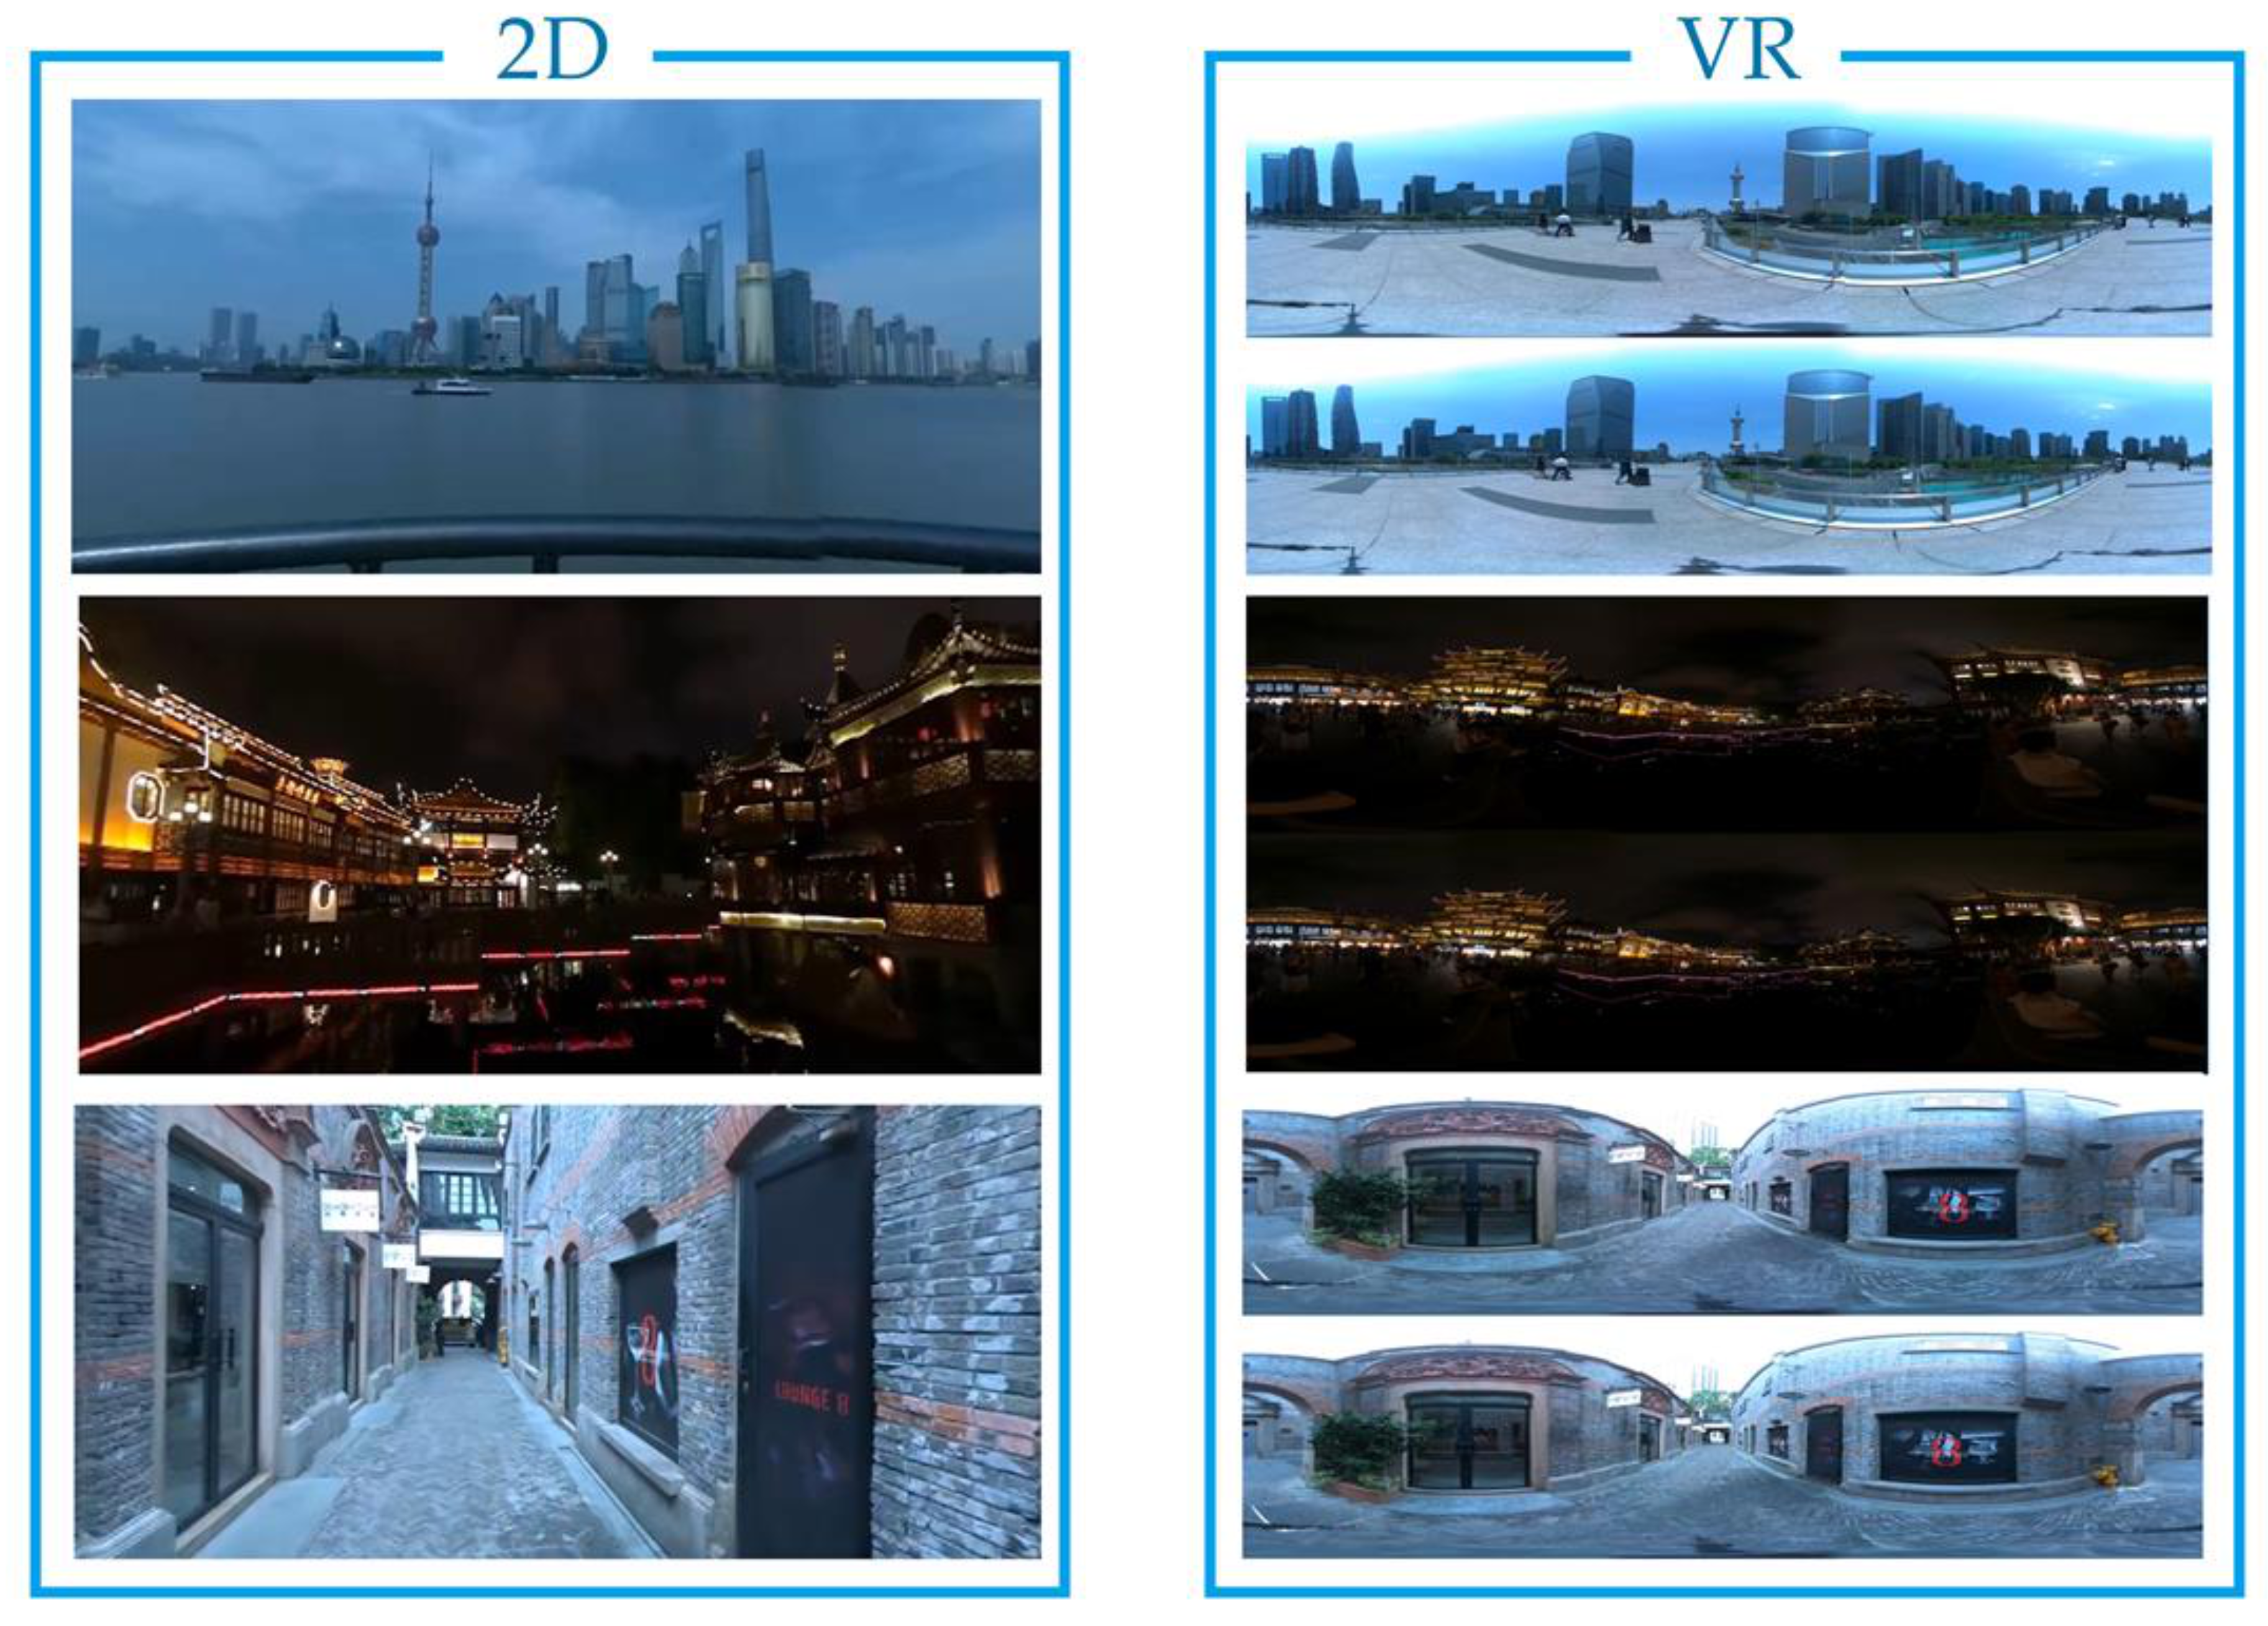
We use the film “Here is Shanghai” as the experimental material. The film was produced by our research group, and contains Shanghai style architecture and urban street scenes, as shown in Figure 1. The filming equipment is Nokia OZO. Due to the experimental requirements, the film is cut into fast, medium, and slow cutting rate films at intervals of 1, 2, and 4 s, respectively. They have the same content and background, and the duration of one film is 78 s. The resolution of the film is 4096 × 2048, the frame rate is 30 f/s, and the format adopts H.264 encoding.
3.2. Hardware Equipment
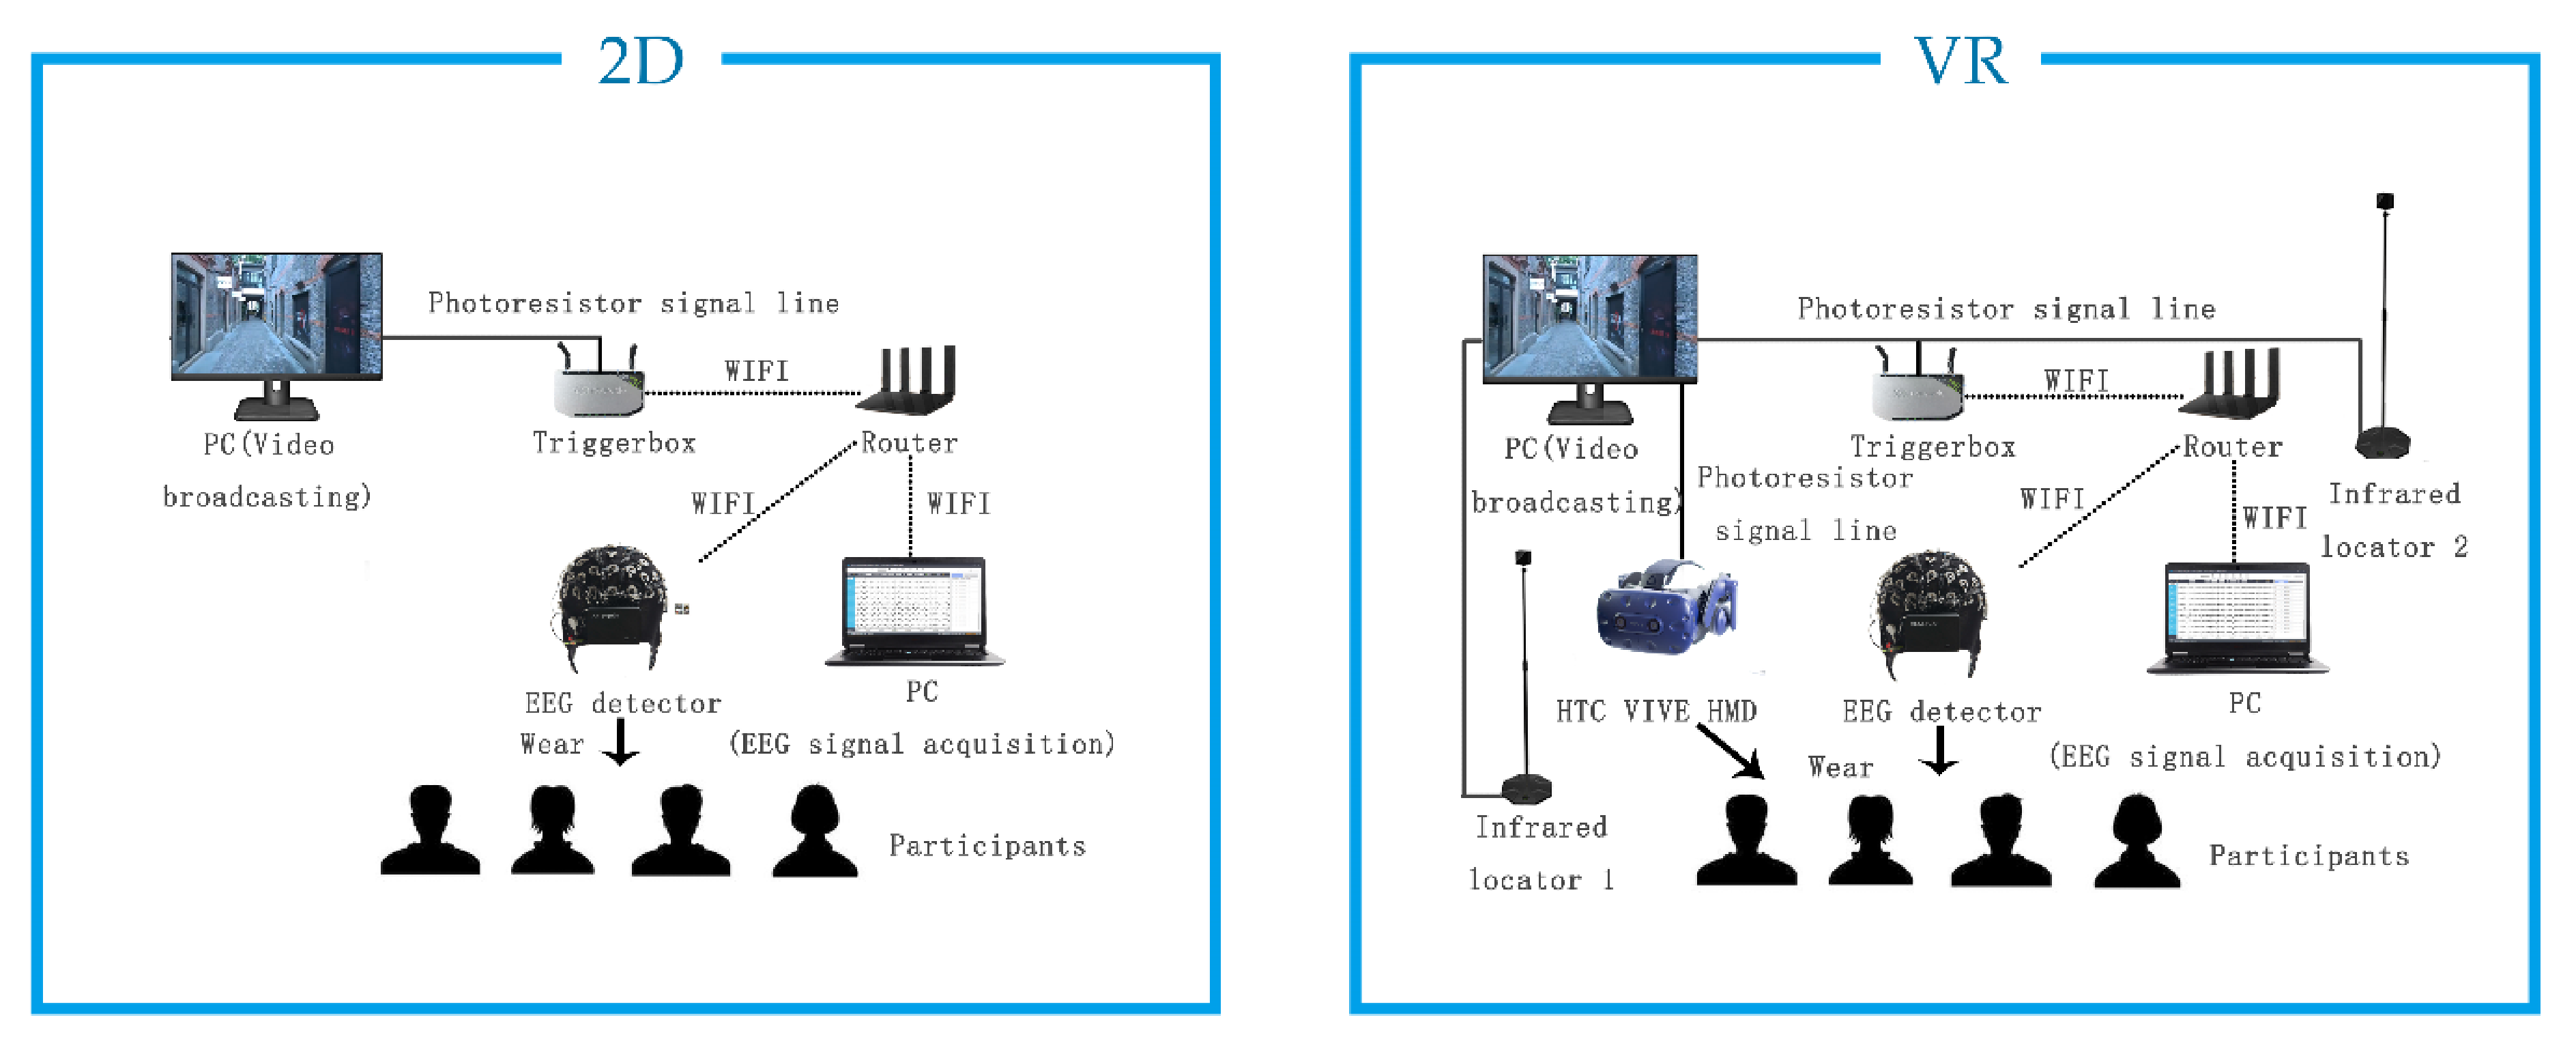
The VR environment was implemented in Unity 2018.1 and run on a PC equipped with a 3.4 GHz Intel Xeon E5-1230 v5 processor, 32 GB RAM, and NVidia GTX 1070D. In the experiment, we installed and used the AOC 24-inch LCD monitor and HTC VIVE. The EEG data were acquired through the Neuracle NeuSen W series wireless EEG acquisition system. The experimental equipment connection setup and transmission path are shown in Figure 2.
3.3. Participants
The participants in this experiment are 40 students from Shanghai University, 20 people belong to the VR group, while 20 people belong to the 2D group, and they are all right-handed. In the 2D experiment, there are 15 boys and 5 girls, with an average age of 23.47. In the VR experiment, there are 12 boys and 8 girls, with an average age of 22.90. Each participant has a normal or corrected vision, and no medical or mental illness. They gave a written informed consent before the start of the experiment. All data in the experiment are analyzed and reported anonymously.
3.4. Experiment Process
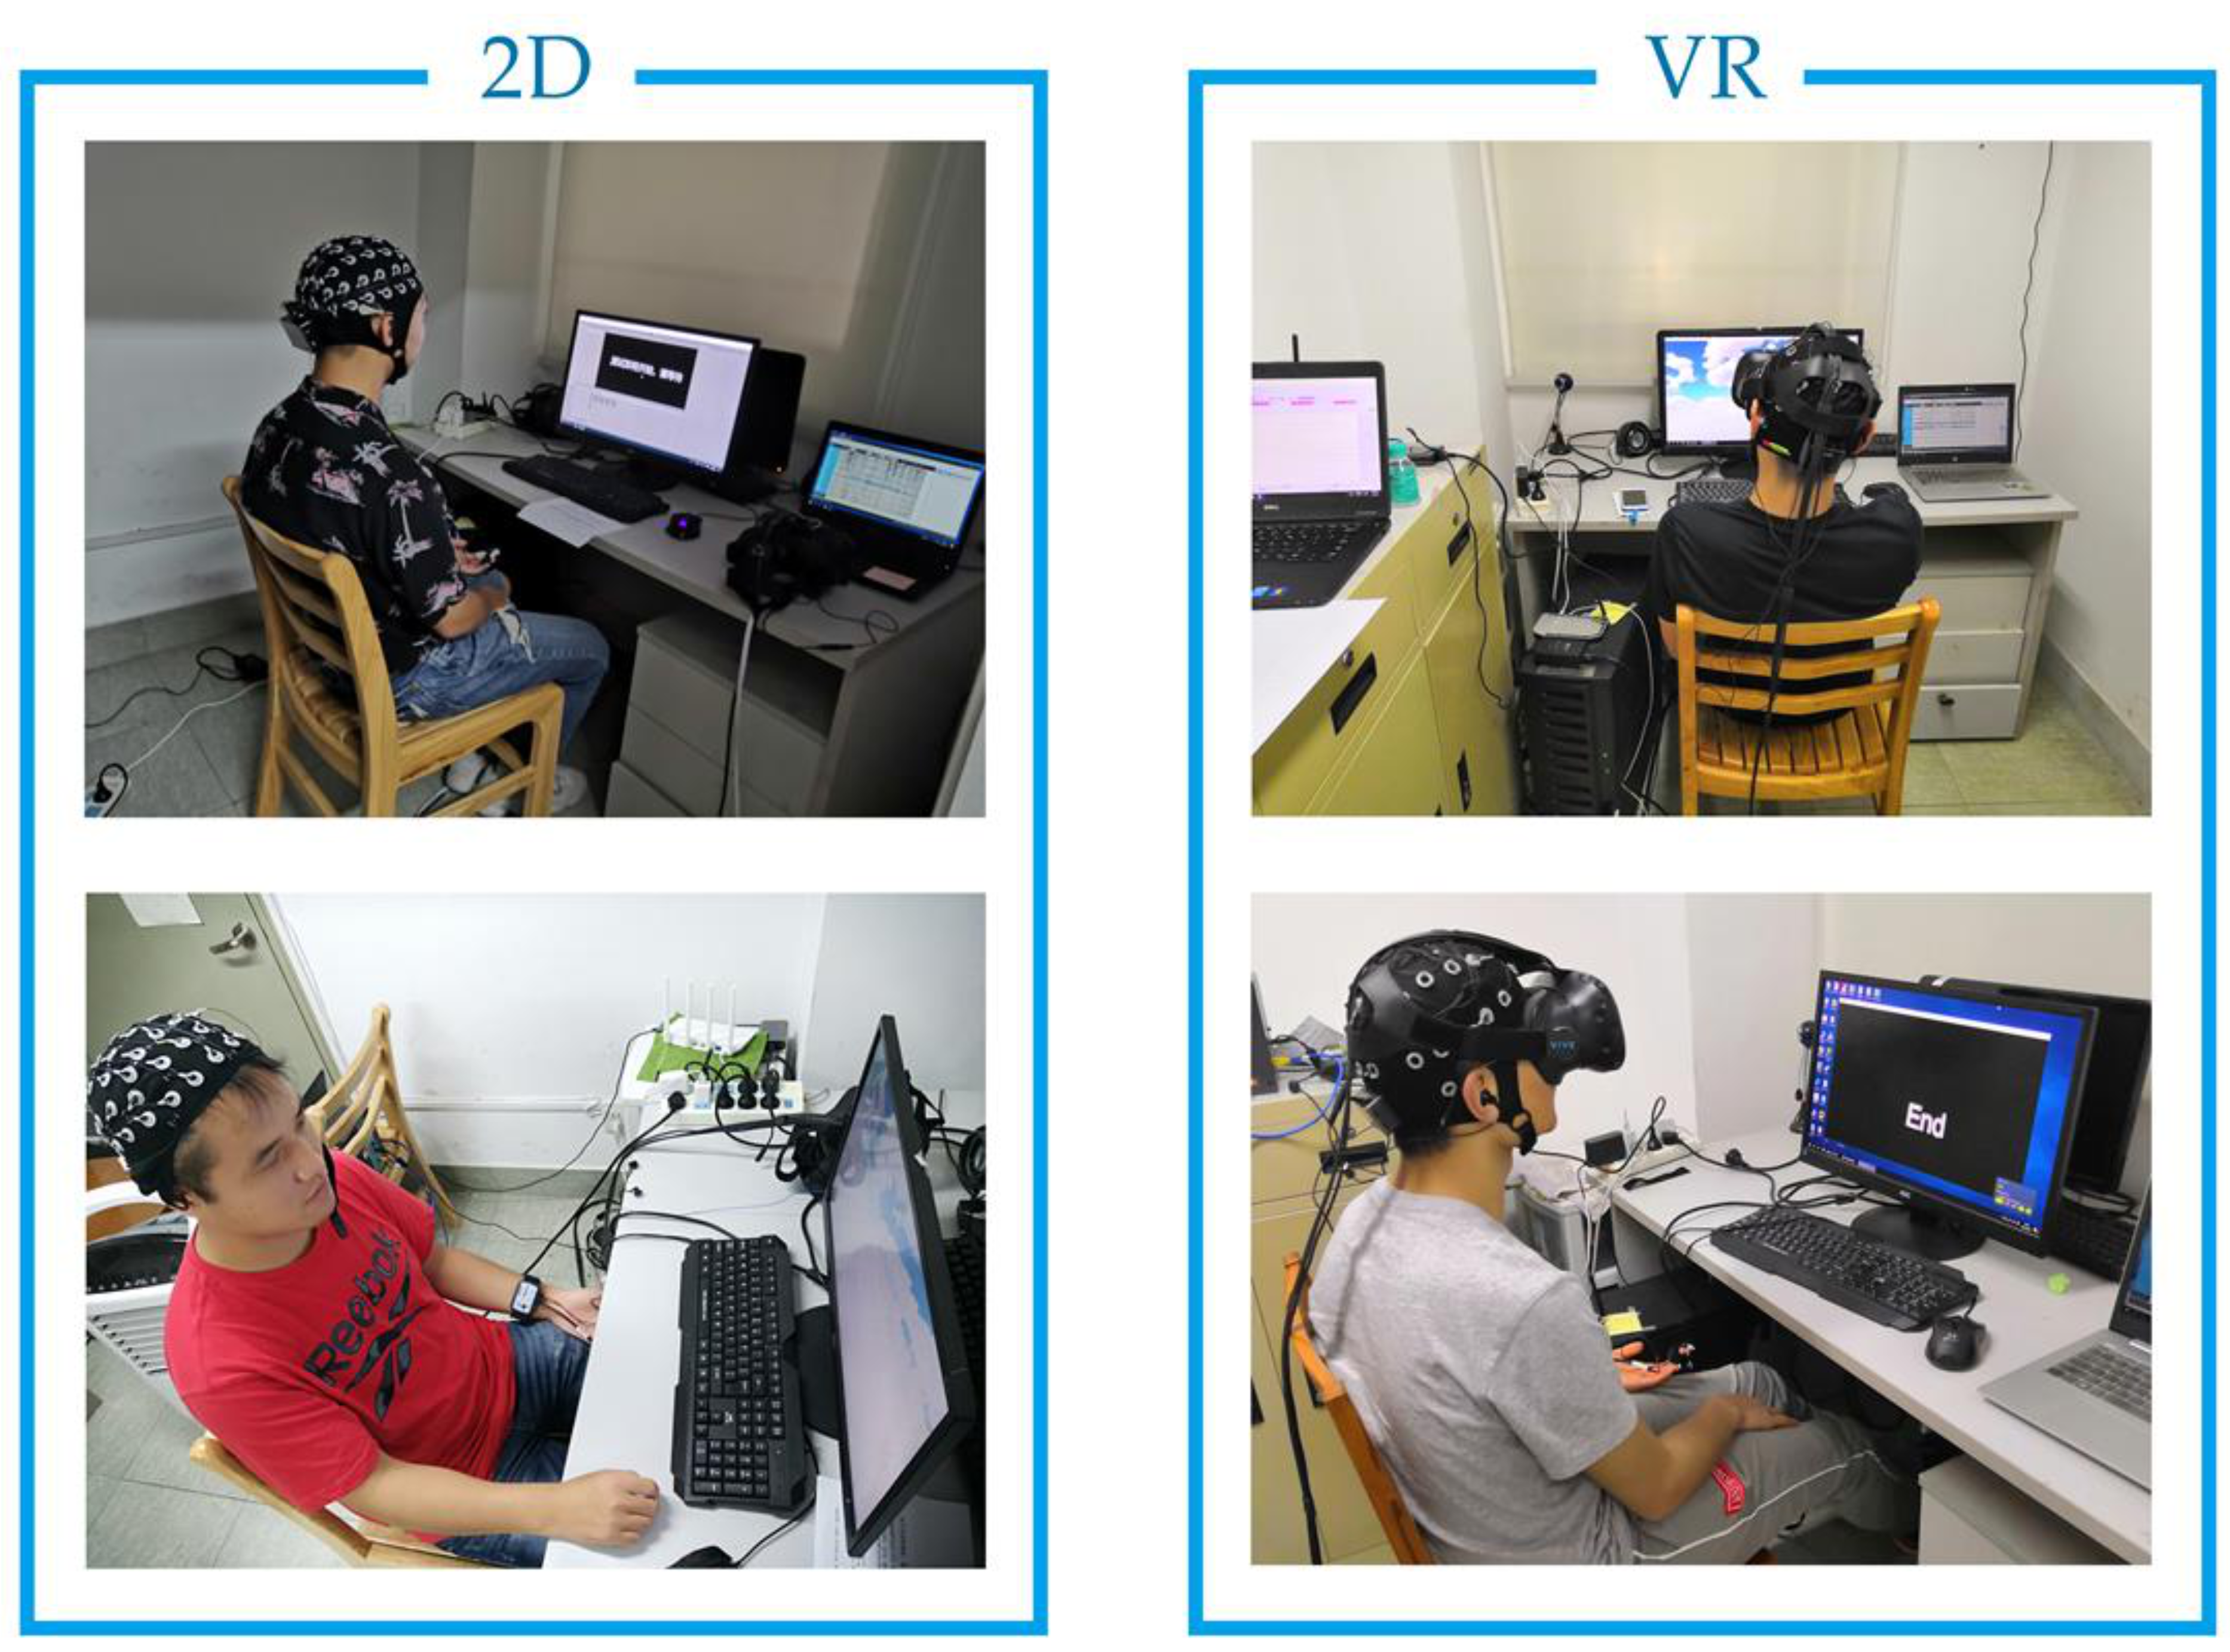
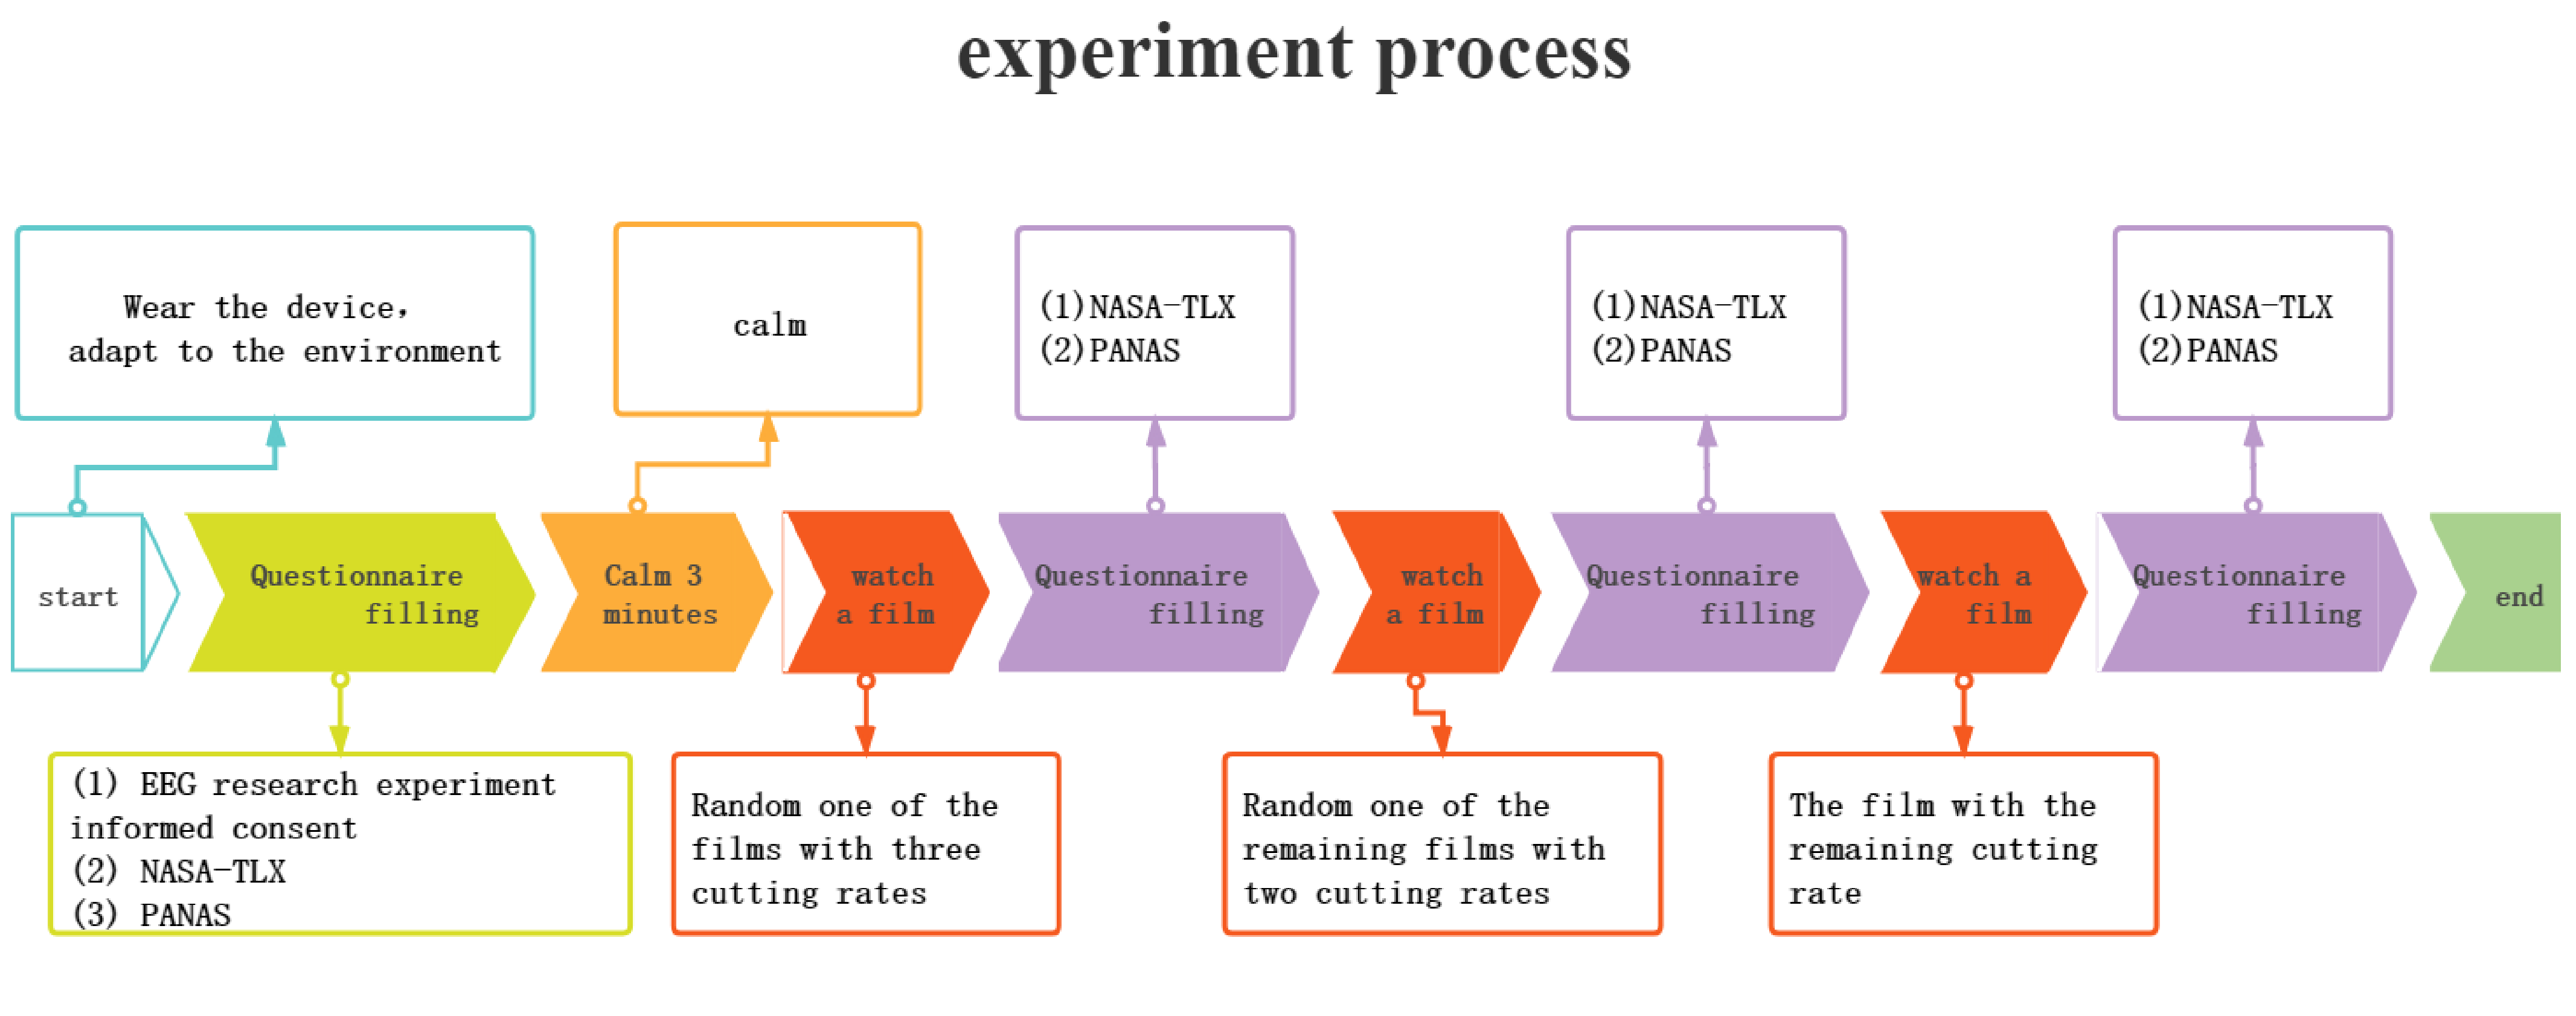
The experiment was conducted in a closed and non-interference dark environment, and the participants sat in a comfortable posture in front of the monitor. The participants wore 64-channel EEG caps distributed according to the international 10–20 system brain electrodes, and then we used a conductive paste to reduce impedance. After wearing the EEG collection equipment, participants in the 2D film group wore headphones and watched 2D films through the LCD display, while participants in the VR film group wore HTC VIVE and then wore headphones to watch VR films through HMD. The experimental scene is shown in Figure 3. Whether it was a 2D or VR film, the films of the three cutting rates were played randomly. The specific flow of the experiment is shown in Figure 4.
3.5. EEG Recording and Preprocessing
The EEG data were collected by Neuracle EEG Recorder v2.0.1, the sampling frequency was 1 kHz, the electrode impedance was less than 5 kΩ and stored in a pdf format. After that, we preprocessed the data through the MATLAB toolbox called EEGLAB. The steps are as follows. First, we removed five useless channels. Then, we proceeded to use the Basic FIR filter and notch filter for filtering. After that, we observed the waveform and interpolated the bad lead, removed the bad segment, and used the method of ICA [22] to remove the artifact component. Moreover, we completed the re-reference and removed the baseline [23]. The above steps were all done through EEGLAB. Finally, the data were divided into three sections, corresponding to the three cutting rates, respectively.
There were 34 cases of valid data obtained after preprocessing. After that, we used the wavelet transform to divide the preprocessed EEG data. For each data segment after preprocessing, the EEG signals of three different frequency bands were filtered out respectively: Theta (4–7 Hz), alpha (8–13 Hz), and beta (14–30 Hz). We took the sum of the squares of all points in the frequency band to represent the energy of the data segment in the frequency band. The frequency band energy calculation is shown in Formula (1):
Among them, k represents the number of data segments, here representing the number of trials. N represents the number of data points in each segment. The length of the film in this study is 78 s, so here N = 78,000, and represents the value of the i-th point of the k-th segment of data.
After that, we performed the statistical analysis on the energy of each frequency band, and compared the difference between VR and 2D films and compared the difference between cutting rates.
4. Results
We used the IBM SPSS 21 software for statistical analysis. If the statistical result p-value is less than 0.05, we will think that there is a statistical significant difference. Statistical significance means that any difference between two groups is due to the influence of system factors rather than accidental factors, and it represents the ability of groups to be distinguished from each other. If there is a significant difference between the data at different levels of a factor, it means that the factor will have an impact on the two sets of data. Here, we used the two-way repeated measures analysis, the intra-group factor was a rate (fast, medium, slow) and the inter-group factor was a mode (2D, VR).
4.1. Subjective Results
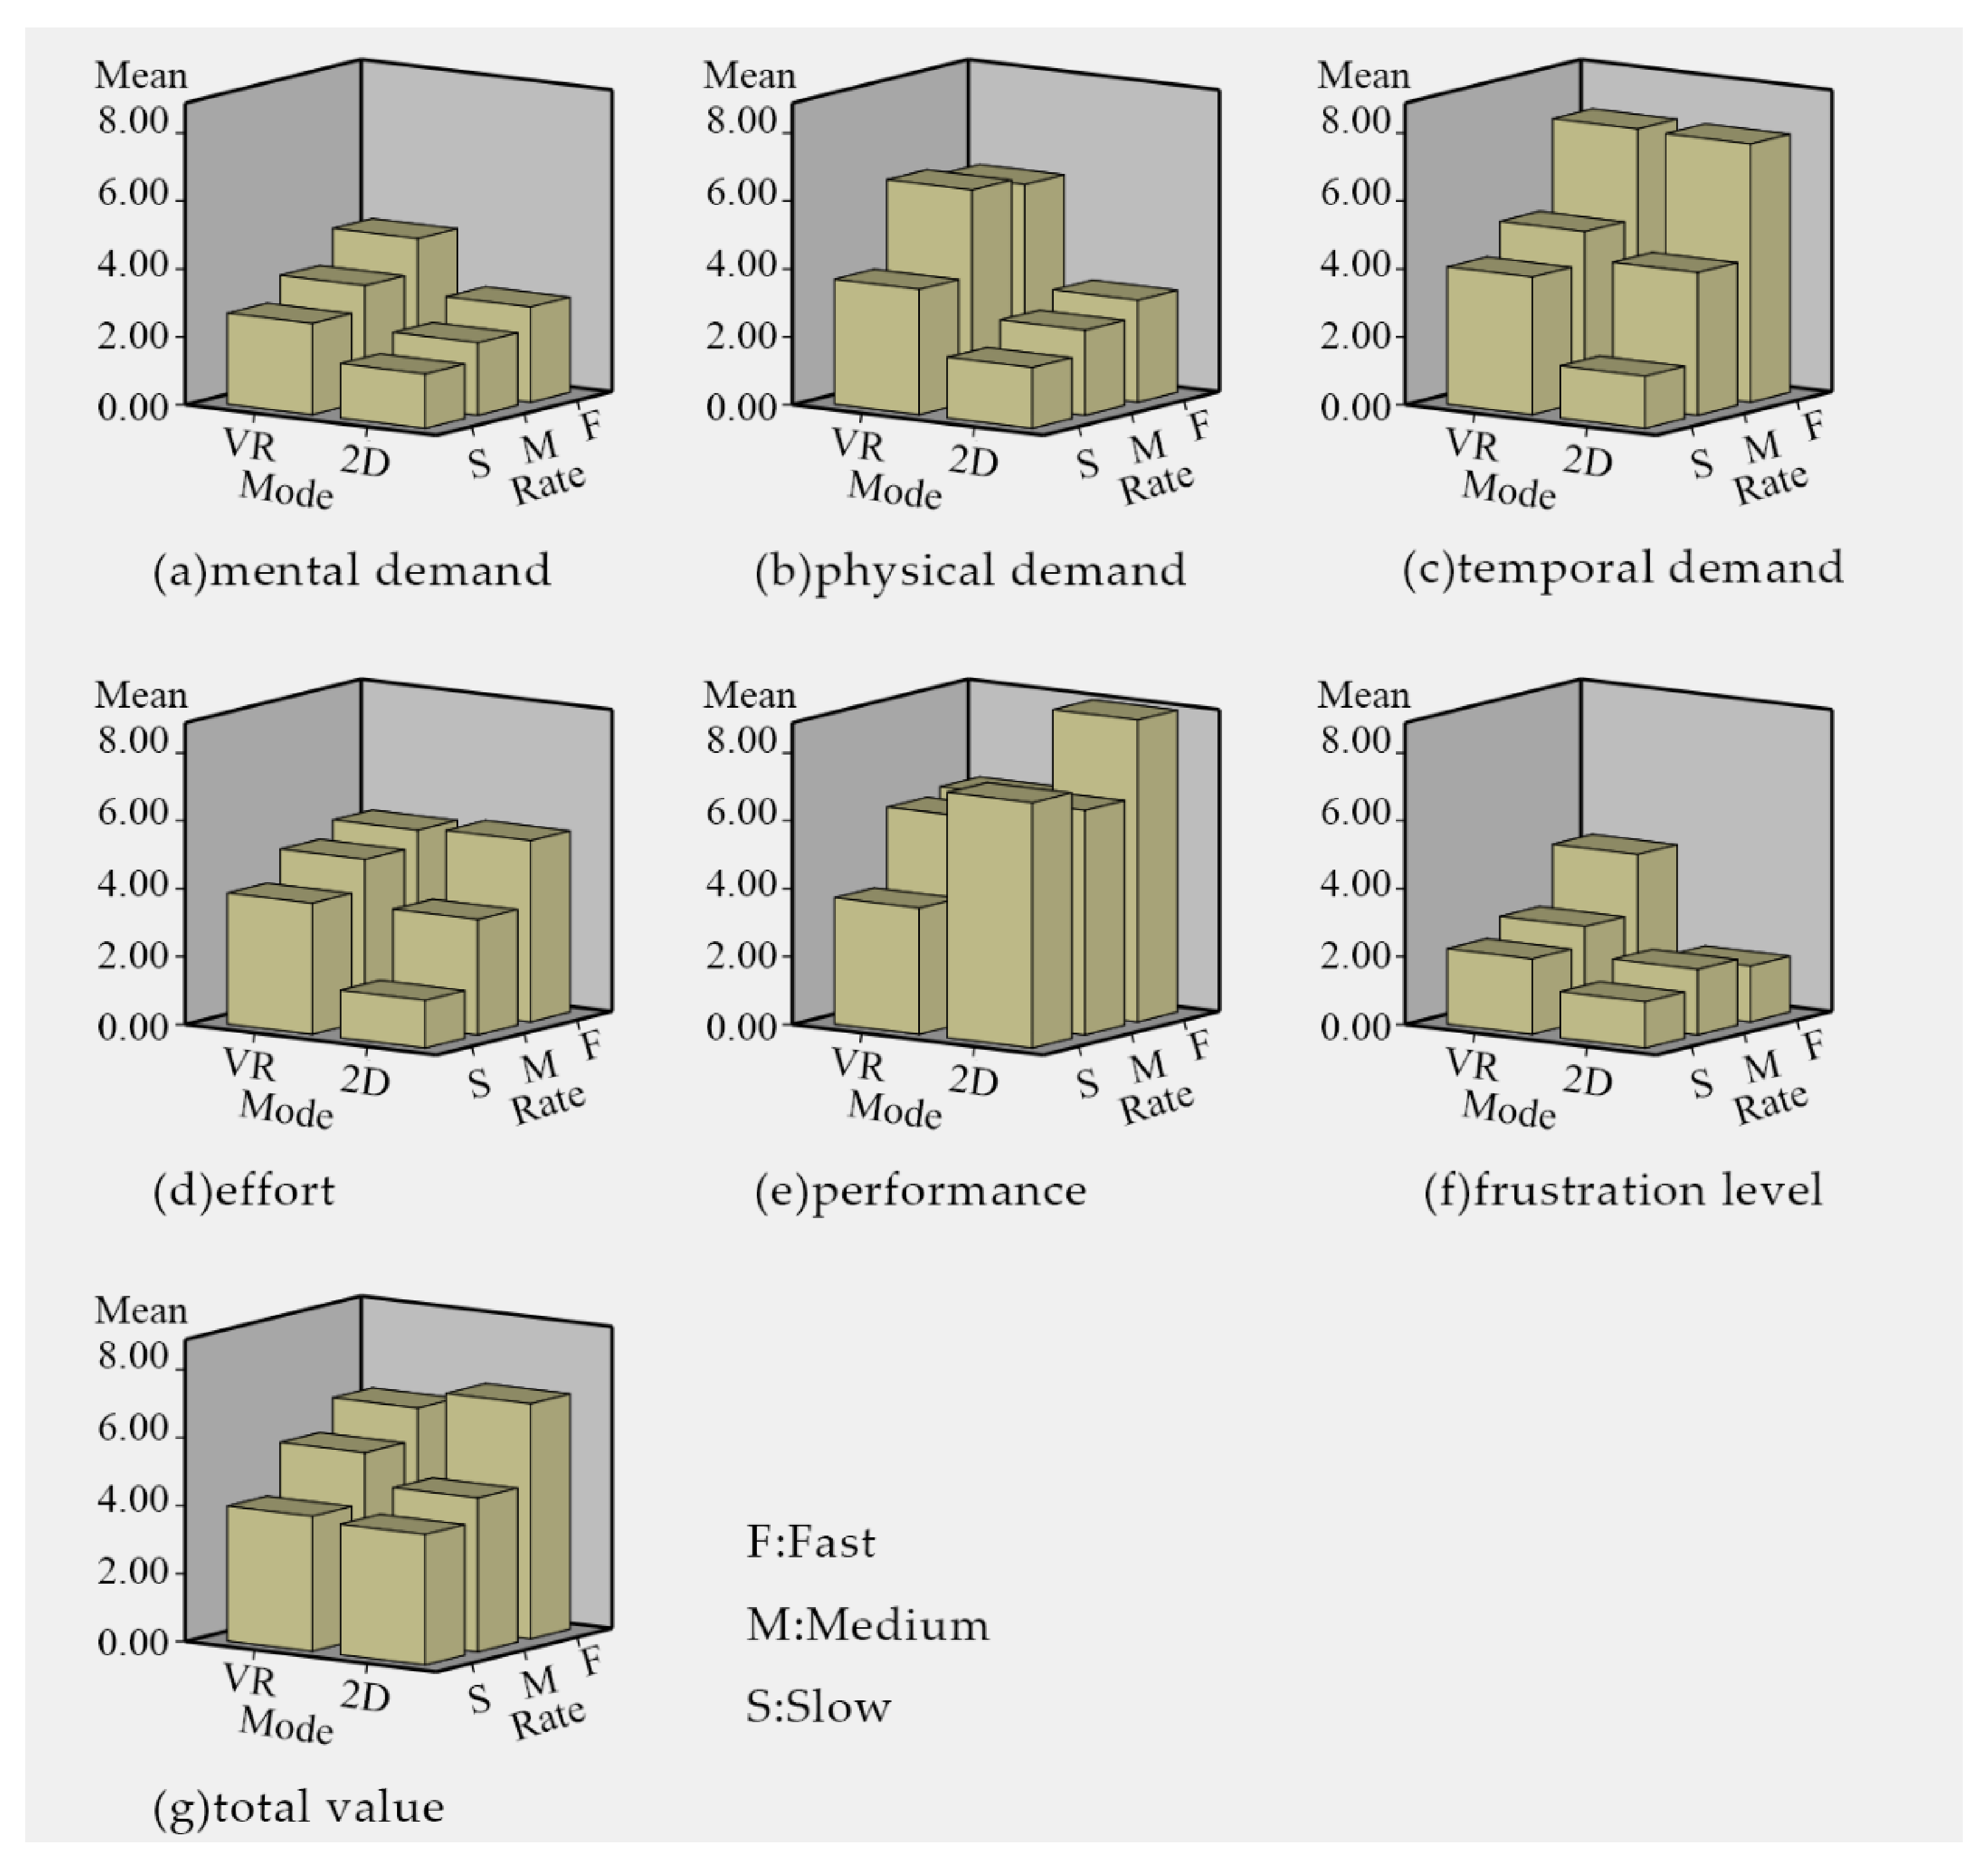
The NASA-TLX questionnaire evaluates the load felt by the experimenter from six factors: Mental demand, physical demand, time demand, effort, performance, and frustration level. Participants determine the weight of each factor through a pairwise comparison of these six factors. The scores of the six factors are weighed according to this weight to obtain the final total value. We analyzed the questionnaire scores of all participants who watched the film with the same mode and the same cutting rate, then took the average of the questionnaire scores. The average result of each group is shown in Figure 5. The statistical results are shown in Table 1.
In terms of human subjective perception, different viewing modes have statistical significance in the load of mental demand, physical demand, effort, and frustration level. The load brought by VR films is greater than that of 2D films significantly. Moreover, different rates have a statistical significance in the load of mental demand, physical demand, time demand, performance, frustration level, and total value. Films with fast cutting rates bring more load than films with slow cutting rates significantly. In particular, with regard to the total value, in the 2D film group, films with the fast cutting rate bring a much higher load than the medium and slow cutting rates, compared to the VR film group.
4.2. EEG Results
4.2.1. Statistics of Alpha, Beta, and Theta Waves
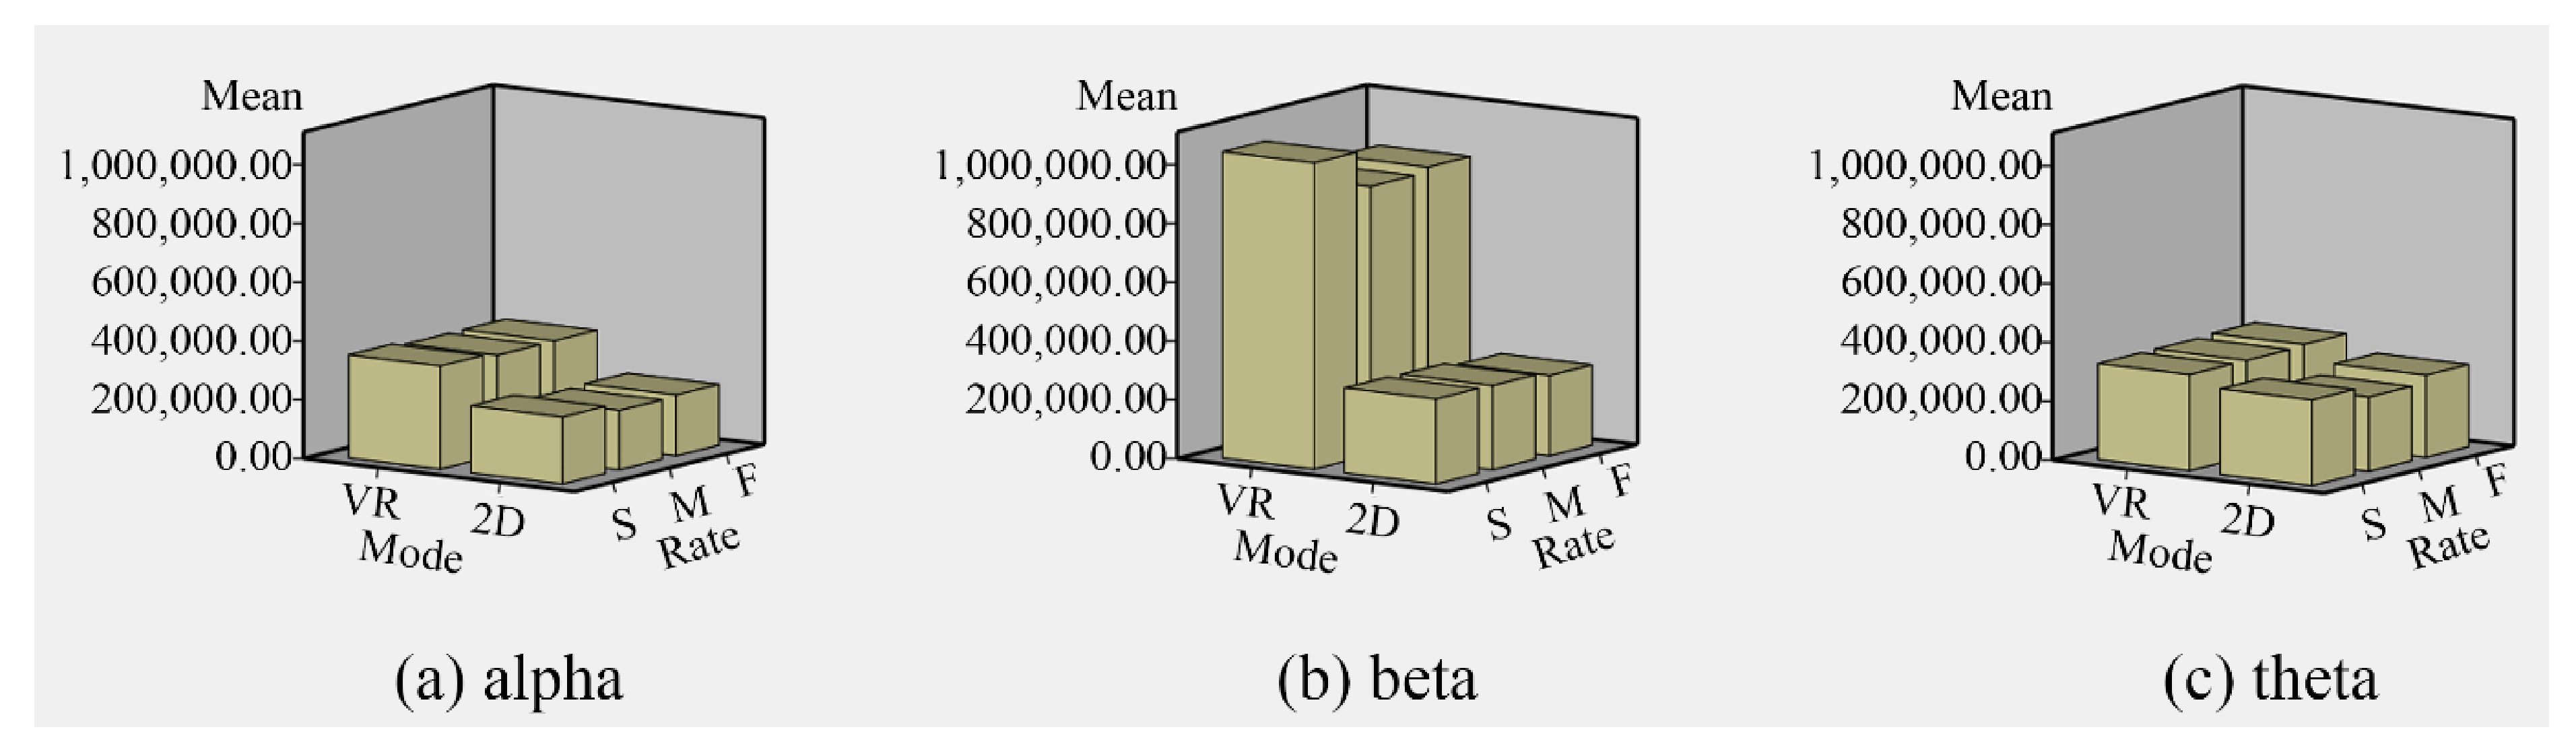
We analyzed the alpha, beta, and theta frequency bands of EEG in 2D and VR visual modes at three cutting rates. The mean value is shown in Figure 6, and the statistical results are shown in Table 2.
In the alpha wave frequency band, the main effect of the mode is significant, F (1, 30) = 10.357, p = 0.003 < 0.05, partial = 0.257, the alpha wave energy of the study subjects in the VR film group (343,116.288 ± 30,593.623) is significantly greater than that of the 2D film group (343,116.228 ± 30,593.623). Therefore, the statistical results show that the mode factor does affect the level of alpha wave energy in the brains of experimental participants, and the alpha wave energy of VR films is higher.
In the beta wave band, the main effect of mode is significant, F (1,30) = 29.424, p < 0.001, partial = 0.495. The beta wave energy of the study subjects in the VR film group (962,273.461 ± 88,606.353) is larger than that of the 2D film group (282,550.901 ± 388,606.353) significantly. Therefore, the statistical results show that the mode factor does affect the beta wave energy of the experimental participants’ brains, and the beta wave energy of VR films is higher. The results of the topographic map also indicate the difference between the VR and 2D film groups intuitively.
In the theta wave band, the interaction between the mode and rate is significant, p = 0.047 < 0.05, partial = 0.210. The simple effect analysis shows that the theta wave energy of the study subjects in the medium cutting rate group (252,331.257 ± 102,676.03826) was significantly lower than that of the slow cutting rate group (290,321.198 ± 113,635.16960) in the 2D film group, p = 0.001 < 0.05. Therefore, the statistical results show that the mode and the cutting rate will affect the brain theta wave energy of the experimental participants, and the slow cutting rate has a higher theta wave energy than the medium cutting rate in the 2D film group.
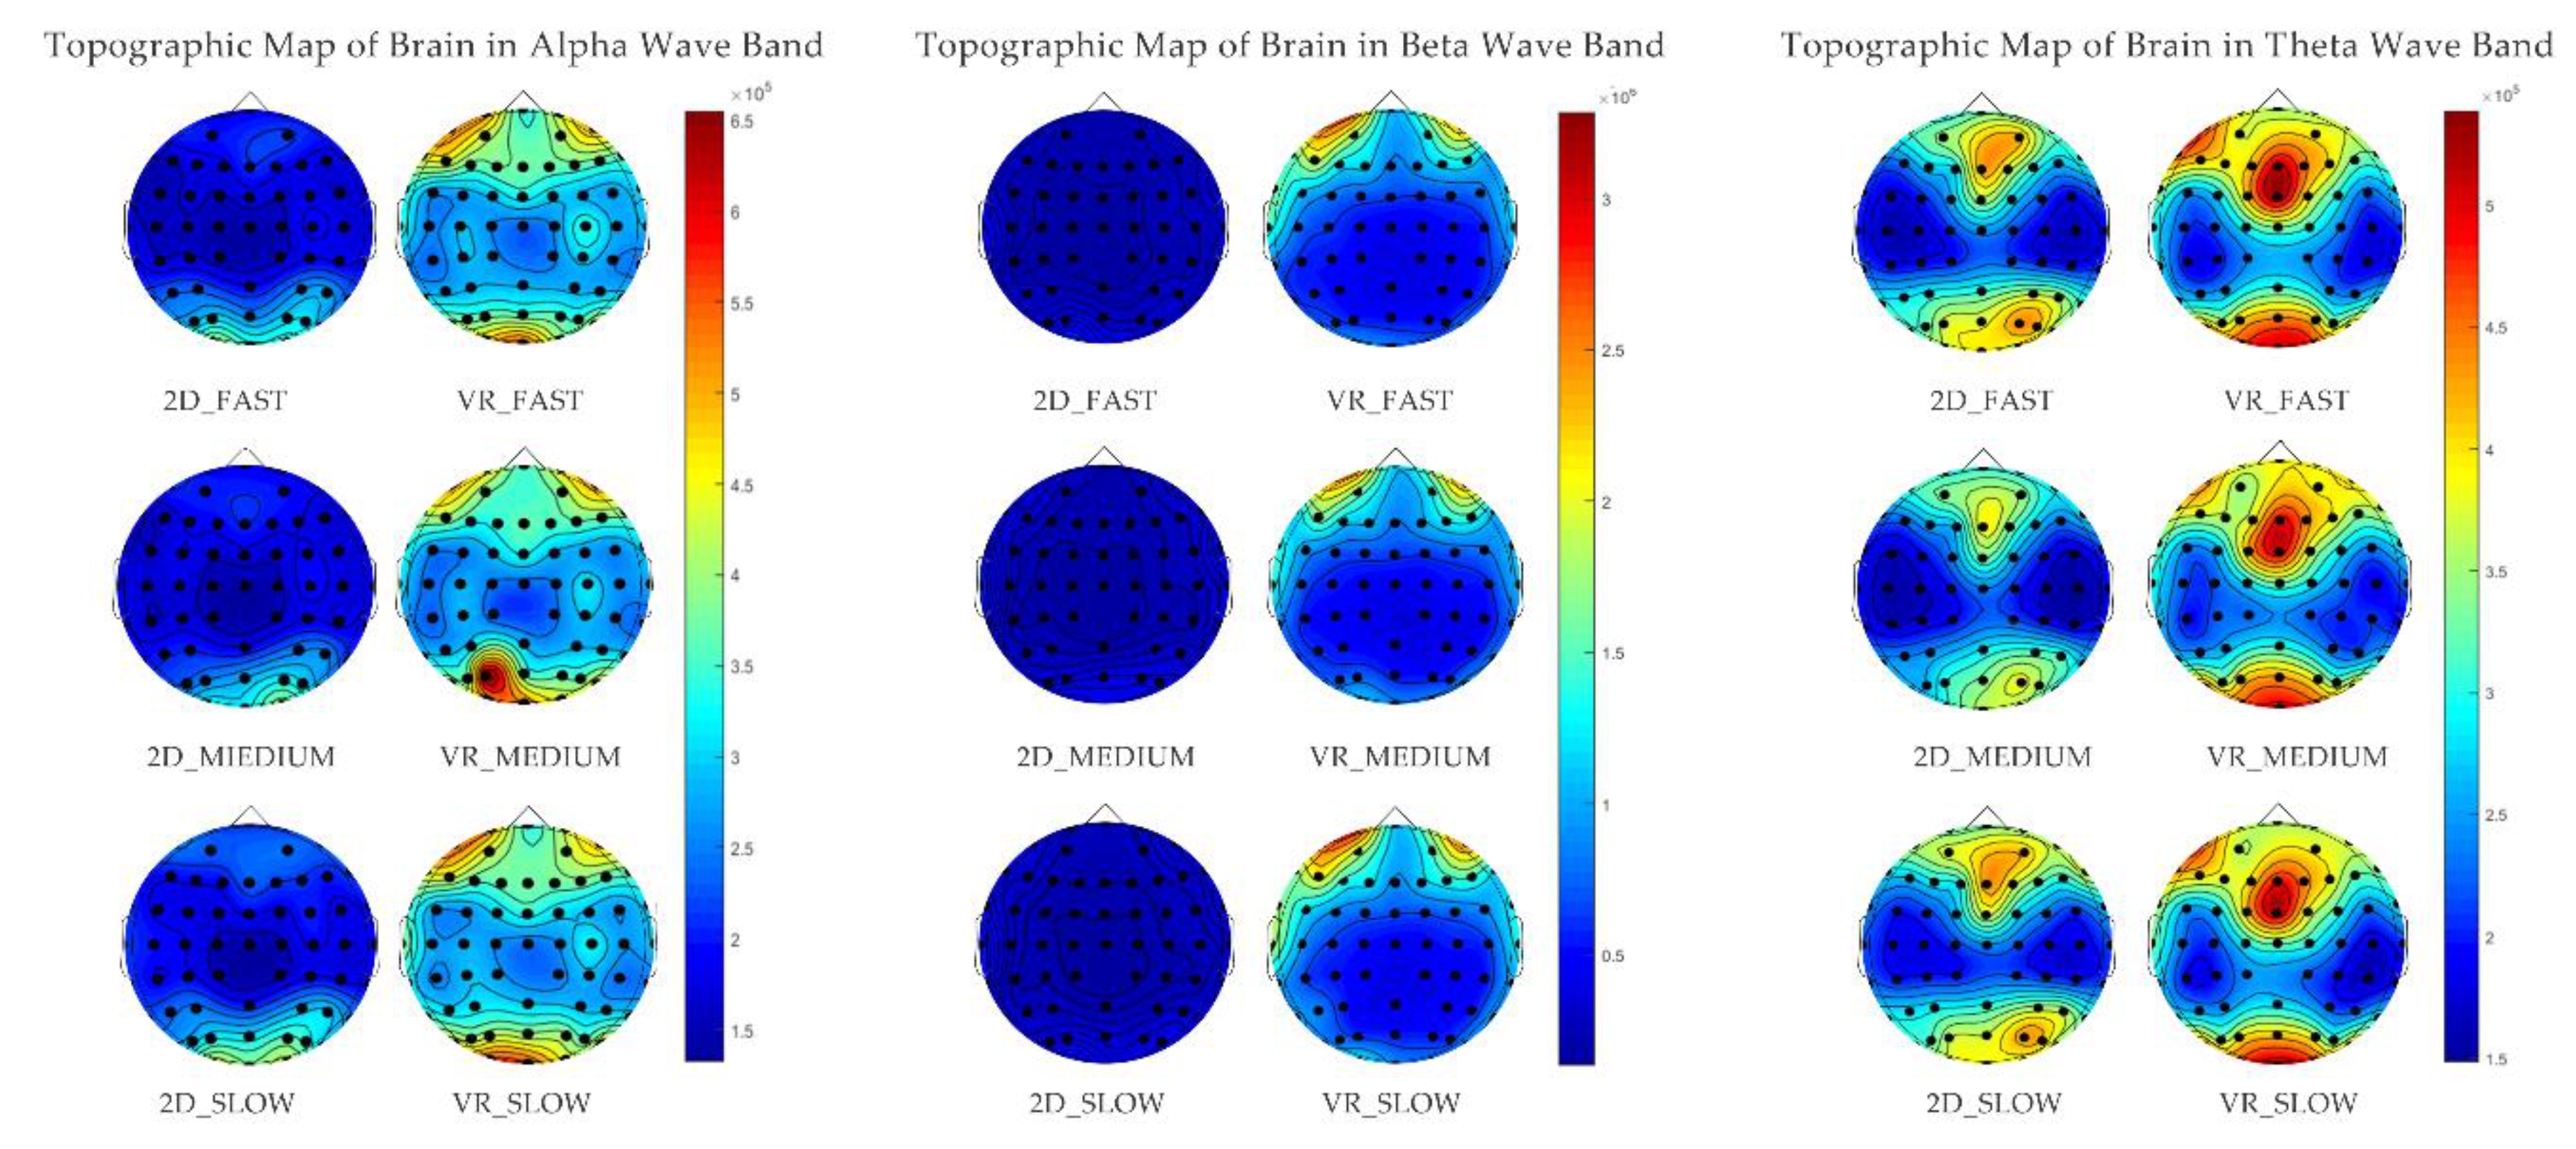
4.2.2. EEG Topographic Map
Figure 7 is a brain wave topographic map based on the average energy of all the subjects who watched 2D and VR movies. Throughout the map, red represents the higher wave activity, while blue represents the less brain wave activity. The VR film group is higher than the 2D film group generally, especially in the frontal lobe and the occipital lobe of the alpha wave, the frontal lobe of the beta wave, the frontal lobe, the occipital lobe, and the central area of the theta wave.
5. Discussion
5.1. Load and High Frequency Alpha, Beta, and Theta Waves
Previous research often interprets alpha waves as relaxation, imagination, visualization, memory, learning, and concentration. Beta waves are related to logic, critical thinking, stress, anxiety, and restlessness. Theta waves are related to mental fatigue and mental workload. The theta spectral power will increase with the increase in the demand for cognitive resources [24].
In terms of modes, the EEG analysis results and topographical maps show that the energy of the alpha, beta, and theta waves of the VR film group is higher than that of the 2D film group. The NASA-TLX results also show that the subjective load of the VR film group is higher than that of the 2D film group. The high alpha energy of the VR film group indicates that when watching VR movies, participants are more likely to focus on watching the film. However, the alpha wave activity, especially in the higher frequency range (10–13 Hz), is related to semantic information processing, especially searching, accessing, and retrieving information from long-term memory. Traditional theories are mainly aimed at verbal or image-based visual spatial task types, and whether new media forms such as virtual reality films are applicable remains to be further studied. In terms of beta wave activities, the energy of the VR film group is much higher than that of the 2D film group. We think that this is probably due to the fact that the panoramic frame of VR is larger than that of desktop 2D, and the viewing methods and equipment of helmet-mounted VR and desktop 2D are different, and the visual presentation of participants is different, as well. For the subjects, VR images will generally produce a strong stimulation in the brain. In terms of theta wave activities, the average power of the VR film group is higher than that of the 2D film group, which shows that VR films will bring more cognitive resources to the subjects. Moreover, due to the long duration of the experiment, the subjects may experience mental fatigue. The fatigue state is related to the length of time to complete the task (TOT) [25]. Usually, as the TOT increases, a person’s performance decreases and mental fatigue begins. In the long-term fatigue process, the PSD of alpha and theta wave in the occipital lobe and frontal lobe area was observed to increase significantly [26,27]. The result of the topographic map in Figure 6 accords with this conclusion.
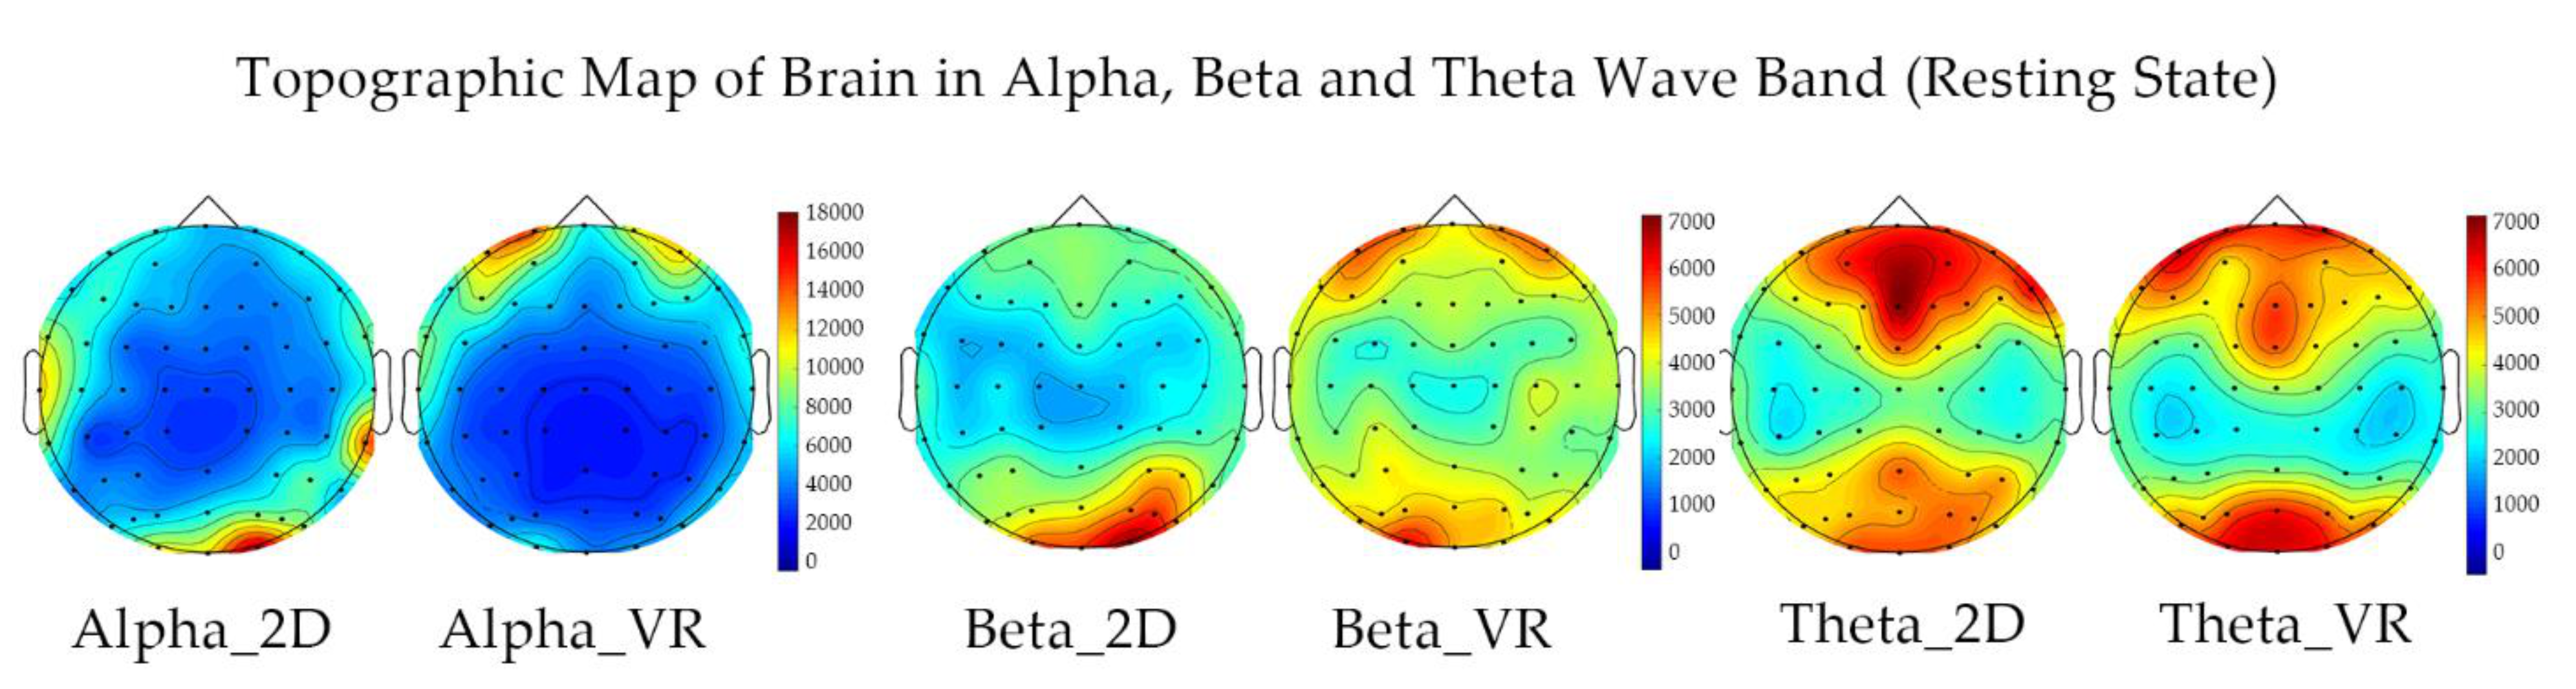
In order to verify whether the VR headset will affect the EEG, we analyze the resting state data in the two modes. At this time, the participants in the VR film group wore the VR headset but did not watch the VR film. The statistical results show that in the alpha, beta, and theta bands, the difference in energy between the VR film group and the 2D film group is not statistically significant (p > 0.05). Therefore, VR helmets will not affect the results of EEG, and the effect of wearing VR helmets on EEG can be ignored. The statistical results refer to Table 3 and topographic maps refer to Figure 8.
In terms of the cutting rate, in the 2D film group, the average power of the alpha wave is the lowest when the cutting rate is medium, and the highest when the cutting rate is slow. The average power of beta wave is the lowest when the cutting rate is slow, and the highest when the cutting rate is fast. The theta wave is lowest when the cutting rate is medium, and highest when the cutting rate is fast. In the VR film group, the average power of the alpha and beta waves are the lowest when the cutting rate is medium, and the highest when the cutting rate is slow. The theta wave is the lowest when the cutting rate is slow, and the highest when the cutting rate is fast.
Flight related experiments have proved that the power of alpha wave drops and the power of theta wave rises as the load increases [28]. Therefore, according to the results of the alpha wave in the experiment, whether in the 2D film group or VR film group, the load caused by watching the film is the highest when the cutting rate of the film is medium, and the lowest when the cutting rate of the film is slow. According to the results of the theta wave in the experiment, in the 2D film group, the load caused by watching the film is the highest when the cutting rate is fast, and the lowest when the cutting rate is medium. In the VR film group, the load caused by watching the film is the highest when the cutting rate is fast, and the lowest when the cutting rate is slow.
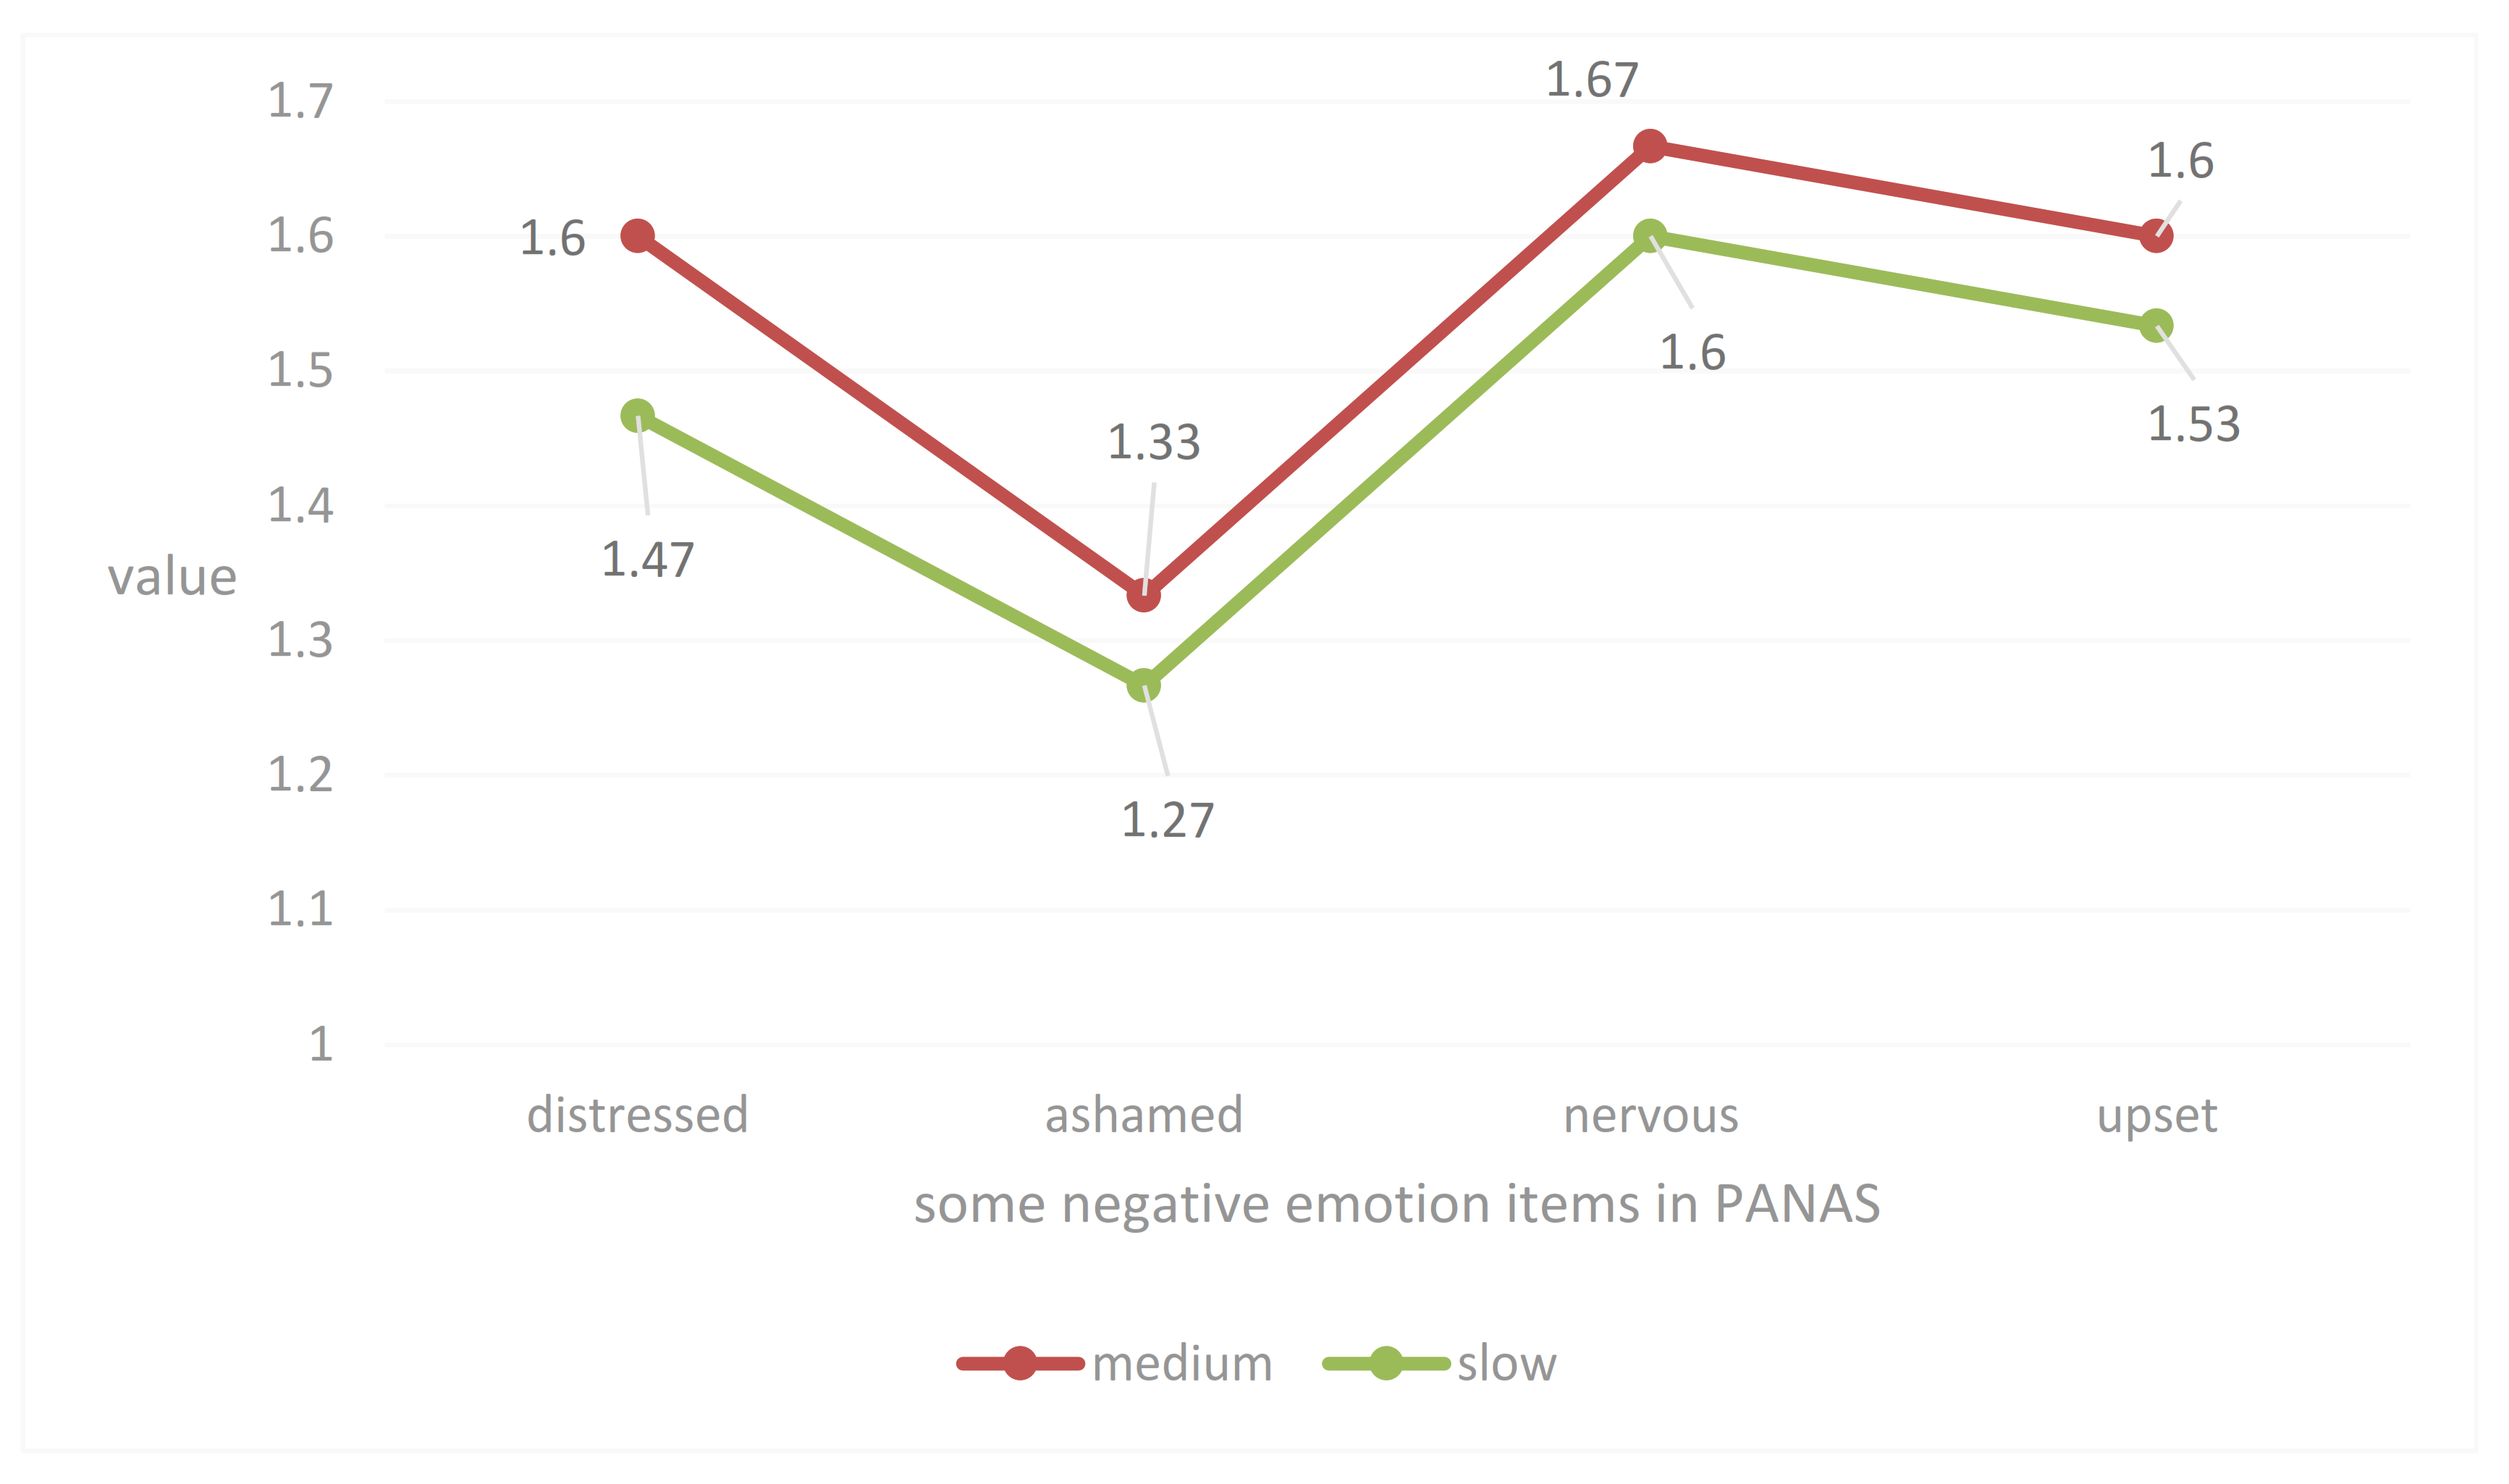
That is, the result of alpha wave shows that the load brought by the medium cutting rate is the highest, while the result of theta wave shows that the load brought by the fast cutting rate is the highest. There is a difference between the two results. We proposed that the possible reasons were: (1) The too large unevenness between the subjects, and the not very sufficient sample size; (2) two factors that promote the increase and decrease of theta wave energy. It is worth noting that the stimulation of the medium cutting rate of the 2D film group is less than the slow cutting rate in the theta frequency band, which is inconsistent with the subjective data analysis results. On the one hand, the enhancement of theta wave is related to sustained attention, increased cognitive control, and working memory load [29,30]. Watching a film with a faster cutting rate requires a certain understanding and cognitive ability, as well as stronger attention, which is related to the working memory [31]. We can speculate that the theta wave energy should be significantly higher than the slower cutting rate under this condition. On the other hand, Gartner found that the energy of theta wave would be suppressed significantly due to acute stress [32]. In this experiment, the subjects need to complete the task of watching the film within a limited time. In the PANAS emotion questionnaire before and after the experiment, the negative level of some items in the medium cutting rate is higher than that of the slow cutting rate, as shown in Figure 9. In the process of watching the film, the subjects reported that they were in a high psychological state of pain, tension, and upset and felt a certain degree of psychological pressure. Therefore, we think the needs of attention and cognition strengthen the theta waves, while the acute psychological pressure weakens the theta wave at the same time. The combined effect of the two makes the theta band energy still higher than the medium cutting rate when the cutting rate is slow, which is the dual processing process of the cerebral cortex for acute psychological stress and tasks related to the working memory [33]. Therefore, the experimental results of this article do not indicate that the cutting rate will affect the human load.
5.2. Subjective Perception of Load Is Related to Cutting Rates
Although the EEG results cannot indicate the correlation between the load and cutting rate, subjectively, the total load and the load of the six factors of NASA-TLX are significantly different caused by different cutting rates. We think that people’s subjective load may be more sensitive. The growth rate of the total load is obviously caused by the fast cutting rate in the 2D film group, which is much higher than the level of the medium and slow cutting rates. This kind of cutting rate, called one-second-one-cut, is the cutting rate used by some traditional 2D films to create a tense and exciting atmosphere. The experimental results in this article also prove that this fast cutting rate does bring a larger load to the audience subjectively.
6. Conclusions
In this article, we studied the impact of 2D and VR films on the participant load at different cutting rates. The subjective results show that whether it is a 2D film or VR film, the faster cutting rate will cause the participants to feel a higher load. The analysis results of alpha, beta, and theta frequency bands show that in the alpha and beta waves, there are obvious differences between VR and traditional 2D films, and VR films bring a stronger stimulation to the viewer. Therefore, in the future of VR film editing, if you want to create a comfortable experience, the cutting rate should not be too fast. The results of this article are only derived from the experimental materials we selected, using the EEG spectrum analysis for the whole brain area. Future research can further explore specific brain areas and try to explain the principle of brain processing the VR information and cutting rate.
Author Contributions
Conceptualization, F.T., Y.Z. and Y.L.; methodology, F.T., Y.Z. and Y.L.; writing—original draft preparation, F.T., Y.Z. and Y.L.; writing—review and editing, F.T., Y.Z. and Y.L. All authors have read and agreed to the published version of the manuscript.
Funding
This research was funded by the National Social Science Fund of China, grant number 17BC043.
Institutional Review Board Statement
The study was conducted according to the guidelines of the Declaration of Helsinki, and approved by Shanghai Ethics Committee for Clinical Research (SECCR) (SECCR/2018-15-01 and 2018-12-19).
Informed Consent Statement
Informed consent was obtained from all subjects involved in the study.
Data Availability Statement
The data presented in this study are available on request from the corresponding author.
Conflicts of Interest
The authors declare no conflict of interest.
References
- Klimesch, W. EEG alpha and theta oscillations reflect cognitive and memory performance: A review and analysis. Brain Res. Rev. 1999, 29, 169–195. [Google Scholar] [CrossRef]
- Lay-Ekuakille, A.; Vergallo, P.; Griffo, G.; Conversano, F.; Casciaro, S.; Urooj, S.; Bhateja, V.; Trabacca, A. Entropy index in quantitative EEG measurement for diagnosis accuracy. IEEE Trans. Instrum. Meas. 2013, 63, 1440–1450. [Google Scholar] [CrossRef]
- Tsivian, Y. Cinemetrics, Part of the Humanities’ Cyberinfrastructure. In Digital Tools in Media Studies: Analysis and Research. An Overview; Michael, R., Manfred, G., Bernd, F., Eds.; Transcript Verlag: Bielefeld, Germany, 2009; Volume 27, pp. 93–100. [Google Scholar]
- Kostyrka-Allchorne, K.; Cooper, N.R.; Gossmann, A.M.; Barber, K.J.; Simpson, A. Differential effects of film on preschool children’s behaviour dependent on editing pace. Acta Paediatr. 2017, 106, 831–836. [Google Scholar] [CrossRef] [PubMed]
- Kostyrka-Allchorne, K.; Cooper, N.R.; Simpson, A. Disentangling the effects of video pace and story realism on children’s attention and response inhibition. Cogn. Dev. 2019, 49, 94–104. [Google Scholar] [CrossRef]
- Kostyrka-Allchorne, K.; Coope, N.R.; Kennett, S.; Nestler, S.; Simpson, A. The Short-Term Effect of Video Editing Pace on Children’s Inhibition and N2 and P3 ERP Components during Visual Go/No-Go Task. Dev. Neuropsychol. 2019, 44, 385–396. [Google Scholar] [CrossRef]
- Gao, Q.; Wang, Y.; Song, F.; Li, Z.; Dong, X. Mental workload measurement for emergency operating procedures in digital nuclear power plants. Ergonomics 2013, 56, 1070–1085. [Google Scholar] [CrossRef] [PubMed]
- Wanyan, X.; Zhuang, D.; Zhang, H. Improving pilot mental workload evaluation with combined measures. Bio-Med Mater. Eng. 2014, 24, 2283–2290. [Google Scholar] [CrossRef] [Green Version]
- Hart, S.G.; Staveland, L.E. Development of NASA-TLX (Task Load Index): Results of Empirical and Theoretical Research. Adv. Psychol. 1988, 52, 139–183. [Google Scholar]
- Castro-Meneses, L.J.; Kruger, J.L.; Doherty, S. Validating theta power as an objective measure of cognitive load in educational video. Educ. Technol. Res. Dev. 2020, 68, 181–202. [Google Scholar] [CrossRef]
- Cepeda-Freyre, H.A.; Garcia-Aguilar, G.; Eguibar, J.R.; Cortes, C. Brain Processing of Complex Geometric Forms in a Visual Memory Task Increases P2 Amplitude. Brain Sci. 2020, 10, 114. [Google Scholar] [CrossRef] [Green Version]
- Rojas, R.F.; Debie, E.; Fidock, J.; Barlow, M.; Kasmarik, K.; Anavatti, S.; Garratt, M.; Abbass, H. Electroencephalographic Workload Indicators During Teleoperation of an Unmanned Aerial Vehicle Shepherding a Swarm of Unmanned Ground Vehicles in Contested Environments. Front. Neurosci. 2020, 14, 1–15. [Google Scholar]
- Dussault, C.; Jouanin, J.C.; Philippe, M.; Guezennec, C.Y. EEG and ECG changes during simulator operation reflect mental workload and vigilance. Aviat. Space Environ. Med. 2005, 76, 344–351. [Google Scholar] [PubMed]
- Ung, W.C.; Yap, K.H.; Ebenezer, E.G.M.; Pui, S.C.; Nordin, N.; Chan, S.C.; Yip, H.L.; Lu, C.K.; Kiguchi, M.; Tang, T.B. Assessing Neural Compensation with Visuospatial Working Memory Load Using Near-Infrared Imaging. IEEE Trans. Neural Syst. Rehabil. Eng. 2019, 28, 13–22. [Google Scholar] [CrossRef] [PubMed]
- Nourbakhsh, N.; Chen, F.; Wang, Y.; Calvo, R.A. Detecting Users’ Cognitive Load by Galvanic Skin Response with Affective Interference. ACM Trans. Interact. Intell. Syst. 2017, 7, 1–20. [Google Scholar] [CrossRef] [Green Version]
- Lal, S.K.L.; Craig, A.; Boord, P.; Kirkupb, L.; Nguyenc, H. Development of an algorithm for an EEG-based driver fatigue countermeasure. J. Saf. Res. 2003, 34, 321–328. [Google Scholar] [CrossRef]
- Dan, A.; Reiner, M. EEG-based cognitive load of processing events in 3D virtual worlds is lower than processing events in 2D displays. Int. J. Psychophysiol. 2017, 122, 75–84. [Google Scholar] [CrossRef]
- Qidwai, U.; Ajimsha, M.S.; Shakir, M. The Role of EEG and EMG combined Virtual Reality gaming system in facial palsy rehabilitation—A case report. J. Bodyw. Mov. Ther. 2019, 23, 425–431. [Google Scholar] [CrossRef]
- Kweon, S.H.; Kweon, H.J.; Kim, S.; Li, X.; Liu, X.; Kweon, H.L. A brain wave research on VR (virtual reality) usage: Comparison between VR and 2D video in EEG measurement. In Proceedings of the International Conference on Applied Human Factors and Ergonomics, Los Angeles, CA, USA, 17−21 July 2017; pp. 194–203. [Google Scholar]
- Hasson, U.; Nir, Y.; Levy, I.; Fuhrmann, G.; Malach, R. Intersubject synchronization of cortical activity during natural vision. Science 2004, 303, 1634–1640. [Google Scholar] [CrossRef]
- Hasson, U.; Landesman, O.; Knappmeyer, B.; Vallines, I.; Rubin, N.; Heeger, D.J. Neurocinematics: The Neuroscience of Film. Projections 2008, 2, 1–26. [Google Scholar] [CrossRef] [Green Version]
- Jung, T.P.; Humphries, C.; Lee, T.W.; Makeig, S.; McKeown, M.J.; Iragui, V.; Sejnowski, T.J. Removing Electroencephalographic Artifacts: Comparison Between ICA and PCA. In Proceedings of the 1998 IEEE Signal Processing Society Workshop (Cat. No.98TH8378), Cambridge, UK, 2 September 1998; pp. 63–72. [Google Scholar]
- Dong, L.; Li, F.; Li, Q.; Wen, X.; Lai, Y.; Xu, P.; Yao, D. MATLAB Toolboxes for Reference Electrode Standardization Technique (REST) of Scalp EEG. Front. Neurosci. 2017, 11, 1–8. [Google Scholar] [CrossRef]
- Xie, J.; Xu, G.; Wang, J.; Li, M.; Han, C.; Jia, Y. Effects of Mental Load and Fatigue on Steady-State Evoked Potential Based Brain Computer Interface Tasks: A Comparison of Periodic Flickering and Motion-Reversal Based Visual Attention. PLoS ONE 2016, 11, 1–10. [Google Scholar] [CrossRef] [PubMed]
- Deepika, D.; Shou, G.; Ding, L. ICA-Derived EEG Correlates to Mental Fatigue, Effort, and Workload in a Realistically Simulated Air Traffic Control Task. Front. Neurosci. 2017, 11, 1–12. [Google Scholar]
- Charbonnier, S.; Roy, R.N.; Bonnet, S.; Campagne, A. EEG index for control operators’ mental fatigue monitoring using interactions between brain regions. Expert Syst. Appl. Int. J. 2016, 52, 91–98. [Google Scholar] [CrossRef] [Green Version]
- Zhao, C.; Zhao, M.; Liu, J.; Zheng, C. Electroencephalogram and electrocardiograph assessment of mental fatigue in a driving simulator. Accid. Anal. Prev. 2012, 45, 83–90. [Google Scholar] [CrossRef]
- Borghini, G.; Astolfi, L.; Vecchiato, G.; Mattia, D.; Babiloni, F. Measuring neurophysiological signals in aircraft pilots and car drivers for the assessment of mental workload, fatigue and drowsiness. Neurosci. Biobehav. Rev. 2014, 44, 58–75. [Google Scholar] [CrossRef]
- Cavanagh, J.F.; Frank, M.J. Frontal theta as a mechanism for cognitive control. Trends Cogn. Sci. 2014, 18, 414–421. [Google Scholar] [CrossRef] [Green Version]
- Gevins, A.; Smith, M.E.; Leong, H.; McEvoy, L.; Whitfield, S.; Du, R.; Rush, G. Monitoring working memory load during computer-based tasks with EEG pattern recognition methods. Hum. Factors 1998, 40, 79–91. [Google Scholar] [CrossRef] [PubMed]
- Logie, R.H.; Gilhooly, K.J.; Wynn, V. Counting on working memory in arithmetic problem solving. Mem. Cogn. 1994, 22, 395–410. [Google Scholar] [CrossRef] [PubMed]
- Gartner, M.; Rohde-Liebenau, L.; Grimm, S.; Bajbouj, M. Working memory-related frontal theta activity is decreased under acute stress. Psychoneuroendocrinology 2014, 43, 105–113. [Google Scholar] [CrossRef]
- Qin, S.; Hermans, E.J.; Marle, H.J.F.V.; Luo, J.; Fernandez, G. Acute Psychological Stress Reduces Working Memory-Related Activity in the Dorsolateral Prefrontal Cortex. Biol. Psychiatry 2009, 66, 25–32. [Google Scholar] [CrossRef]
Figure 1.
Experimental materials are divided into the two-dimensional (2D) and virtual reality (VR) film groups.
Figure 1.
Experimental materials are divided into the two-dimensional (2D) and virtual reality (VR) film groups.

Figure 2.
Connection setting and transmission path.

Figure 3.
Examples of 2D and VR experiment scene.

Figure 4.
Experiment process.

Figure 5.
The average value of the load in (a) mental demand, (b) physical demand, (c) temporal demand, (d) effort, (e) performance, (f) frustration level and (g) total value of NASA-TLX (two modes × three rates).
Figure 5.
The average value of the load in (a) mental demand, (b) physical demand, (c) temporal demand, (d) effort, (e) performance, (f) frustration level and (g) total value of NASA-TLX (two modes × three rates).

Figure 6.
The average energy values of (a) alpha, (b) beta, and (c) theta waves of 2D and VR film groups at different cutting rates (two modes × three rates).
Figure 6.
The average energy values of (a) alpha, (b) beta, and (c) theta waves of 2D and VR film groups at different cutting rates (two modes × three rates).

Figure 7.
Film-induced electroencephalogram (EEG) topographic map in alpha, beta, and theta wave frequency bands.
Figure 7.
Film-induced electroencephalogram (EEG) topographic map in alpha, beta, and theta wave frequency bands.

Figure 8.
EEG topographic map in alpha, beta, and theta wave frequency bands in the resting state.

Figure 9.
Values of negative emotion items for medium and slow cutting rates in the 2D film group.


Table 1.
The statistical results of the load in each factor and total load of the NASA task load index (NASA-TLX).
Table 1.
The statistical results of the load in each factor and total load of the NASA task load index (NASA-TLX).
| Dimension | Mode | Rate | Mode*Rate |
|---|---|---|---|
| mental demand | F (1, 35) = 6.04 p = 0.019 < 0.05 VR > 2D | F (2, 70) = 8.204, p = 0.001 fast > slow (p = 0.001) | \ |
| physical demand | F (1, 34) = 76.915 p = 0.003 < 0.05 VR > 2D | F (2, 68) = 9.053, p < 0.001 fast > slow (p = 0.004 < 0.05) medium > slow (p = 0.004 < 0.05) | \ |
| temporal demand | \ | F (2, 70) = 24.214, p < 0.001 fast > middle (p < 0.001) medium > slow (p = 0.015 < 0.05) | \ |
| effort | slow: VR > 2D (p = 0.002) | 2D: Fast > slow (p < 0.001) 2D: Medium > slow (p < 0.001) | p = 0.047 < 0.05 |
| performance | \ | F (2,60) = 4.393, p = 0.024 < 0.05 fast > medium (p = 0.031 < 0.05) fast > slow (p = 0.022 < 0.05) | \ |
| frustration level | fast: VR > 2D (p = 0.007 < 0.05) | VR: Fast > medium (p = 0.026 < 0.05) VR: Fast > slow (p = 0.002 < 0.05) | p = 0.049 < 0.05 |
| total value | \ | F (2,64.639) = 17.597, p < 0.001 fast > medium (p < 0.001) fast > slow (p < 0.001) | \ |
Table 2.
Statistical results of the energy sum of alpha, beta, and theta waves.
| Wave | Mode | Rate | Mode*Rate |
|---|---|---|---|
| alpha | F (1, 30) = 10.357 p = 0.003 < 0.05 VR > 2D | \ | \ |
| beta | F (1, 30) = 29.424 p < 0.001 VR > 2D | \ | \ |
| theta | \ | 2D: Medium < slow (p = 0.001 < 0.05) | p = 0.047 < 0.05 |
Table 3.
Statistical results of the energy sum of alpha, beta, and theta waves in the resting state.
Table 3.
Statistical results of the energy sum of alpha, beta, and theta waves in the resting state.
| Wave | 2D | VR | t | sig |
|---|---|---|---|---|
| alpha | 3153.691 | 3928.887 | −0.972 | 0.346 |
| beta | 5895.521 | 4890.963 | 0.821 | 0.425 |
| theta | 4216.904 | 4050.844 | 0.253 | 0.804 |
Publisher’s Note: MDPI stays neutral with regard to jurisdictional claims in published maps and institutional affiliations. |
© 2021 by the authors. Licensee MDPI, Basel, Switzerland. This article is an open access article distributed under the terms and conditions of the Creative Commons Attribution (CC BY) license (http://creativecommons.org/licenses/by/4.0/).
Share and Cite
MDPI and ACS Style
Tian, F.; Zhang, Y.; Li, Y. From 2D to VR Film: A Research on the Load of Different Cutting Rates Based on EEG Data Processing. Information 2021, 12, 130. https://0-doi-org.brum.beds.ac.uk/10.3390/info12030130
AMA Style
Tian F, Zhang Y, Li Y. From 2D to VR Film: A Research on the Load of Different Cutting Rates Based on EEG Data Processing. Information. 2021; 12(3):130. https://0-doi-org.brum.beds.ac.uk/10.3390/info12030130
Chicago/Turabian StyleTian, Feng, Yan Zhang, and Yingjie Li. 2021. "From 2D to VR Film: A Research on the Load of Different Cutting Rates Based on EEG Data Processing" Information 12, no. 3: 130. https://0-doi-org.brum.beds.ac.uk/10.3390/info12030130
Note that from the first issue of 2016, this journal uses article numbers instead of page numbers. See further details here.