
Neutron-Enhanced Information on the Laboratory Characterization of Ancient Egyptian Leathers: Hydration and Preservation Status

 , ,
, ,  , , , and
Abstract
:1. Introduction
2. Materials and Methods
3. Results
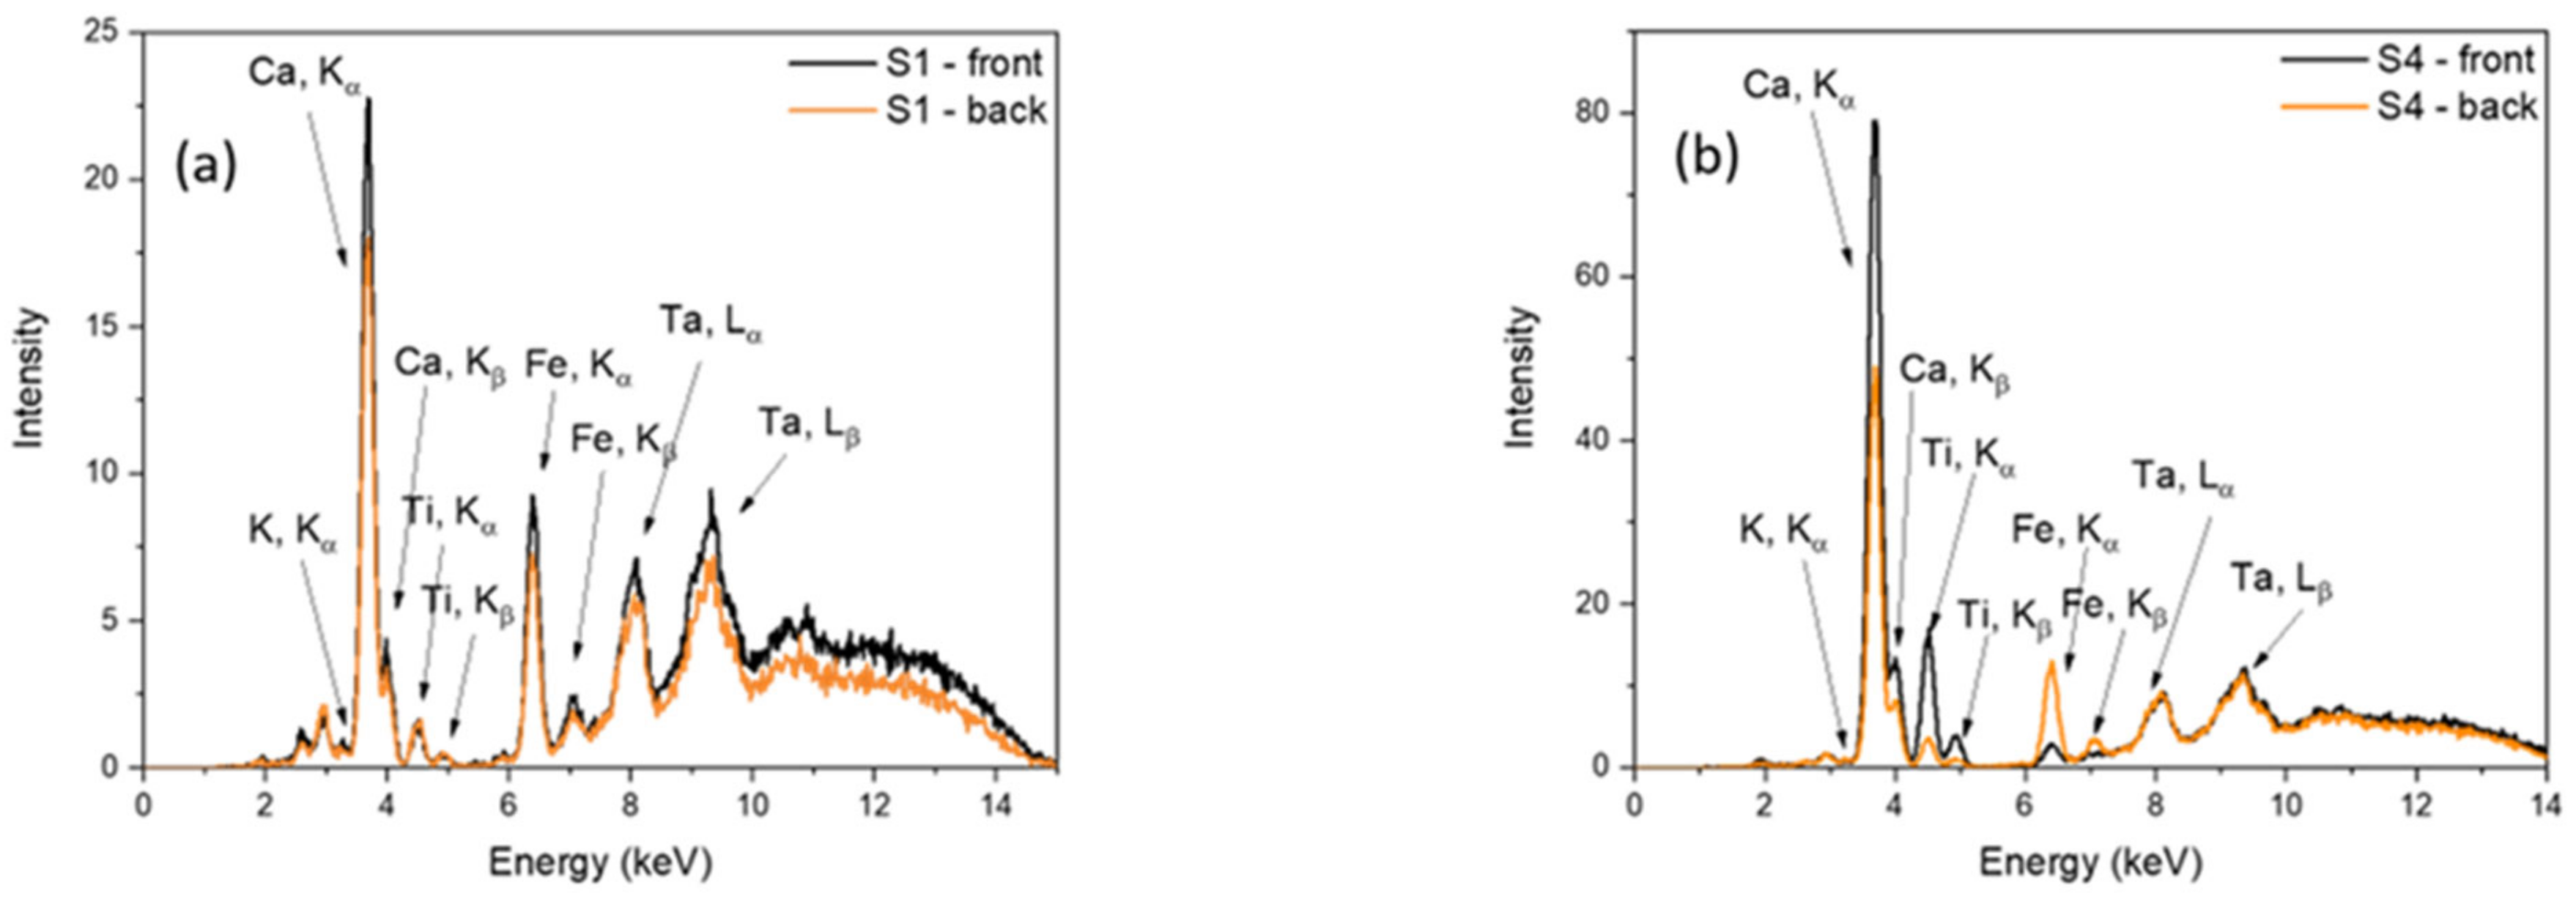
3.1. XRF Analysis
3.2. Raman Spectroscopy Analysis
3.3. Neutron Scattering Analyses
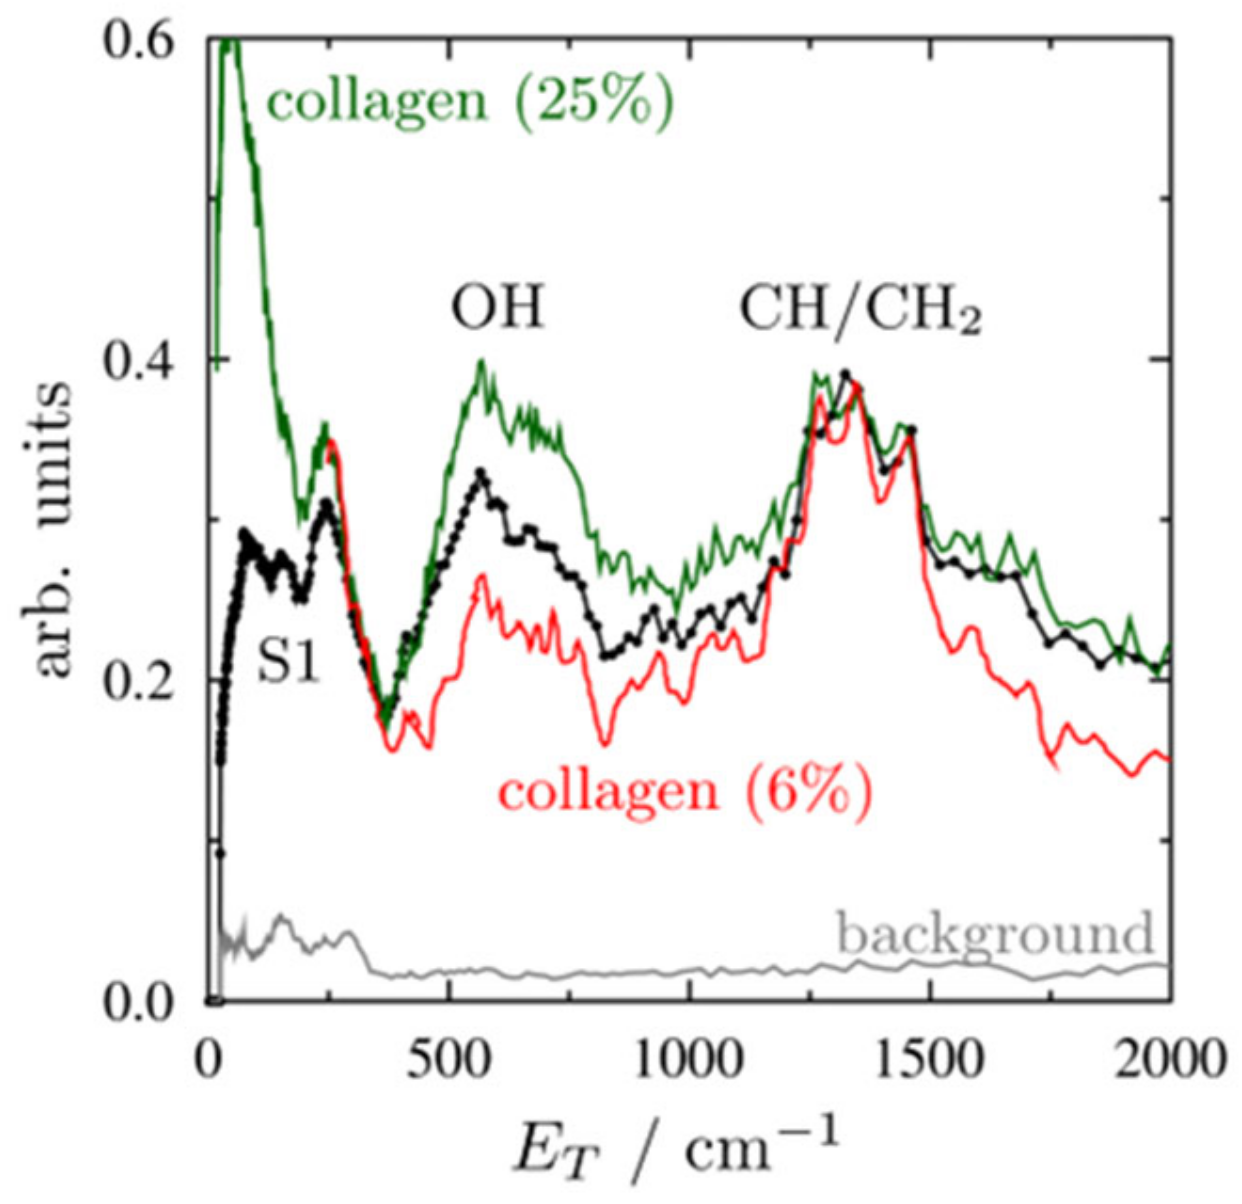
3.3.1. Inelastic Neutron Scattering Analysis
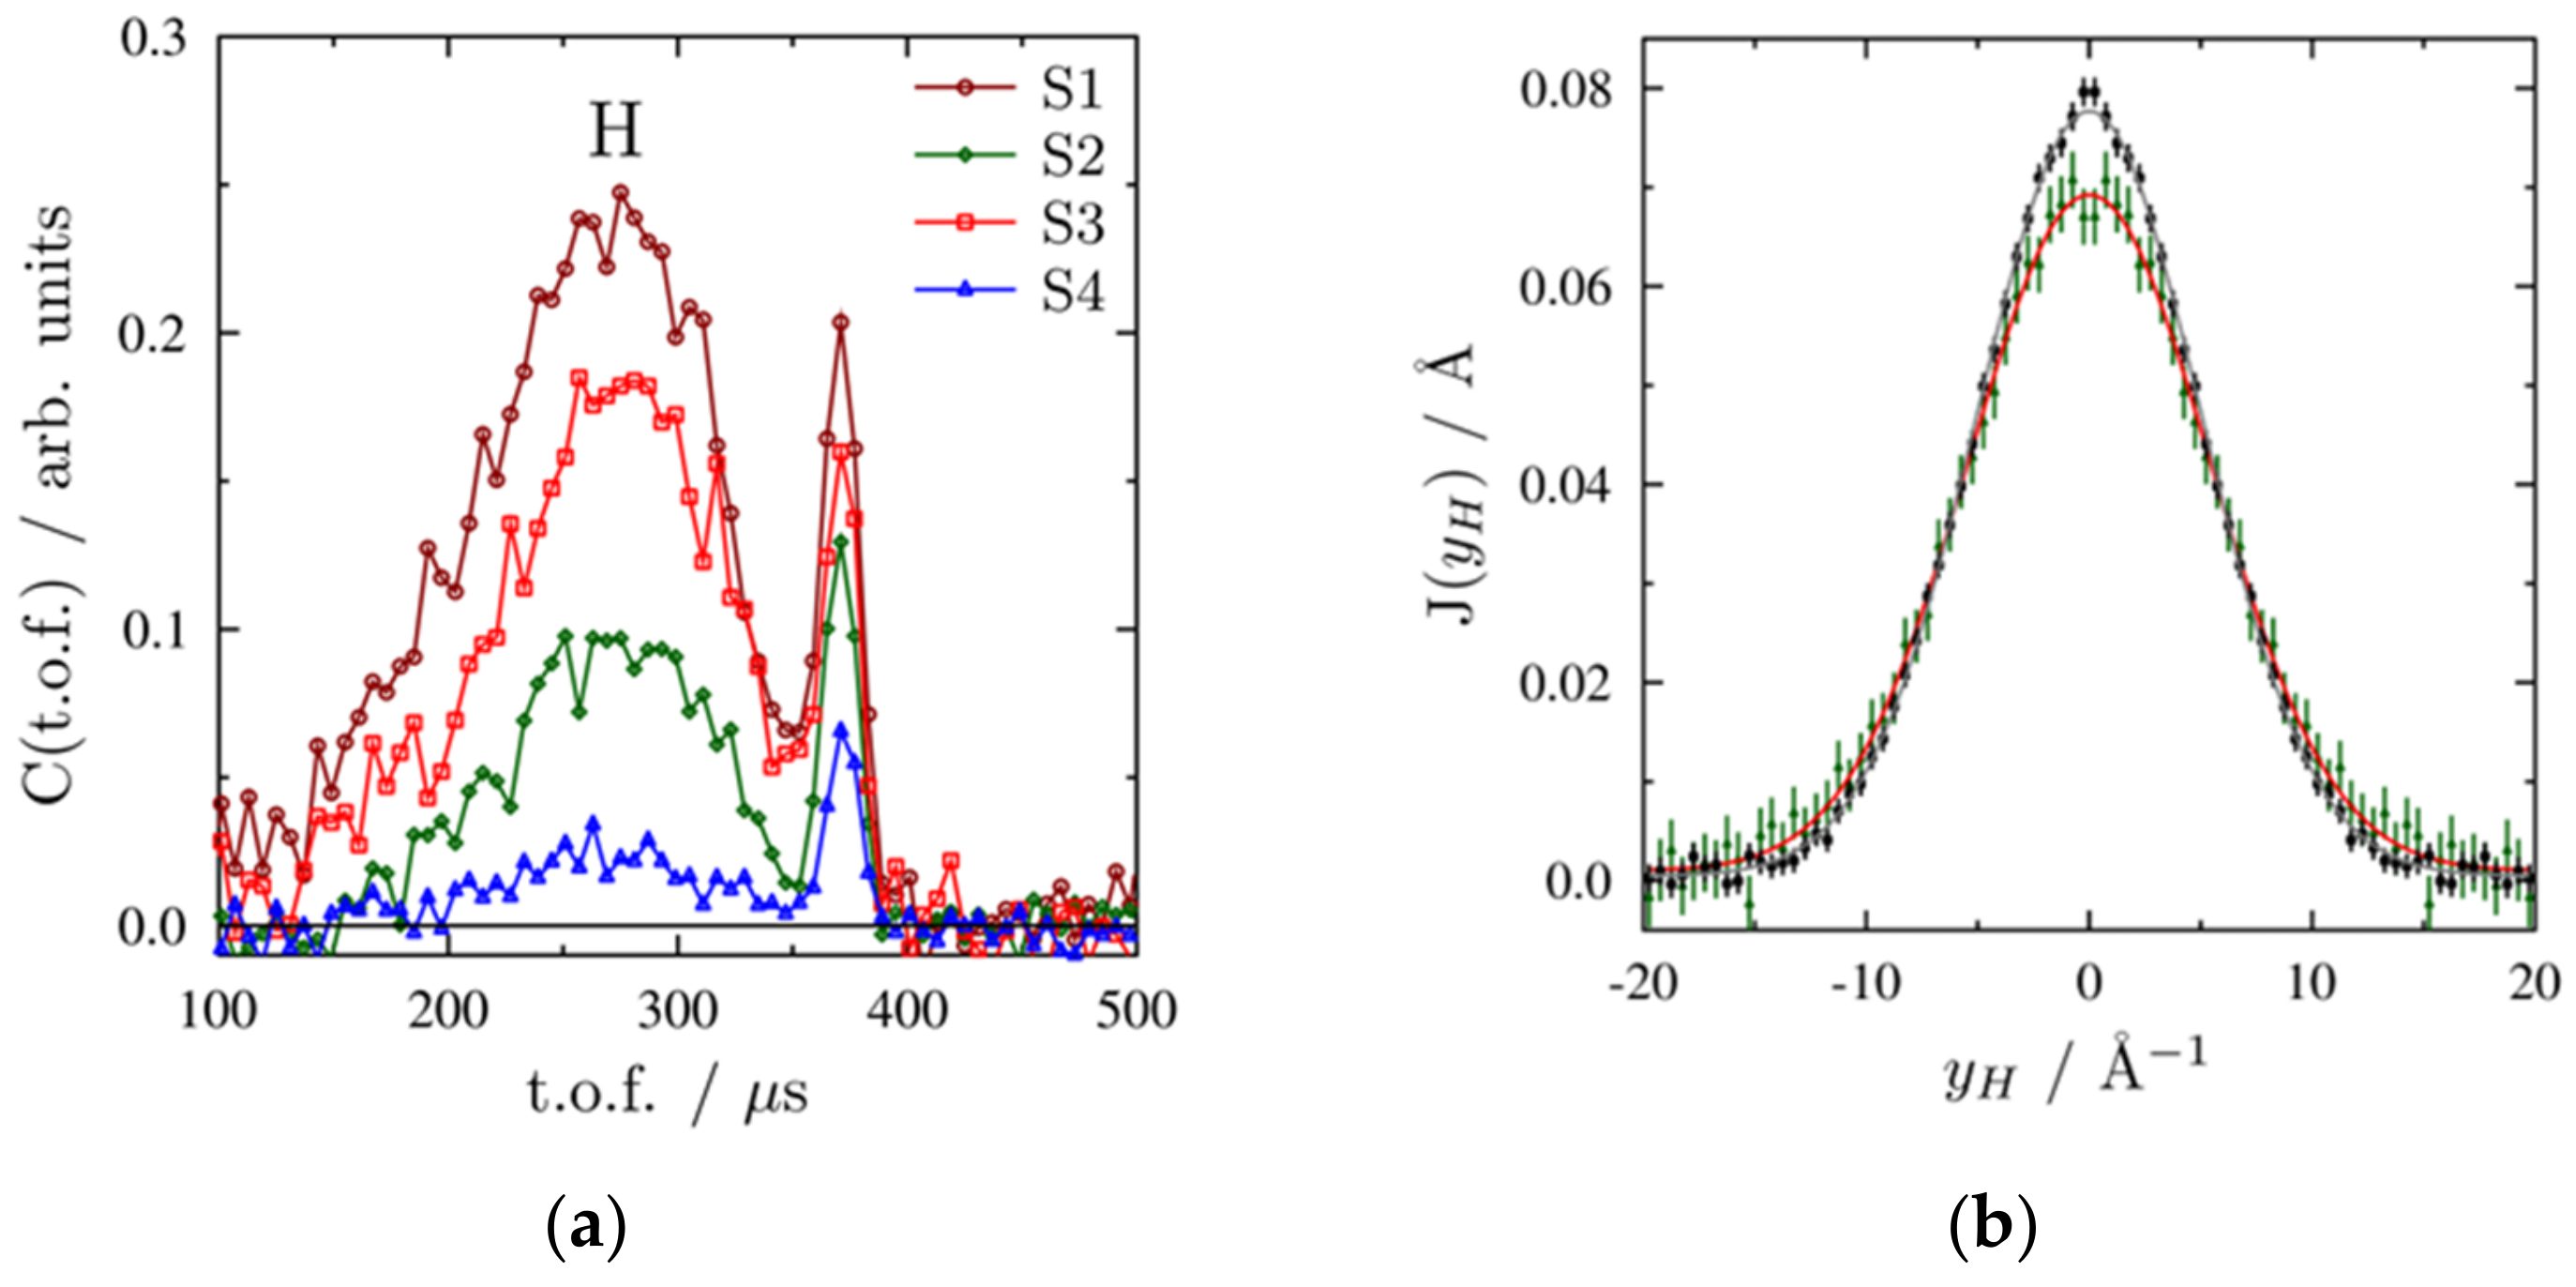
3.3.2. Deep Inelastic Neutron Scattering Analysis
3.4. Scanning Electron Microscopy Analysis
Energy Dispersive X-ray Spectroscopy Information
4. Discussion
- Elemental composition: By merging XRF (more effective for elements with atomic number higher than 15) and EDS (effective for low atomic number elements), we provide a description of the substances used for tanning and possible contaminants during conservation. In addition, XRF provides information from the overall sample and from tens of microns below its surface while EDS gives punctual information from the first microns of the surface, allowing us to describe the very superficial layers of the sample. Moreover, DINS provides elemental information for Z = 1, which is difficult to access via photon-based techniques, helping to quantify the amount of water.
- Chemical composition: Through Raman spectroscopy, the chemical compositions of the tanning agents and pigments have been investigated (discovering carbonates and phosphates) and by INS, showing the amount of water in the bulk.
- Morphology characterization: Through SEM, the surface of the samples has been investigated on different length scales, highlighting the presence of salts, the composition of fibers, and the occurrence of cracking due to the low hydration and the gelatinization of collagen.

5. Conclusions
Author Contributions
Funding
Data Availability Statement
Acknowledgments
Conflicts of Interest
References
- Museo Egizio. Available online: https://www.museoegizio.it/en/ (accessed on 15 June 2022).
- Schiaparelli, E. Relazione Sui Lavori della Missione Archeologica Italiana in Egitto (Anni 1903–1920): La Tomba Intatta Dell’architetto Cha, Nella Necropoli di Tebe; R. Museo di Antichità: Torino, Italy, 1927. [Google Scholar]
- Skinner, L.; Stacey, R.; Lama, A.; McGrath, K.; Cartwright, C.; Wills, B. Modified Methods for Species Identification of Archaeological Skin-based Objects: Dealing with Degradation and Improving Standards. In Proceedings of the 11th Interim Meeting of the ICOM-CC Leather and Related Materials Working Group (2021), Paris, France, 6–7 June 2019. [Google Scholar]
- Van Driel-Murray, C. Leatherwork and Skin Products. Ancient Egyptian Materials and Technology; Cambridge University Press: Cambridge, UK, 2000; pp. 299–319. [Google Scholar]
- Kite, M.; Thomson, R. (Eds.) Conservation of Leather and Related Materials; Routledge: London, UK, 2005. [Google Scholar]
- Veldmeijer, A.J. Leather. In Busy Lives at Amarna: Excavations in the Main City; Kemp, B.J., Ed.; Grid 12 and the House of Ranefer, N49.18; Egypt Exploration Society/Amarna Trust: London, UK; Cambridge, UK, 2010; Volume II: The objects, pp. 205–212. [Google Scholar]
- Larsen, R.; Sommer, D.V.P.; Axelsson, K.M.; Frank, S. Transformation of collagen into gelatine in historical leather and parchment caused by natural deterioration and moist treatment. In Proceedings of the ICOM-CC, Leather and Related Materials Working Group. Interim Meeting, Offenbach, Germany, 23–31 August 2012; Volume 31, pp. 61–68. [Google Scholar]
- Miller, A. Collagen: The organic matrix of bone. Philos. Trans. R. Soc. B Biol. Sci. 1984, 304, 455–477. [Google Scholar]
- Fraser, R.; MacRae, T.; Miller, A. Molecular packing in type I collagen fibrils. J. Mol. Biol. 1987, 193, 115–125. [Google Scholar] [CrossRef]
- Wess, T.; Miller, A.; Bradshaw, J. Cross-linkage sites in type I collagen fibrils studied by neutron diffraction. J. Mol. Biol. 1990, 213, 1–5. [Google Scholar] [CrossRef]
- Karplus, M.; Petsko, G.A. Molecular dynamics simulations in biology. Nature 1990, 347, 631–639. [Google Scholar] [CrossRef] [PubMed]
- ISIS Neutron and Muon Source. Available online: https://www.isis.stfc.ac.uk/Pages/home.aspx (accessed on 15 June 2022).
- Romanian Database of Raman Spectroscopy. Available online: http://rdrs.ro (accessed on 15 June 2022).
- Lafuente, B.; Downs, R.T.; Yang, H.; Stone, N. The power of databases: The RRUFF project. In Highlights in Mineralogical Crystallography; De Gruyter: Berlin, Germany, 2005; pp. 1–30. [Google Scholar]
- Parker, S.F.; Carlile, C.J.; Pike, T.; Tomkinson, J.; Newport, R.J.; Andreani, C.; Ricci, F.P.; Sacchetti, F.; Zoppi, M. TOSCA: A world class inelastic neutron spectrometer. Phys. B Condens. Matter 1997, 241, 154–156. [Google Scholar] [CrossRef]
- Pinna, R.S.; Zanetti, M.; Rudić, S.; Parker, S.F.; Armstrong, J.; Waller, S.P.; Zacek, D.; Smith, C.; Harrison, S.M.; Gorini, G.; et al. The TOSCA spectrometer at ISIS: The guide upgrade and beyond. J. Phys. Conf. Ser. 2018, 1021, 012029. [Google Scholar] [CrossRef]
- Fernandez-Alonso, F.; Price, D.L. Neutron Scattering; Academic Press: Cambridge, MA, USA, 2013. [Google Scholar]
- Romanelli, G.; Krzystyniak, M.; Senesi, R.; Raspino, D.; Boxall, J.; Pooley, D.; Moorby, S.; Schooneveld, E.M.; Rhodes, N.J.; Andreani, C.; et al. Characterisation of the incident beam and current diffraction capabilities on the VESUVIO spectrometer. Meas. Sci. Technol. 2017, 28, 095501. [Google Scholar] [CrossRef]
- Andreani, C.; D’angelo, A.; Gorini, G.; Imberti, S.; Pietropaolo, A.; Rhodes, N.J.; Schooneveld, E.M.; Senesi, R.; Tardocchi, M. CdZnTe γ detector for deep inelastic neutron scattering on the VESUVIO spectrometer. Appl. Phys. A 2004, 78, 903–913. [Google Scholar] [CrossRef]
- Andreani, C.; Pietropaolo, A.; Senesi, R.; Gorini, G.; Tardocchi, M.; Bracco, A.; Rhodes, N.; Schooneveld, E. Electron-volt spectroscopy at a pulsed neutron source using a resonance detector technique. Nucl. Instrum. Methods Phys. Res. Sect. A Accel. Spectrom. Detect. Assoc. Equip. 2002, 481, 509–520. [Google Scholar] [CrossRef]
- Pietropaolo, A.; Andreani, C.; Rebai, M.; Giacomelli, L.; Gorini, G.; Cippo, E.P.; Tardocchi, M.; Fazzi, A.; Rinati, G.V.; Verona, C.; et al. Fission diamond detectors for fast-neutron ToF spectroscopy. EPL (Europhys. Lett.) 2011, 94, 62001. [Google Scholar] [CrossRef]
- Cippo, E.P.; Borella, A.; Gorini, G.; Kockelmann, W.; Moxon, M.; Postma, H.; Rhodes, N.J.; Schillebeeckx, P.; Schoonenveld, E.M.; Tardocchi, M.; et al. Imaging of cultural heritage objects using neutron resonances. J. Anal. At. Spectrom. 2011, 26, 992–999. [Google Scholar] [CrossRef]
- Andreani, C.; Pietropaolo, A.; Senesi, R.; Gorini, G.; Perelli-Cippo, E.; Tardocchi, M.; Rhodes, N.; Schooneveld, E.M. A resonant detector for high-energy inelastic neutron scattering experiments. Appl. Phys. Lett. 2004, 85, 5454. [Google Scholar] [CrossRef]
- Romanelli, G.; Hewer, B.; Krzystyniak, M.; Gigg, M.; Tolchenov, R.; Mukhopadhyay, S.; Fernandez-Alonso, F. Data analysis of neutron Compton scattering experiments using MANTID. J. Phys. Conf. Ser. 2018, 1055, 012016. [Google Scholar] [CrossRef]
- Mannina, L.; Lombardo, A. Diagnostic Analyses for the Study of Materials, Technique and State of Preservation of a Gilt and Painted Leather of the XVIII Century. Procedia Chem. 2013, 8, 202–211. [Google Scholar] [CrossRef]
- Rifkin, R. Assessing the Efficacy of Red Ochre as a Prehistoric Hide Tanning Ingredient. J. Afr. Archaeol. 2011, 9, 131–158. [Google Scholar] [CrossRef]
- Castro, L.N.C.; Calza, C.; Freitas, R.P.; Brancaglion, A.; Lopes, R.T. Analysis of ancient Egypt artifacts using X-ray fluorescence. In Proceedings of the IMEKO International Conference on Metrology for Archaeology and Cultural Heritage, Torino, Italy, 19–21 October 2016. [Google Scholar]
- Elnaggar, A.; Leona, M.; Nevin, A.; Heywood, A. The characterization of vegetable tannins and colouring agents in ancient Egyptian leather from the collection of the metropolitan museum of art. Archaeometry 2017, 59, 133–147. [Google Scholar] [CrossRef]
- D’Amico, S.; Venuti, V.; Colica, E.; Crupi, V.; Majolino, D.; Paladini, G.; Guido, S.; Mantella, G.; Zumbo, R. Scientific investigation of the Conversion of St Paul painting (Mdina, Malta). In Proceedings of the 2019 IMEKO TC4 International Conference on Metrology for Archaeology and Cultural Heritage, MetroArchaeo, Florence, Italy, 4–6 December 2019; pp. 330–334. [Google Scholar]
- Venuti, V.; Fazzari, B.; Crupi, V.; Majolino, D.; Paladini, G.; Morabito, G.; Certo, G.; Lamberto, S.; Giacobbe, L. In situ diagnostic analysis of the XVIII century Madonna della Lettera panel painting (Messina, Italy). Spectrochim. Acta A Mol. Biomol. Spectrosc. 2019, 228, 117822. [Google Scholar] [CrossRef]
- Mitchell, P.C.H. Vibrational Spectroscopy with Neutrons: With Applications in Chemistry, Biology, Materials Science and Catalysis; World Scientific: Singapore, 2005; Volume 3. [Google Scholar]
- Middendorf, H.; Hayward, R.; Parker, S.; Bradshaw, J.; Miller, A. Vibrational neutron spectroscopy of collagen and model polypeptides. Biophys. J. 1995, 69, 660–673. [Google Scholar] [CrossRef]
- Andreani, C.; Krzystyniak, M.; Romanelli, G.; Senesi, R.; Fernandez-Alonso, F. Electron-volt neutron spectroscopy: Beyond fundamental systems. Adv. Phys. 2017, 66, 1–73. [Google Scholar] [CrossRef]
- Krzystyniak, M.; Romanelli, G.; Fernandez-Alonso, F. Non-destructive quantitation of hydrogen via mass-resolved neutron spectroscopy. Analyst 2019, 144, 3936–3941. [Google Scholar] [CrossRef]
- Romanelli, G.; Liscio, A.; Senesi, R.; Zamboni, R.; Treossi, E.; Liscio, F.; Giambastiani, G.; Palermo, V.; Fernandez-Alonso, F.; Andreani, C. Soft confinement of water in graphene-oxide membranes. Carbon 2016, 108, 199–203. [Google Scholar] [CrossRef]
- Lodish, H.; Berk, A.; Zipursky, S.L.; Matsudaira, P.; Baltimore, D.; Darnell, J. Collagen: The Fibrous Protein of the Matrix. In Molecular Cell Biology, 4th ed.; WH Freeman and Company: New York, NY, USA, 2000. [Google Scholar]
- Andreani, C.; Romanelli, G.; Senesi, R. Direct Measurements of Quantum Kinetic Energy Tensor in Stable and Metastable Water near the Triple Point: An Experimental Benchmark. J. Phys. Chem. Lett. 2016, 7, 2216–2220. [Google Scholar] [CrossRef] [PubMed]
- Senesi, R.; Romanelli, G.; Adams, M.; Andreani, C. Temperature dependence of the zero point kinetic energy in ice and water above room temperature. Chem. Phys. 2013, 427, 111–116. [Google Scholar] [CrossRef]
- Andreani, C.; Romanelli, G.; Senesi, R. A combined INS and DINS study of proton quantum dynamics of ice and water across the triple point and in the supercritical phase. Chem. Phys. 2013, 427, 106–110. [Google Scholar] [CrossRef]
- Andreani, C.; Senesi, R.; Krzystyniak, M.; Romanelli, G.; Fernandez-Alonso, F. Experimental studies of nuclear quantum effects in condensed matter: The case of water. Riv. Nuovo Cim. 2018, 41, 291–340. [Google Scholar]
- Andreani, C.; Corsaro, C.; Mallamace, D.; Romanelli, G.; Senesi, R.; Mallamace, F. The onset of the tetrabonded structure in liquid water. Sci. China Ser. G Phys. Mech. Astron. 2019, 62, 107008. [Google Scholar] [CrossRef]
- Reiter, G.F.; Senesi, R.; Mayers, J. Changes in the Zero-Point Energy of the Protons as the Source of the Binding Energy of Water to A -Phase DNA. Phys. Rev. Lett. 2010, 105, 148101. [Google Scholar] [CrossRef]
- Costa, M.; Arruda, A.M.; Dias, L.; Barbosa, R.; Mirão, J.; Vandenabeele, P. The combined use of Raman and micro-X-ray diffraction analysis in the study of archaeological glass beads. J. Raman Spectrosc. 2018, 50, 250–261. [Google Scholar] [CrossRef]
- Portillo, H.; Zuluaga, M.C.; Ortega, L.A.; Alonso-Olazabal, A.; Murelaga, X.; Martinez-Salcedo, A. XRD, SEM/EDX and micro-Raman spectroscopy for mineralogical and chemical characterization of iron slags from the Roman archaeological site of Forua (Biscay, North Spain). Microchem. J. 2018, 138, 246–254. [Google Scholar] [CrossRef]
- Turina, V.; Ferraris, E.; Andreani, C.; Licoccia, S.; Romanelli, G.; Senesi, R.; Venuti, V. Neutron Spectroscopy of Leather Artefacts from Museo Egizio (TOSCA), STFC ISIS Facility; STFC ISIS Neutron and Muon Source: Oxford, UK, 2021. [Google Scholar] [CrossRef]
- Turina, V.; Ferraris, E.; Andreani, C.; Licoccia, S.; Romanelli, G.; Senesi, R.; Venuti, V. Neutron Spectroscopy of Leather Artefacts from Museo Egizio (VESUVIO), STFC ISIS Facility; STFC ISIS Neutron and Muon Source: Oxford, UK, 2021. [Google Scholar] [CrossRef]


| Sample Reference Number | Mass [mg] | Description |
|---|---|---|
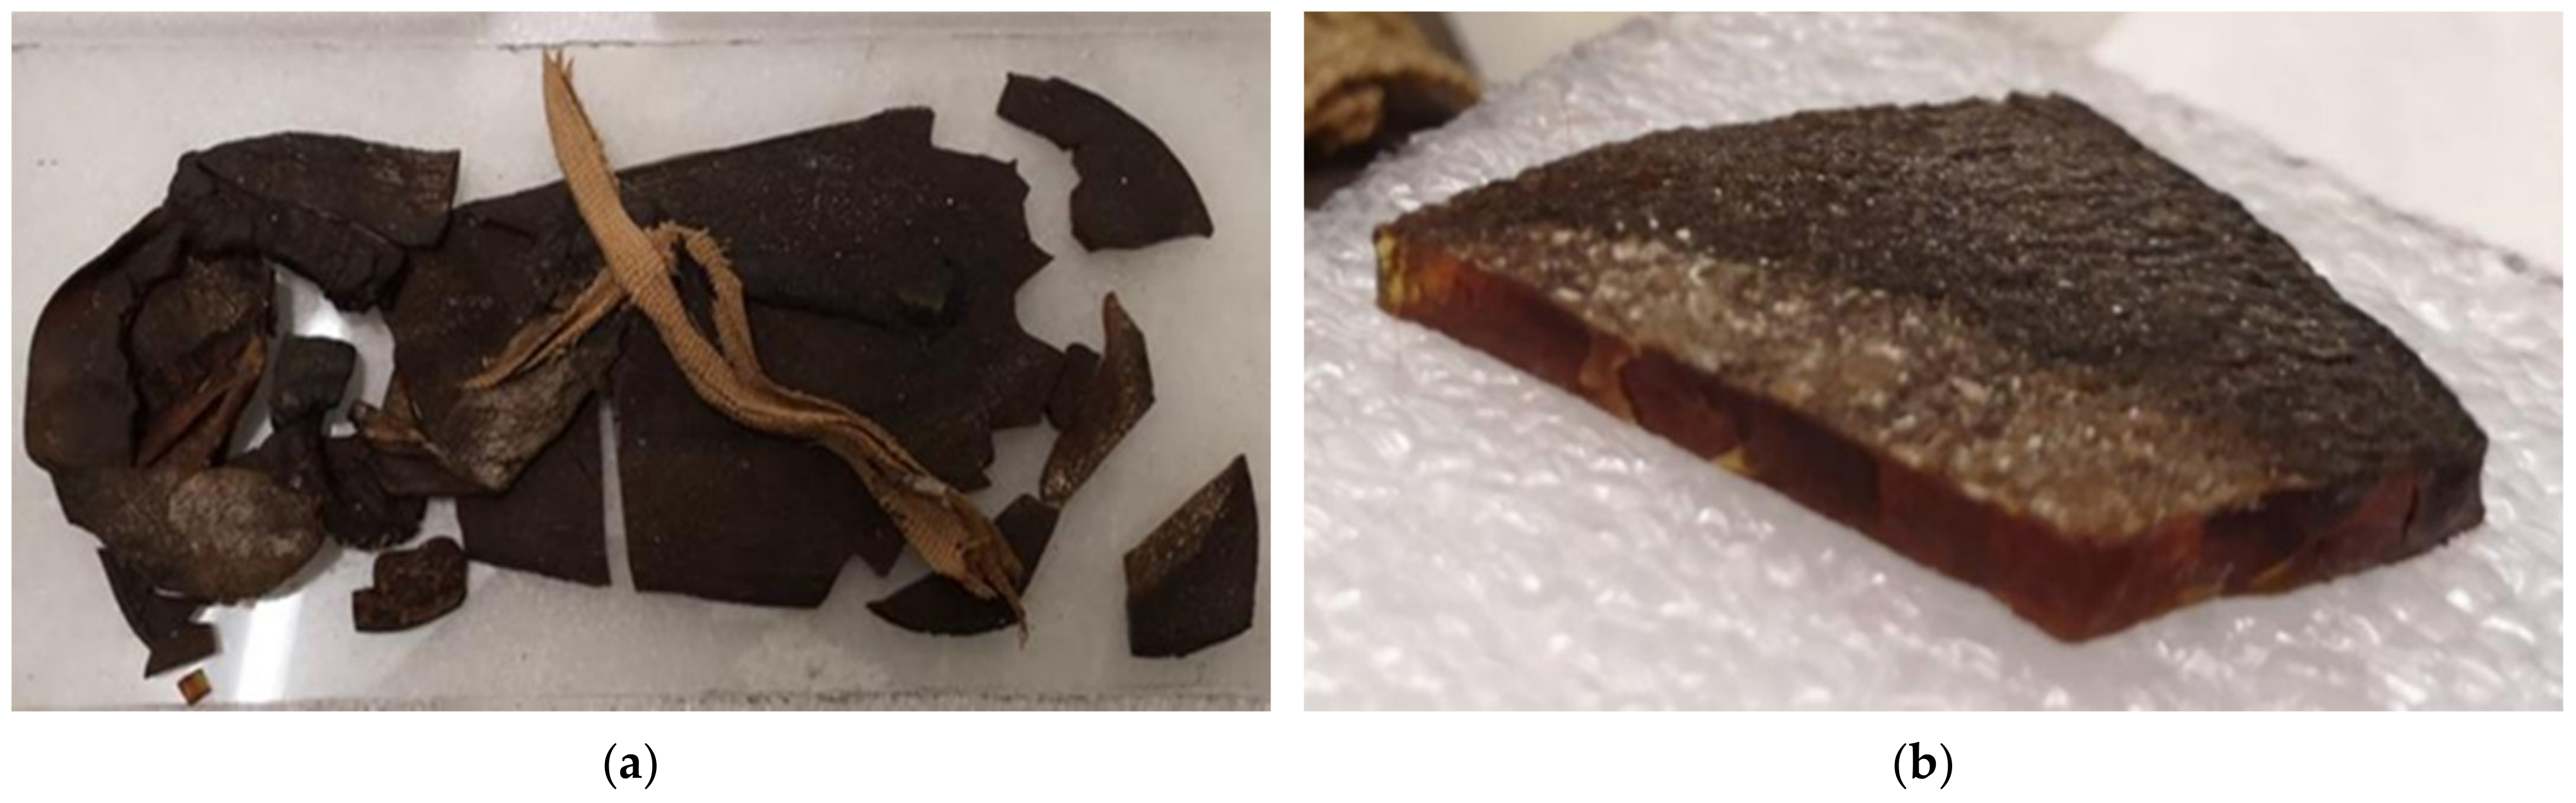
| S1/S. 08640 | 403 | Fragment from leather sandal, New Kingdom, XVIII Dynasty; Amenhotep II, Thutmose IV, Amenhotep III (1425-1353 B.C.) |
| S2/S. 14044 | 117 | Fragment from leather sandal, Old Kingdom, V Dynasty (2435-2306 B.C.) |
| S3/S. 08369 | 264 | Fragment from leather bag, New Kingdom, XVIII Dynasty, Amenhotep II, Thutmose IV, Amenhotep III (1425-1353 B.C.) |
| S4/S. 08507 | 30 | Fragment from leather stool, New Kingdom, XVIII Dynasty, Amenhotep II, Thutmose IV, Amenhotep III (1425-1353 B.C.) |
| S5/S. 05150 | 8 | Fragment from leather sandal, Late Period (722-332 B.C.) |
| Sample | Side | Elements |
|---|---|---|
| S1/08640 | Front | Ca, Cl, S, K, Fe, Ti, (Ba, Sr, As, Br, Zr) |
| Back | Ca, Cl, K, Ti, Fe, (Ba, Mn, Zr, Sr, Mo, Br) | |
| S2/14044 | Front | Ca, Cl, Ti, Fe, K, (Ba, Mn, Mo, Zr, Sr, Br, Rb) |
| Back | Ca, Cl, S, Fe, K, Ti, (Ba, Mn, Cu, Mo, Zr, Sr, Br, Rb) | |
| S3/08369 | Front | Ca, Fe, K, S, Cl, Ti, (Cu, Mn, Ba, Sr, Pb, Zr, Zn, Mo, As, Br, Rb) |
| Back | Ca, Fe, K, S, Cl, Ti, (Cu, Mn, Ba, Sr, Pb, Zr, Zn, Mo, As, Br, Rb) | |
| S4/08507 | Front | Ca, Ti, Cl, Ba, Fe, (Mo, Sr, Zr, Rb, Br) |
| Back | Ca, Cl, Ti, K, Fe, (Ba, Sr, Mn, Mo, Zr, Br, Rb) | |
| S5/05150 | Front | Ca, Fe, Cl, K, Ti, (Ba, Mn, Sr, Mo, Zr, Br, Rb) |
| Back | Ca, Cl, Ti, Fe, K, (Ba, Mn, Sr, Mo, Zr, Br, Rb) |
Publisher’s Note: MDPI stays neutral with regard to jurisdictional claims in published maps and institutional affiliations. |
© 2022 by the authors. Licensee MDPI, Basel, Switzerland. This article is an open access article distributed under the terms and conditions of the Creative Commons Attribution (CC BY) license (https://creativecommons.org/licenses/by/4.0/).
Share and Cite
Romanelli, G.; Andreani, C.; Ferraris, E.; Greco, C.; Ikram, S.; Licoccia, S.; Paladini, G.; Parker, S.F.; Preziosi, E.; Senesi, R.; et al. Neutron-Enhanced Information on the Laboratory Characterization of Ancient Egyptian Leathers: Hydration and Preservation Status. Information 2022, 13, 467. https://0-doi-org.brum.beds.ac.uk/10.3390/info13100467
Romanelli G, Andreani C, Ferraris E, Greco C, Ikram S, Licoccia S, Paladini G, Parker SF, Preziosi E, Senesi R, et al. Neutron-Enhanced Information on the Laboratory Characterization of Ancient Egyptian Leathers: Hydration and Preservation Status. Information. 2022; 13(10):467. https://0-doi-org.brum.beds.ac.uk/10.3390/info13100467
Chicago/Turabian StyleRomanelli, Giovanni, Carla Andreani, Enrico Ferraris, Christian Greco, Salima Ikram, Silvia Licoccia, Giuseppe Paladini, Stewart F. Parker, Enrico Preziosi, Roberto Senesi, and et al. 2022. "Neutron-Enhanced Information on the Laboratory Characterization of Ancient Egyptian Leathers: Hydration and Preservation Status" Information 13, no. 10: 467. https://0-doi-org.brum.beds.ac.uk/10.3390/info13100467