Article

Non-Invasive Classification of Blood Glucose Level for Early Detection Diabetes Based on Photoplethysmography Signal

1
Department of Electronic Engineering, Universitas Indonesia, Depok 16424, Indonesia
2
Department of Mathematics, Universitas Indonesia, Depok 16424, Indonesia
3
Department of Radiodiagnostic and Radiotherapy, Poltekkes Kemenkes Jakarta II, Jakarta 12120, Indonesia
*
Author to whom correspondence should be addressed.
Submission received: 25 November 2021 / Revised: 9 January 2022 / Accepted: 12 January 2022 / Published: 24 January 2022
(This article belongs to the Special Issue Biomedical Signal Processing and Data Analytics in Healthcare Systems)

Abstract

:
Monitoring systems for the early detection of diabetes are essential to avoid potential expensive medical costs. Currently, only invasive monitoring methods are commercially available. These methods have significant disadvantages as patients experience discomfort while obtaining blood samples. A non-invasive method of blood glucose level (BGL) monitoring that is painless and low-cost would address the limitations of invasive techniques. Photoplethysmography (PPG) collects a signal from a finger sensor using a photodiode, and a nearby infrared LED light. The combination of the PPG electronic circuit with artificial intelligence makes it possible to implement the classification of BGL. However, one major constraint of deep learning is the long training phase. We try to overcome this limitation and offer a concept for classifying type 2 diabetes (T2D) using a machine learning algorithm based on PPG. We gathered 400 raw datasets of BGL measured with PPG and divided these points into two classification levels, according to the National Institute for Clinical Excellence, namely, “normal” and “diabetes”. Based on the results for testing between the models, the ensemble bagged trees algorithm achieved the best results with an accuracy of 98%.

1. Introduction

Diabetes is a medical emergency that can cause various complications or even death in adults. Diabetes is often referred to as the “Silent Killer” [1,2] if it is not diagnosed in its early stages. It causes many people to ignore their diabetes and not realize its severity or presence until their blood sugar is above standard. A 2017 report by the International Diabetes Federation stated that the prevalence of diabetes would continue to increase globally [3].
The two major types of diabetes, type 1 (T1D) and type 2 (T2D) have the same symptoms. The types of diabetes are distinguished by their cause. T1D is caused by a deficiency of insulin-secreting β-cells in the pancreas and cannot be cured, but the patient’s quality of life can be maintained. T2D is characterized by insulin resistance which develops throughout the patient’s life. As T2D is an acquired metabolic condition, people have a higher probability of having T2D than T1D [4]. T2D can be avoided or reduced by a better understanding the risks and lifestyle changes. Effective prevention by regularly monitoring blood glucose levels (BGL) is necessary for diabetes management [5,6,7].
Currently, only invasive methods for monitoring BGL are commercially available. Blood glucose laboratory tests and glucometers are the only commercial options. Both ways are painful for the patient, as they use either a syringe or a finger prick procedure. However, the invasive methods provide a high degree of accuracy [8].
Non-invasive methods can be developed to overcome the limitations of invasive procedures [9]. A painless, easy to operate, and low-cost will improve patient compliance with routine blood glucose monitoring and early detection of diabetes [8,10]. Non-invasive methods to monitor or predict BGL have been developed using different techniques, as shown in Figure 1 [1,8,10,11,12,13,14]. The preferred approach is based on sensors and optical techniques [11,15,16,17]. However, these non-invasive methods are still in the early stages of development [18]. Various research studies with new techniques have emerged, requiring constant updating of the available information. One of these new methods uses photoplethysmography (PPG), as shown in Figure 1.
PPG is a non-invasive optical technique that measures changes in blood volume based on variations in the intensity of light that passes through or is reflected by human organs [19,20,21]. The PPG signal is collected from a finger sensor that uses a photodiode as an optical sensor to capture light from an infrared LED, as shown in Figure 2.
The Prototype of PPG signals is an easy and inexpensive optical technique measurement method that could monitor BGL in diabetes [14,17,19]. Many academics have developed prototypes with optical sensor-based data-acquisition systems. The prototypes are supported by the development of embedded system technology and relatively affordable sensor prices.
PPG signals contain a lot of information about blood [18]. The PPG signal can be explored in assessing vital signs such as blood pressure, cardiac output, respiration, and the presence of diabetes. PPG can easily capture sequential heartbeats, making it possible to measure not only heart rate (HR) but also heart rate variability (HRV) [22,23]. Derivation, HRV signal from electrocardiogram (ECG), is calculated from R–R interval. In contrast, the calculation of the HRV signal from the PPG signal uses the inter-beat interval (IBI) or pulse interval (PPI) [24], as shown in Figure 3. HRV measures the time duration varies between successive heartbeats, and this method has been widely used as an indicator of various disease conditions. The HRV strongly reflects the parasympathetic and sympathetic branches of the autonomic nervous system (ANS) [25]. ANS regulates the body’s metabolic system, which plays an essential role in regulating blood glucose levels [26].
Previous studies identified several associations between HRV and blood glucose level (BGL). These associations were only found in type 2 diabetes (T2D). Meanwhile, BGL of type 1 diabetes (T1D) does not significantly correlate with HRV parameters [27]. Parasympathetic and sympathetic activity is decreased due to the detrimental effects of glucose metabolism. It can be monitored via PPG morphology by calculating HRV [28].
There are still many things that have not been explored from PPG morphology. PPG morphology shows a different pattern between healthy and diabetic subjects of the same age in three different age ranges [28]. While healthy subjects have a slightly prolonged shape in the diastolic phase, people with diabetes usually have a bell-shaped PPG signal wave without a secondary peak. The arterial stiffness is caused by diabetes [29,30,31]. Stiffness index (SI) is a standard marker for significant arterial stiffness. SI value is calculated as subject height divided by peak-to-peak time (PTT) [32], as shown in Figure 4. Diabetic patients have significantly higher SI than non-diabetes patients [33]. A strong correlation with blood pressure, body mass index, and age was noted [33].
There are several potential sources of error in BGL estimation based on PPG morphology, including:
  • PPG is very sensitive toward being made unstable by movement, which can cause errors in measurement [34,35,36].
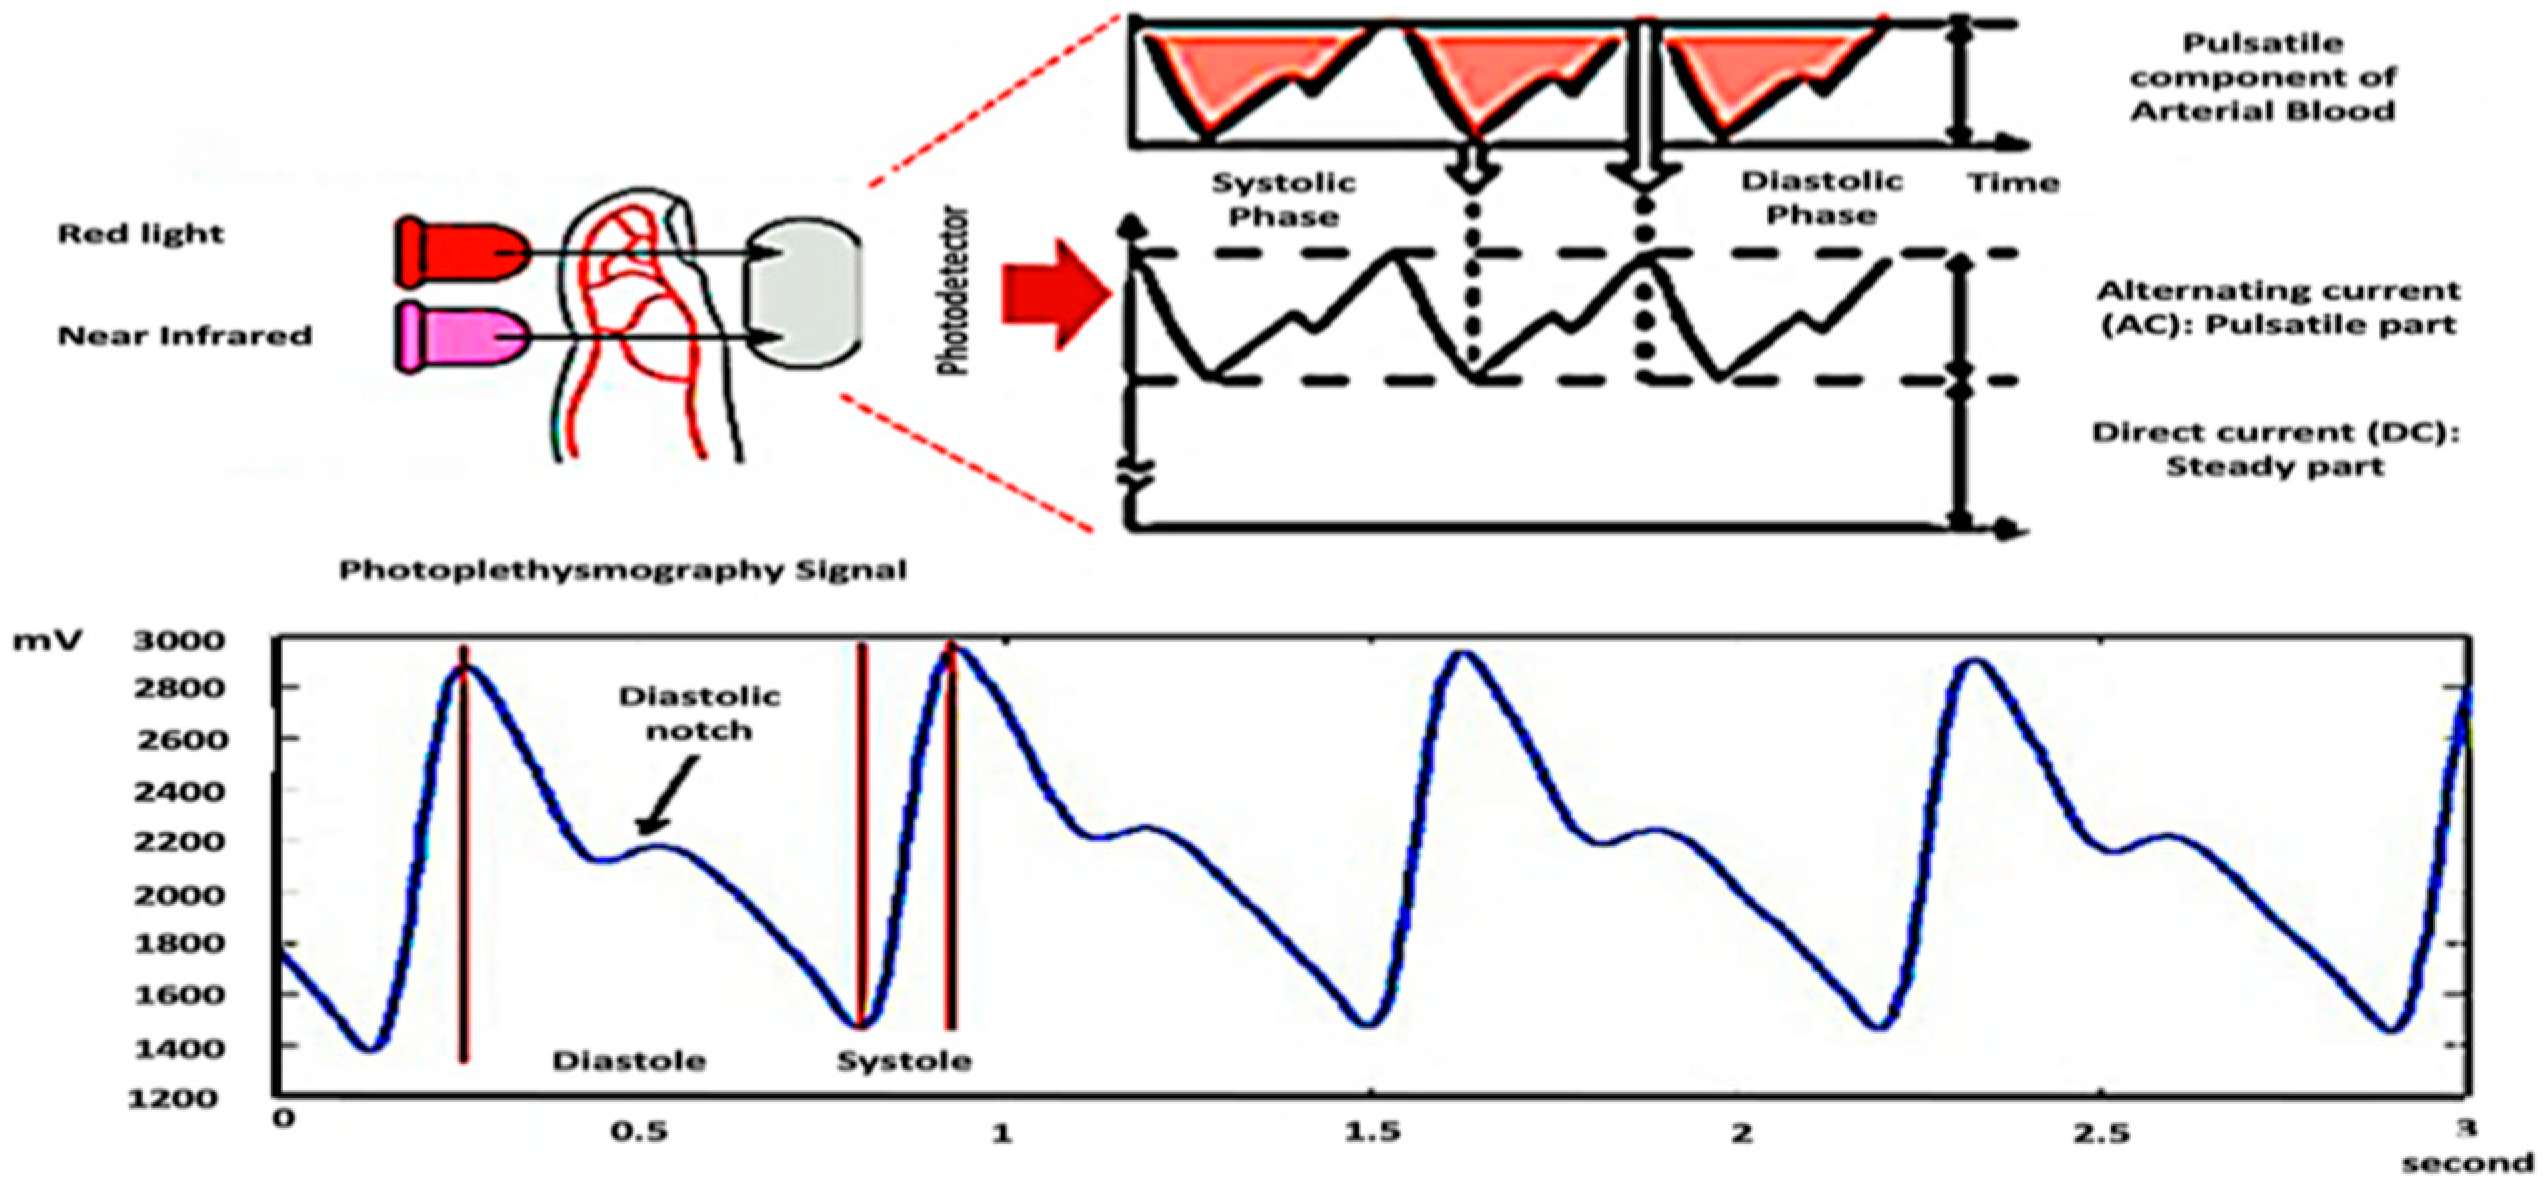
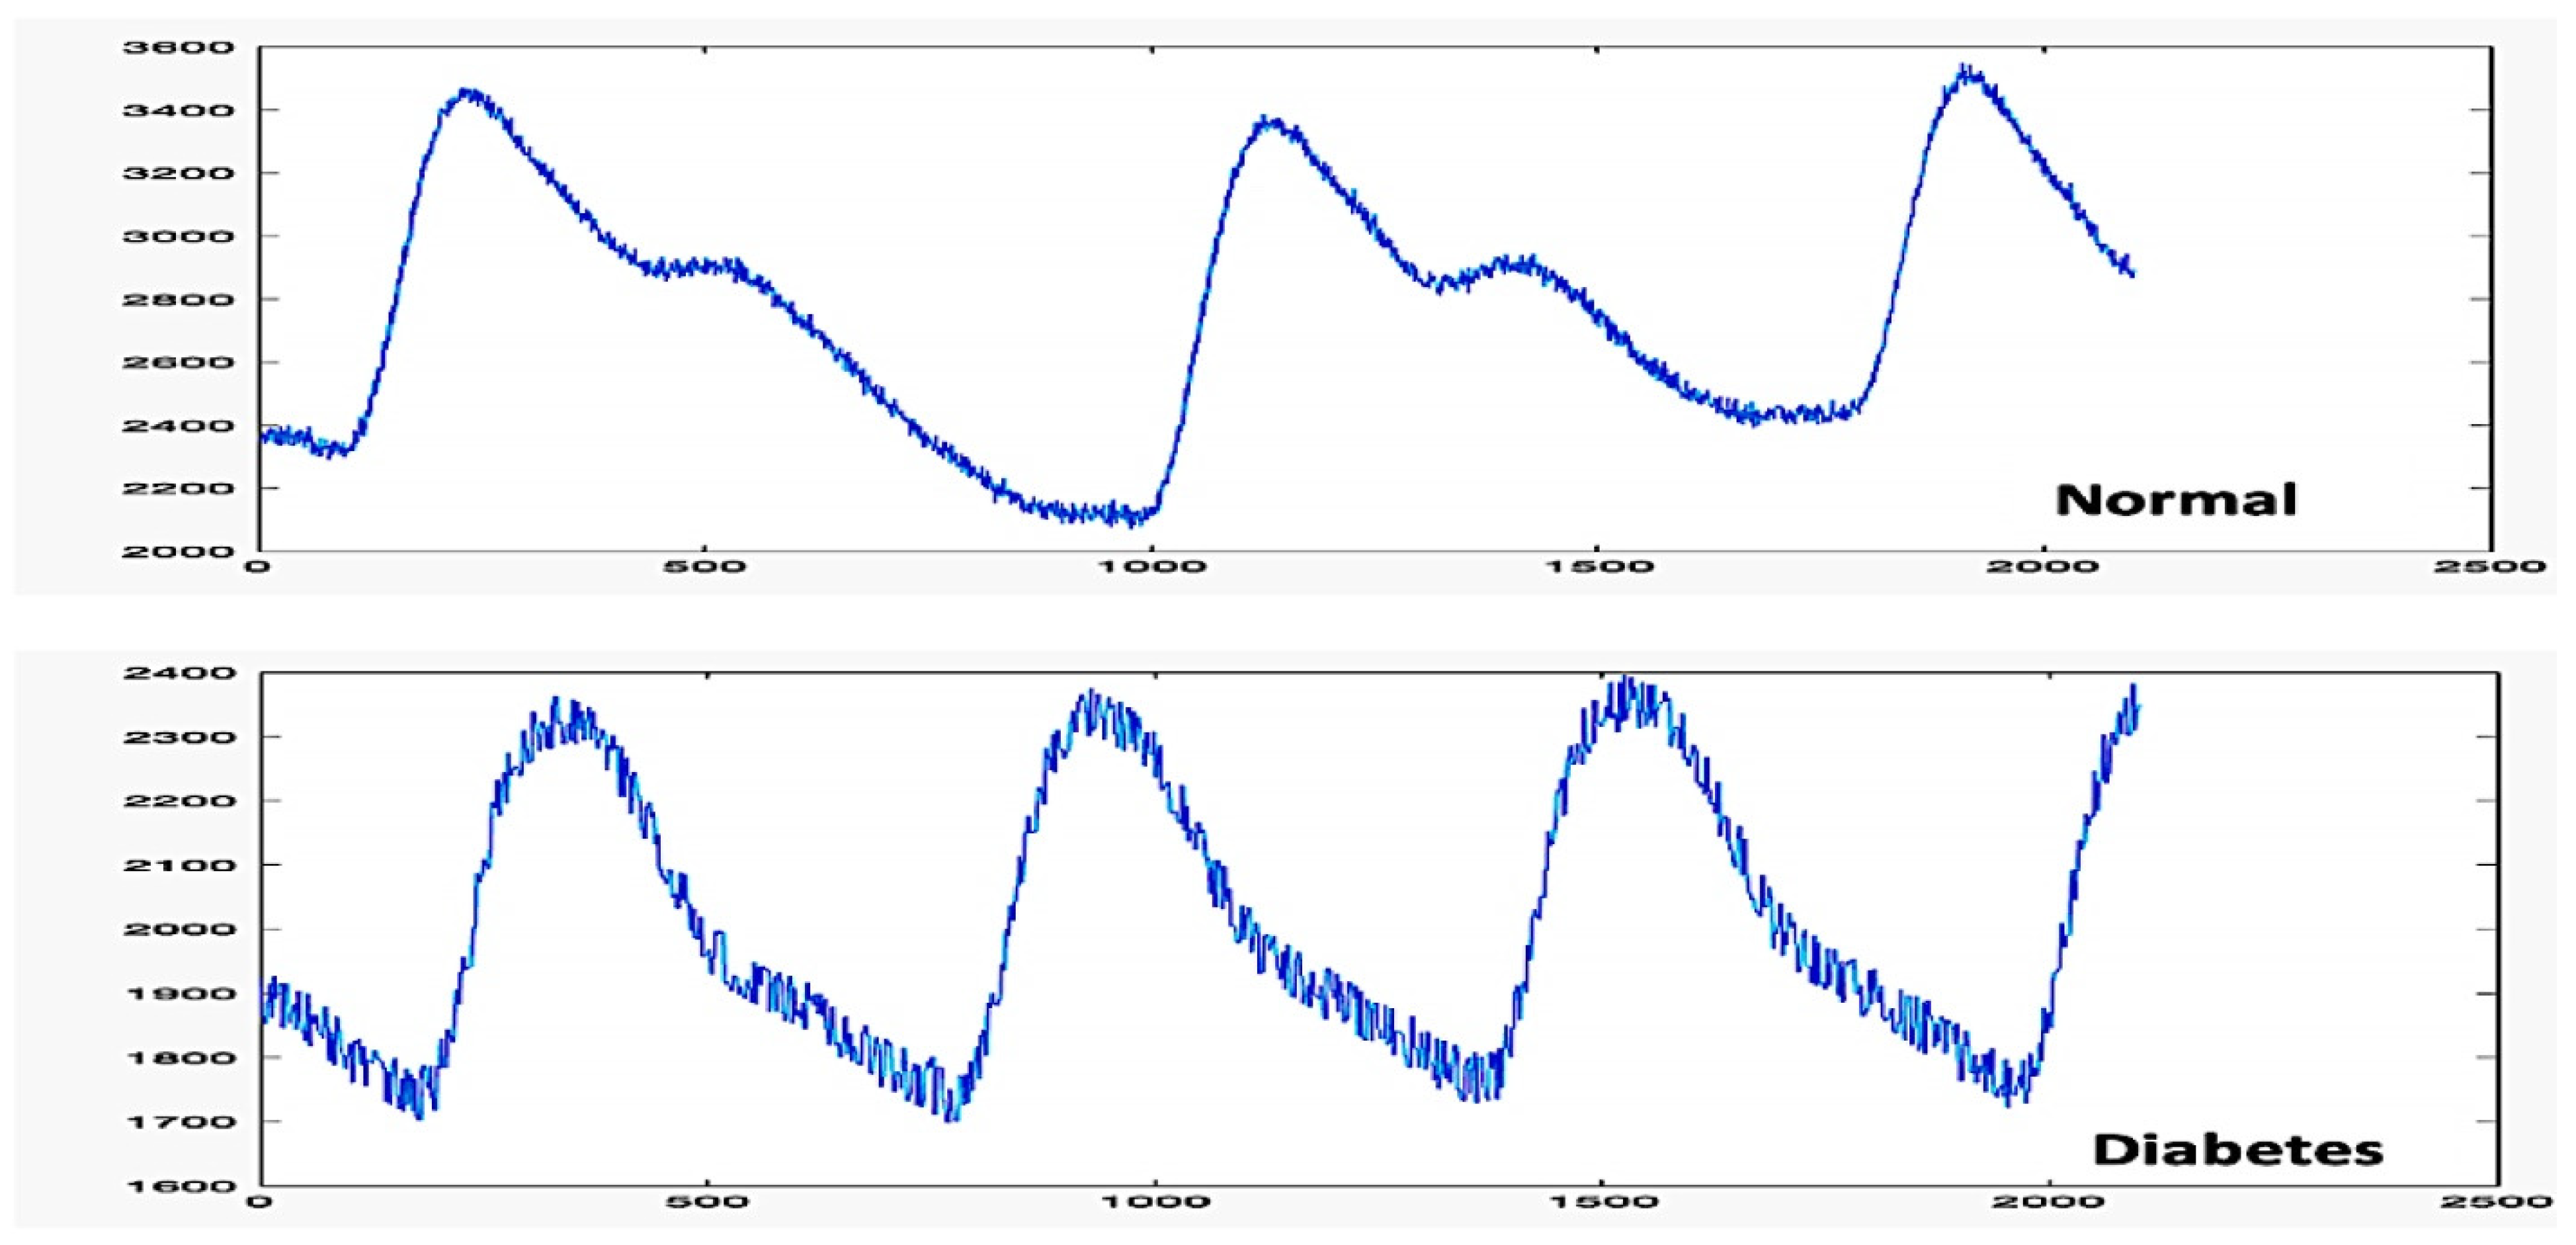
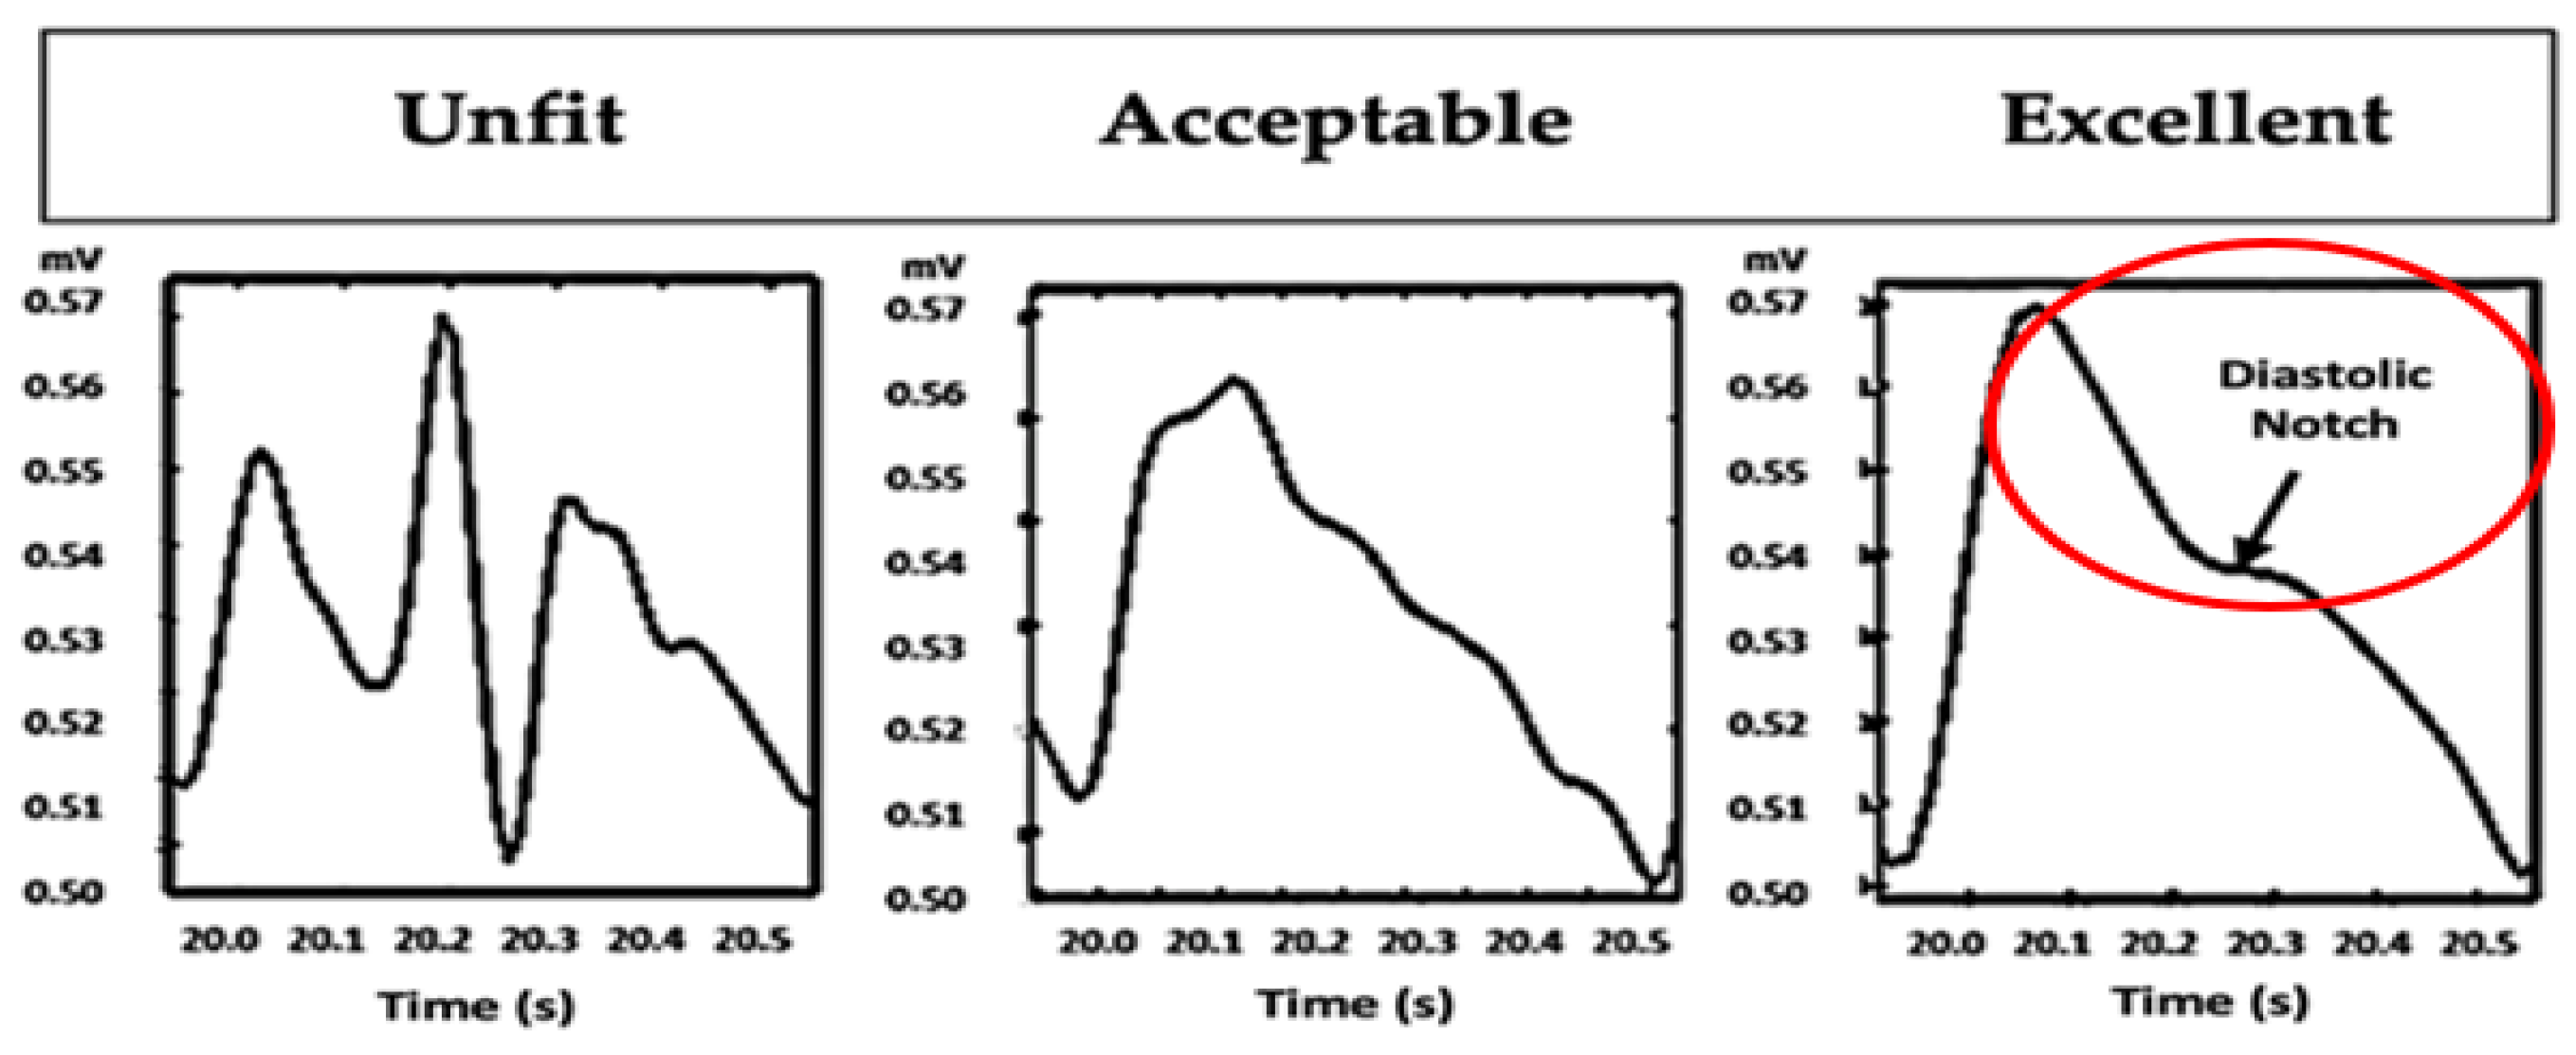
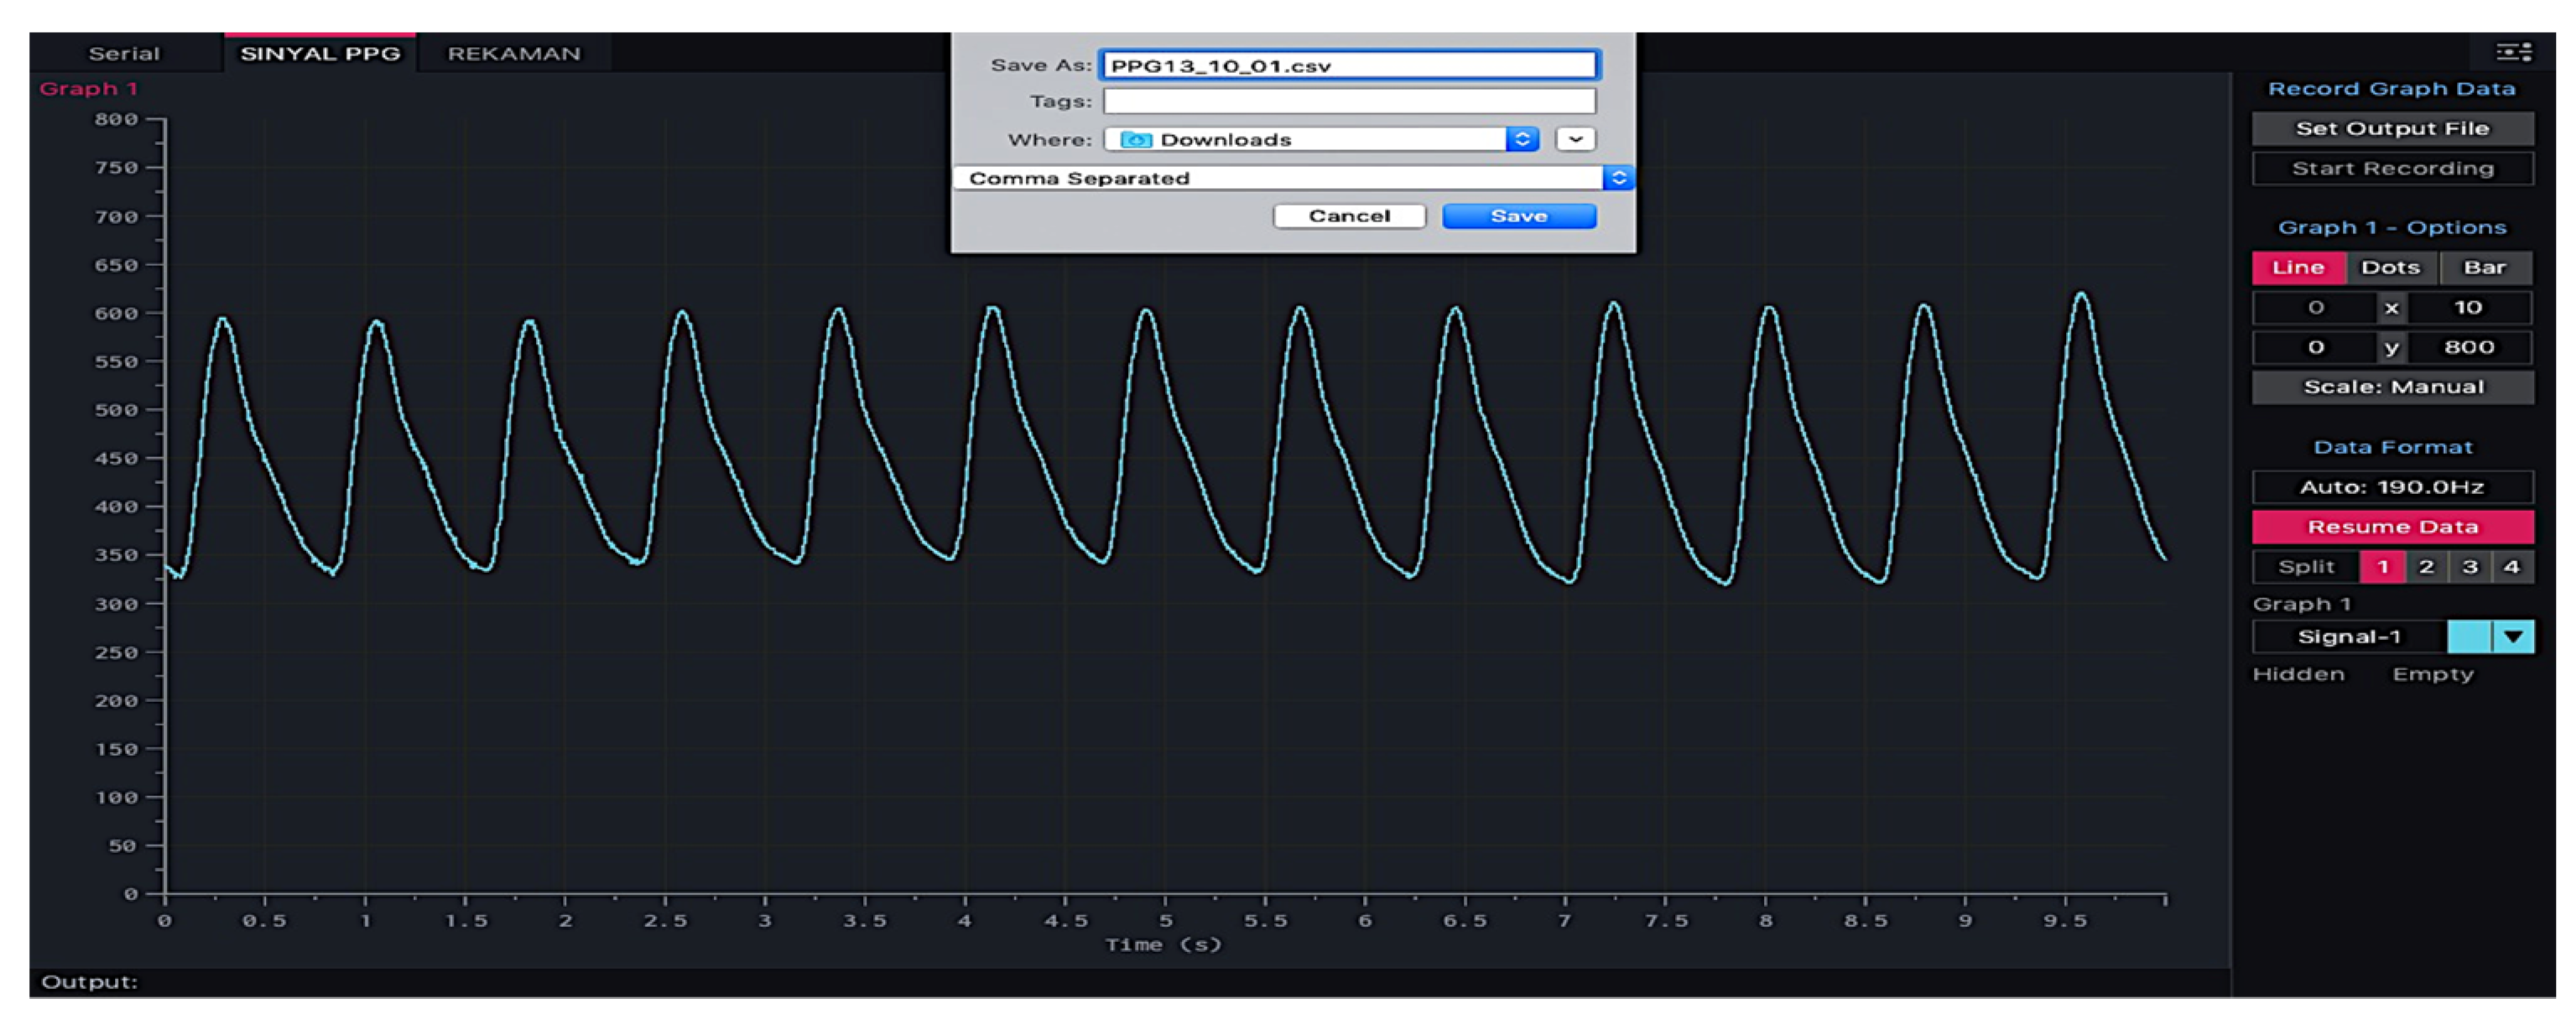
  • The quality of the PPG waveform depends on the quality of the blood circulation.
  • Characteristics of the PPG waveforms vary according to blood viscosity, vascular elasticity, and fluctuations in peripheral vascular resistance [37].
The combination of PPG data collected by near-infrared sensors with artificial intelligence (AI) makes it possible to predict BGL. Machine learning (ML) or deep learning (DL) approaches are equally good at predicting BGL using PPG [14,38,39,40,41,42,43,44]. A common challenge in implementing ML or DL is limited test samples. Currently, no data-source website contains the digital records of physiological signals, time series, and related data needed in this biomedical research.
Our proposed method is very relevant to obtaining a BGL classification in real-time. Most of the previous studies of PPG focused on estimating the BGL value [18,45,46]. The drawback of this estimation method is that clinical supervision is required. Meanwhile, the classification method helps patients to self-monitor for diabetes detection independently. Here are our main contributions:
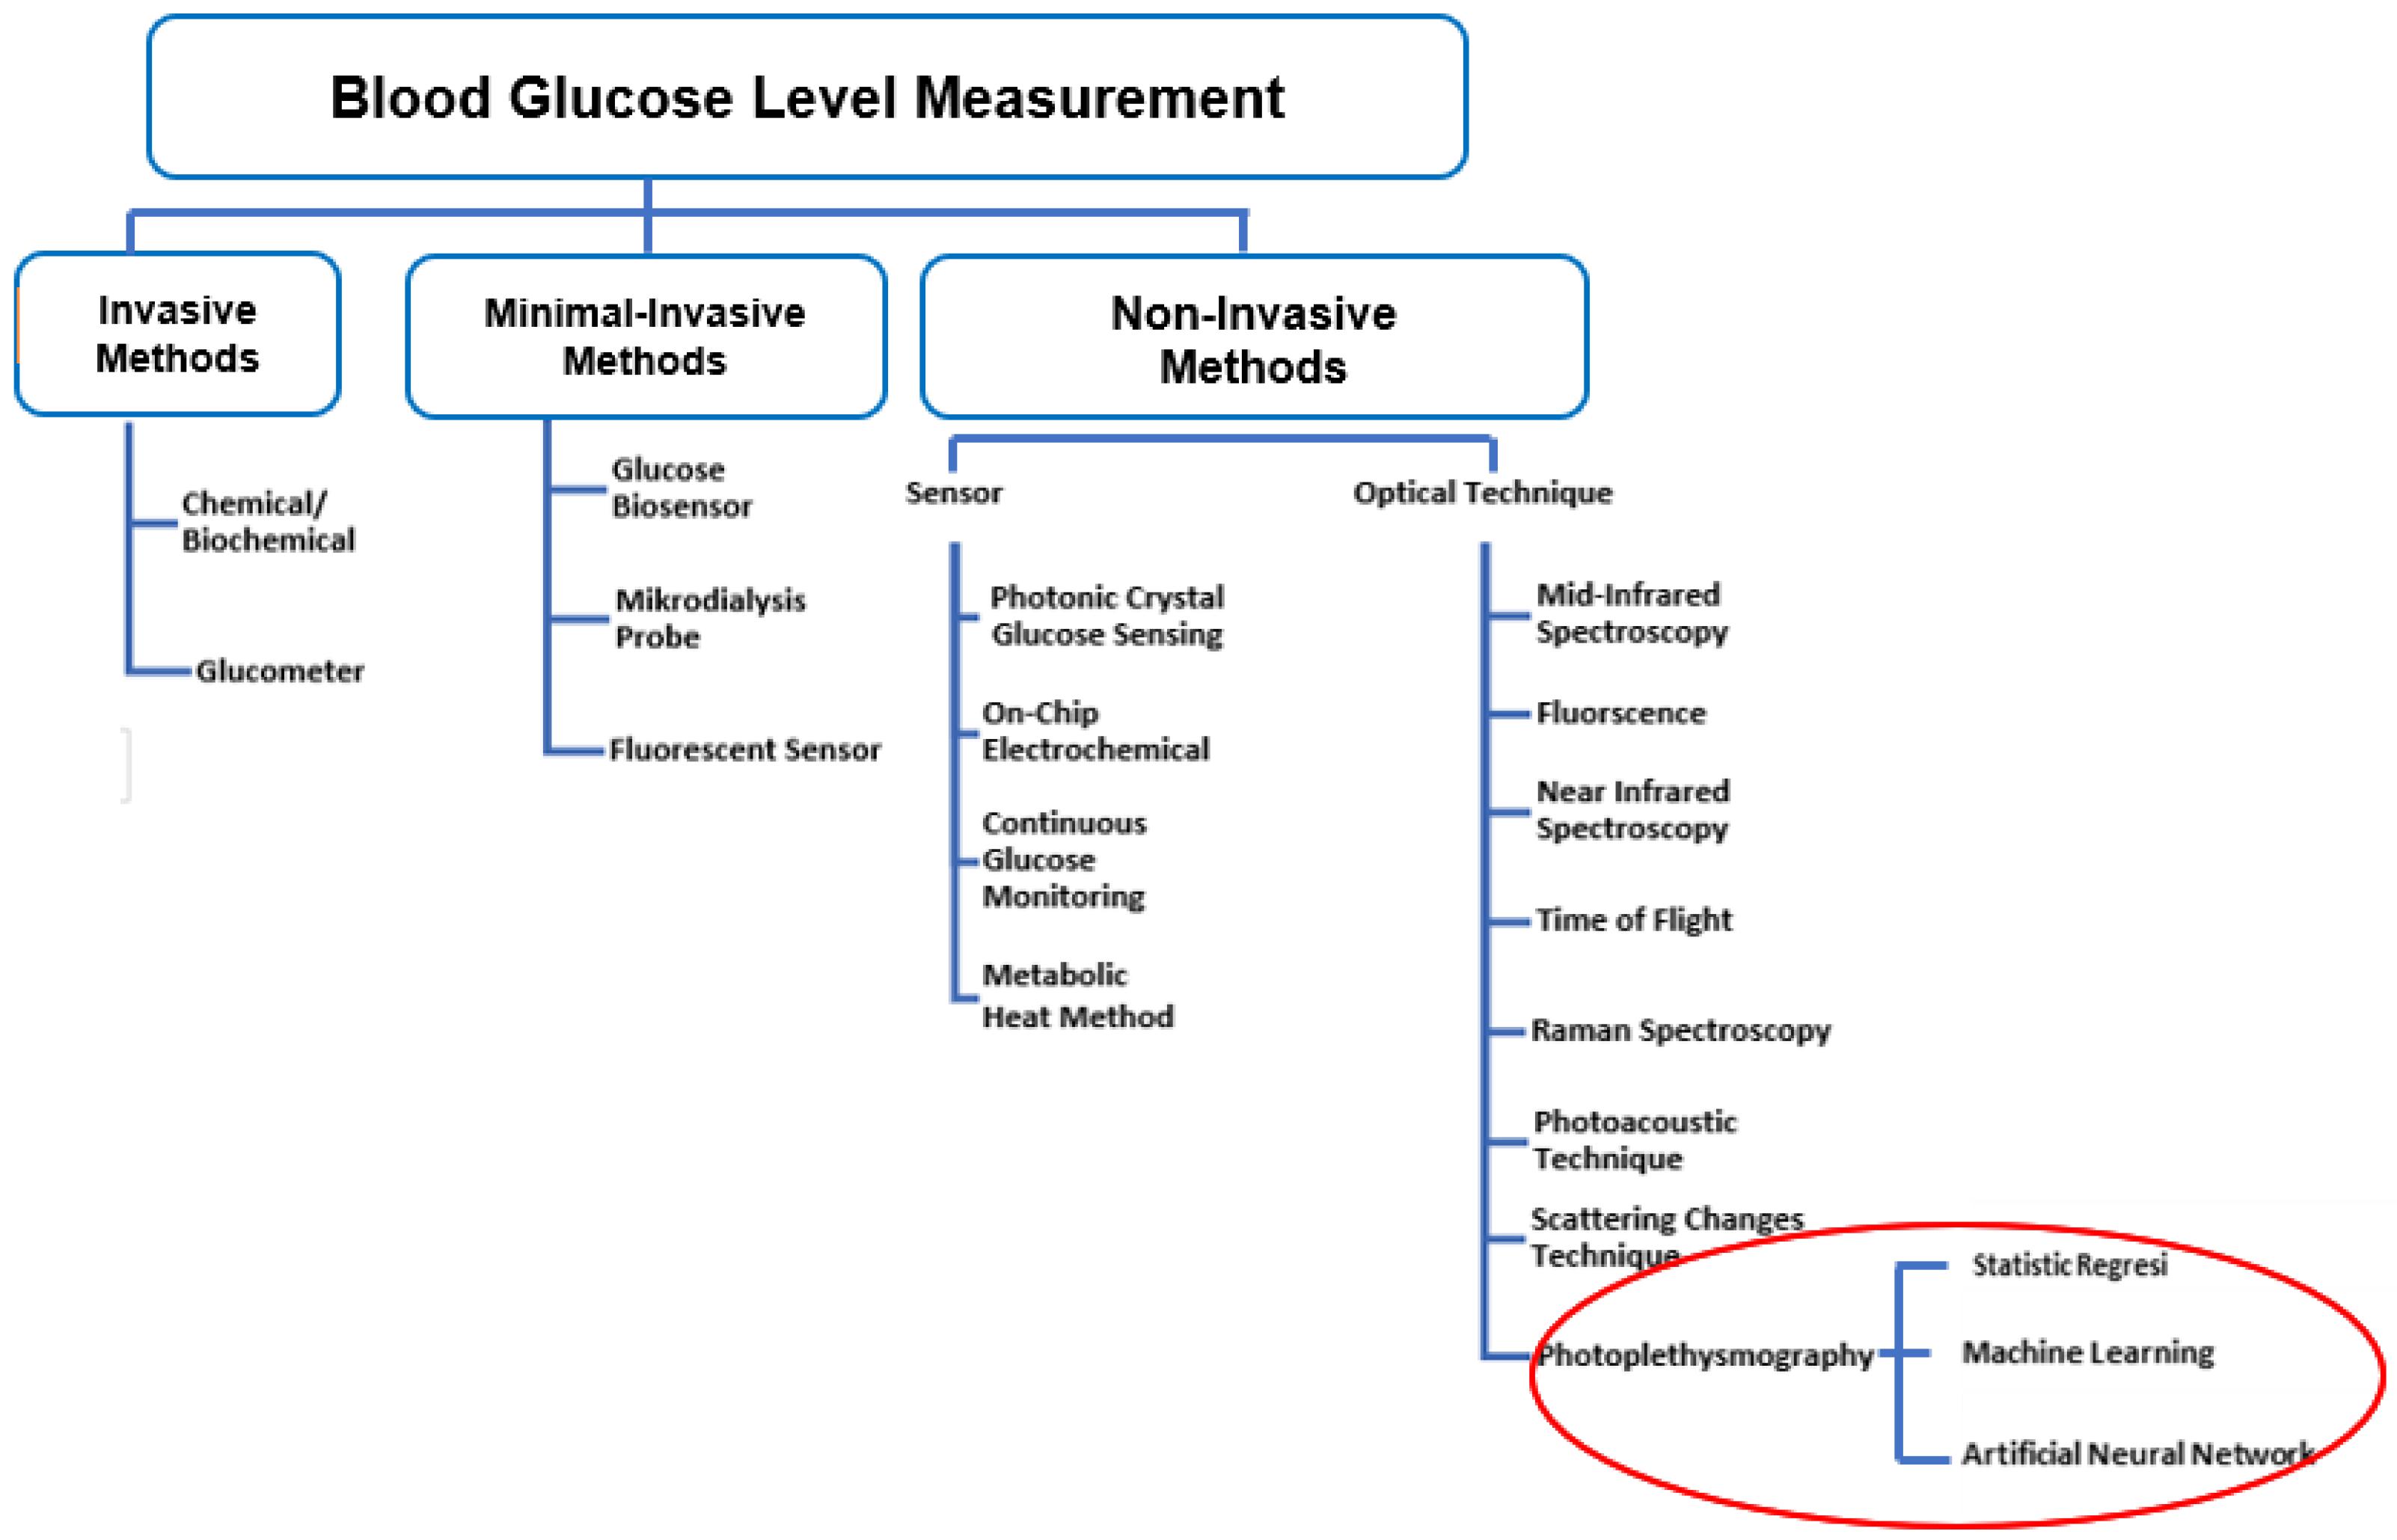
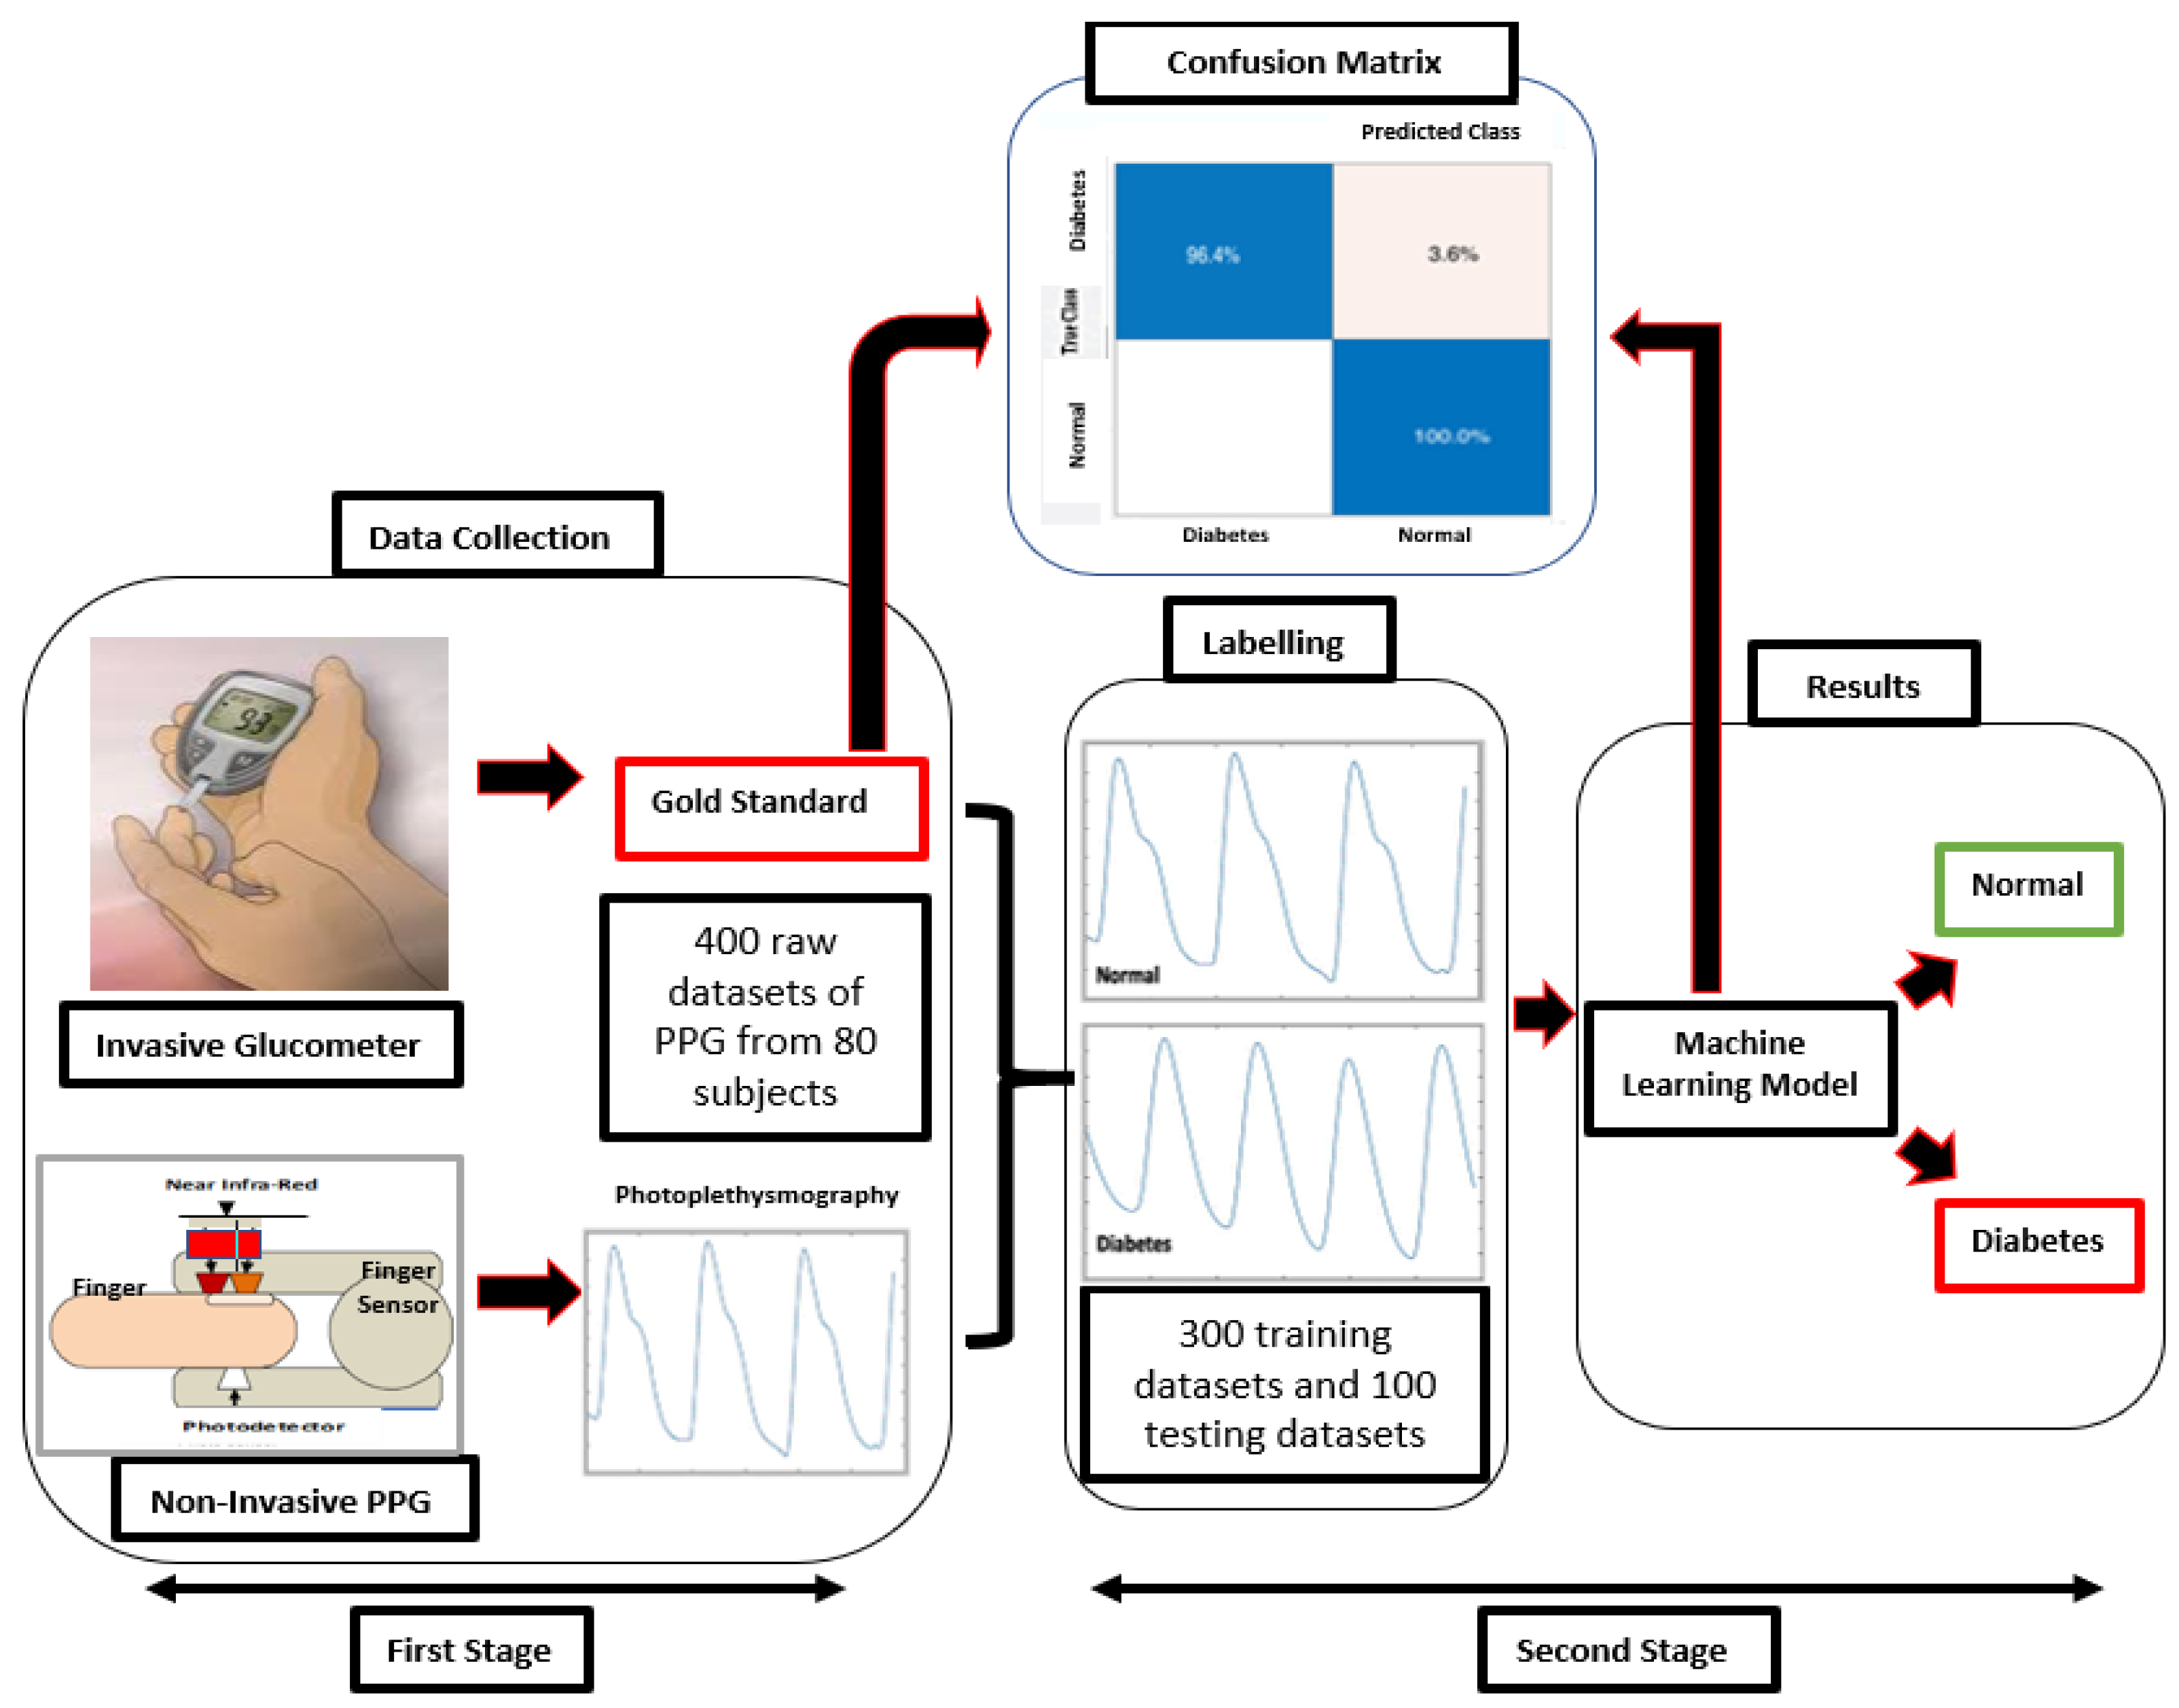
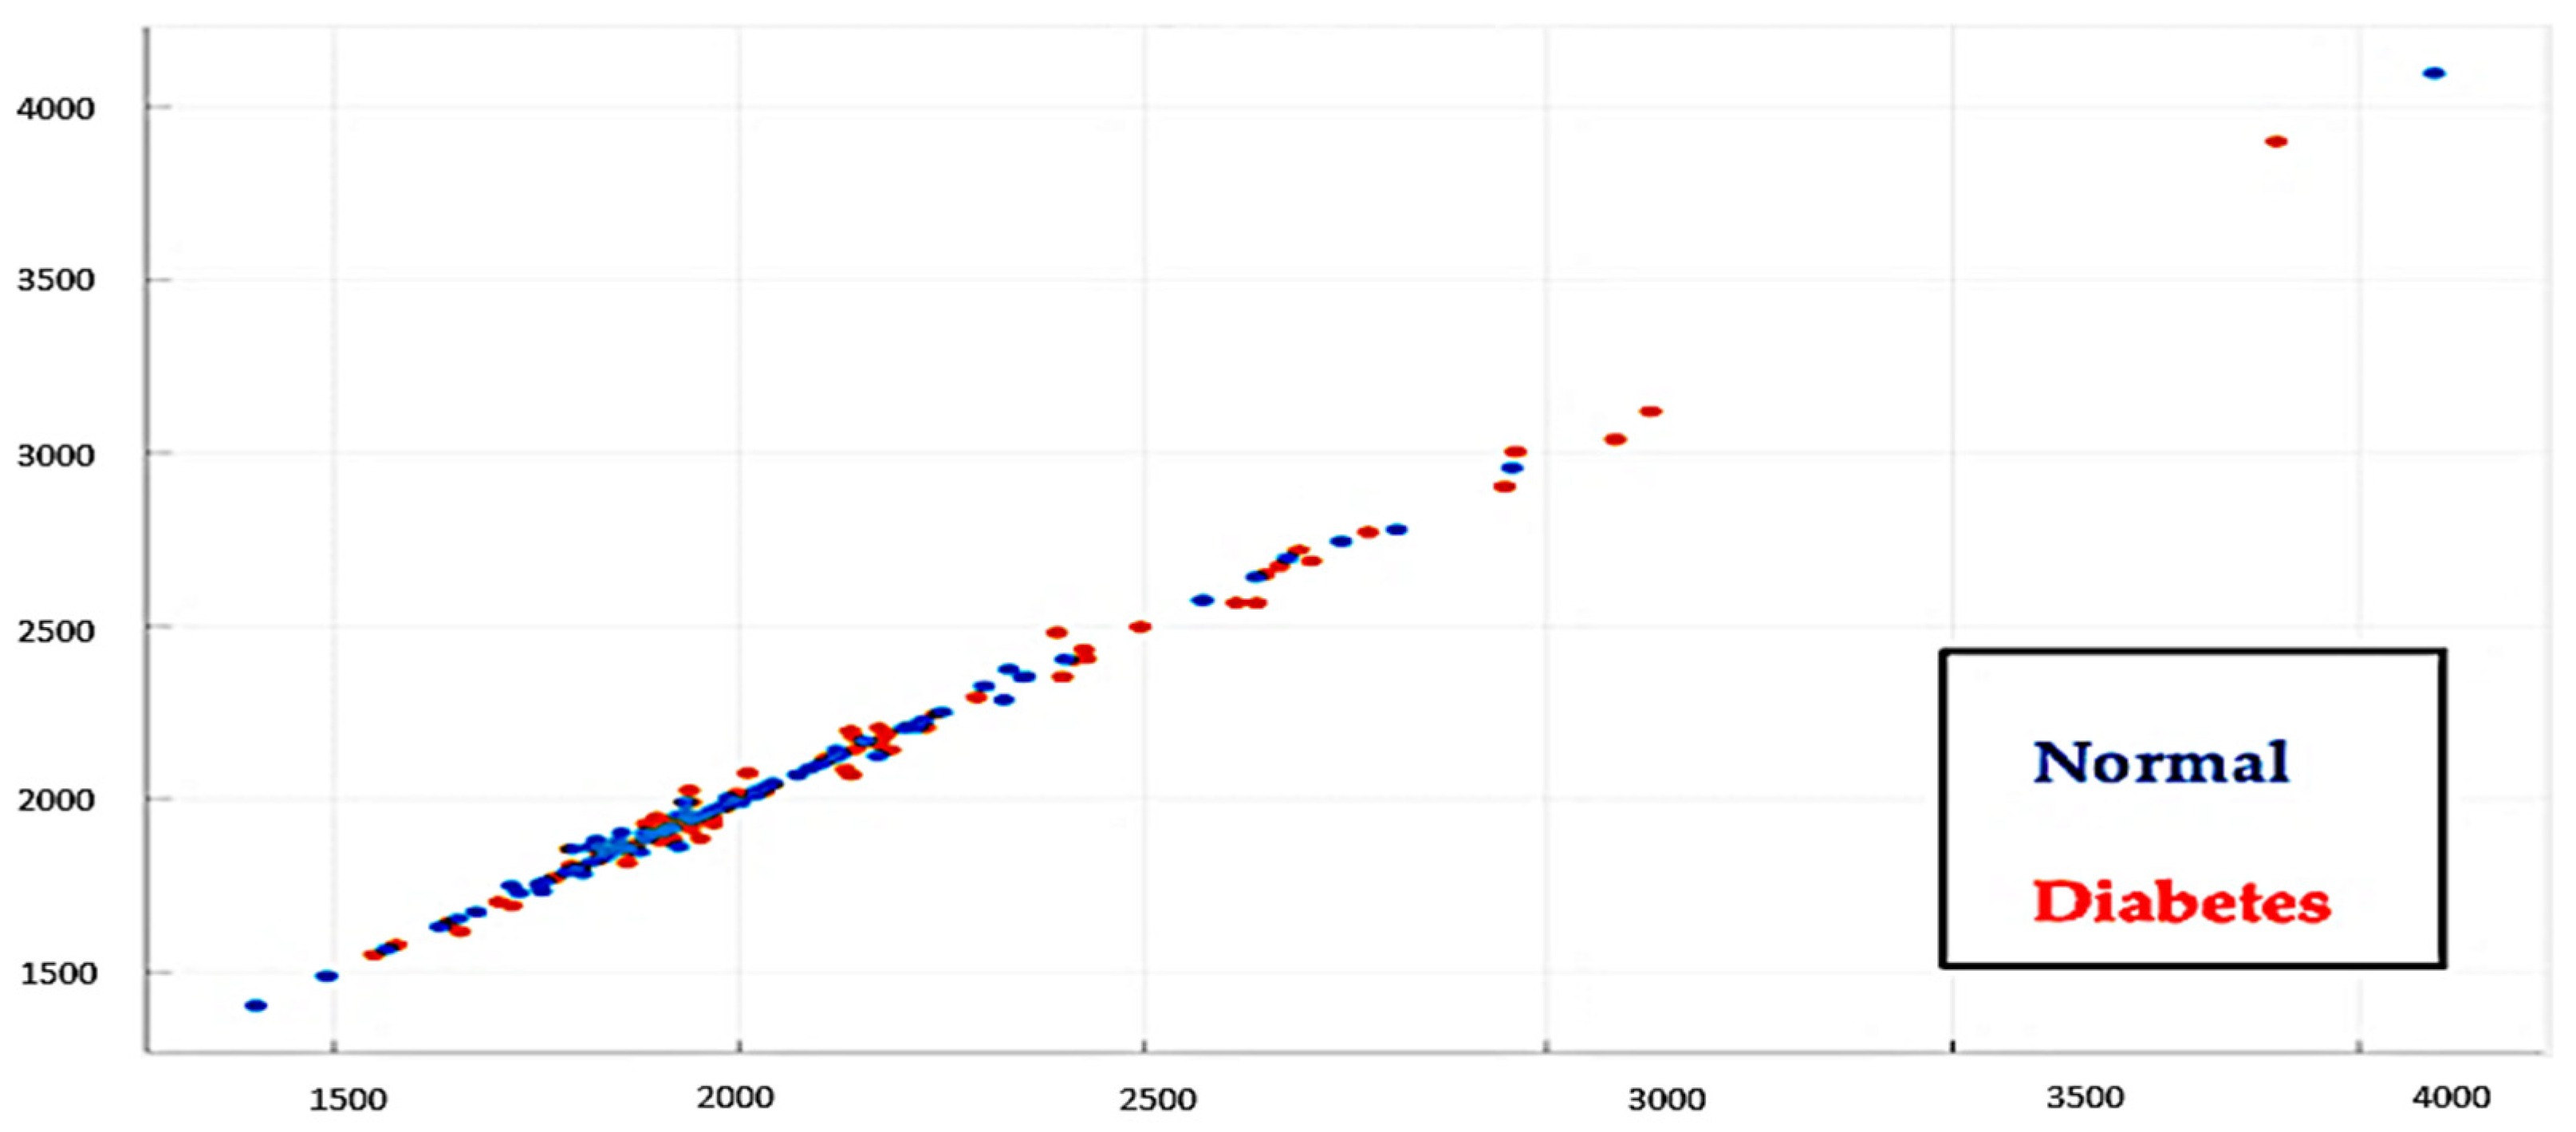
  • With our proposed method, users can immediately know the condition of their blood BGL. We focus on a BGL classification based on the PPG signal. Therefore, in this study, two BGL levels were established: “normal” and “diabetes”.
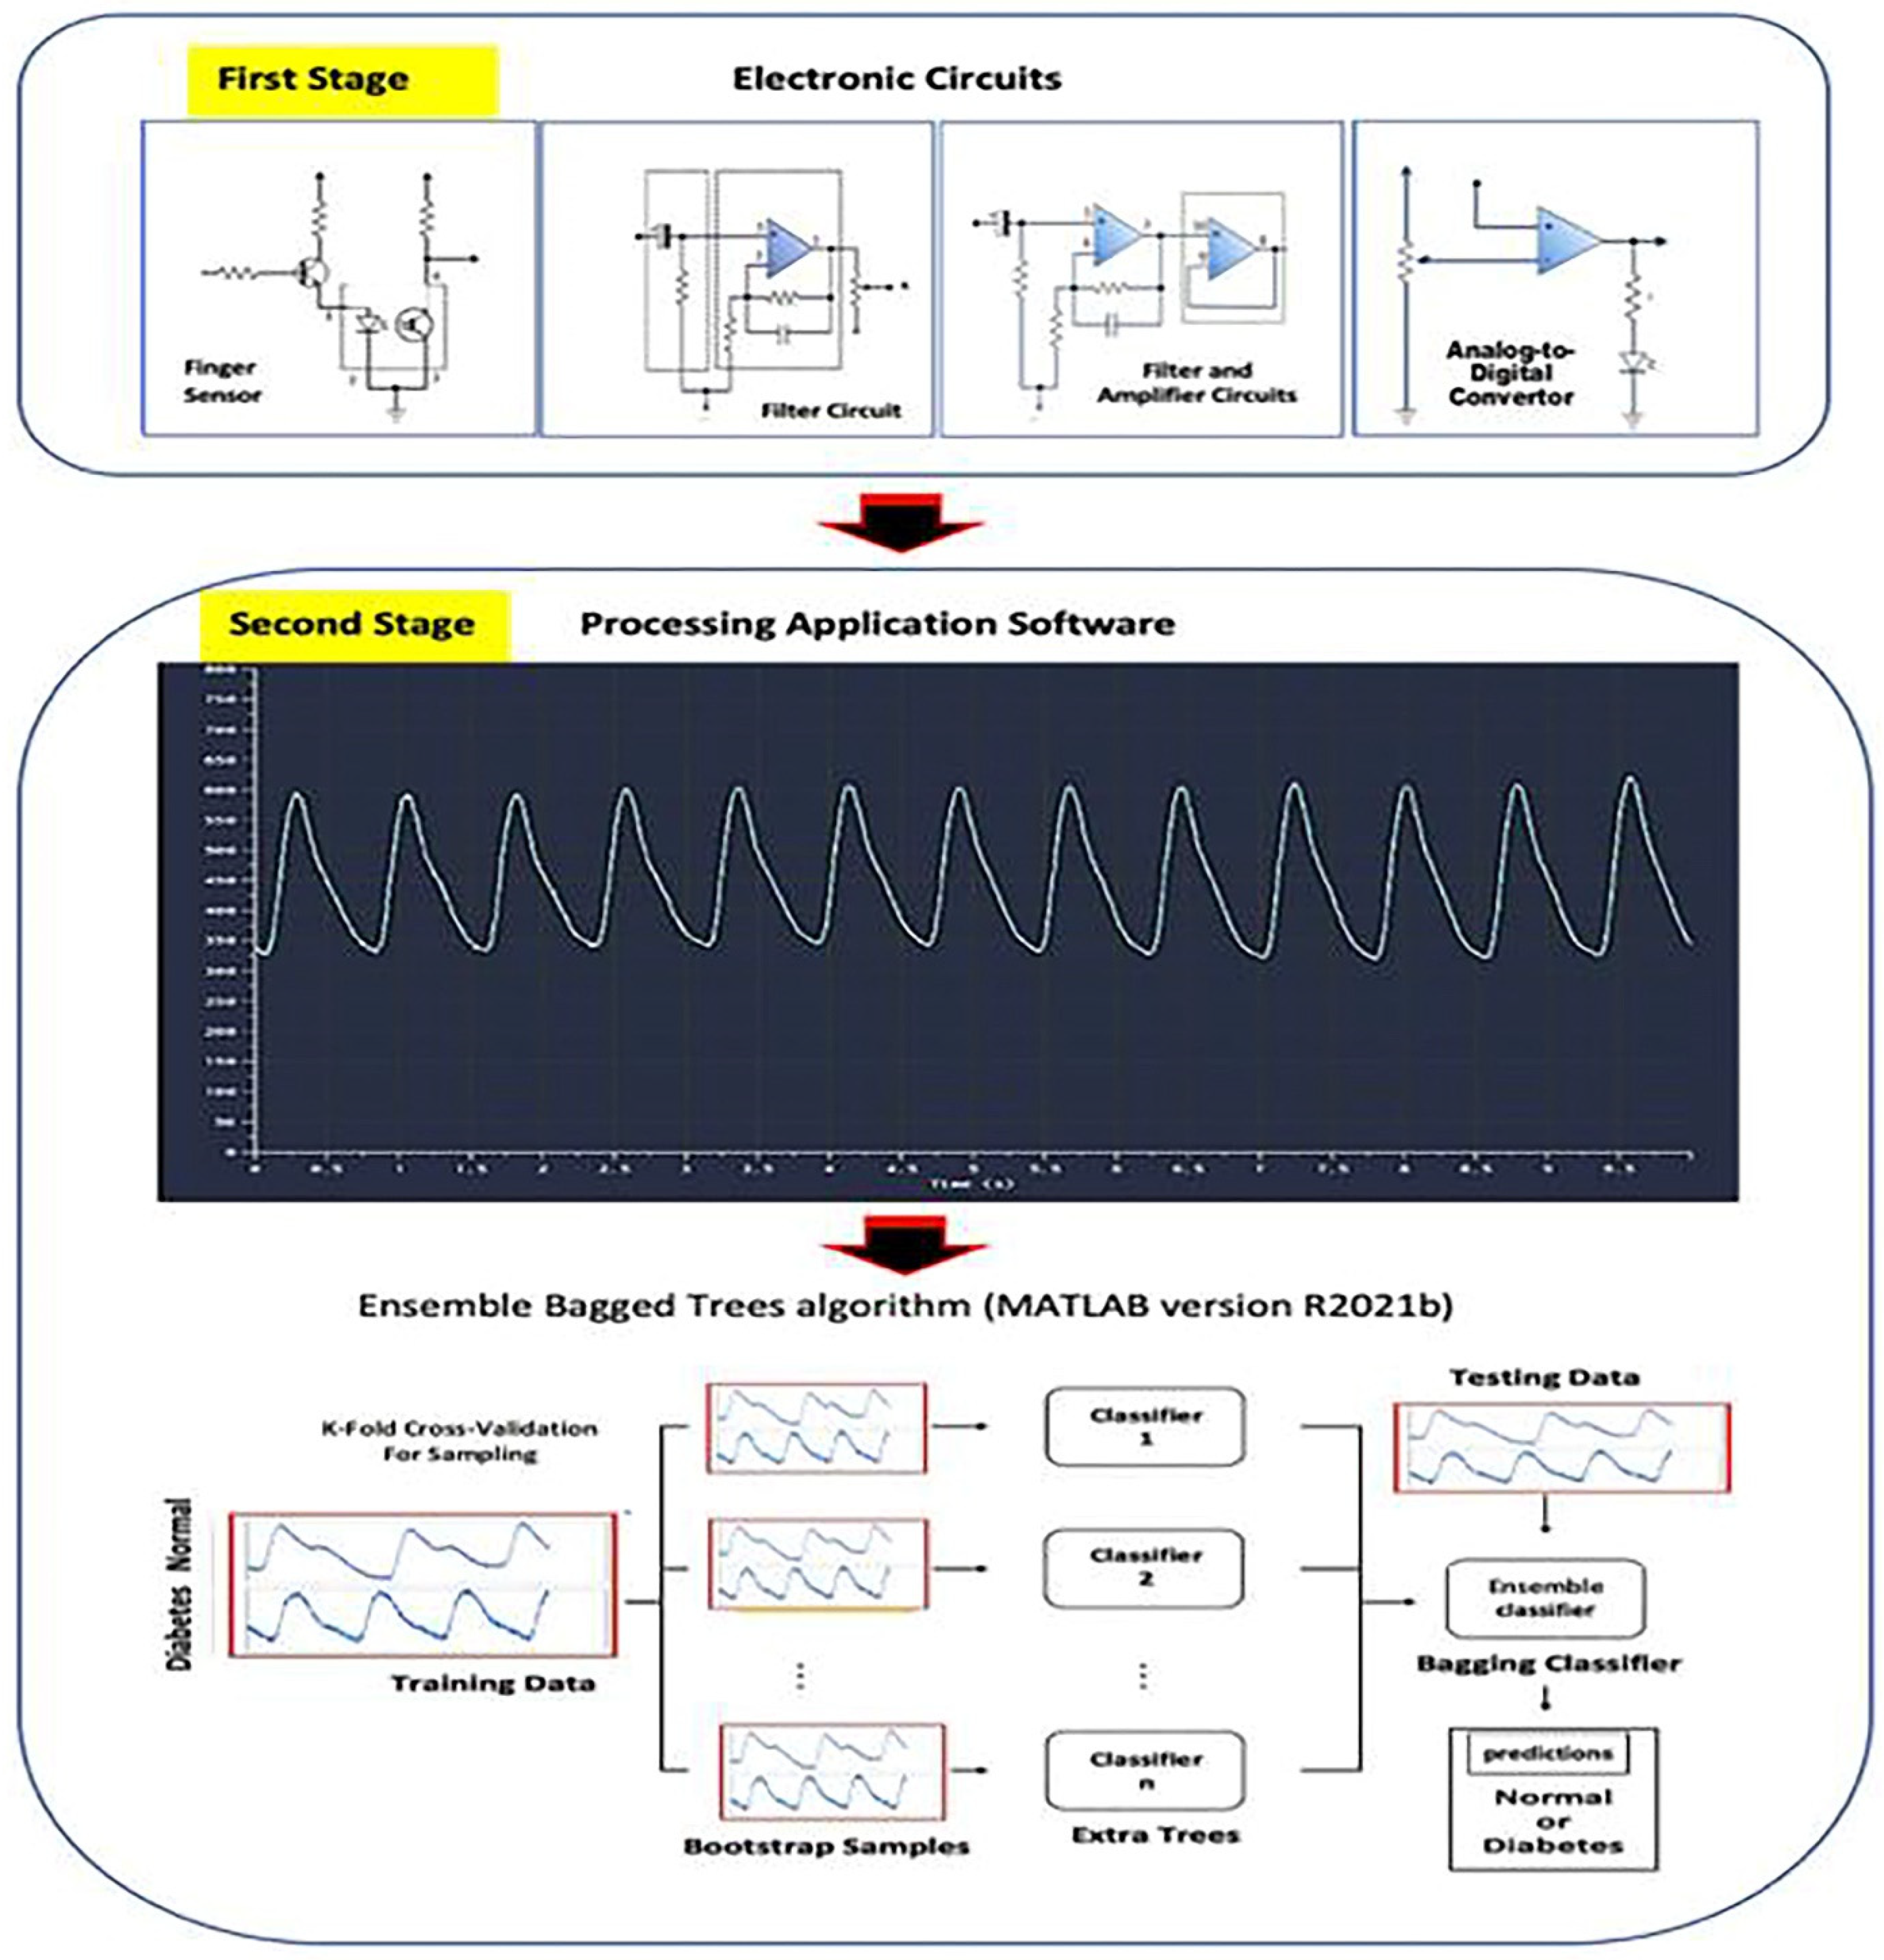
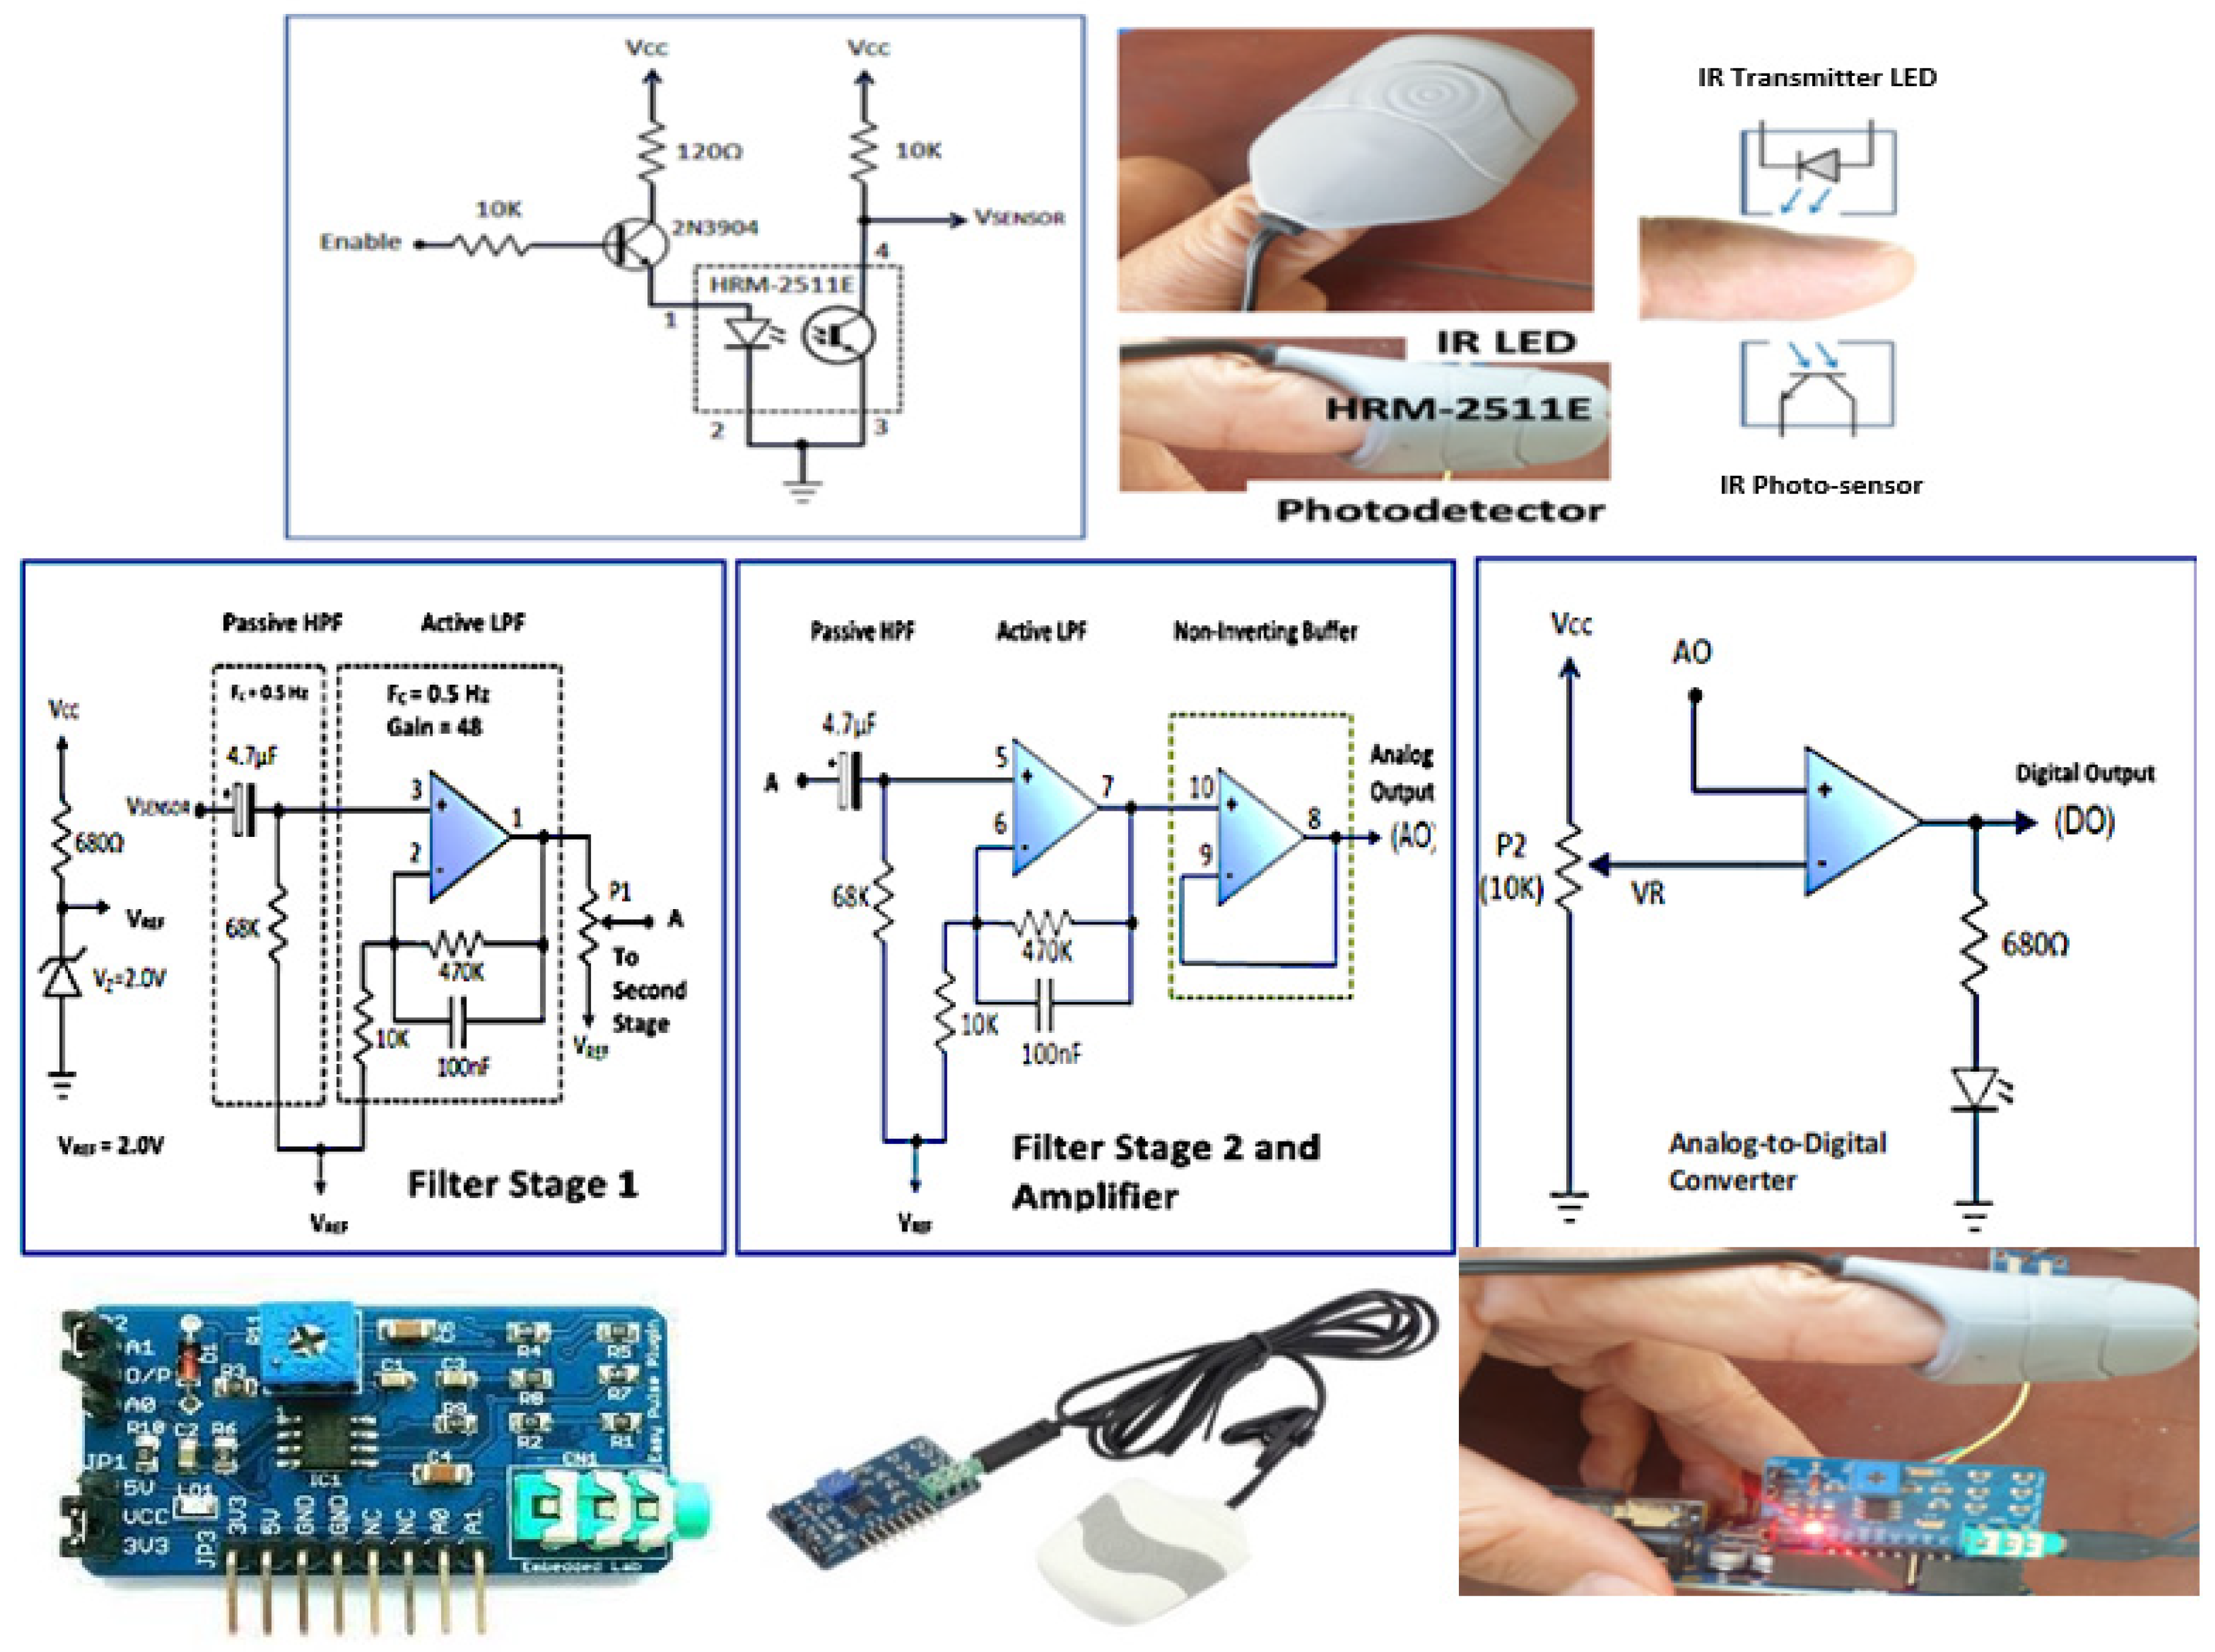
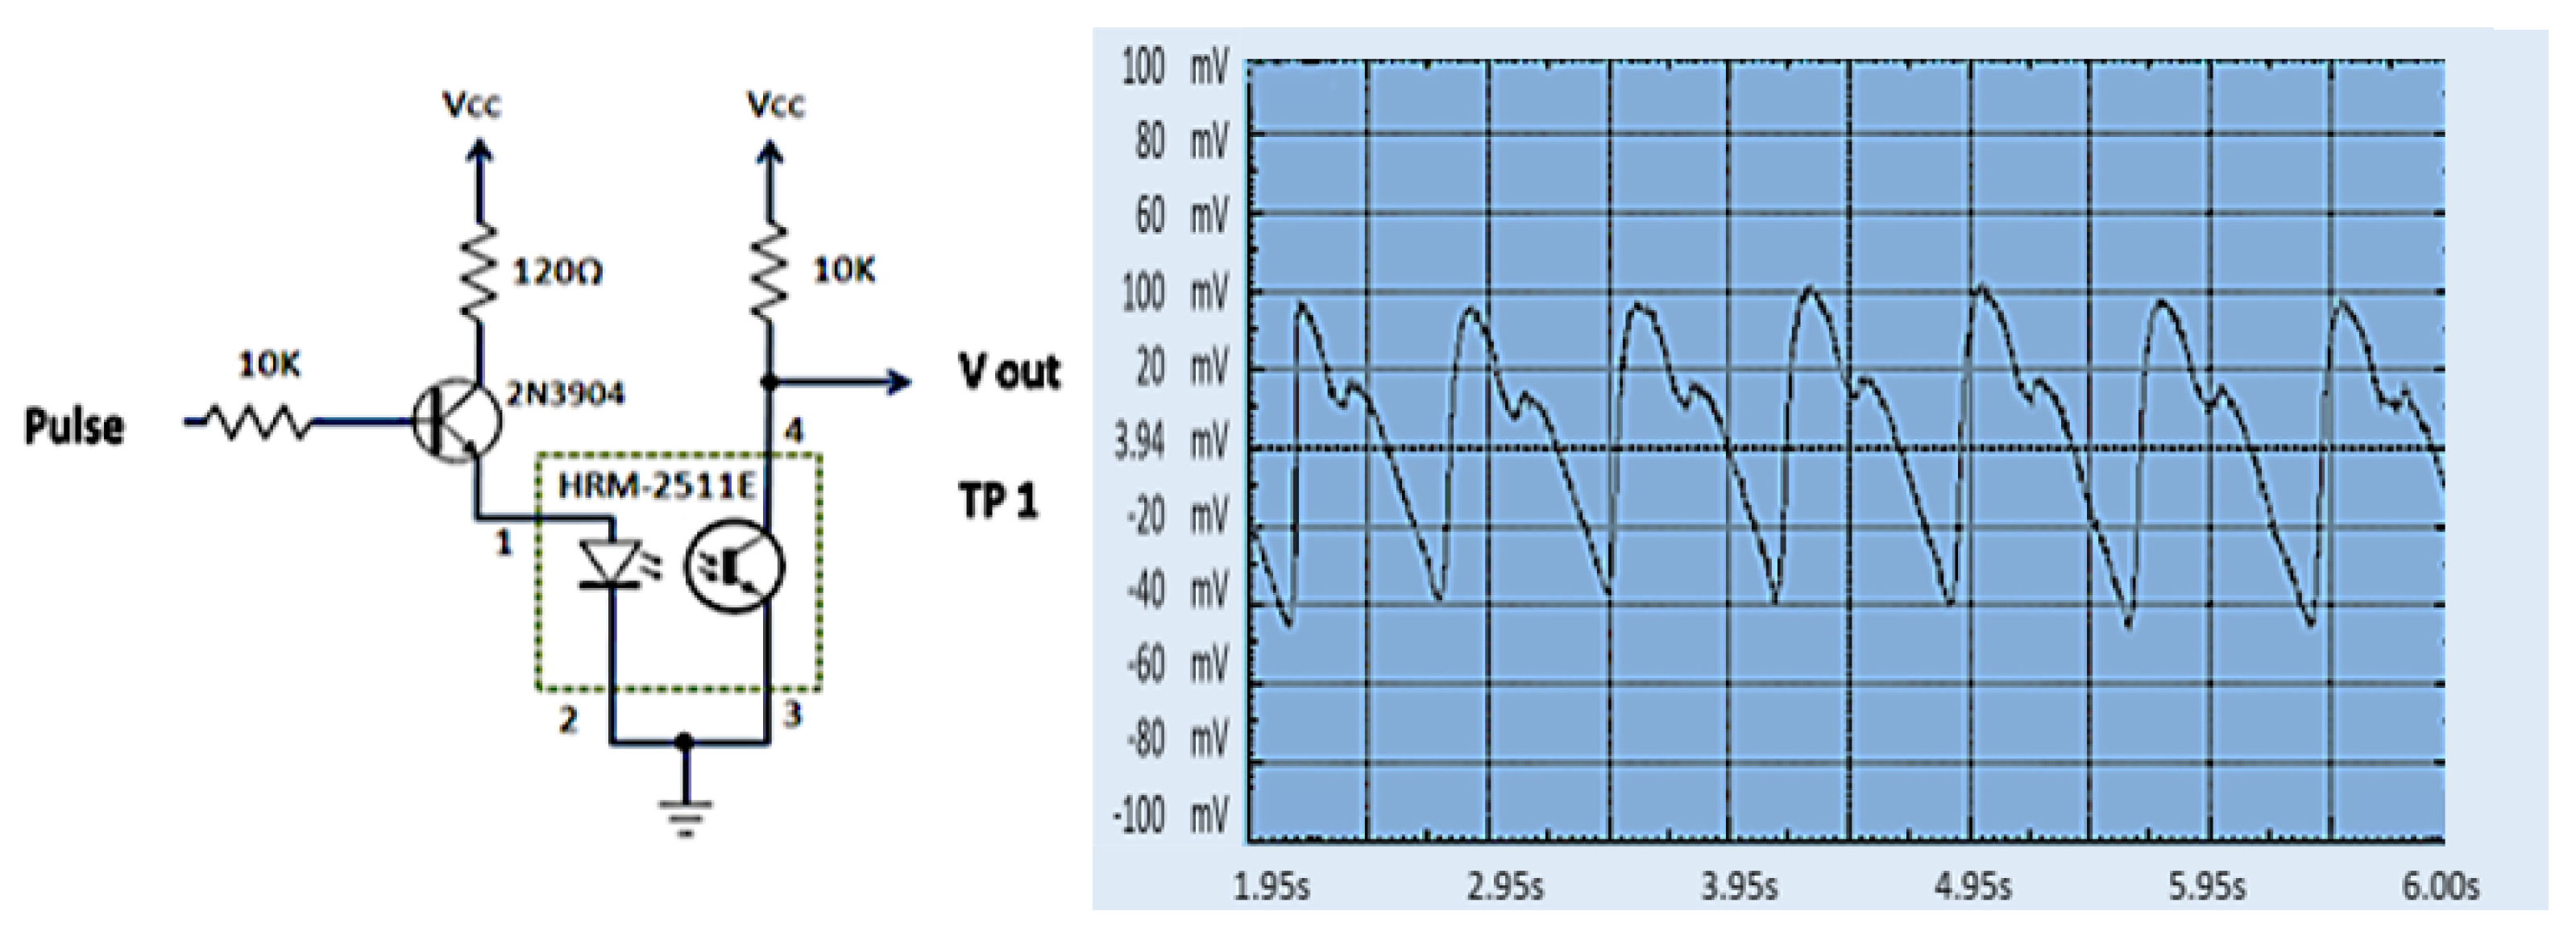
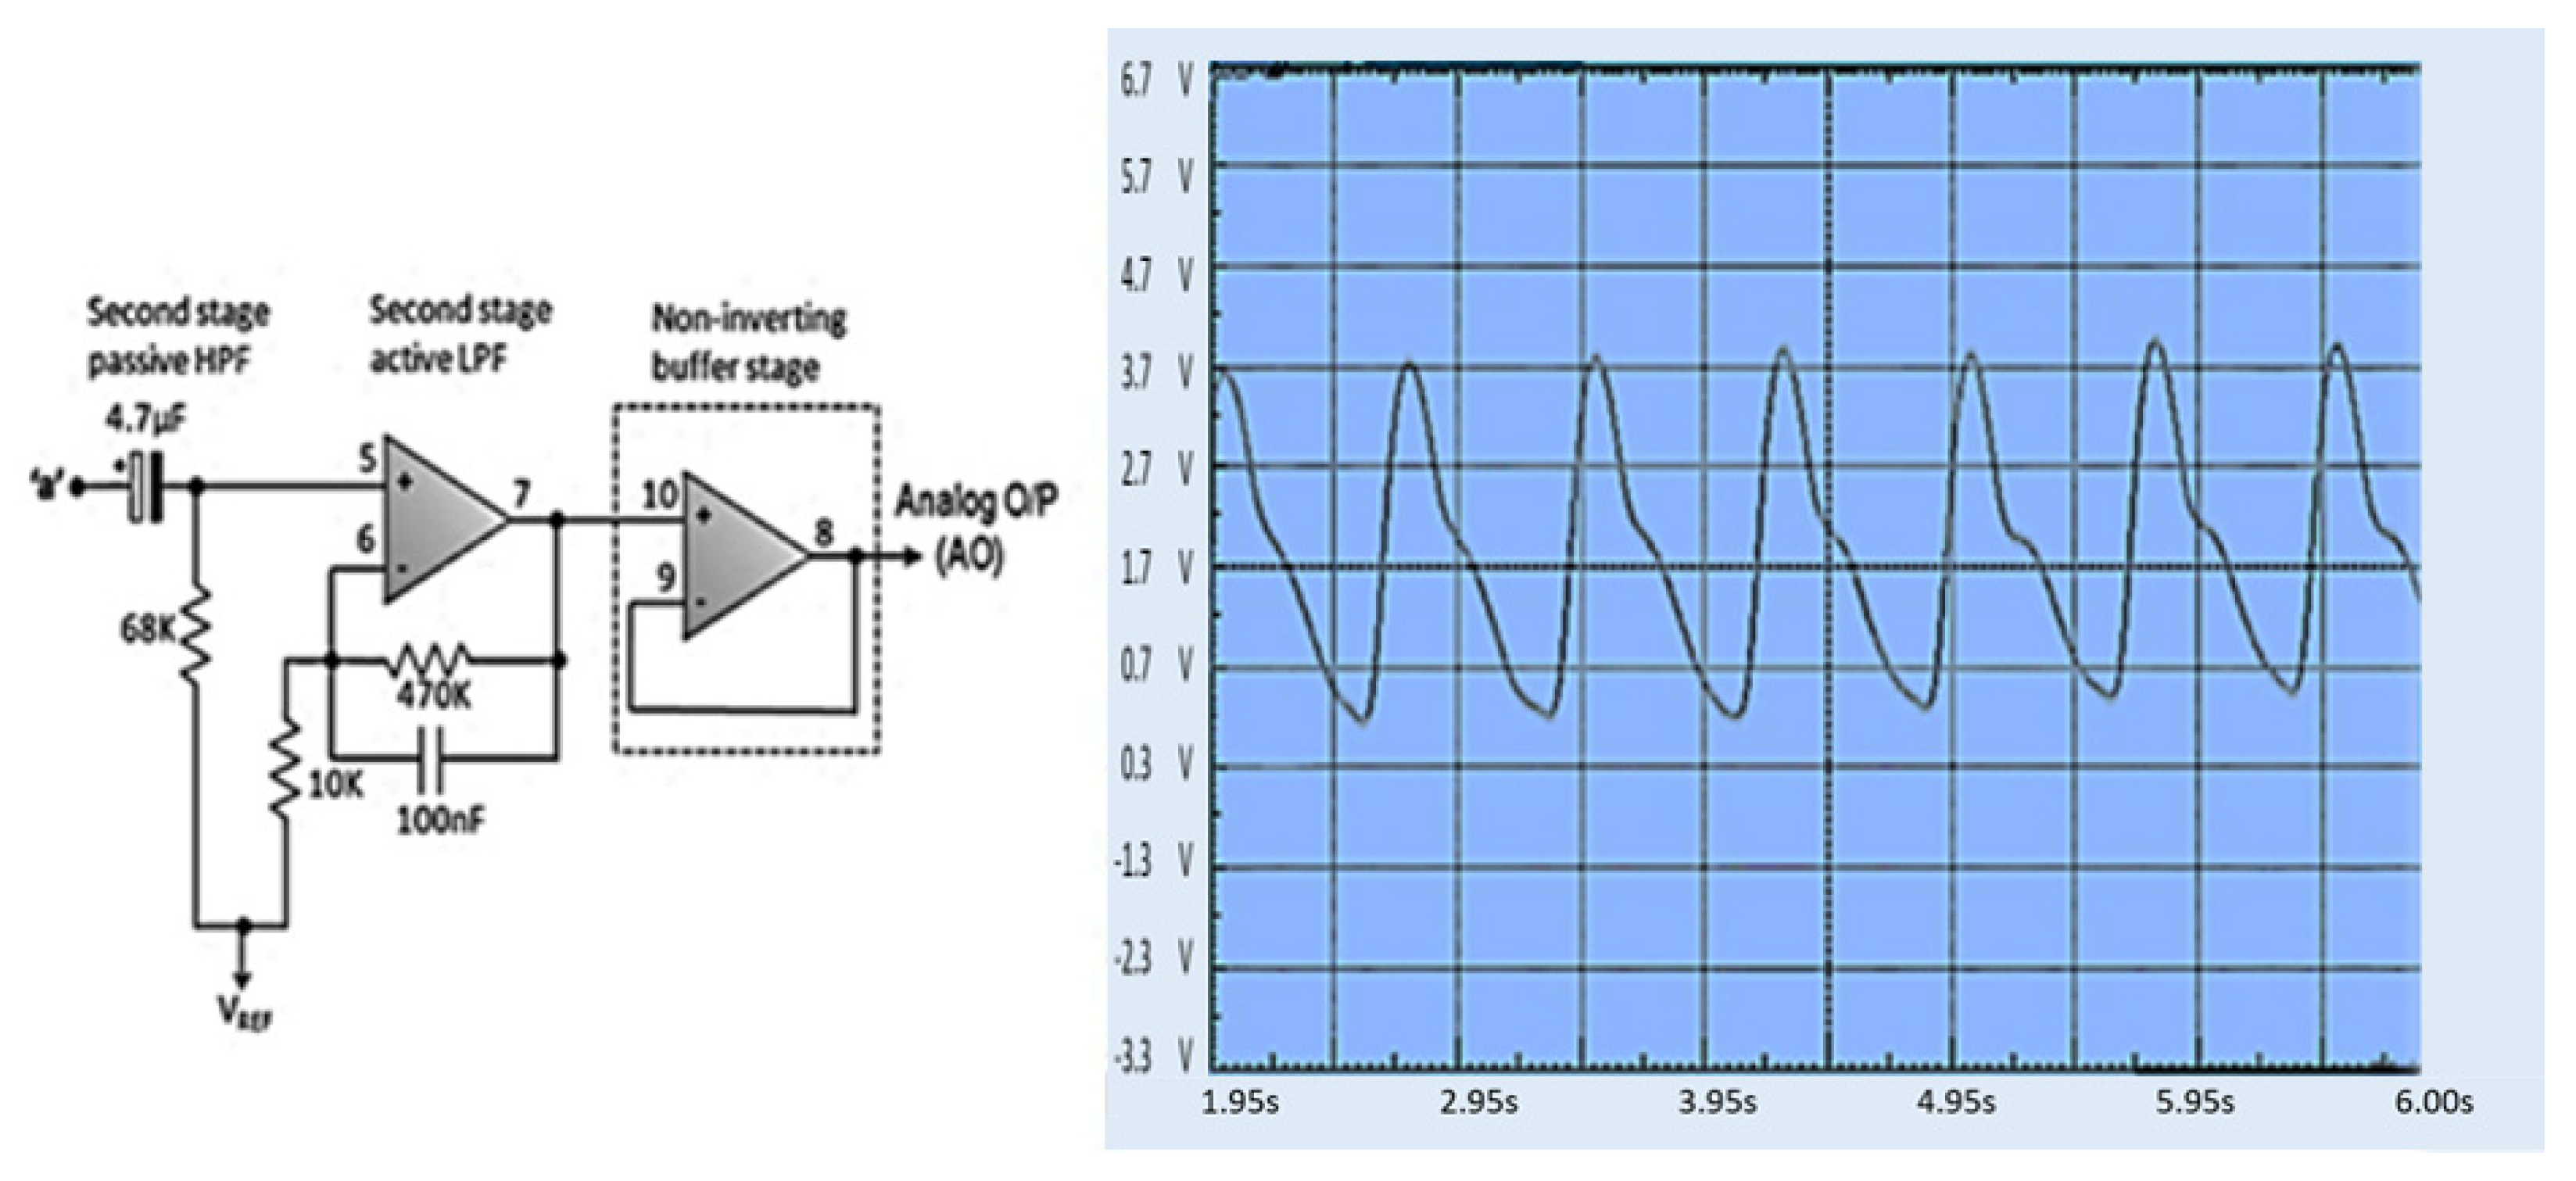
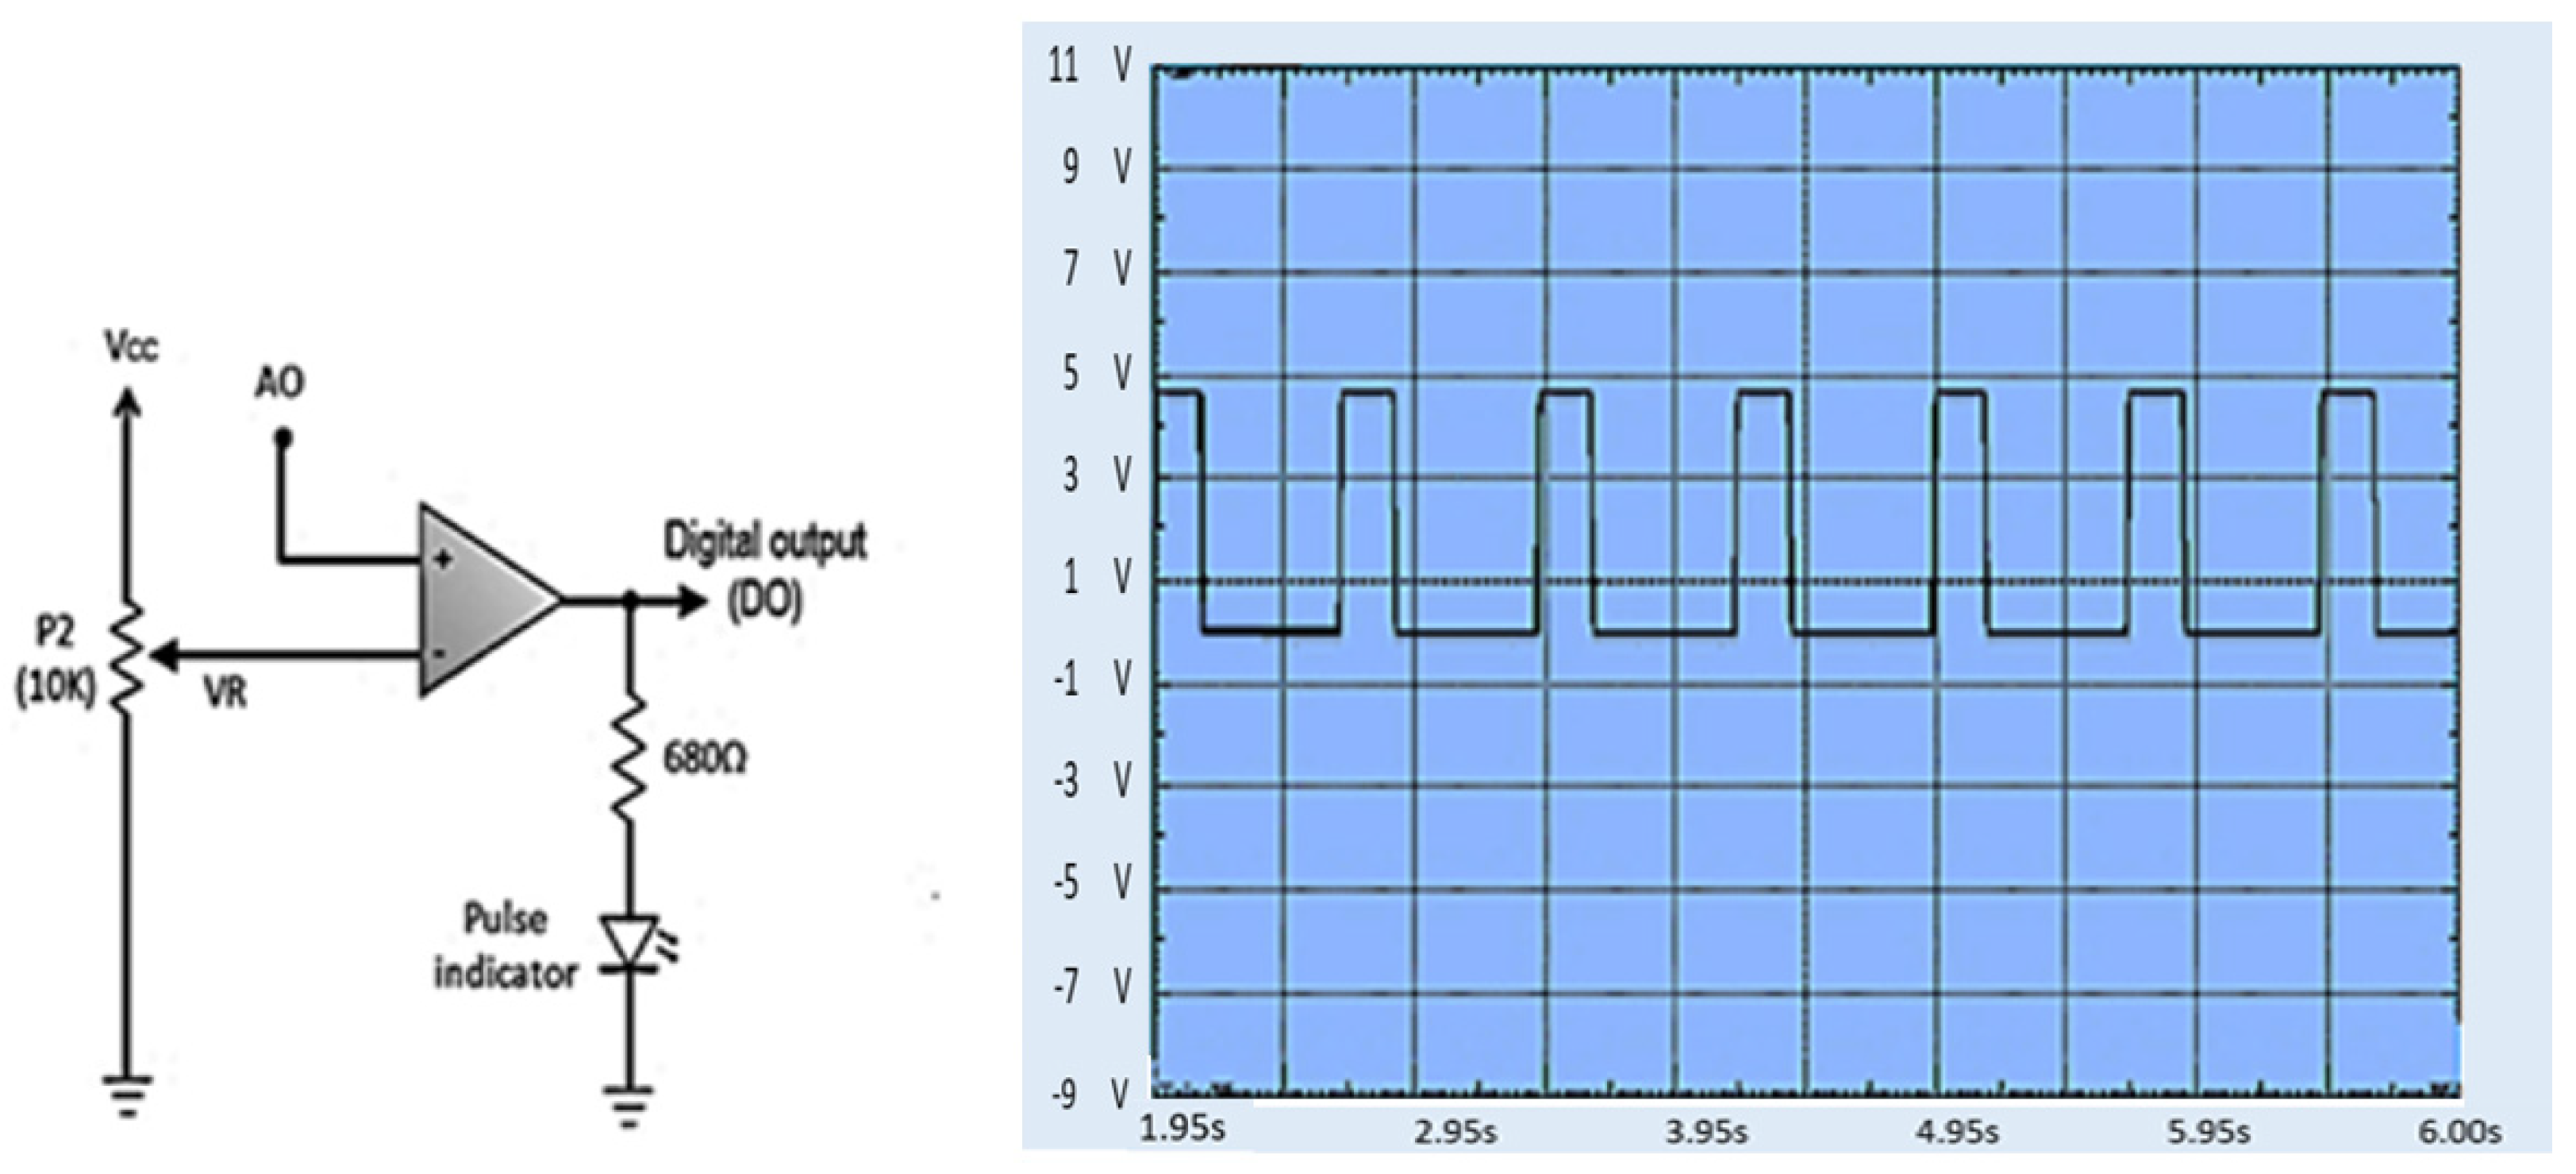
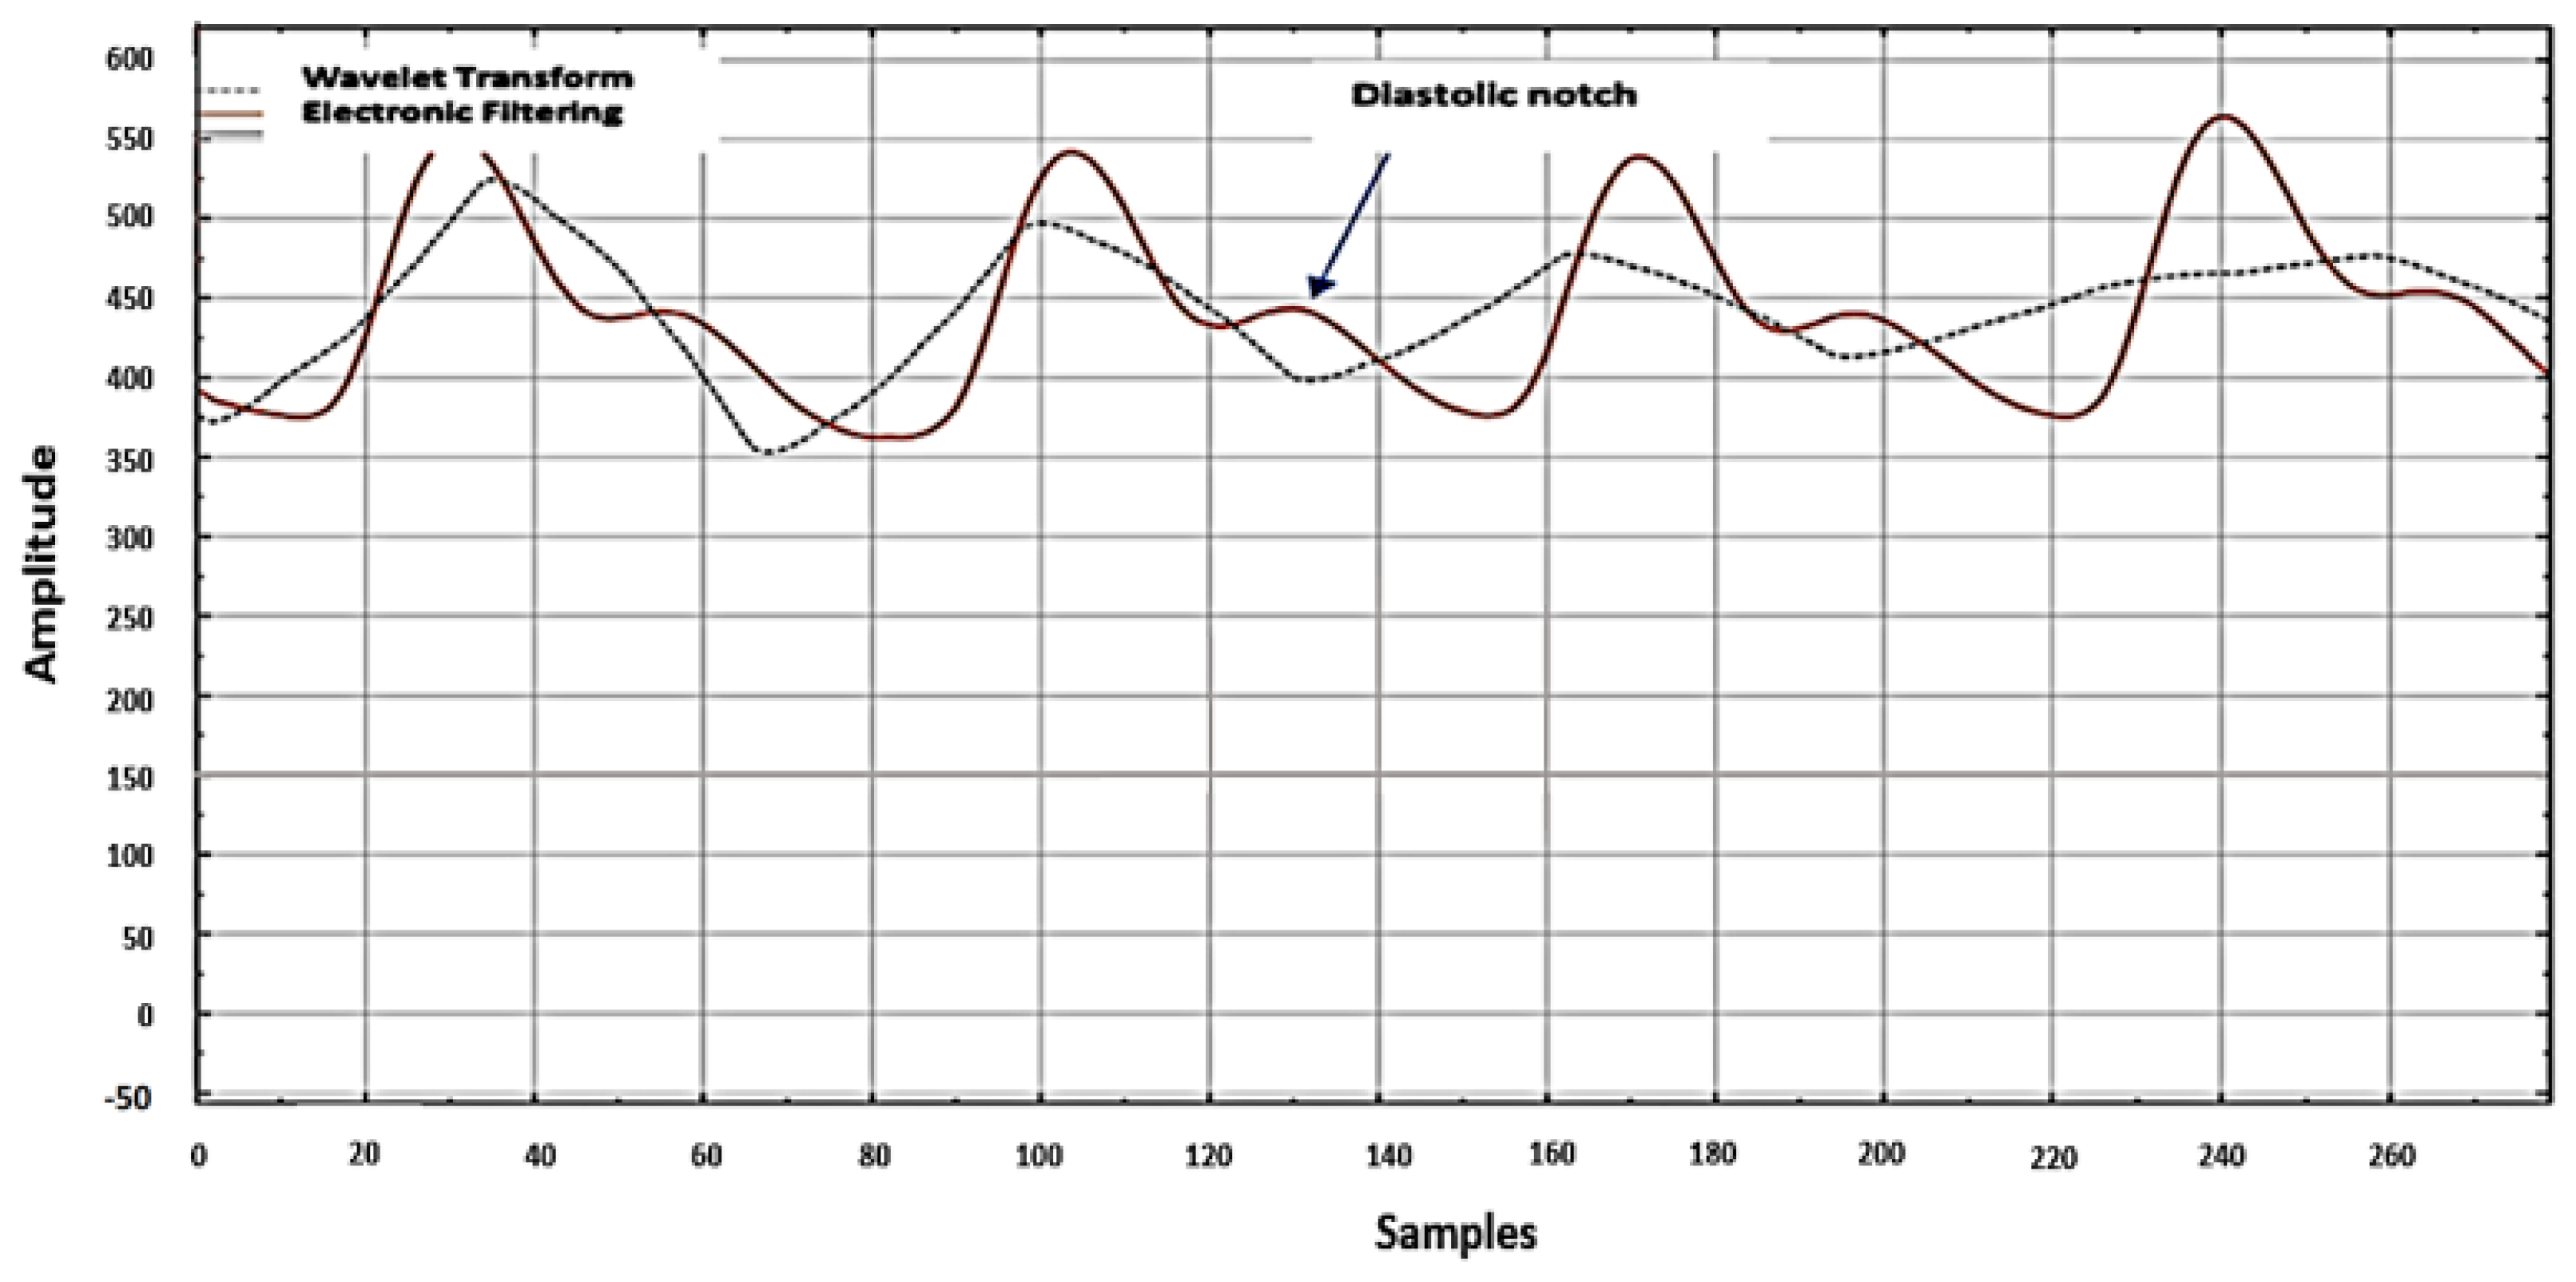
  • A particular process is not needed to establish the PPG signal’s quality with our proposed method. We have used electronic filter circuits instead of filter algorithms such as wavelets.
  • Our proposed method uses ML instead of DL to achieve a faster training time. Deep learning uses extensive computing power and takes a long time to train, making it difficult to validate and repeat extensively to improve results [47].
This article proposes a non-invasive classification of BGL for early detection of diabetes based on a PPG signal by utilizing a combination of electronic circuits with a machine learning algorithm (MLA). The classifier model to be used is chosen from the results of a comparative analysis between models, such as subspace K-nearest neighbor, RUS boosted trees, ensemble bagged trees, decision trees, support vector machine, gaussian support vector machine (GSVM), bagged trees, K-nearest neighbor (KNN), fine gaussian support vector regression (FGSVR), support vector regression quadratic, and enabled boosted trees.
This study included 80 subjects and collected 400 original PPG signals from students at the Indonesian Defense University and patients at the Wocare Diabetes Clinic. Feature extraction of the PPG signal was carried out point-by-point, so the physiological data contained in the PPG signal could be explored. Each PPG data segment consists of 2100 sampling points. After all the data were collected, the datasets were divided into a training set (300 PPG signals) to train the classifier and a test set (100 PPG signals) to test the accuracy of the classifier. Datasets were added to avoid bias by duplicating signal data from each classification level to give each group the same number of training datasets (150 normal subjects and 150 diabetes subjects).
This paper is structured as follows: Section 2 defines the materials and methods; Section 3 explains the measurement and verification results; Section 4 discusses the results; Section 5 concludes the study.

2. Materials and Methods

The essential component in this research is the PPG signal, which was collected through an electronic circuit in a finger sensor. The resulting PPG signal cannot be directly used for BGL classification. We have used an indirect methodology by utilizing patterns and sampling points from PPG signals which are then processed using MLA. It takes PPG datasets from normal and diabetic subjects to obtain PPG signal patterns associated with BGL. The advantage of artificial intelligence is learning patterns related to the desired results, as can be seen in Figure 5.

2.1. Data Collection

We collected the gold-standard dataset using an invasive glucometer. The PPG signal was collected using a non-invasive finger sensor. Each PPG signal is classified with the labelling “normal” or “diabetes” based on the results of the glucometer measurement. The MLA processed the signal measured by the PPG hardware to produce a patient classification. Once the PPG classification was complete, the result was compared to the glucometer classification and placed into the confusion matrix. The blue cells represent true positive (TP) or true negative (TN) signals, as shown in Figure 6.
We also collected data on the basic physiology of the individual. The dataset collected for each time point included the participant’s PPG waveform signal, blood pressure, blood oxygen saturation levels, heart rate, and glucometer BGL, as shown in Table 1.
The measurements for each of these parameters were taken as many as five times for each subject. The dataset includes PPG and BGL information from the subjects, divided according to BGL values based on the National Institute for Clinical Excellence (NICE) in 2019, as shown in Table 2.
Glucometers can measure BGL using a random or fasted method. Random glucose tests can be taken at any time and do not require preparation. Fasting plasma glucose tests are performed after a minimum of eight hours of fasting. In this study, we assessed BGL using a random test method. According to the NICE guidelines, we classified participants with a BGL of >200 mg/dL into the “diabetes” dataset.
The total duration of the experiment was approximately 15 min. The data collected from PPG and BGL took around five minutes to obtain. We divided the data into “signals” and “labels” groups. The signal is an array of cells consisting of a collection of PPG signals, while the label is a description of “normal” or “diabetes” based on the NICE 2019 guidelines, as shown in Figure 7.
We selected the signals based on the waveform to anticipate a low-quality PPG signal. Each PPG signal segment was manually evaluated using either an unfit, acceptable, or excellent PPG waveform classification, as described in Figure 8 [34]. PPG waves in the excellent category had a clear beat with a diastolic notch. The acceptable category had a clear beat without a diastolic notch, and the unfit category contained many noisy beats without a diastolic notch. This method is inspired by the skewness signal quality index (SSQI), which divides the degree of asymmetry of the distribution around the mean. Positive skewness is an asymmetric distribution towards a positive value. Negative skewness indicates an asymmetric distribution towards a negative value [34,48].
The PPG signal generated from the electronic circuit was processed and saved in a comma-separated values (CSV) format using processing application software. Each PPG data segment consisted of 2100 sampling points, which required 10 s of data access. We used a frequency of 190 Hz during signal acquisition, as shown in Figure 9. Processing software allowed us to view each subject’s PPG waveform in real-time. We selected the PPG waveforms manually and analyzed them one by one so that only PPG waveforms in the excellent or acceptable category were stored. This process was developed to reduce PPG segments with high motion artefacts.

2.2. Electronic Circuits
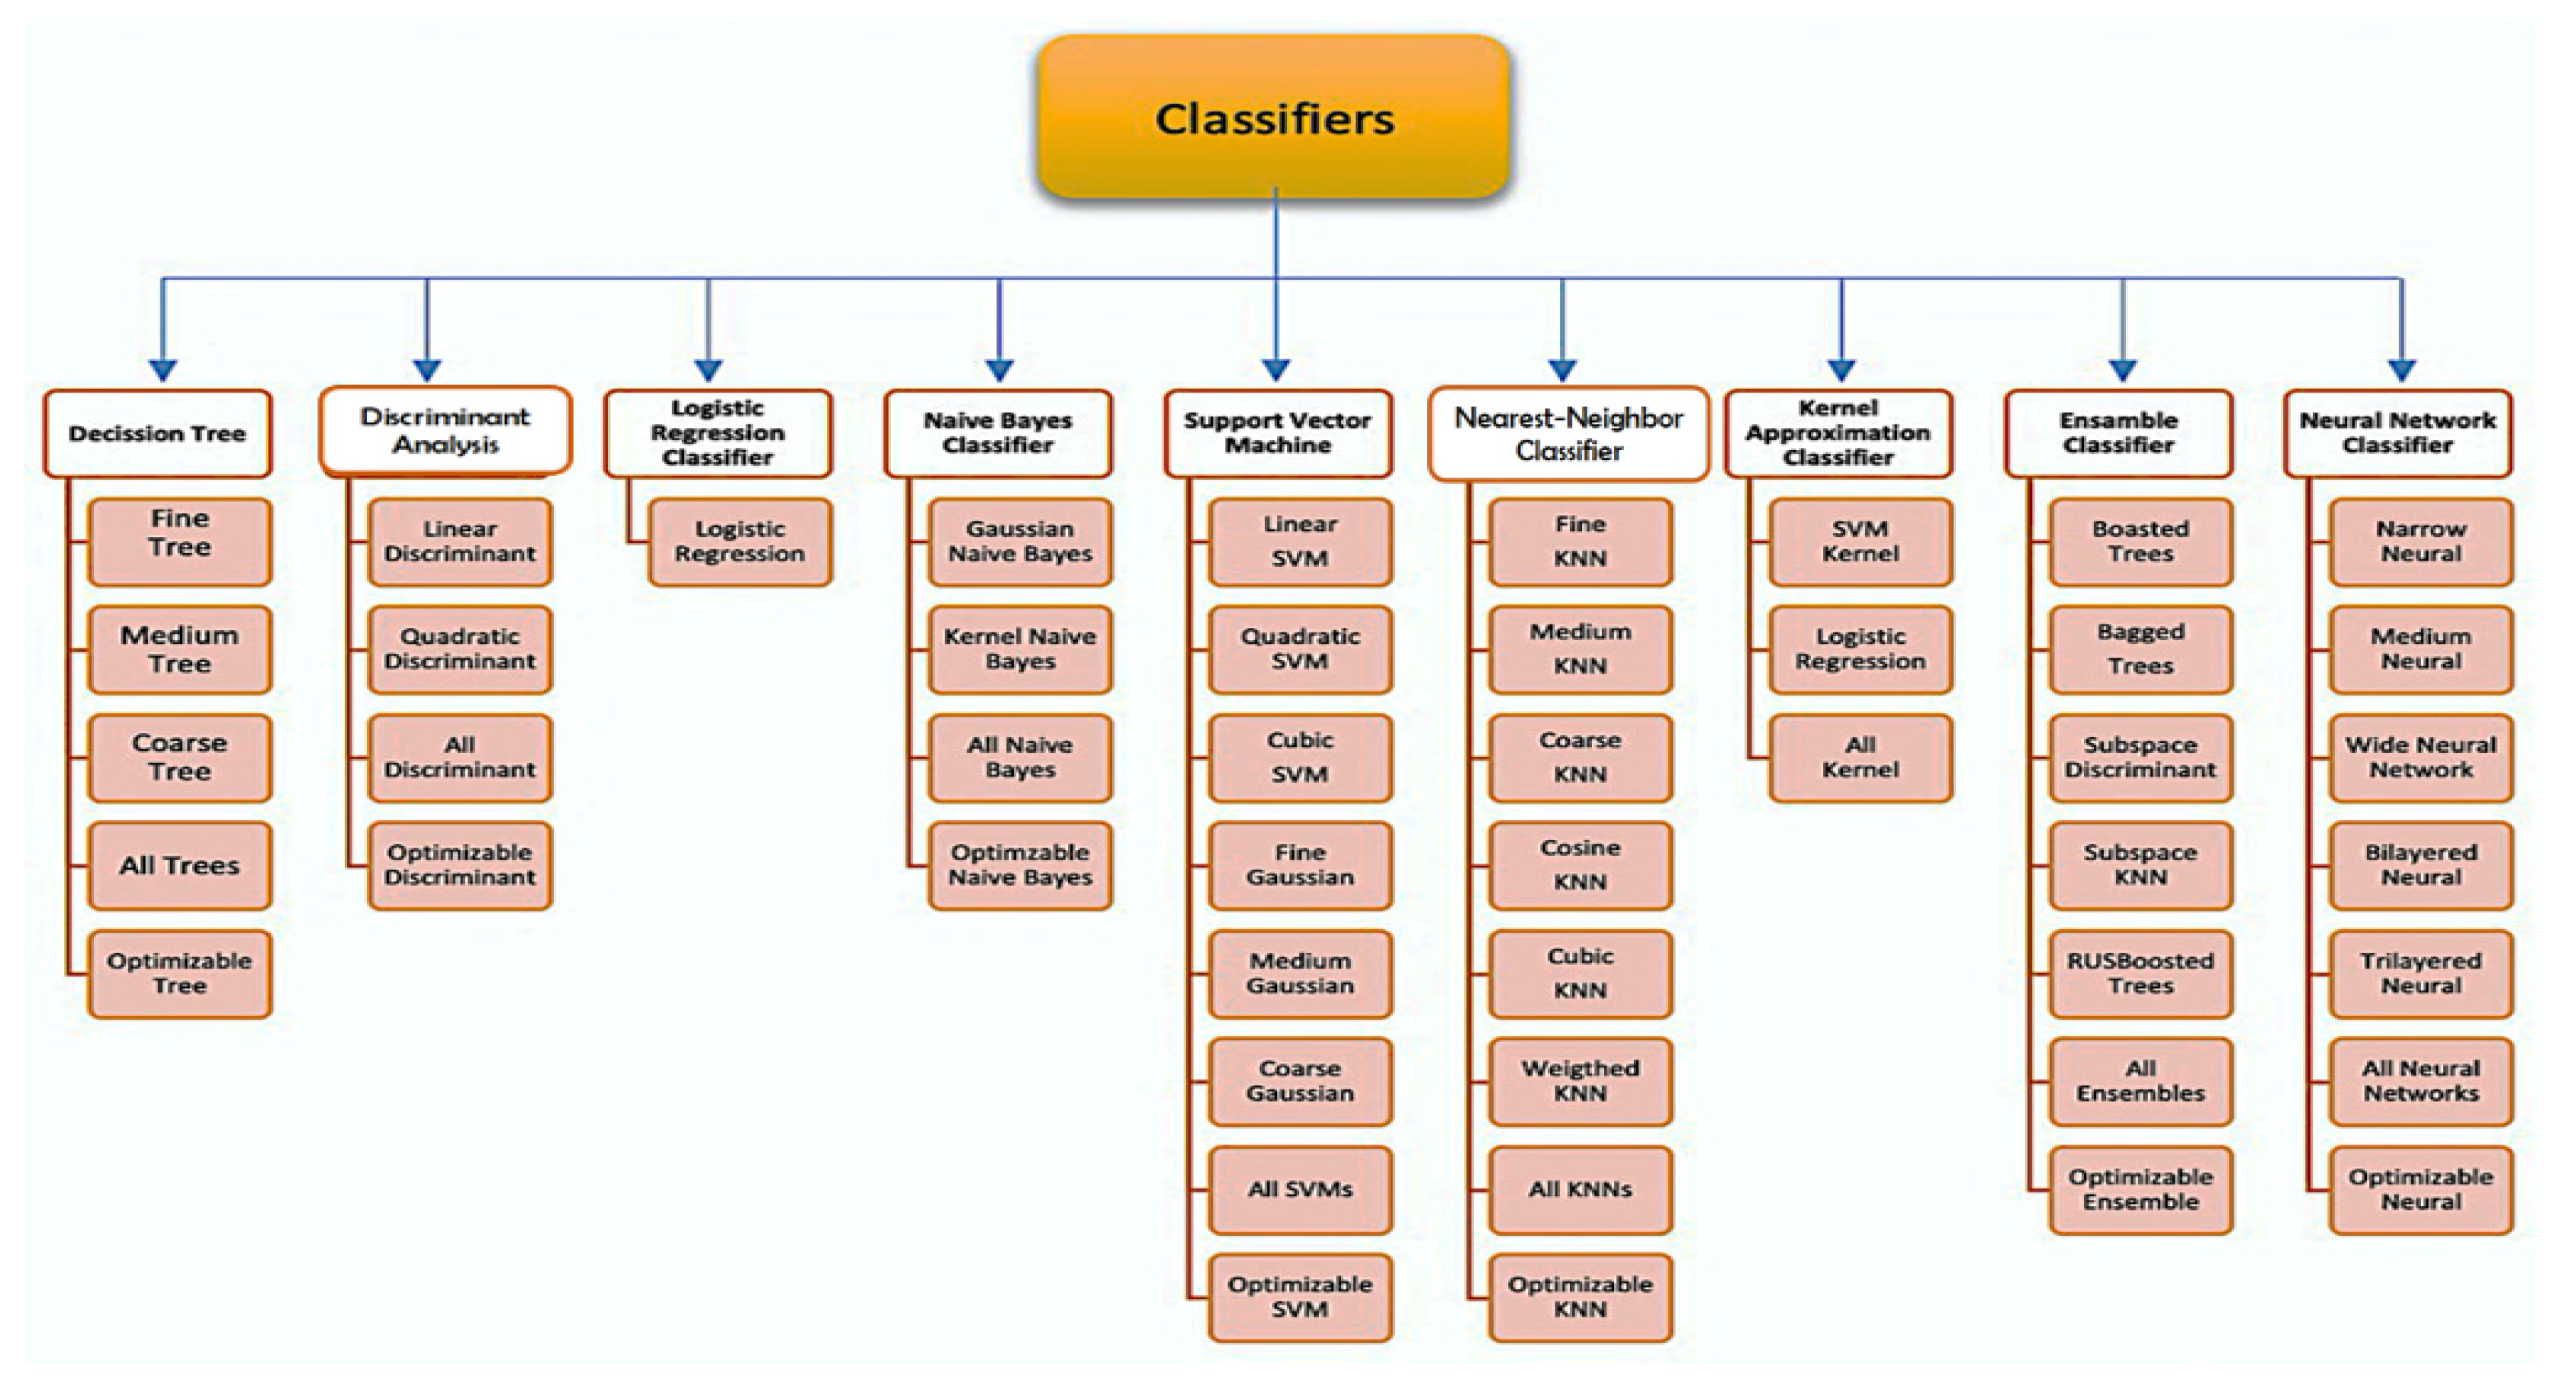
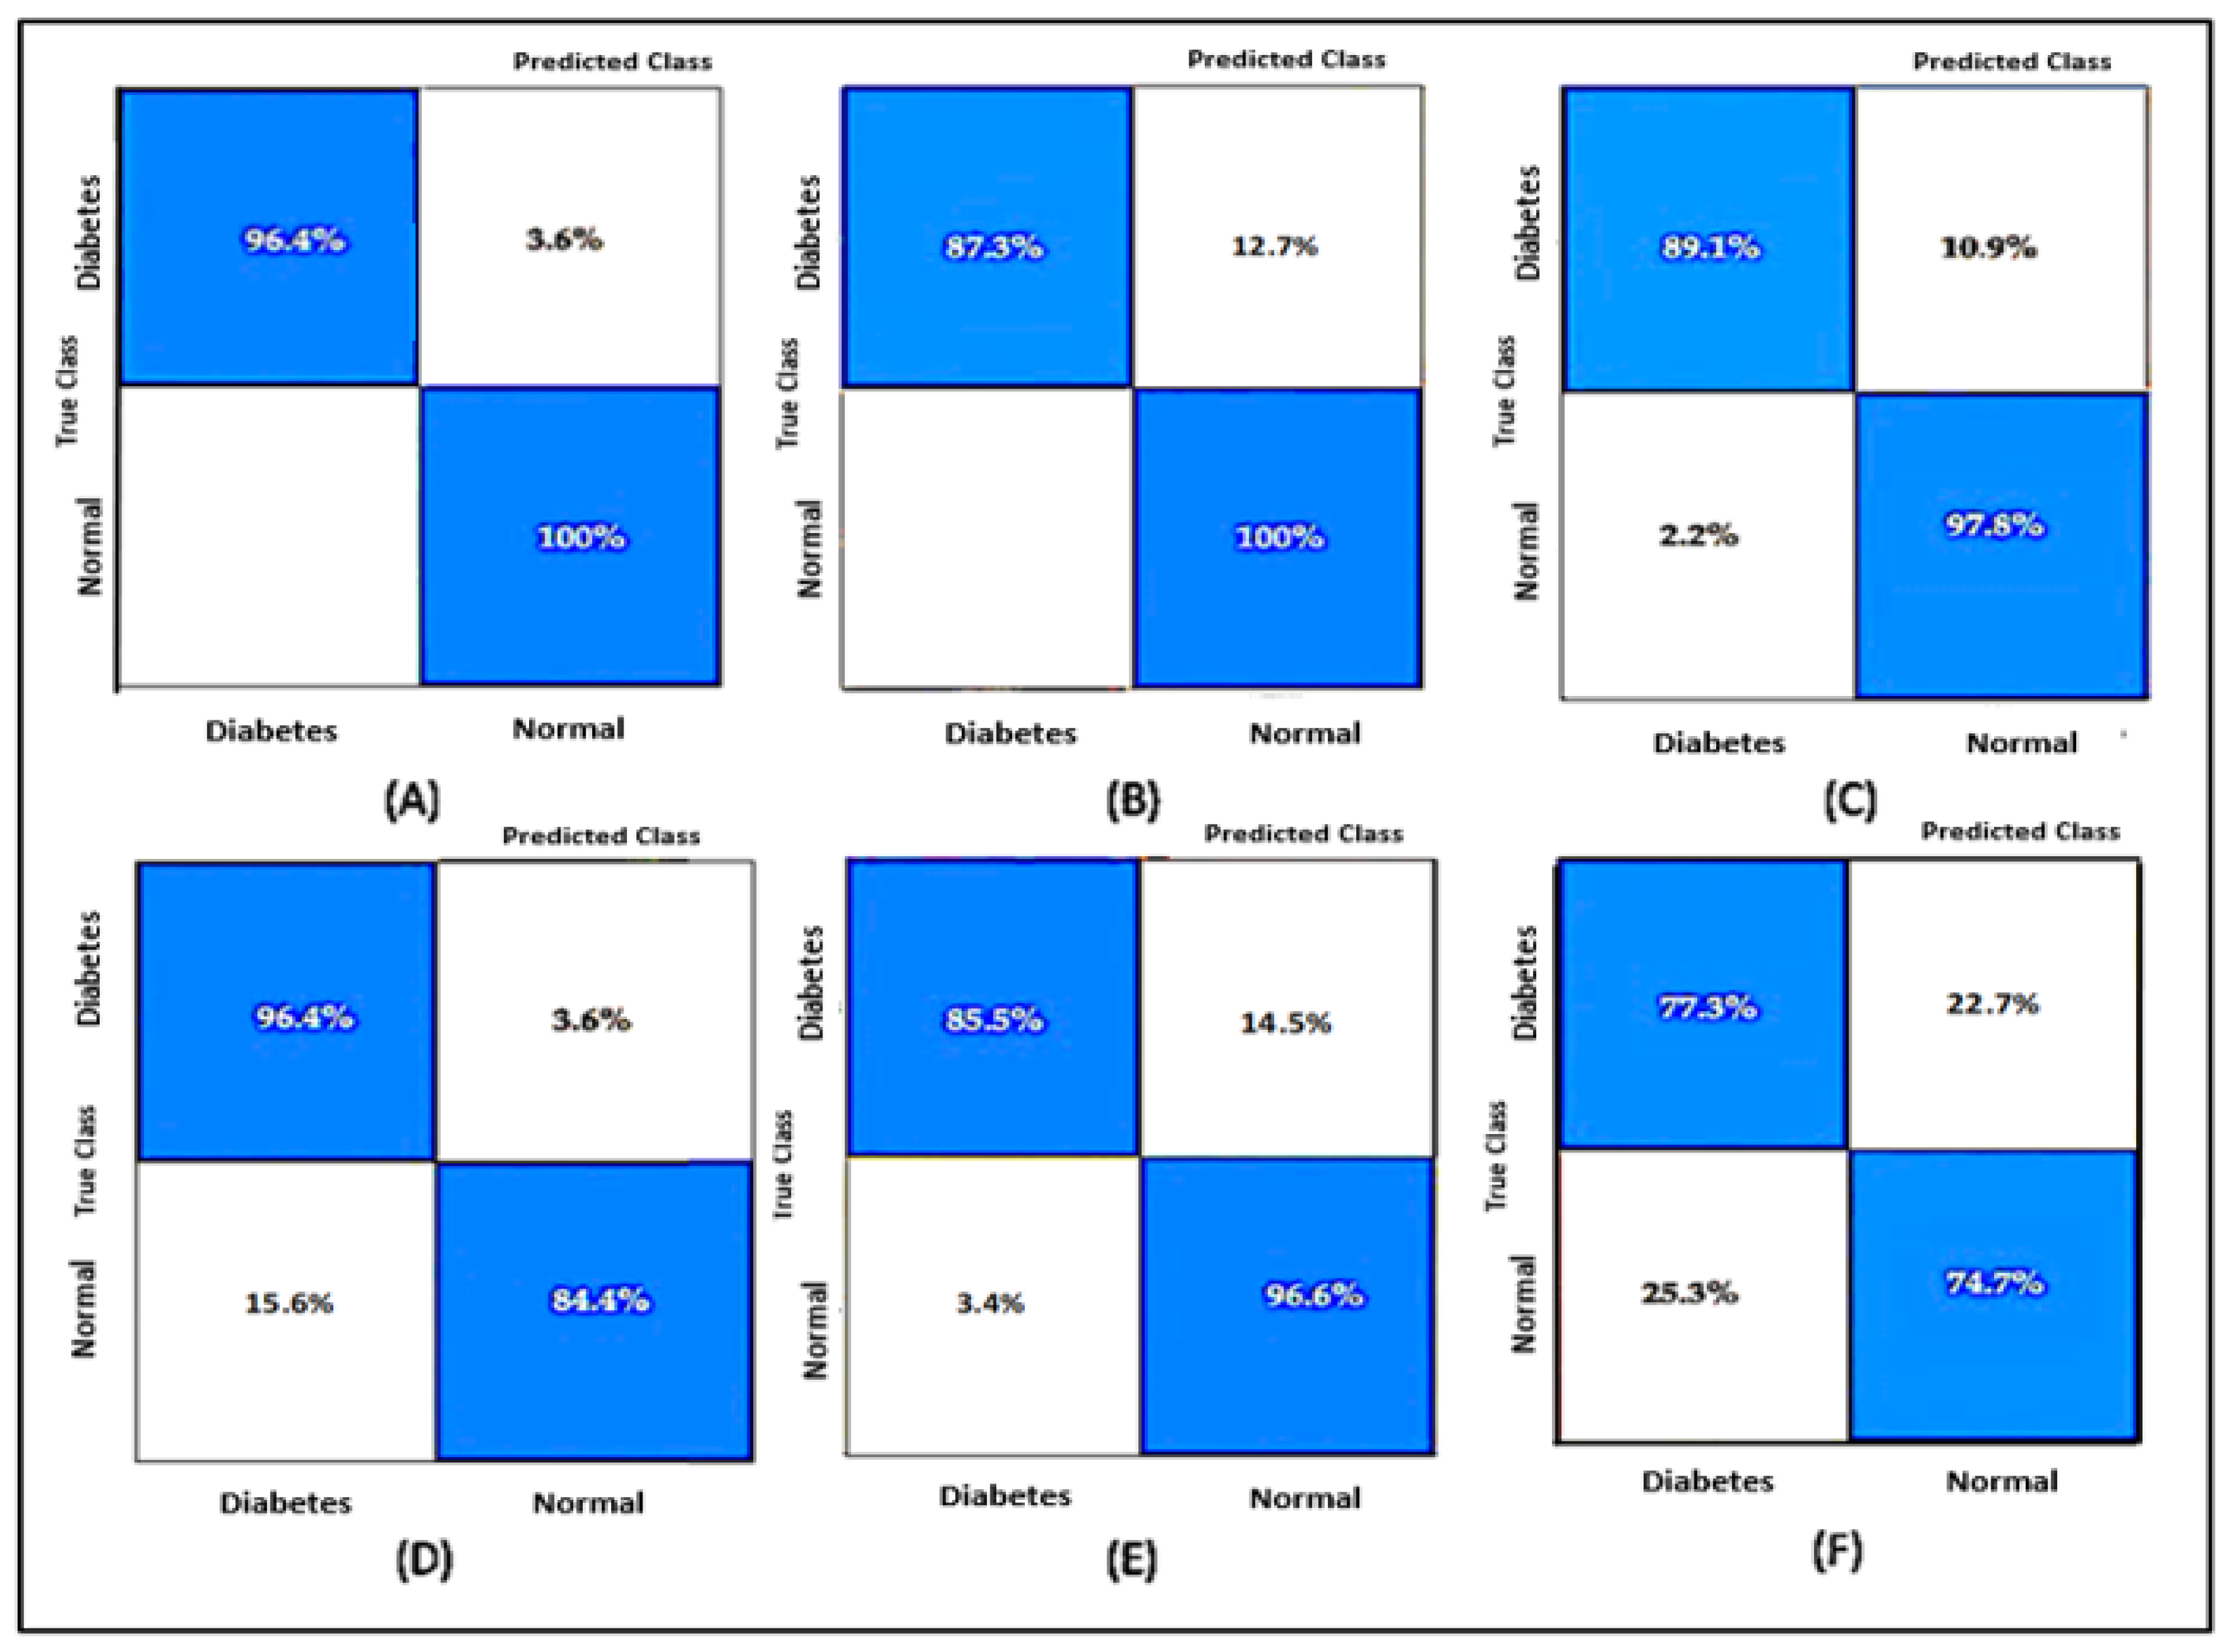
In this study, we used the Easy Pulse design by Embedded Lab, an open-source pulse sensor, to measure cardiovascular pulse waves by detecting changes in blood volume in blood vessels close to the skin, which generate PPG signals [49]. The hardware configuration includes the finger sensor, the filtering circuit, the amplifier circuit, and the analog-to-digital converter circuit. The finger sensor uses HRM-2511E which consist of near-infrared and photodiode [49]. This configuration will detect changes in the blood volume during the systolic and diastolic phases in the form of a PPG waveform. The PPG signal from the photodetector is still fragile and noisy, so it requires a signal amplifier circuit and a filter to suppress noise. Technically there are two stages of signal processing. In Stage 1, blocking the DC component of the PPG signal through a passive high-pass filter (HPF) is a combination of a resistor (68 kOhm) and a capacitor (4.7 uF), resulting in a cut-off frequency of 0.5 Hz. The PPG signal from the HPF is still noisy, so it still needs to be processed further through an active low-pass filter (LPF) based on an operational amplifier (op-amp) in a non-inverting mode that has a gain of 48 and a cut-off frequency of 3.4 Hz. At the negative input, the op-amp uses a reference voltage (Vref) of 2.0 V coming from the Zener diode so that the PPG signal can reach full swing at the op-amp output. The active LPF goes to Stage 2, which is a replica of the Stage I circuit. The PPG analog signal from Stage 2 is converted into a digital signal by an analog-to-digital converter circuit as raw data input in ML models, as shown in Figure 10.

2.3. Classifier

We used MATLAB (version R2021b) as a platform to choose the best machine learning classifier. The platform enables the algorithm to perform BGL classification based on PPG signals with an optimal level of accuracy. All models were tested on the same dataset, as shown in Figure 11.

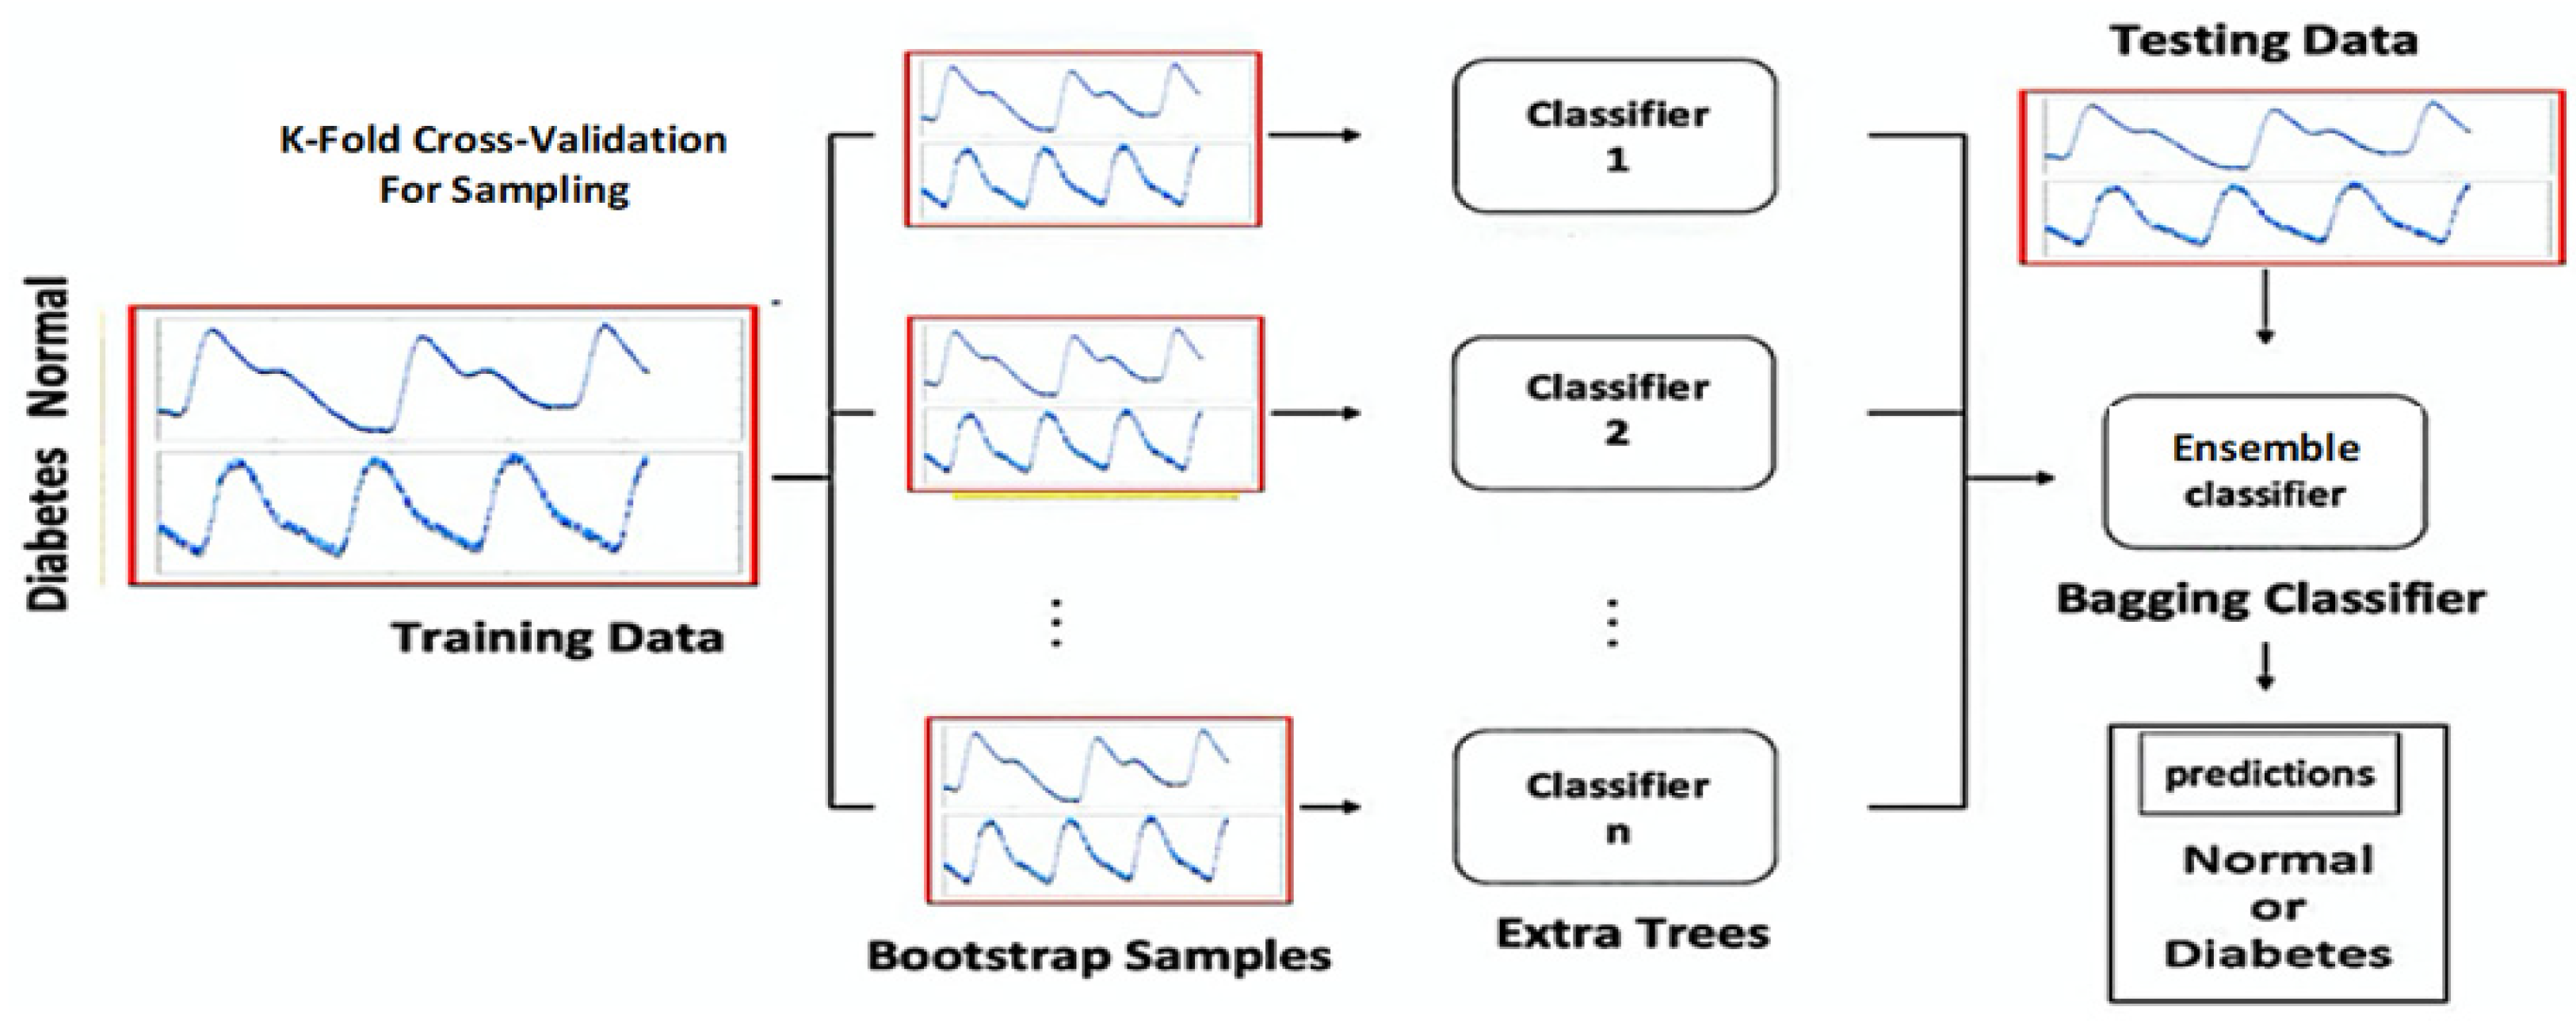
Ensemble Classification

The ensemble is a method that combines many single classifiers so that the predicted results of each classifier are integrated into the final prediction through a majority voting process. The ensemble method was developed to improve classification prediction accuracy. The ensemble technique that relies on bagging and boosting variations can provide predictions with excellent accuracy. Bagging works by making ensemble composing models so that various possibilities can be accommodated to the maximum while boosting works iteratively so that cases that are not easily predictable are no longer a problem. Based on what is currently developing, the ensemble approach in the predictive algorithm is the right choice for those who want to obtain satisfactory results that are very easy to work with.
The number of split parameters in the ensemble algorithm determines the accuracy of the results [50]. The model will perform better when there is an increase in splits. However, increasing the number of splits that are too large creates the possibility of overfitting. In addition, the number of parameters studied further increases the accuracy of the model, but the process becomes very time-consuming. This study selected an ensemble bagged trees model for non-invasive BGL classification based on a single PPG waveform. The ensemble bagged trees algorithm (EBTA) is a method that can improve the results of machine learning classification algorithms by combining prediction classifications from several models. It is used to overcome instability in complex models with relatively small data sets. Bagging is best suited for problems with relatively small training datasets. Bagging adopts bootstrap distribution to generate different base learners, to obtain subset data. Bagging also adopts a base learner output-aggregation strategy, namely the voting method for the classification case and averaging for the regression case [50], as shown in Figure 12.

3. Results

When a finger is inserted into the finger sensor, the raw PPG waveforms can be observed at Test Point 1 (TP1) using an oscilloscope. The voltage generated from the finger sensor is very low and noisy, only about 80 mV, as described in Figure 13. The raw PPG signal from TP1 enters the second stage. The raw signal is then filtered to reduce noise in the second stage. The first stage output signal (TP2) still contains a significant DC component and small pulsatile amplitude. The output from the HPF goes to an active LPF where the op-amp amplifies the PPG signal so that the rated PPG signal voltage is 0.8 V. The noise in the signal can be eliminated in this phase, which is shown in Figure 14. The PPG signal on TP2 coming from the second stage is amplified by an op-amp circuit with amplification between the reference voltage ranges (V reference = 2.0 V), as shown in Figure 15.
The PPG signal from the second stage circuit is still analog and must be converted to digital in the analog-to-digital converter (ADC) circuit. The resulting digital signal is a series of digital pulses synchronized with the heart rate monitor on the digital output pin, as shown in Figure 16.
We compared the testing performance based on the accuracy values. The results show that the EBTA had a better accuracy score than any other classification method, as shown in Table 3. A confusion matrix is used to visualize the performance of the classifiers for the data sets where the true value is known. The confusion matrix from the testing process of each model is shown in Figure 17.
We performed a comparative study between our method and the results of previous studies. Table 4 presents a performance comparison to prior studies.

4. Discussion

The quality of the finger sensor needs to be considered because it is related to the PPG principle, which is a non-invasive method that functions to measure variations in blood volume in tissues using a light source and detector. The signal quality will significantly affect the final classification results of ML in general. This PPG signal quality assurance is the main reason for using an electronic filter circuit instead of filtering algorithms such as wavelet transform. As shown in Figure 18, an analysis of PPG signal quality demonstrates a difference in PPG signal quality between electronic circuit filtering and wavelet transform. The quality of the PPG signal from the filtering of the electronic circuit is better, marked by the visible diastolic notch. The feature points on each PPG signal contain essential information related to the accuracy of an ML classification process results. If filtered through a wavelet transformation, it is possible to remove important information from the PPG signal during the derivation process.
Data distribution is a function that shows all the data values and how often these values occur. The data distribution includes parameters that need to be considered to ensure that there are no data outliers to provide the optimal level of accuracy of the results, as shown in Figure 19.
After getting a high-quality, raw PPG signal, the next step is to choose an MLA that best fits the non-linear character of the PPG signal. Algorithm selection was based on training time, total misclassification cost, and accuracy of results. The top three were obtained after conducting several tests between several MLAs with the same dataset. The highest-ranked algorithm was the EBTA with 98% accuracy, a training time of 8 s, and a total misclassification cost of 2. The second-best algorithm was weighted KNN with 93% accuracy, a training time of 8.87 s, and a total misclassification cost of 7. The third algorithm was ensemble subspace KNN with 93% accuracy, a training time of 15 s, and a total misclassification cost of 7. While the algorithm Coarse Gaussian SVM had the fastest training time of 5 s, the accuracy of the results was only 91%, as shown in Table 3. The total misclassification cost is an essential parameter for evaluating the classification performance of unbalanced data sets [51]. The cost of misclassification is a penalty for errors in the classification process. The cost acquisition caused by different errors may be further in binary classification problems. The smaller the total misclassification cost obtained, the better the classifier’s performance. We have shown that the EBTA has a total misclassification cost of 2, so it is the best algorithm compared to other machine learning algorithms. We chose the EBTA to classify BGL using non-invasive PPG based on these results.
We conducted a comparative study between our method and the results of previous studies. The results of the comparative study show that the model we propose achieves a better accuracy score and overall outcome. In general, conclusions from quantitative research in previous studies can be different even though they use the same classifier, as shown in Table 4. We focus on comparing the results with two previous researchers, Zhang et al. [41] and Nirala et al. [42]. Nirala et al. proposed the Gaussian SVM method with a final accuracy value of 97.8%, which had the highest accuracy before this study. The SVM algorithm is trained to label the input data into two categories divided by the most expansive possible area between categories. Due to the large area between these category labels, SVM is also known as a large margin classifier. However, the SVM model is a linear classifier and cannot map non-linear functions without kernel usage, while the PPG signal is a non-linear function. When the EBTA produces a decision, it comes from several different models to reach a single conclusion. Technically, the classification process will be simplified by implementing voting. The EBTA uses a configuration of trees to be combined when voting on each test case. One class is considered valid if it receives more votes than the other. Voting results are more consistent if more votes are used. The EBTA produces composite models which usually perform better than single models such as SVM.
Zhang et al. research [41] is a meaningful comparison because it uses the same ensemble algorithm as our proposed algorithm. However, the results produced by Zhang et al. have lower accuracy than our proposed model. The difference in accuracy values occurs due to differences in the quality of the PPG raw signal and the number of sample points used. Each PPG signal has been extracted into 2100 features, and feature extraction is performed point-by-point so that the physiological data in the PPG signal can be explored optimally.

5. Conclusions

ML is the best solution to replace the conventional extracting PPG morphological features related to BGL. Our proposed method combines hardware with software to create a reliable system for BGL classification based on PPG. This classification method has advantages over other BGL estimation methods. Users can immediately find out the condition of their BGL to ensure early detection of diabetes using our proposed method. This method can speed up the treatment process and reduce the risk of death. We chose an electronic component-based PPG signal filtering process instead of an algorithm to preserve every information point contained in the PPG signal. The selection of electronic circuit filtering is an advantage of the proposed method compared to previous studies. By maintaining the quality of the PPG signal from the beginning, a more optimal accuracy value of ML classification results will be achieved. Our proposed method also does not require the extraction of the morphological features of the PPG signal; therefore, this method can be easily applied to many situations. Our proposed method (EBTA) achieves higher accuracy than subspace K-nearest neighbor, RUS boosted trees, ensemble bagged trees, decision trees, support vector machine, Gaussian support vector machine (GSVM), bagged trees, K-nearest neighbor (KNN), fine gaussian support vector regression (FGSVR), and support vector regression quadratic. In addition, increased sample sizes could further improve the performance of BGL classification based on PPG signals. We will use an embedded system to unite the electronic circuit section with ML algorithms to realize handheld equipment in future research.

Author Contributions

Designed, methodology, software, data collection, E.S.; supervision, methodology and corresponding, K.R.; performed the experiments and analysis H.M.; review and editing, N.H.A.; and all authors contributed to writing the paper. All authors have read and agreed to the published version of the manuscript.

Funding

This research was funded by the PDD grant of Ristekdikti, grant number: NKB-334/UN2.RST/HKP.05.00/2021.

Institutional Review Board Statement

Ethical review and approval were neglected for this study because the study data were obtained from the diabetes clinic medical records.

Informed Consent Statement

Informed consent was obtained from all subjects involved in the study.

Data Availability Statement

Not applicable.

Conflicts of Interest

The authors declare no conflict of interest.

References

  1. Clarke, S.; Foster, J. A history of blood glucose meters and their role in self-monitoring of diabetes mellitus. Br. J. Biomed. Sci. 2012, 69, 83–93. [Google Scholar] [CrossRef] [PubMed]
  2. Galaviz, K.I.; Narayan, K.V.; Lobelo, F.; Weber, M.B. Lifestyle and the Prevention of Type 2 Diabetes: A Status Report. Am. J. Lifestyle Med. 2018, 12, 4–20. [Google Scholar] [CrossRef] [PubMed]
  3. International Diabetes Federation. IDF Diabetes Atlas, 8th ed.; International Diabetes Federation: Brussel, Belgium, 2017; Available online: www.diabetesatlas.org (accessed on 24 November 2020).
  4. American Diabetes Association. (2) Classification and diagnosis of diabetes. Diabetes Care 2015, 38 (Suppl. 1), S8–S16. [Google Scholar] [CrossRef] [PubMed] [Green Version]
  5. The Big Picture: Checking Your Blood Sugar. Available online: https://www.diabetes.org/healthy-living/medication-treatments/blood-glucose-testing (accessed on 20 November 2020).
  6. Kirk, J.K.; Stegner, J. Self-monitoring of blood glucose: Practical aspects. J. Diabetes Sci. Technol. 2010, 4, 435–439. [Google Scholar] [CrossRef] [PubMed]
  7. Benjamin, E.M. Self-Monitoring of Blood Glucose: The Basics. Clin. Diabetes 2002, 20, 45–47. Available online: https://clinical.diabetesjournals.org/content/20/1/45.full-text.pdf (accessed on 10 November 2020). [CrossRef] [Green Version]
  8. Villena Gonzales, W.; Mobashsher, A.T.; Abbosh, A. The Progress of Glucose Monitoring-A Review of Invasive to Minimally and Non-Invasive Techniques, Devices and Sensors. Sensors 2019, 19, 800. [Google Scholar] [CrossRef] [PubMed] [Green Version]
  9. Lin, T. Non-Invasive Glucose Monitoring: A Review of Challenges and Recent Advances. Curr. Trends Biomed. Eng. Biosci. 2017, 6, 555696. [Google Scholar] [CrossRef]
  10. Tang, L.; Chang, S.J.; Chen, C.J.; Liu, J.T. Non-Invasive Blood Glucose Monitoring Technology: A Review. Sensors 2020, 20, 6925. [Google Scholar] [CrossRef]
  11. Poddar, R.; Andrews, J.T.; Shukla, P.; Sen, P. Non-Invasive Glucose Monitoring Techniques: A review and current trends. arXiv 2008, arXiv:0810.5755. Available online: https://www.researchgate.net/publication/210255819 (accessed on 24 November 2020).
  12. Khalil, O.S. Non-invasive glucose measurement technologies: An update from 1999 to the dawn of the new millennium. Diabetes Technol. Ther. 2004, 6, 660–697. [Google Scholar] [CrossRef]
  13. Tura, A.; Maran, A.; Pacini, G. Non-invasive glucose monitoring: Assessment of technologies and devices according to quantitative criteria. Diabetes Res. Clin. Pract. 2007, 77, 16–40. [Google Scholar] [CrossRef] [PubMed]
  14. Moreno, E.M.; Lujan, M.J.; Rusinol, M.T.; Fernandez, P.J.; Manrique, P.N.; Trivino, C.A.; Miquel, M.P.; Rodriguez, M.A.; Burguillos, M.J. Type 2 Diabetes Screening Test by Means of a Pulse Oximeter. IEEE Trans. Biomed. Eng. 2017, 64, 341–351. [Google Scholar] [CrossRef]
  15. Shokrekhodaei, M.; Quinones, S. Review of Non-invasive Glucose Sensing Techniques: Optical, Electrical and Breath Acetone. Sensors 2020, 20, 1251. [Google Scholar] [CrossRef] [Green Version]
  16. Waynant, R.W.; Chenault, V.M. Overview of Non-Invasive Fluid Glucose Measurement Using Optical Techniques to Maintain Glucose Control in Diabetes Mellitus. IEEE LEOS Newsl. 1998, 12, 3–6. [Google Scholar]
  17. Moraes, J.L.; Rocha, M.X.; Vasconcelos, G.G.; Vasconcelos Filho, J.E.; de Albuquerque, V.H.C.; Alexandria, A.R. Advances in Photopletysmography Signal Analysis for Biomedical Applications. Sensors 2018, 18, 1894. [Google Scholar] [CrossRef] [PubMed] [Green Version]
  18. Hina, A.; Saadeh, W. A Noninvasive Glucose Monitoring SoC Based on Single Wavelength Photoplethysmography. IEEE Trans. Biomed. Circuits Syst. 2020, 14, 504–515. [Google Scholar] [CrossRef]
  19. Allen, J. Photoplethysmography and its application in clinical physiological measurement. Physiol. Meas. 2007, 28, R1. [Google Scholar] [CrossRef] [Green Version]
  20. Alian, A.A.; Shelley, K.H. Photoplethysmography. Best Pract. Res. Clin. Anaesthesiol. 2014, 28, 395–406. [Google Scholar] [CrossRef]
  21. Sviridova, N.; Sakai, K. Human photoplethysmogram: New insight into chaotic characteristics. Chaos Solitons Fractals 2015, 77, 53–63. [Google Scholar] [CrossRef] [Green Version]
  22. Aimie-Salleh, N.; Ghani, N.A.A.; Hasanudin, N.; Shafie, S.N.S. Heart Rate Variability Recording System Using Photoplethysmography Sensor. In Autonomic Nervous System Monitoring-Heart Rate Variability; IntechOpen: London, UK, 2019. [Google Scholar]
  23. Nguyen, L.; Su, S.; Nguyen, H.T. Effects of Hyperglycemia on Variability of RR, QT and corrected QT intervals in Type 1 Diabetic Patients. In Proceedings of the 35th Annual International Conference of the IEEE EMBS, Osaka, Japan, 3–7 July 2013. [Google Scholar]
  24. Akhter, N.; Tharewal, S.; Gite, H.; Kale, K.V. Microcontroller based RR-Interval measurement using PPG signals for Heart Rate Variability based biometric application. In Proceedings of the 2015 International Conference on Advances in Computing, Communications and Informatics (ICACCI), Kochi, India, 10–13 August 2015; pp. 588–593. [Google Scholar]
  25. Vinik, A.I.; Erbas, T.; Casellini, C.M. Diabetic cardiac autonomic neuropathy, inflammation and cardiovascular disease. J. Diabetes Investig. 2013, 4, 4–18. [Google Scholar] [CrossRef]
  26. Rothberg, L.J.; Lees, T.; Clifton-Bligh, R.; Lal, S. Association Between Heart Rate Variability Measures and Blood Glucose Levels: Implications for Noninvasive Glucose Monitoring for Diabetes. Diabetes Technol. Ther. 2016, 18, 366–376. [Google Scholar] [CrossRef] [PubMed]
  27. Benichou, T.; Pereira, B.; Mermillod, M.; Tauveron, I.; Pfabigan, D.; Maqdasy, S.; Dutheil, F. Heart rate variability in type 2 diabetes mellitus: A systematic review and meta-analysis. PLoS ONE 2018, 13, e0195166. [Google Scholar] [CrossRef] [PubMed] [Green Version]
  28. Chellappan, K.; Sahathevan, R. Accelerated Aging and Non-invasive Cardiovascular Risk Monitoring. Cerebrovasc. Dis. 2015, 40, 25–27. [Google Scholar]
  29. Nirala, N.; Periyasamy, R.; Kumar, A. Noninvasive Diagnostic Methods for Better Screening of Peripheral Arterial Disease. Ann. Vasc. Surg. 2018, 52, 263–272. [Google Scholar] [CrossRef] [PubMed]
  30. Pilt, K.; Ferenets, R.; Meigas, K.; Lindberg, L.G.; Temitski, K.; Viigimaa, M. New photoplethysmographic signal analysis algorithm for arterial stiffness estimation. Sci. World J. 2013, 2013, 169035. [Google Scholar] [CrossRef] [PubMed]
  31. Yousef, Q.; Reaz, M.B.I.; Ali, M.A.M. The Analysis of PPG Morphology: Investigating the Effects of Aging on Arterial Compliance. Meas. Sci. Rev. 2012, 12, 266. [Google Scholar] [CrossRef] [Green Version]
  32. Md Lazin Md Lazim, M.R.; Aminuddin, A.; Chellappan, K.; Ugusman, A.; Hamid, A.A.; Wan Ahmad, W.A.N.; Mohamad, M.S.F. Is Heart Rate a Confounding Factor for Photoplethysmography Markers? A Systematic Review. Int. J. Environ. Res. Public Health 2020, 17, 2591. [Google Scholar] [CrossRef] [Green Version]
  33. Hiramine, K.; Miwa, T.; Horashima, K. A study of the Arterial Stiffness Index in Diabetes Patient: Trial of a New Non-Invasive Arterial Hardness Estimation Procedure That Uses an Oscillometric Method; Japan Diabetes Society: Tokyo, Japan, 2002. [Google Scholar]
  34. Tjahjadi, H.; Ramli, K. Non-invasive Blood Pressure Classification Based on Photoplethysmography Using K-Nearest Neighbors Algorithm: A Feasibility Study. Information 2020, 11, 93. [Google Scholar] [CrossRef] [Green Version]
  35. Banik, S.K.; Fenley, A.T.; Kulkarni, R.V. A model for signal transduction during quorum sensing in Vibrio harveyi. Phys. Biol 2009, 6, 046008. [Google Scholar] [CrossRef]
  36. Lim, P.K.; Ng, S.C.; Lovell, N.H.; Yu, Y.P.; Tan, M.P.; McCombie, D.; Lim, E.; Redmond, S.J. Adaptive template matching of photoplethysmogram pulses to detect motion artefact. Physiol. Meas. 2018, 39, 105005. [Google Scholar] [CrossRef]
  37. Maeda, Y.; Sekine, M.; Tamura, T. Relationship between measurement site and motion artifacts in wearable reflected photoplethysmography. J. Med. Syst. 2011, 35, 969–976. [Google Scholar] [CrossRef] [PubMed]
  38. Hettiarachchi, C.; Chitraranjan, C. A Machine Learning Approach to Predict Diabetes Using Short Recorded Photoplethysmography and Physiological Characteristics. In Artificial Intelligence in Medicine; Springer: Cham, Switzerland, 2019; Chapter 41; pp. 322–327. [Google Scholar]
  39. Zou, Q.; Qu, K.; Luo, Y.; Yin, D.; Ju, Y.; Tang, H. Predicting Diabetes Mellitus With Machine Learning Techniques. Front. Genet. 2018, 9, 515. [Google Scholar] [CrossRef] [PubMed]
  40. Karimipour, H.; Shandiz, H.T.; Zahedi, E. Diabetic diagnose test based on PPG signal and identification system. J. Biomed. Sci. Eng. 2009, 02, 465–469. [Google Scholar] [CrossRef] [Green Version]
  41. Zhang, Y.; Zhang, Y.; Siddiqui, S.A.; Kos, A. Non-invasive blood-glucose estimation using smartphone PPG signals and subspace kNN classifier. Elektrotehniski Vestn. 2019, 86, 68–74. [Google Scholar]
  42. Nirala, N.; Periyasamy, R.; Singh, B.K.; Kumar, A. Detection of type-2 diabetes using characteristics of toe photoplethysmogram by applying support vector machine. Biocybern. Biomed. Eng. 2019, 39, 38–51. [Google Scholar] [CrossRef]
  43. Qawqzeh, Y.K.; Bajahzar, A.S.; Jemmali, M.; Otoom, M.M.; Thaljaoui, A. Classification of Diabetes Using Photoplethysmogram (PPG) Waveform Analysis: Logistic Regression Modeling. Biomed. Res. Int. 2020, 2020, 3764653. [Google Scholar] [CrossRef]
  44. Zhang, G.; Mei, Z.; Zhang, Y.; Ma, X.; Lo, B.; Chen, D.; Zhang, Y. A Non-invasive Blood Glucose Monitoring System Based on Smartphone PPG Signal Processing and Machine Learning. IEEE Trans. Ind. Inform. 2020, 16, 7209–7218. [Google Scholar] [CrossRef]
  45. Hossain, S.; Debnath, B.; Biswas, S.; Al-Hossain, M.J.; Anika, A.; Zaman Navid, S.K. Estimation of Blood Glucose from PPG Signal Using Convolutional Neural Network. In Proceedings of the 2019 IEEE International Conference on Biomedical Engineering, Computer and Information Technology for Health (BECITHCON), Dhaka, Bangladesh, 28–30 November 2019; pp. 53–58. [Google Scholar]
  46. Sen Gupta, S.; Kwon, T.-H.; Hossain, S.; Kim, K.-D. Towards non-invasive blood glucose measurement using machine learning: An all-purpose PPG system design. Biomed. Signal Process. Control 2021, 68, 102706. [Google Scholar] [CrossRef]
  47. Majumder, S.; Balaji, N.; Brey, K.; Fu, W.; Menzies, T. 500+ Times Faster Than Deep Learning (A Case Study Exploring Faster Methods for Text Mining StackOverflow). In Proceedings of the 2018 IEEE/ACM 15th International Conference on Mining Software Repositories (MSR), Gothenburg, Sweden, 28–29 May 2018. [Google Scholar] [CrossRef]
  48. Bolandraftar, M. Application of K-Nearest Neighbor (KNN) Approach for Predicting Economic Events: Theoretical Background. J. Eng. Res. Appl. 2013, 3, 605–610. [Google Scholar]
  49. Easy Pulse Sensor (Version 1.1). Available online: http://www.embedded-lab.com (accessed on 20 October 2021).
  50. Jukic, S.; Saracevic, M.; Subasi, A.; Kevric, J. Comparison of Ensemble Machine Learning Methods for Automated Classification of Focal and Non-Focal Epileptic EEG Signals. Mathematics 2020, 8, 1481. [Google Scholar] [CrossRef]
  51. Lu, H.; Xu, Y.; Ye, M.; Yan, K.; Gao, Z.; Jin, Q. Learning misclassification costs for imbalanced classification on gene expression data. BMC Bioinform. 2019, 20, 681. [Google Scholar] [CrossRef] [PubMed]
Figure 1. Blood Glucose Measurement Techniques.
Information 13 00059 g001
Figure 2. PPG Measurement Techniques.
Information 13 00059 g002
Figure 3. HRV calculation using ECG and PPG signals.
Information 13 00059 g003
Figure 4. Stiffness index calculation using PPG.
Information 13 00059 g004
Figure 5. The detailed block diagram of the classification of BGL. The proposed method presents a system that can be used for non-invasive BGL classification based on a single PPG waveform from an electronic circuit combined with a machine learning algorithm.
Information 13 00059 g005
Figure 6. Schematic diagram of non-invasive classification of BGL for early detection of diabetes using a machine learning algorithm based on a photoplethysmography signal. Processing steps: data collection, data segmentation, labelling, and results (classification).
Information 13 00059 g006
Figure 7. PPG signal characteristics of different BGL classifications.
Information 13 00059 g007
Figure 8. The PPG signal selection is made based on its waveform [34].
Information 13 00059 g008
Figure 9. Processing application software can display PPG signals in real-time.
Information 13 00059 g009
Figure 10. The design of PPG electronic circuits consists of: finger sensor, filter, and amplifier circuit [49].
Information 13 00059 g010
Figure 11. Classifier algorithms were tested.
Information 13 00059 g011
Figure 12. The proposed model of the Ensemble Bagging Trees configuration consists of many single classifiers with final predictions through a majority voting process.
Information 13 00059 g012
Figure 13. PPG waveform at TP1 [49].
Information 13 00059 g013
Figure 14. PPG waveform at TP2 [49].
Information 13 00059 g014
Figure 15. Analog PPG waveform [49].
Information 13 00059 g015
Figure 16. Digital PPG waveform at the digital output (DO) [49].
Information 13 00059 g016
Figure 17. (A) Ensemble Bagged Trees, testing accuracy: 98%; (B) Ensemble Subspace KNN, testing accuracy: 93%; (C) Fine Trees, testing accuracy: 93%; (D) Coarse Gaussian SVM, testing accuracy: 90%; (E) Ensemble Boosted Trees, testing accuracy: 91%; (F) Logistic Regression, testing accuracy: 76%.
Information 13 00059 g017
Figure 18. Comparison of PPG signal filtering from the electronic circuit (hardware) with wavelet transform (software).
Information 13 00059 g018
Figure 19. Training data distribution with 150 normal subjects and 150 diabetes subjects.
Information 13 00059 g019
Table 1. The Dataset Information.
No.Subject IDSex
F/M
Age
(Years)
Systolic
(mmHg)
Diastolic
(mmHg)
HR
(bpm)
Random Glucose Test
(mg/dL)
Status
14F19125808092Normal
25M18100708080Normal
412M4011167101211Diabetes
513M481125783230Diabetes
Table 2. Blood glucose level of NICE 2019.
Plasma Glucose TestNormalPrediabetesDiabetes
Random<200 mg/dL or <11.1 mmol/LN/A>200 mg/dL or >11.1 mmol/L
Fasting<100 mg/dL or <5.5 mmol/L100–125 mg/dL or 5.5–6.9 mmol/L>126 mg/dL or >7 mmol/L
Table 3. Comparison of testing performance.
ClassifierAccuracy
(%)
Prediction Speed
(Observation/s)
Training Time
(s)
Total Cost
Ensemble Bagged Trees98.00 ~ 330 8.022
Weighted KNN93.00 ~ 160 8.877
Ensemble Subspace KNN93.00 ~ 95 15.007
Fine Trees93.00 ~ 310 24.007
Medium Trees93.00 ~ 310 24.007
Fine KNN92.00 ~ 170 8.008
Three-layered Neural Network92.00 ~ 370 16.18NA
Narrow Neural Network91.00 ~ 370 7.09NA
Coarse Gaussian SVM90.00 ~ 360 5.179
Ensemble Boosted Trees91.00 ~ 310 27.0010
Ensemble RUS Boosted Trees87.00 ~ 270 48.0813
Logistic Regression76.00 ~ 120 19.03NA
Table 4. Classification performance comparison.
YearPPG SignalInvasive MethodsClassifierFeatures ExtractionEvaluation MetricCharacteristic
2009Finger sensor [40]Not
mentioned
Auto-Regressive Moving Average (ARMA)Not MentionedSpecificity =
0.9
Sensitivity = 1
Classification
2017Pulse Oximeter
[14]
HbA1c TestRandom Forest9ROC = 0.7Classification
Gradient Boosting9ROC = 0.7Classification
Linear Discriminant Analysis9ROC = 0.6Classification
2019Smartphone Camera
[41]
Glucose meterSubspace KNN67Accuracy =
86.2%.
Classification
RUS Boosted Trees67Accuracy =
85.0%
Classification
Bagged Trees67Accuracy =
86.0%
Classification
Decision Trees67Accuracy =
80.1%
Classification
2019Finger sensor
[42]
Blood
Glucose Lab Test
Support Vector Machine37Accuracy =
97.9%
Classification
2020Finger sensor
[43]
HbA1c TestLogistic RegressionNot MentionedAccuracy =
92.3%
Classification
2020Smartphone
[44]
Glucose meterGaussian Support Vector Machine (GSVM)28Accuracy =
81.5%
Classification
Bagged Trees28Accuracy =
74.0%
Classification
K-Nearest Neighbor28Accuracy =
71.0%
Classification
2021Finger sensorGlucose meterEnsemble bagged trees
(Proposed method in this study)
2100Accuracy:
98.0%
Classification
Publisher’s Note: MDPI stays neutral with regard to jurisdictional claims in published maps and institutional affiliations.

