
Explainable Stacking-Based Model for Predicting Hospital Readmission for Diabetic Patients


School of Project Management, Faculty of Engineering, The University of Sydney, Forest Lodge, Sydney, NSW 2037, Australia
*
Author to whom correspondence should be addressed.
Information 2022, 13(9), 436; https://0-doi-org.brum.beds.ac.uk/10.3390/info13090436
Submission received: 5 August 2022
/
Revised: 13 September 2022
/
Accepted: 13 September 2022
/
Published: 15 September 2022
(This article belongs to the Special Issue Predictive Analytics and Data Science)
Abstract
:Artificial intelligence is changing the practice of healthcare. While it is essential to employ such solutions, making them transparent to medical experts is more critical. Most of the previous work presented disease prediction models, but did not explain them. Many healthcare stakeholders do not have a solid foundation in these models. Treating these models as ‘black box’ diminishes confidence in their predictions. The development of explainable artificial intelligence (XAI) methods has enabled us to change the models into a ‘white box’. XAI allows human users to comprehend the results from machine learning algorithms by making them easy to interpret. For instance, the expenditures of healthcare services associated with unplanned readmissions are enormous. This study proposed a stacking-based model to predict 30-day hospital readmission for diabetic patients. We employed Random Under-Sampling to solve the imbalanced class issue, then utilised SelectFromModel for feature selection and constructed a stacking model with base and meta learners. Compared with the different machine learning models, performance analysis showed that our model can better predict readmission than other existing models. This proposed model is also explainable and interpretable. Based on permutation feature importance, the strong predictors were the number of inpatients, the primary diagnosis, discharge to home with home service, and the number of emergencies. The local interpretable model-agnostic explanations method was also employed to demonstrate explainability at the individual level. The findings for the readmission of diabetic patients could be helpful in medical practice and provide valuable recommendations to stakeholders for minimising readmission and reducing public healthcare costs.
1. Introduction
Explainable Artificial Intelligence (XAI) is a method of making emerging artificial intelligence systems more understandable, trustworthy, and manageable [1]. According to Amann et al. [2], the explainability of artificial intelligence models raises legal, ethical, and societal concerns that require further examination. One of the most contentious issues concerns the interpretability of machine learning models for prediction, particularly when it comes to healthcare [2]. Apparently, many healthcare stakeholders do not have a solid foundation in data science. Experts consider the reason for a prognosis rather than the binary result of machine learning algorithms [3]. However, most of the previous works in the field of health informatics only presented machine learning prediction but did not attempt to explain the model [4,5,6,7]. Even if the accuracy measures were high, seeing these models as a ‘black box’ diminished confidence in their predictions. Since machine learning algorithms are widely considered as ‘black boxes’ that are difficult to understand, incorporating explainability via XAI into these algorithms should be imperative in healthcare.
Meanwhile, hospital readmissions occur when a patient is released from the hospital and returns within a particular time window [8]. Unplanned patient readmissions place a significant financial strain on healthcare systems. The healthcare expenditures associated with unplanned readmissions are enormous, and there are severe impacts on patients’ health and well-being [9]. Patients with diabetes are often readmitted to hospitals [8]. Inpatient hospital treatment for diabetics accounted for more than 40% of total diabetes-related healthcare spending in Australia [10]. Readmissions added significantly to the burden and medical costs associated with diabetes hospitalisation [11].
In order to reduce healthcare costs caused by readmission after hospitalisation of patients with diabetes, the hospital readmission reduction programme in the United States was established under the Affordable Care Act. Hospital readmission within 30 days of discharge is the criteria for unexpected readmission [12]. According to a recent study, the 30-day readmission rate for hospitalised diabetes patients is roughly 20%, which is much higher than the rate for all hospitalised patients (i.e., 8.5%–13.5%) [13]. Therefore, it is important to predict the patients who are at high risk of readmission when they are discharged from the hospital to receive better treatment and lower their chances of readmission [14].
A substantial amount of related work has been conducted on the related topic of predicting hospital readmission. Strack et al. [8] used a statistical model to analyse the impact of HbA1c measurement on hospital readmission rates. According to the findings, paying more attention to diabetes as assessed improves patient outcomes and minimises inpatient care costs. Rubin [15] investigated the risk variables for hospital readmission in diabetic patients. Lower socioeconomic level, racial minority, burden, insurance, emergent admission, and a history of recent hospitalisation significantly impact admission rates. Recently, with the rise of machine learning and deep learning, enormous literature has been devoted to using machine learning models for predicting hospital readmission risks. Bhuvan et al. [14] employed machine learning classifiers to predict readmission risk in diabetic patients. Cui et al. [16] suggested a novel technique for predicting readmission risk that combines a Support Vector Machine and a genetic algorithm. Deep learning algorithms were also used in this area. Hung et al. [17] used three classic machine learning models to predict hospital readmissions in patients with atrial fibrillation undergoing catheter ablation. Arnaud et al. utilised deep learning to predict hospitalisation at triage. They used a multilayer perceptron with features and a convolutional neural network [18] to operate over the textual data for predicting hospitalisation. Hammoudeh et al. [19] performed an analysis on predicting hospital readmission using neural networks. They suggested deep learning outperformed machine learning models. Although these machine learning and deep learning models can predict the risk of hospital readmission and classify high-risk factors, these studies often ignore the models’ interpretability or lack of explainability, leading to the ‘black box’ phenomenon. Interpretability is crucial, and researchers may struggle to transfer learnings into a larger knowledge base if they do not comprehend how a model works. Meanwhile, stakeholders in the healthcare domain may not have a strong data science background. Using the proposed machine learning and deep learning models in practice and explaining these models to stakeholders have become critical issues. At the same time, given that each machine learning strategy is likely to outperform or be wrong in different contexts, it makes sense to consider how to combine numerous machine learning approaches to achieve superior results. Bagging [20], boosting [21] and stacking [22] are three main ensemble learning methods. Despite the fact that Bagging and Boosting are the most widely used classification methods, they are still part of a simplistic combination strategy, making it impossible to extract complicated information from different classifiers. The stacking approach uses several base learner predictions as features to train a new meta learner, which is a powerful ensemble strategy that has been used effectively in predicting readmission risk [23,24,25]. The stacking-based approach is powerful and convincing enough to shift the initial data mining attitude away from finding the best single model and towards discovering a group of good complementary models. However, to the best of our knowledge, the explainable stacking technique is rarely applied in predicting the risk of 30-day readmission in diabetic patients.
The goal of this study was to use the stacking approach to predict 30-day readmission following hospitalisation of diabetic patients using the XAI technique. XAI aids clinician and patient decision-making by revealing the natures and characteristics of the variables that the method used to make its predictions.
The contributions of this study include:
- The exploration of class imbalanced techniques and feature selection methods on the dataset with high-class imbalance problems. Measure the importance of the features to reduce the feature dimensions in machine learning models.
- We utilised a stacking-based model for predicting the readmission risk for diabetic patients and studied deeply into interpreting the readmission predictions using interpretable machine learning tools.
The rest of the study is organised as follows. Section 2 describes the materials and methods for the XAI framework. Section 3 presents the experimental results and a case study for XAI. Section 4 presents the discussion, limitations, and recommendations for further research, followed by Section 5, which concludes the study.
2. Materials and Methods
The section below describes the data source, data preprocessing, feature selection, and machine learning classifier. The overall workflow of the XAI-based framework shows in Figure 1. Our research framework consists of two modules. Firstly, machine learning classifiers, including the proposed model, were used to predict the outcomes. Secondly, XAI techniques were used to explore the most important features for prediction. In this research, we used 30-day readmission after hospitalisation of patients for diabetes prediction as an example to examine the framework.
2.1. Data Collection
This study employed data from the US Health Facts Database, which comprised 101,766 de-identified diabetes patients between 1999 and 2008 [8]. This dataset also contained the clinical records of diabetic inpatients who stayed in the hospital for 1–14 days and laboratory testing and medicines administered during their hospitalisations.
2.2. Data Preprocessing
2.2.1. Handing Missing Data and Outlier Detection
We removed the variables with more than 30% missing data, such as ‘variables weight’, ‘medical speciality’, and ‘payer code’. In addition, the race variable contained 2273 missing values (i.e., 2.3% of total patients). We decided to drop the patients with invalid races. Further, in addition to three patients with an unknown or invalid value for gender, we also dropped these patients. Local Outlier Factor [26] was also used for outlier detection. It determines how far a sample’s density deviates from its neighbours on a local scale.
2.2.2. Feature Engineering
The goal of this study was to predict whether the patient would be readmitted to the hospital within 30 days. The target variable readmission category was specified as three values (i.e., no, less than 30 days and more than 30 days). We integrated readmission after 30 days and no readmission into a single category to limit the problem to binary classification (i.e., labels ‘No’ and ‘>30′ representing ‘no 30-day readmission’, encoded numerically as 0. Otherwise, encoded numerically as 1).
The discharge disposition contained different types of discharge. We dropped the patients with expired, hospice/home, hospice/medical facility, expired at home, expired at the medical facility, and expired with place unknown because these patients will not be readmitted again.
For the diagnosis variable, each variable in the dataset had about 700–900 different ICD (International Classification of Diseases) codes. In order to reduce the complexity of these variables, these codes were mapped into nine diseases. We followed the ICD-9-CM guideline [27], and the mapping details are presented in Table 1.
Further, we encoded the 21 drug features, A1c test results, and glucose serum test into binary. If the drug with value ‘No’, we classified it as 0, otherwise 1. If the A1c test result and glucose serum test were ‘Norm’, we classified it as 0, otherwise 1. We then used one-hot encoding for ‘Race’, ‘admission type ID’, ‘discharge disposition ID’, and ‘admission source ID’.
Lastly, the features ‘examine’ and ‘citoglipton’ were removed because each had just one value (i.e., it makes no difference for machine learning methods if we consider these features or not). The features ‘encounter id’ and ‘patient number’ were also removed because there were nominal variables.
2.3. Handing Class Imbalance
Many machine learning approaches encounter the problem of unbalanced data, which happens when a majority class dominates the data, and a minority class is rarely discovered [28]. As a result, the classifier’s performance in the minority class may be poor when compared with the majority class. Predicting readmission is a fundamentally imbalanced problem [29]. According to previous studies [28], random under-sampling (RUS) [30] was performed outstandingly on imbalanced medical data. Therefore, we applied the RUS method that randomly balanced the class by removing a large portion of the majority class to overcome an imbalanced dataset. RUS is the process of randomly selecting samples from the majority class from the training dataset and deleting them. The majority of class instances are deleted at random until a more balanced distribution is attained [30].
2.4. Feature Selection
The process of selecting the best features that have a substantial influence on the expected results is known as feature selection [31]. Since there were 55 features in the dataset, conducting a feature selection process is necessary. We utilised the embedded technique for feature selection to find informative factors for readmission prediction [31]. In this study, we utilised a feature selection method of SelectFromModel (SFM). SFM is a meta-transformer created by Scikit-learn [32]. It uses an estimator’s attribute to evaluate and rank the features, then transforms the dataset based on their ranking. As a result, the estimator was fitted to the training data, and the model was used to calculate the importance of each feature. The meta-transformer then rated the features based on their value and selected the most important ones based on the set threshold.
After the data cleaning and transformation, six machine learning models were used to feature selection: support vector machine, decision tree, random forest, adaptive Boosting, extreme gradient boosting, and category boosting. We also utilised accuracy and the area under the receiver operating characteristic curve to assess the models’ prediction performance.
The Support Vector Machine (SVM) distinguishes between two classes by constructing a hyperplane, which processes the input data to create a mathematically optimal separation of classes into a high-dimensional space [33]. The decision tree (DT) approach employs a tree-like graph and its potential outcomes [34]. It is easy to interpret and understand how the model is making decisions. Random forest (RF) is an approach for ensemble learning that consists of several decision trees [35]. It performs well on large volumes of data and high decisional data. Adaptive Boosting (AdaBoost) is a meta-estimator that begins by fitting a classifier on the dataset and then fitting further copies of the classifier on the same dataset while modifying the weights of poorly categorised examples so that future classifiers focus more on challenging scenarios [21]. Extreme gradient boosting (XGBoost) is a variation on bagging that aims to enhance learners by concentrating on areas where the system is not performing well. It also uses both L1 and L2 regularisation to prevent overfitting [36]. Category Boosting (CatBoost) is a boosting variant that focuses on categorical columns using permutation techniques. To tackle the exponential expansion of feature combinations, it employs the greedy method for each new split of the current tree [37].
2.5. Stacking-Based Model
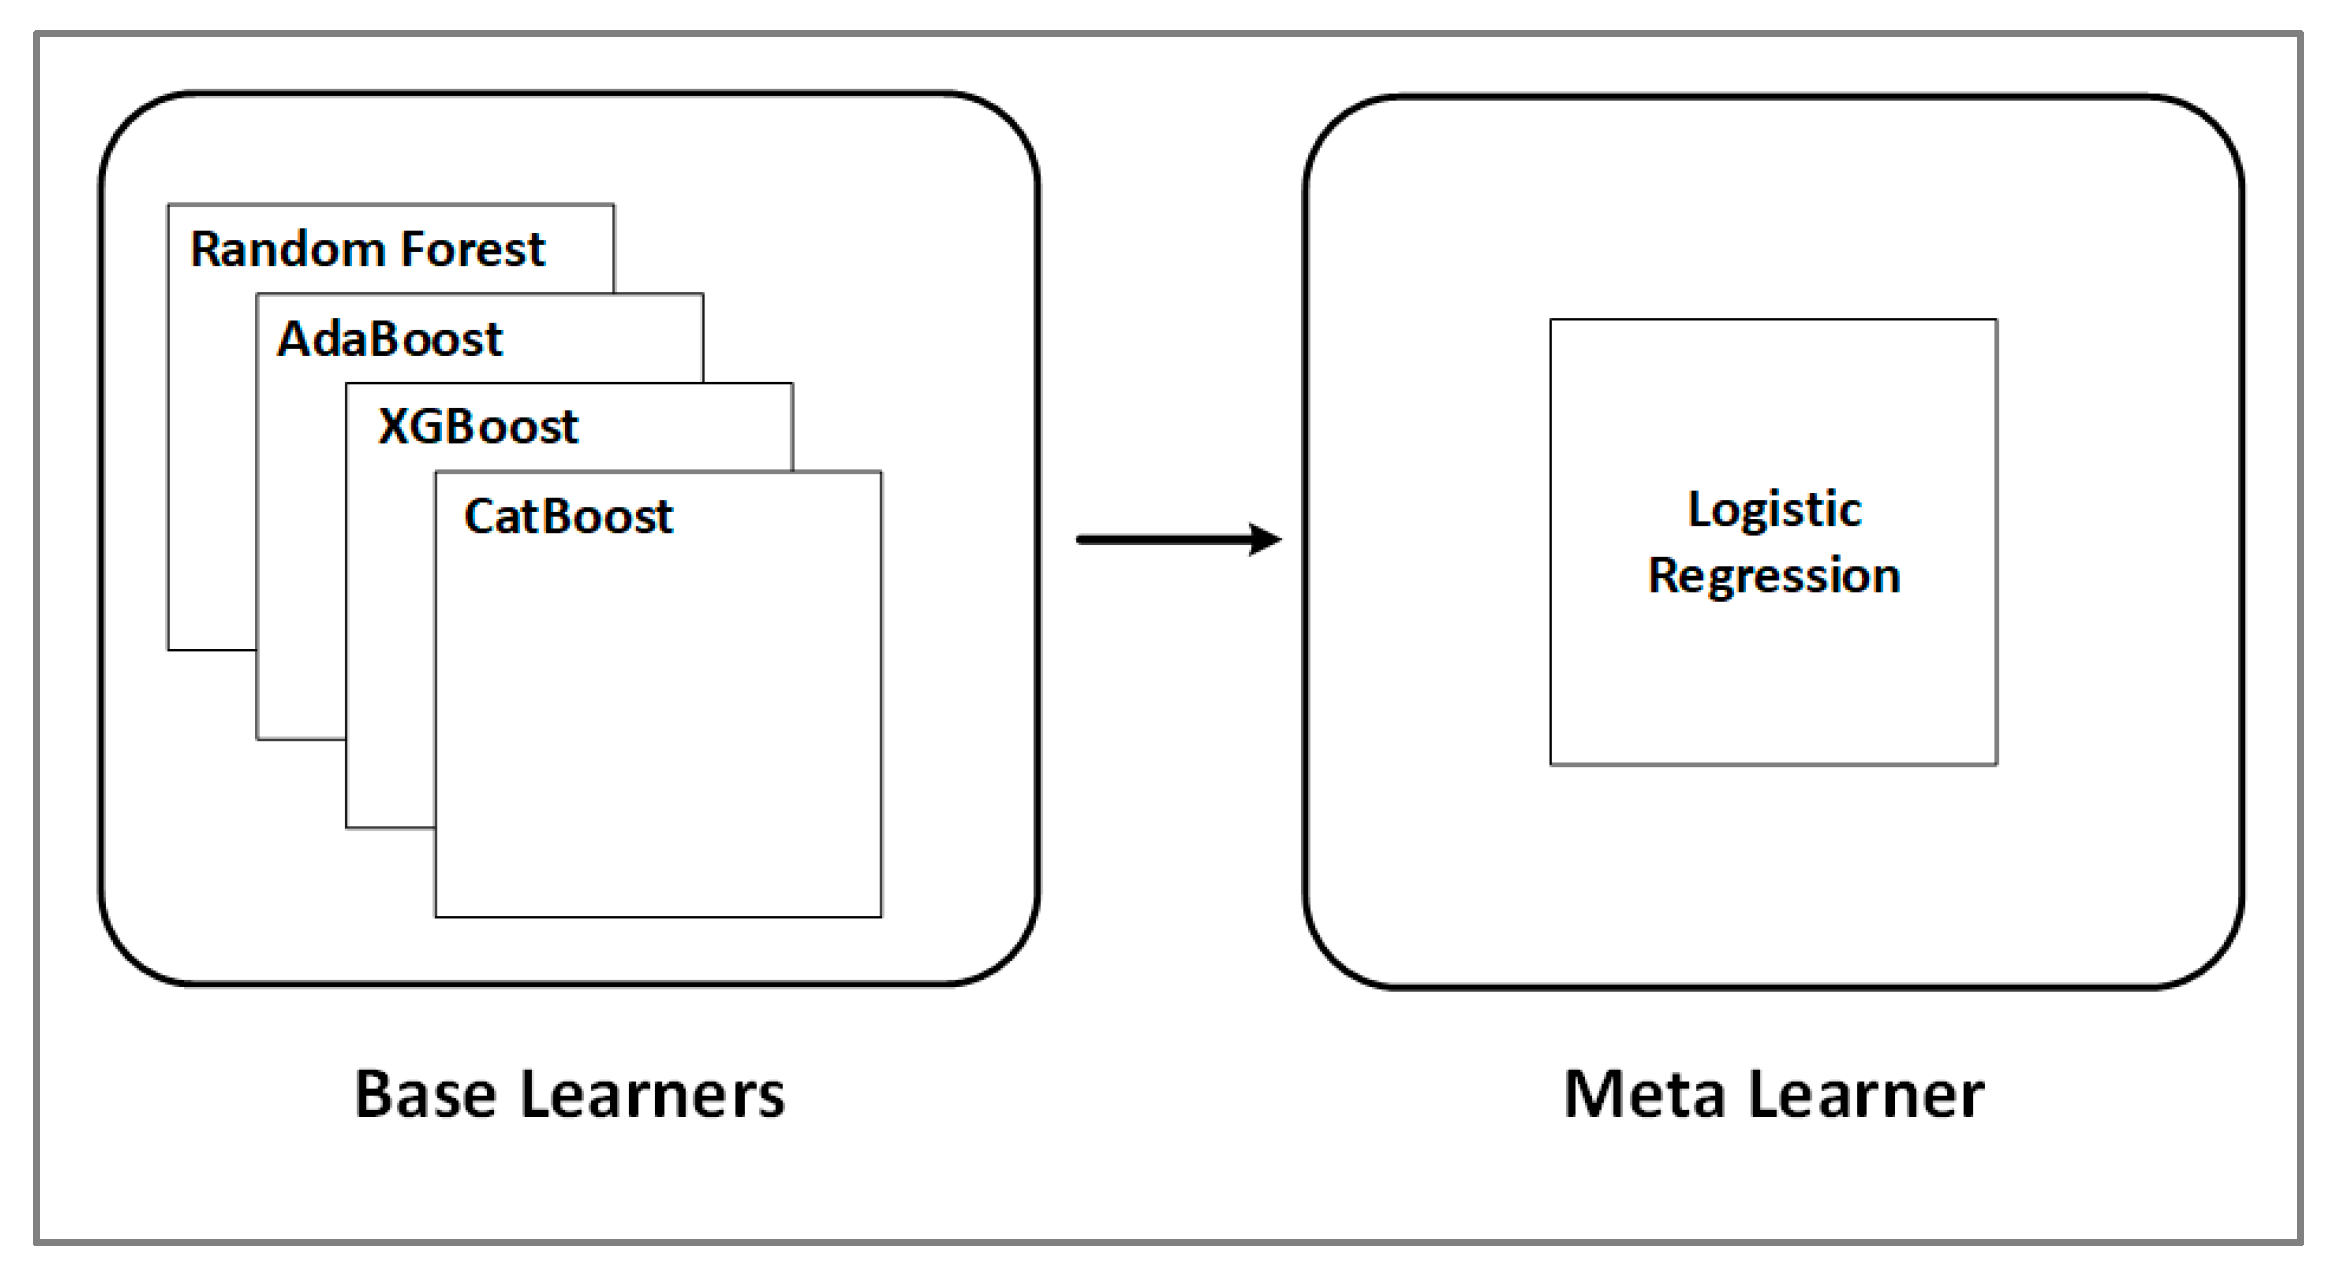
The stacking method is a machine learning ensemble algorithm. Using a meta-learning strategy, it learns how to aggregate predictions from two or more underlying machine learning algorithms. Multiple machine learning models are merged in a sequence in a stacking-based model. Each model’s predictions are merged to produce a new feature, ensuring that each model in the stack accurately predicts a piece of the training data for this new feature. The stack’s final dataset is fed into a meta learner, tasked with generalising all of the features to provide a final prediction. Stacking can combine the skills of many high-performing models to provide predictions that exceed any single model in the ensemble on a categorisation assignment [22]. In this study, we created a stacking classifier by combining predictions from the five models: RF, AdaBoost, XGBoost, and CatBoost were used as base learners. LR was used as the meta learner. Meanwhile, the meta learner is simple, allowing for a seamless interpretation of the base-models predictions. As a result, linear models, such as logistic regression for classification tasks, were employed as the meta-model in this study (see Figure 2).
2.6. Interpretable Machine Learning Applications
In this study, we used permutation feature importance and Local Interpretable Model-Agnostic Explanations (LIME) for detailed explanations of the machine learning model’s behaviour and prediction. The workflow of XAI applications is shown in Figure 3.
The relevance of permutation features is measured by the increase in the model’s prediction error after permuting the feature’s values, which destroys the link between the feature and the true outcome. [38]. This method can be used for any fitted estimator, which is suitable for the proposed stacking-based model, and it has the advantage of being model agnostic, allowing it to be calculated multiple times with various permutations of the feature.
LIME [39] is a method for training local surrogate models that can explain individual predictions. In the LIME method, local refers to the need for the explanation to accurately reflect the classifier’s behaviour ‘around’ the predicted instance.
2.7. Validation and Evaluation
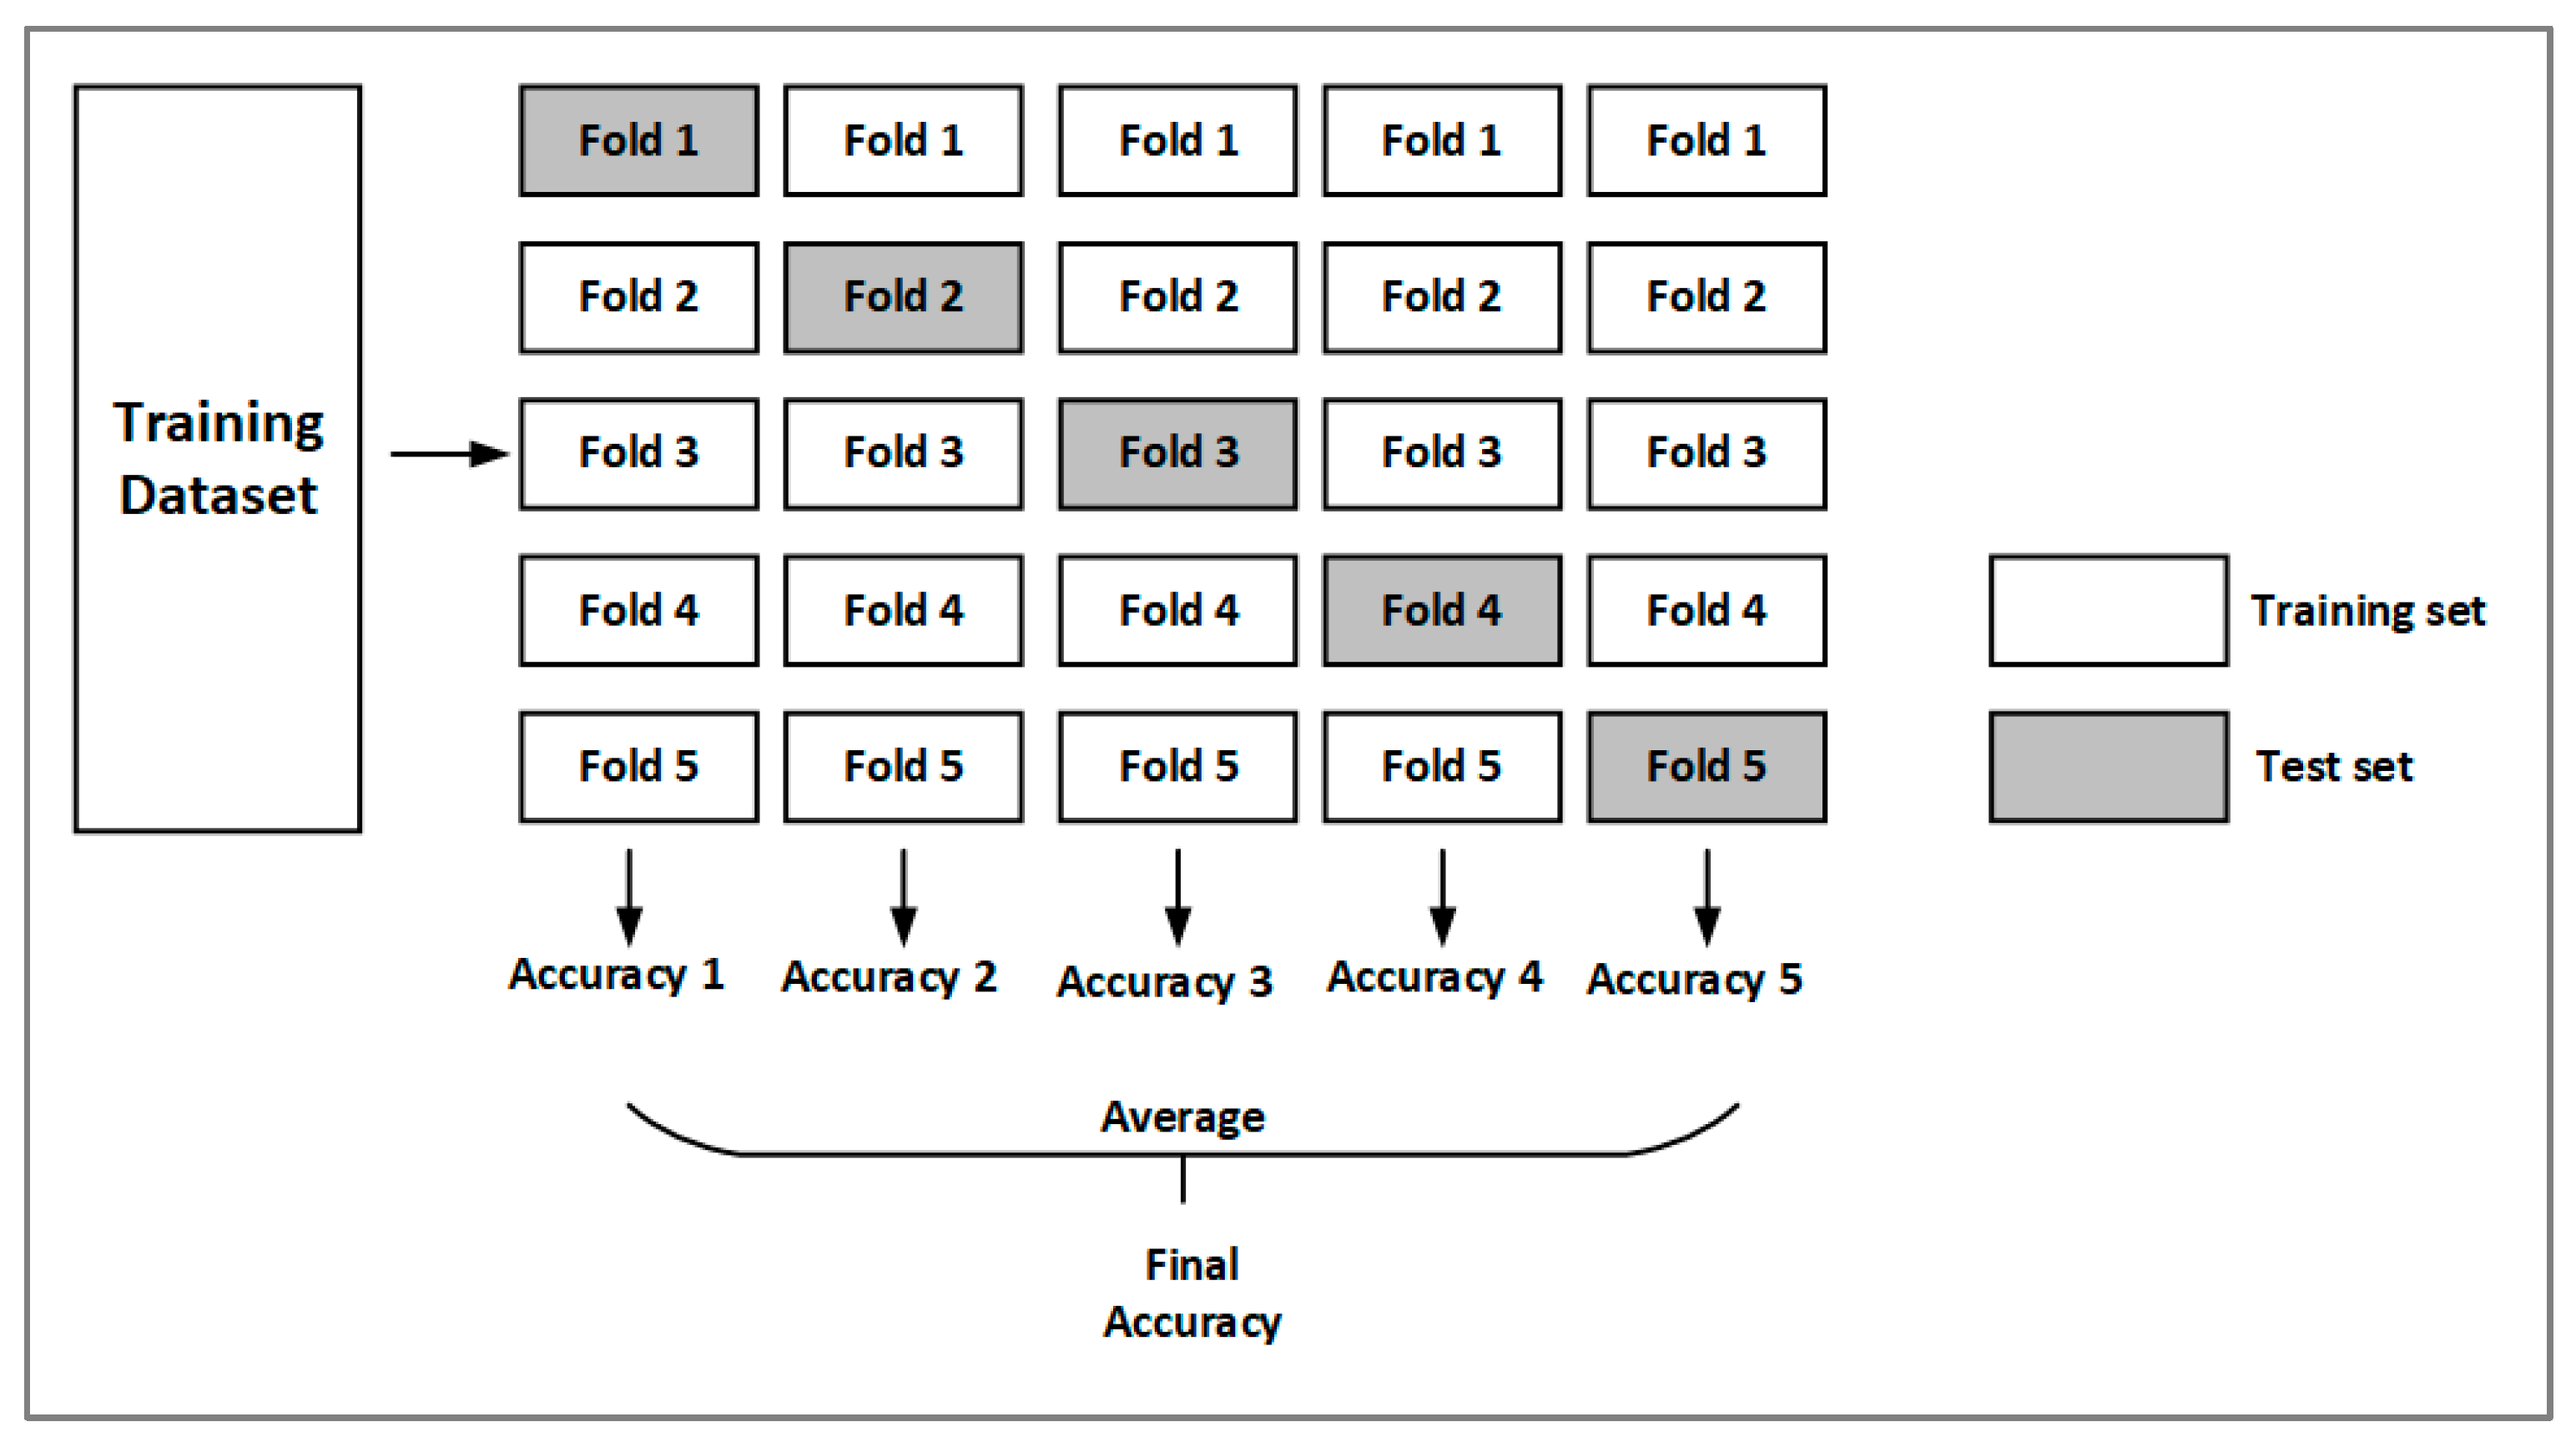
The models are trained using k-fold cross-validation. The dataset is divided into different groups. The number of groups, commonly known as the ‘fold’, is denoted by the letter k. The technique of k-fold cross-validation divides the data set into k groups, the model is trained by (k − 1) groups, and then the trained model is evaluated by the other group [40]. In this study, we selected k = 5. Figure 4 represents a 5-fold cross-validation process. The dataset was divided into five folds, with four participating in model training and one participating in evaluation in each of the five iterations. After the training, the average accuracy was calculated to assess the performance.
This study used accuracy and the area under the receiver operating characteristic curve (AUC), precision, recall, and f1-score as the measure of model performance. Figure 5 displays the Receiver Operating Characteristic (ROC) Curve, which is the plot between the true-positive rate (y-axis) and the false-positive rate (x-axis). The area under the ROC curve (AUC) assesses how effectively a model can predict whether a classification belongs to one of two classes. The greater the AUC value, the better the predictive performance of the classifier [41].
3. Results
After applying the research dataset through the filtering criteria, we removed 4658 patients from the dataset. The total number of patients was 97,108. We divided the data into two sets: training and testing. This study randomly selected 80% of patients from the dataset to train the models. In the training set, there were 68,785 patients who were not readmitted and 8901 patients who were readmitted. As can be seen, the data were imbalanced. We applied random under-sampling methods mentioned in Section 2.2. After the data preprocessing, there were 8901 readmitted patients and 8901 not-readmitted patients for model training.
3.1. Results of Models during the Training Phase
Table 2 displays the accuracy of the machine learning models during the training phase.
The models had similar accuracy in predicting readmission in diabetic patients. We found that CatBoost had the best accuracy (61.53%), followed by XGBoost (61.49%).
3.2. Results of Feature Selection and Stacking-Based Model
Before feature selection, the dataset had 55 features. Since CatBoost was the best-performing model in the training phase, we applied SFM on CatBoost. After SFM, which deleted a significant number of redundant features, there were 18 feature numbers. We also trained the machine learning models with a reduced number of features. Table 3 displays the model performance metrics for the testing phase.
As shown in Table 3, the stacking model outperformed the other models with an AUC, precision, F1-score, and accuracy of 0.6736, 0.8542, 0.7434, and 68.63%, respectively. RF and CatBoost followed behind with AUCs of 0.6690 and 0.6660, respectively. The confusion matrix is shown in Figure 6. The number of not-readmitted in the test set is greater than the number of admitted due to the nature of the dataset. The confusion matrix showed that the best-performed model had more false-negative predictions than false-positive predictions. Because of the false-positive counts, some diabetic patients may be anticipated to have a high risk of readmission. This is appropriate for our research because the goal is to enhance the predictability of readmission risk. It is preferable to anticipate lower-risk individuals as readmission risks (i.e., false-positives) rather than the contrary (i.e., false-negative counts). Patients who are on the readmission pathway will leave unnoticed if there are more false-negative results in the prediction.
3.3. Comparison with the Other Studies of the Present Literature
Although the stack-based model performed over the other models, the accuracy and AUC results seem to be relatively low. It would be interesting to provide a comparison with pre-existing works to understand if these results are in line with the existing state-of-the-art.
Table 4 summarises the comparison of this study to other similar studies in the current literature using the same dataset. In producing this comparison, we took into account generally used performance measures (i.e., AUC). As can be seen, the AUC results of the present literature ranged from 0.640 to 0.670. This comparison with pre-existing studies concluded model outperforms previous prediction results. There are two main reasons for our proposed stacking model to have better performance. Firstly, our model selects important features and then builds a model utilising only those features. This phase reduces variance and over-fitting, hence improving the model’s generalisation ability, as evidenced by improved performance. Furthermore, the suggested stacking model takes advantage of numerous heterogeneous classifiers and solves the drawbacks of single or homogeneous classifiers.
3.4. Model Interpretability
Machine learning interpretability is crucial, especially in the context of healthcare decision-making. In this subsection, we provide explanations for the stacking model in further detail and how predictions are formed at the individual observation level. We divided the XAI application into two parts. Firstly, we used permutation importance to explore the features in the stacking model. We then used LIME [39] to explain the patient readmission risk for specific patients and interpret the reasons for risk.
3.4.1. Feature Importance
The concepts of permutation importance are discussed in Section 2.6, and the result of permutation importance for the stacking model is shown in Figure 7. On average, the feature with the highest importance was the number of inpatient visits associated with an error increase of 0.0353 after permutation. This was the strongest predictor of readmission. The primary diagnosis was next, followed by the Discharged/transfer to home with home health service, and the number of emergencies was also revealed to be a significant effect.
3.4.2. LIME
LIME was applied to the models created and how predictions are made at the individual observation level. Figure 8 shows the composition of individualised predictions for two patients. This figure is divided into three parts: the anticipated probability of readmission, the nature of the impact on the variables, and the values of the observation whose outcome is being explained. The model took into account all 18 features and LIME reports on all variables internally. However, the figure was trimmed for visualisation. The first example had been hospitalised once before this stay, and this patient was discharged/transferred to their home with a home health service; the number of lab tests performed during the encounter was 44, and he/she was between the ages of 70 and 80. The model predicted a 65% chance of 30-day readmission. The model assumed that being discharged/transferred to another rehab facility, including hospital rehab units, had a negative impact on the prediction, with a coefficient of 0.14. However, other most important features, such as being discharged to home and the number of emergencies, have positive impacts on the outcome of readmission. Conversely, the second example was discharged to home and was between the ages of 70 and 80, but this patient did not have any prior hospitalisation. The model suggested there is a 59% chance that this patient is non-readmission, and the most influential feature to readmission was the number of inpatients.
4. Discussion
Hospital readmissions increase healthcare expenses and have a negative impact on hospitals’ reputations. As a result, individuals who are at high risk of readmission should be identified at the point of discharge. The prediction of readmission is not only to decrease expenditures on the patients but also to improve care to lower the probability of their readmission. Furthermore, the effect of risk variables allowed for the development of models that could be used to predict readmission and explain the components of risk and their interactions.
This study employed stacking-based machine learning algorithms to predict the probability of readmission in diabetic patients. We addressed the selection of variables for the application of machine learning models. KNN, SVM, DT, RF, AdaBoost, XGBoost, and CatBoost were used to compare the performance with the stacking-based model to predict readmission for diabetic patients. These models performed admirably in terms of accuracy and AUC. Meanwhile, the stacking-based model was the best-performing model, with an AUC of 0.6736 and an accuracy of 68.63% for the test data. In addition to outperforming individual machine learning models in terms of prediction, the stacking model has the ability to self-adaptively select the basic learners [22]. There are many combinations of the base learners. The process of experimenting with different combinations takes time. As a result, we opted to employ tree models in this study. Future studies might test the combination of the base learners using various data. Further, prediction accuracy is generally acknowledged to be critical in readmission prediction. As discussed in the previous subsections, the proposed ensemble technique can achieve a low prediction error. Unlike other machine learning models, the proposed framework is free from some limitations. For example, logistic regression struggles with its constrained of expressiveness (e.g., interactions must be manually added), and interpretation is more challenging since the weights are multiplicative rather than additive. Moreover, the deep learning model is a black box model. While it may estimate any function, understanding its structure provides no information about the nature of the function being approximated, it does not discern which feature is more important. Besides, our proposed model is an explainable machine learning algorithm used widely for the importance of linear and non-linear models.
In practice, a medical professional cannot rely solely on the prediction from the machine learning models without knowing about the components that contribute to it. Therefore, it is critical to explain the factors that contributed to the models for medical practitioners. Permutation importance and LIME were employed as explanatory aids to attain this research goal. We provided explanations for the stacking-based model using permutation importance, and an observation of a subject was passed to LIME. LIME was able to provide extensive explanations for the subject’s readmission prediction.
The interpretable machine learning techniques pointed out that the number of inpatients, the primary diagnosis, discharge/transfer to home with home service, and the number of emergencies were the factors that strongly impacted the risk of 30-day readmission. Specifically, the variable ‘number of inpatient visits’ had the largest impact on admission. Meanwhile, LIME provided insight into the factors that contributed to each instance. It is worth noting that the number of inpatient visits had the most decisive influence on the result of readmission. The high readmission rate for the relatively large number of inpatient visits in our study indicates the need for additional research on the decisions and policies to discharge a patient with a large number of prior readmissions. This explainable AI model would assist healthcare practitioners in identifying patients at high risk of short-term readmission, and the factors that were important deserve further validation in clinical trials.
This study, like many clinical prediction efforts, had several limitations. Firstly, we used the dataset from patients with diabetes. However, it is unknown whether diabetes was the cause of their readmission (e.g., the causes might be the comorbidity of diabetes or other diseases). Further, this retrospective study used data from a single healthcare system. As a result, external validation is required, implying that our model could be applicable in other systems. Lastly, the planned readmissions after discharge were not excluded in our study since there is no such information in the dataset. This work was only the first step towards XAI. The model needs to be tested and validated on different data sets. We will explore other machine learning or deep learning methods to increase prediction performance in the future.
5. Conclusions
Despite the introduction of machine learning models to increase the performance of diabetes readmission prediction, existing models continue to struggle to perform effectively, and there are facing a ‘black-box’ problem. In this study, we proposed a stacking model using an XAI-based framework for predicting 30-day readmission for diabetic patients. We used a feature selection to reduce the dimensionality of the data and find the most important features. We then demonstrated a stacking ensemble approach comprising RF, AdaBoost, XGBoost, CatBoost, and LR. Performance evaluation shows that the proposed model overperformed those of existing studies. The framework presented here can potentially help medical experts and stakeholders understand and visualise the risk factors of hospital readmission. Further, the findings from this study could be useful in medical practice, and stakeholders could receive recommendations from this research to reduce readmission and save public healthcare expenses in the future. In addition, researchers can use the proposed XAI-based framework for any other disease, such as heart disease.
Author Contributions
H.L.: writing, data analysis, and research design; S.U.: research design, writing, conceptualization, and supervision. All authors have read and agreed to the published version of the manuscript.
Funding
This research received no external funding.
Institutional Review Board Statement
Not applicable.
Informed Consent Statement
Not applicable.
Data Availability Statement
This study obtained research data from publicly available sources: https://downloads.hindawi.com/journals/bmri/2014/781670.f1.zip (accessed on 1 August 2022).
Conflicts of Interest
The authors declare no conflict of interest.
References
- Carvalho, D.V.; Pereira, E.M.; Cardoso, J.S. Machine Learning Interpretability: A Survey on Methods and Metrics. Electronics 2019, 8, 832. [Google Scholar] [CrossRef]
- Amann, J.; Blasimme, A.; Vayena, E.; Frey, D.; Madai, V.I. Explainability for artificial intelligence in healthcare: A multidisciplinary perspective. BMC Med. Inform. Decis. Mak. 2020, 20, 310. [Google Scholar] [CrossRef] [PubMed]
- Antoniadi, A.; Du, Y.; Guendouz, Y.; Wei, L.; Mazo, C.; Becker, B.; Mooney, C. Current Challenges and Future Opportunities for XAI in Machine Learning-Based Clinical Decision Support Systems: A Systematic Review. Appl. Sci. 2021, 11, 5088. [Google Scholar] [CrossRef]
- Nusinovici, S.; Tham, Y.C.; Yan, M.Y.C.; Ting, D.S.W.; Li, J.; Sabanayagam, C.; Wong, T.Y.; Cheng, C.-Y. Logistic regression was as good as machine learning for predicting major chronic diseases. J. Clin. Epidemiol. 2020, 122, 56–69. [Google Scholar] [CrossRef]
- Khan, A.; Uddin, S.; Srinivasan, U. Chronic disease prediction using administrative data and graph theory: The case of type 2 diabetes. Expert Syst. Appl. 2019, 136, 230–241. [Google Scholar] [CrossRef]
- Hossain, E.; Uddin, S.; Khan, A. Network analytics and machine learning for predictive risk modelling of cardiovascular disease in patients with type 2 diabetes. Expert Syst. Appl. 2020, 164, 113918. [Google Scholar] [CrossRef]
- Ramírez, J.C.; Herrera, D. Prediction of diabetic patient readmission using machine learning. In Proceedings of the IEEE Colombian Conference on Applications in Computational Intelligence, Barranquilla, Colombia, 5–7 June 2019; Springer: Berlin/Heidelberg, Germany, 2019. [Google Scholar]
- Strack, B.; DeShazo, J.P.; Gennings, C.; Olmo, J.L.; Ventura, S.; Cios, K.J.; Clore, J.N. Impact of HbA1c Measurement on Hospital Readmission Rates: Analysis of 70,000 Clinical Database Patient Records. BioMed Res. Int. 2014, 2014, 781670. [Google Scholar] [CrossRef]
- Considine, J.; Fox, K.; Plunkett, D.; Mecner, M.; O’Reilly, M.; Darzins, P. Factors associated with unplanned readmissions in a major Australian health service. Aust. Health Rev. 2019, 43, 1–9. [Google Scholar] [CrossRef]
- Caughey, G.E.; Pratt, N.; Barratt, J.D.; Shakib, S.; Kemp-Casey, A.; Roughead, L. Understanding 30-day re-admission after hospitalisation of older patients for diabetes: Identifying those at greatest risk. Med. J. Aust. 2017, 206, 170–175. [Google Scholar] [CrossRef]
- Donzé, J.; Lipsitz, S.; Bates, D.W.; Schnipper, J.L. Causes and patterns of readmissions in patients with common comorbidities: Retrospective cohort study. BMJ 2013, 347, f7171. [Google Scholar] [CrossRef] [Green Version]
- Fonarow, G.C.; Konstam, M.A.; Yancy, C.W. The Hospital Readmission Reduction Program Is Associated with Fewer Readmissions, More Deaths: Time to Reconsider; American College of Cardiology Foundation: Washington, DC, USA, 2017. [Google Scholar]
- Ostling, S.; Wyckoff, J.; Ciarkowski, S.L.; Pai, C.-W.; Choe, H.M.; Bahl, V.; Gianchandani, R. The relationship between diabetes mellitus and 30-day readmission rates. Clin. Diabetes Endocrinol. 2017, 3, 3. [Google Scholar] [CrossRef] [PubMed]
- Bhuvan, M.S.; Kumar, A.; Zafar, A.; Kishore, V. Identifying diabetic patients with high risk of readmission. arXiv 2016, arXiv:1602.04257. [Google Scholar]
- Rubin, D.J. Hospital Readmission of Patients with Diabetes. Curr. Diabetes Rep. 2015, 15, 1–9. [Google Scholar] [CrossRef] [PubMed]
- Cui, S.; Wang, D.; Wang, Y.; Yu, P.-W.; Jin, Y. An improved support vector machine-based diabetic readmission prediction. Comput. Methods Programs Biomed. 2018, 166, 123–135. [Google Scholar] [CrossRef]
- Hammoudeh, A.; Al-Naymat, G.; Ghannam, I.; Obied, N. Predicting Hospital Readmission among Diabetics using Deep Learning. Procedia Comput. Sci. 2018, 141, 484–489. [Google Scholar] [CrossRef]
- Hung, M.; Lauren, E.; Hon, E.; Xu, J.; Ruiz-Negrón, B.; Rosales, M.; Li, W.; Barton, T.; O’Brien, J.; Su, W. Using Machine Learning to Predict 30-Day Hospital Readmissions in Patients with Atrial Fibrillation Undergoing Catheter Ablation. J. Pers. Med. 2020, 10, 82. [Google Scholar] [CrossRef]
- Arnaud, E.; Elbattah, M.; Gignon, M.; Dequen, G. Deep Learning to Predict Hospitalization at Triage: Integration of Structured Data and Unstructured Text. In Proceedings of the 2020 IEEE International Conference on Big Data (Big Data), Atlanta, GA, USA, 10–13 December 2020; pp. 4836–4841. [Google Scholar] [CrossRef]
- Breiman, L. Bagging predictors. Mach. Learn. 1996, 24, 123–140. [Google Scholar] [CrossRef]
- Freund, Y.; Schapire, R.E. Experiments with a new boosting algorithm. In Proceedings of the ICML’96, Bari, Italy, 3–6 July 1996. [Google Scholar]
- Wolpert, D.H. Stacked generalisation. Neural Netw. 1992, 5, 241–259. [Google Scholar] [CrossRef]
- Radovanović, S.; Delibašić, B.; Jovanović, M.; Vukićević, M.; Suknović, M. Framework for integration of domain knowledge into logistic regression. In Proceedings of the WIMS’18: 8th International Conference on Web Intelligence, Mining and Semantics, Novi Sad, Serbia, 25–27 June 2018; Volume 24. [Google Scholar] [CrossRef]
- Yu, K.; Xie, X. Predicting Hospital Readmission: A Joint Ensemble-Learning Model. IEEE J. Biomed. Health Inform. 2019, 24, 447–456. [Google Scholar] [CrossRef]
- Alahmar, A.; Mohammed, E.; Benlamri, R. Application of data mining techniques to predict the length of stay of hospitalised patients with diabetes. In Proceedings of the 2018 4th International Conference on Big Data Innovations and Applications (Innovate-Data), Barcelona, Spain, 6–8 August 2018. [Google Scholar]
- Breunig, M.M.; Kriegel, H.-P.; Ng, R.T.; Sander, J. LOF: Identifying density-based local outliers. In Proceedings of the 2000 ACM SIGMOD International Conference on Management of Data, Dallas, TX, USA, 15–18 May 2000. [Google Scholar]
- Centers for Disease Control and Prevention. International Classification of Diseases, Ninth Revision, Clinical Modification (ICD-9-CM). 2015. Available online: https://www.cdc.gov/nchs/icd/icd9cm.htm (accessed on 19 September 2021).
- Khushi, M.; Shaukat, K.; Alam, T.M.; Hameed, I.A.; Uddin, S.; Luo, S.; Yang, X.; Reyes, M.C. A Comparative Performance Analysis of Data Resampling Methods on Imbalance Medical Data. IEEE Access 2021, 9, 109960–109975. [Google Scholar] [CrossRef]
- Artetxe, A.; Beristain, A.; Graña, M. Predictive models for hospital readmission risk: A systematic review of methods. Comput. Methods Programs Biomed. 2018, 164, 49–64. [Google Scholar] [CrossRef] [PubMed]
- Prusa, J.; Khoshgoftaar, T.M.; Dittman, D.J.; Napolitano, A. Using Random Undersampling to Alleviate Class Imbalance on Tweet Sentiment Data. In Proceedings of the 2015 IEEE International Conference on Information Reuse and Integration, San Francisco, CA, USA, 13–15 August 2015. [Google Scholar]
- Chandrashekar, G.; Sahin, F. A survey on feature selection methods. Comput. Electr. Eng. 2014, 40, 16–28. [Google Scholar] [CrossRef]
- Pedregosa, F.; Varoquaux, G.; Gramfort, A.; Michel, V.; Thirion, B.; Grisel, O.; Blondel, M.; Prettenhofer, P.; Weiss, R.; Dubourg, V.; et al. Scikit-learn: Machine learning in Python. J. Mach. Learn. Res. 2011, 12, 2825–2830. [Google Scholar]
- Cortes, C.; Vapnik, V. Support-vector networks. Mach. Learn. 1995, 20, 273–297. [Google Scholar] [CrossRef]
- Quinlan, J.R. Induction of Decision Trees. Mach. Learn. 1986, 1, 81–106. [Google Scholar] [CrossRef]
- Breiman, L. Random Forests. Mach. Learn. 2001, 45, 5–32. [Google Scholar] [CrossRef]
- Chen, T.; Guestrin, C. Xgboost: A scalable tree boosting system. In Proceedings of the 22nd ACM SIGKDD International Conference on Knowledge Discovery and Data Mining, San Francisco, CA, USA, 13–17 August 2016. [Google Scholar]
- Dorogush, A.V.; Ershov, V.; Gulin, A. CatBoost: Gradient boosting with categorical features support. arXiv 2018, arXiv:1810.11363. [Google Scholar]
- Altmann, A.; Toloşi, L.; Sander, O.; Lengauer, T. Permutation importance: A corrected feature importance measure. Bioinformatics 2010, 26, 1340–1347. [Google Scholar] [CrossRef]
- Ribeiro, M.T.; Singh, S.; Guestrin, C. “Why should i trust you?” Explaining the predictions of any classifier. In Proceedings of the 22nd ACM SIGKDD International Conference on Knowledge Discovery and Data Mining, San Francisco, CA, USA, 13–17 August 2016. [Google Scholar]
- Kohavi, R. A study of cross-validation and bootstrap for accuracy estimation and model selection. In Proceedings of the IJCAI-95, Montreal, Canada, 20–25 August 1995. [Google Scholar]
- Hanley, J.A.; McNeil, B.J. The meaning and use of the area under a receiver operating characteristic (ROC) curve. Radiology 1982, 143, 29–36. [Google Scholar] [CrossRef]
- Hempstalk, K.; Mordaunt, D. Improving 30-day readmission risk predictions using machine learning. In Proceedings of the Health Informatics New Zealand (HiNZ) Conference, Auckland, New Zealand, 31 October 2016. [Google Scholar]
- Alloghani, M.; Aljaaf, A.; Hussain, A.; Baker, T.; Mustafina, J.; Al-Jumeily, D.; Khalaf, M. Implementation of machine learning algorithms to create diabetic patient re-admission profiles. BMC Med. Inform. Decis. Mak. 2019, 19, 253. [Google Scholar] [CrossRef]
- Shang, Y.; Jiang, K.; Wang, L.; Zhang, Z.; Zhou, S.; Liu, Y.; Dong, J.; Wu, H. The 30-days hospital readmission risk in diabetic patients: Predictive modeling with machine learning classifiers. BMC Med. Inform. Decis. Mak. 2021, 21, 57. [Google Scholar] [CrossRef] [PubMed]
Figure 1.
Workflow of Explainable AI-based framework.

Figure 2.
Structure for the stacking-based model.

Figure 3.
Workflow of decision-making of the Explainable AI.

Figure 4.
The processes of 5-fold cross-validation.

Figure 5.
Receiver operating characteristic curve.

Figure 6.
Confusion matrix for stacking model.

Figure 7.
Permutation importance for the stacking model.

Figure 8.
LIME explanation for patients. dis_id_22, dis_id_2, and dis_id_1 stand for Discharged/transferred to another rehab fac, including rehab units of a hospital, Discharged/transferred to another short-term hospital, and Discharged to home, respectively. num_emergency stands for the number of emergencies, diag_1 stands for the primary diagnosis (coded as the first three digits of ICD9), num_dianoses stand for the number of diagnoses, input stands for the number of inpatients, time_in_hosp stand for the time in hospital and num_medicat stands for the number of medications. The right-hand side of the figures shows the weights assigned to each feature. The colours and directions of each weight’s bars indicate which class they contributed to the prediction.


Table 1.
ICD-9-CM mapping.
| Diagnosis Code | Diseases |
|---|---|
| [140, 240) | Neoplasms |
| 250.x | Diabetes |
| [390, 460) and 785 | Circulatory |
| [460, 520) and 786 | Respiratory |
| [520, 580) and 787 | Digestive |
| [800, 1000) | Injury |
| [700, 740) | Musculoskeletal |
| [500, 630) and 788 | Genitourinary |
| ‘V’, ‘E’ and others | Other diseases |
Table 2.
Performance metrics of the models for training.
| Model | Accuracy (%) | Standard Deviation |
|---|---|---|
| KNN | 53.42 | 0.0114 |
| SVM | 57.61 | 0.0135 |
| DT | 54.17 | 0.0119 |
| RF | 60.35 | 0.0114 |
| AdaBoost | 61.18 | 0.0122 |
| XGBoost | 61.49 | 0.0116 |
| CatBoost | 61.53 | 0.0104 |
Table 3.
Performance metrics of models for testing.
| Model | AUC | Precision | F1-Score | Accuracy (%) |
|---|---|---|---|---|
| KNN | 0.5584 | 0.8164 | 0.6658 | 59.00 |
| SVM | 0.6358 | 0.8321 | 0.7341 | 67.79 |
| DT | 0.6624 | 0.8423 | 0.7117 | 64.70 |
| RF | 0.6690 | 0.8448 | 0.6959 | 62.69 |
| AdaBoost | 0.6639 | 0.8410 | 0.7226 | 66.13 |
| XGBoost | 0.6542 | 0.8398 | 0.7196 | 65.75 |
| CatBoost | 0.6660 | 0.8425 | 0.6977 | 62.96 |
| Stacking | 0.6736 | 0.8542 | 0.7434 | 68.63 |
Table 4.
Comparison of this study to other similar studies in the current literature using the same dataset.
Table 4.
Comparison of this study to other similar studies in the current literature using the same dataset.
| Study | Best Performances | Comments |
|---|---|---|
| Hempstalk and Mordaunt [42] | Logistic Regression with AUC: 0.670 (10-fold training result) | This study developed classic machine learning models to improve 30-day readmission risk predictions with no explainability involved. In addition, they only provided training performance (i.e., no test AUC provided). |
| Alloghani et al. [43] | Naïve Bayes with AUC: 0.640 | This study focused on recognising patterns and combinations of risk factors. |
| Shang et al. [44] | Random Forest with AUC: 0.64 (over-sampling) and AUC: 0.661 (down-sampling) | It used different machine learning classifiers to predict the 30-day readmission, and the random forest model achieved the best performance. No further analysis for features importance etc. |
| Ramírez and Herrera [7] | Multilayer perceptron (MLP) with AUC 0.6548. | This study heavy relied on the data preprocessing methods. Such as the reduction of several variables’ domains. Overfitting might occur. We only consider the result from the second best-performed model, which is MLP. |
| This study | Stacking model with AUC: 0.6736 | This study can assess the risk of 30-day readmission of diabetic patients with explainable AI techniques. |
Publisher’s Note: MDPI stays neutral with regard to jurisdictional claims in published maps and institutional affiliations. |
© 2022 by the authors. Licensee MDPI, Basel, Switzerland. This article is an open access article distributed under the terms and conditions of the Creative Commons Attribution (CC BY) license (https://creativecommons.org/licenses/by/4.0/).
Share and Cite
MDPI and ACS Style
Lu, H.; Uddin, S. Explainable Stacking-Based Model for Predicting Hospital Readmission for Diabetic Patients. Information 2022, 13, 436. https://0-doi-org.brum.beds.ac.uk/10.3390/info13090436
AMA Style
Lu H, Uddin S. Explainable Stacking-Based Model for Predicting Hospital Readmission for Diabetic Patients. Information. 2022; 13(9):436. https://0-doi-org.brum.beds.ac.uk/10.3390/info13090436
Chicago/Turabian StyleLu, Haohui, and Shahadat Uddin. 2022. "Explainable Stacking-Based Model for Predicting Hospital Readmission for Diabetic Patients" Information 13, no. 9: 436. https://0-doi-org.brum.beds.ac.uk/10.3390/info13090436
Note that from the first issue of 2016, this journal uses article numbers instead of page numbers. See further details here.