
A Comparison of Undersampling, Oversampling, and SMOTE Methods for Dealing with Imbalanced Classification in Educational Data Mining


Abstract
:1. Introduction
2. Literature Review
2.1. Class Imbalance as a Threat to EDM
2.2. Addressing Class Imbalance with ROS, RUS, and SMOTE-NC + RUS Hybrid
3. Present Study
4. Methods
4.1. Dataset and Data Preprocessing
4.2. Imbalance Learning Techniques
4.3. Classification Model
5. Results
5.1. Resampling Results
5.2. Algorithm Tuning and Classification Results
6. Discussion and Conclusions
Author Contributions
Funding
Institutional Review Board Statement
Informed Consent Statement
Data Availability Statement
Acknowledgments
Conflicts of Interest
Abbreviations
| EDM | Educational data mining |
| ROS | Random oversampling |
| ROSE | Random oversampling example |
| RUS | Random undersampling |
| SMOTE-NC | Synthetic minority oversampling technique for nominal and continuous |
| ENN | Edited Nearest neighbor |
| ROC-AUC | Receiver operating characteristic-area under curve |
| ROSE | Random oversampling example |
Appendix A. List of Utilized Variables
| Variable Type | Variable Name (Variable Code) |
| Continuous | Students’ socio-economic status composite score (X1SES) |
| Students’ mathematics self-efficacy (X1MTHEFF) | |
| Students’ interest in fall 2009 math course (X1MTHINT) | |
| Students’ perception of science utility (X1SCIUTI) | |
| Students’ science self-efficacy (X1SCIEFF) | |
| Students’ interest in fall 2009 math course (X1SCIINT) | |
| Students’ sense of school belonging (X1SCHOOLBEL) | |
| Students’ school engagement (X1SCHOOLENG) | |
| Scale of school climate assessment (X1SCHOOLCLI) | |
| Scale of counselor’s perceptions of teacher’s expectations (X1COUPERTEA) | |
| Scale of counselor’s perceptions of counselor’s expectations (X1COUPERCOU) | |
| Scale of counselor’s perceptions of principal’s expectations (X1COUPERPRI) | |
| Students’ GPA in ninth grade (X3TGPA9TH) | |
| Categorical | Hours spent on homework/studying on typical school day (S1HROTHHOMWK) |
| Mother’s/female guardian’s highest level of education (X1MOMEDU) | |
| Father’s/male guardian’s highest level of education (X1DADEDU) | |
| How far in school 9th grader thinks he/she will get (X1STUEDEXPCT) | |
| How far in school parent thinks 9th grader will get (X1PAREDEXPCT) | |
| How often 9th grader goes to class without his/her homework done (S1NOHWDN) | |
| How often 9th grader goes to class without pencil or paper (S1NOPAPER) | |
| How often 9th grader goes to class without books (S1NOBOOKS) | |
| How often 9th grader goes to class late (S1LATE) | |
| 9th grader thinks studying in school rarely pays off later with a good job (S1PAYOFF) | |
| 9th grader thinks even if he/she studies, he/she will not get into college (S1GETINTOCLG) | |
| 9th grader thinks even if he/she studies, family cannot afford college (S1AFFORD) | |
| 9th grader thinks working is more important for him/her than college (S1WORKING) | |
| 9th grader’s closest friend gets good grades (S1FRNDGRADES) | |
| 9th grader’s closest friend is interested in school (S1FRNDSCHOOL) | |
| 9th grader’s closest friend attends classes regularly (S1FRNDCLASS) | |
| 9th grader’s closest friend plans to go to college (S1FRNDCLG) | |
| Hours spent on math homework/studying on typical school day (S1HRMHOMEWK) | |
| Hours spent on science homework/studying on typical school day (S1HRSHOMEWK) | |
| How sure 9th grader is that he/she will graduate from high school (S1SUREHSGRAD) | |
| How often parent contacted by school about problem behavior (P1BEHAVE) | |
| How often parent contacted by school about poor attendance (P1ATTEND) | |
| How often parent contacted by school about poor performance (P1PERFORM) | |
| Ever dropped out of high school in 2016 (X4EVERDROP) | |
| Post-secondary enrollment status in February 2016 (X4PSENRSTLV) |
References
- Jokhan, A.; Sharma, B.; Singh, S. Early warning system as a predictor for student performance in higher education blended courses. Stud. High. Educ. 2019, 44, 1900–1911. [Google Scholar] [CrossRef]
- Chen, G.; Rolim, V.; Mello, R.F.; Gašević, D. Let’s shine together! A comparative study between learning analytics and educational data mining. In Proceedings of the tenth International Conference on Learning Analytics & Knowledge, Frankfurt, Germany, 23–27 March 2020; pp. 544–553. [Google Scholar]
- Bulut, O.; Gorgun, G.; Yildirim-Erbasli, S.N.; Wongvorachan, T.; Daniels, L.M.; Gao, Y.; Lai, K.W.; Shin, J. Standing on the shoulders of giants: Online formative assessments as the foundation for predictive learning analytics models. Br. J. Educ. Technol. 2022. [CrossRef]
- Ma, Y.; He, H. Imbalanced Learning: Foundations, Algorithms, and Applications; John Wiley & Sons: Hoboken, NJ, USA, 2013. [Google Scholar]
- Kaur, P.; Gosain, A. Comparing the behavior of oversampling and undersampling approach of class imbalance learning by combining class imbalance problem with noise. In ICT Based Innovations; Series Title: Advances in Intelligent Systems and Computing; Saini, A.K., Nayak, A.K., Vyas, R.K., Eds.; Springer: Singapore, 2018; Volume 653, pp. 23–30. [Google Scholar] [CrossRef]
- Barros, T.M.; SouzaNeto, P.A.; Silva, I.; Guedes, L.A. Predictive models for imbalanced data: A school dropout perspective. Educ. Sci. 2019, 9, 275. [Google Scholar] [CrossRef] [Green Version]
- Guo, H.; Li, Y.; Shang, J.; Gu, M.; Huang, Y.; Gong, B. Learning from class-imbalanced data: Review of methods and applications. Expert Syst. Appl. 2017, 73, 220–239. [Google Scholar] [CrossRef]
- Márquez-Vera, C.; Cano, A.; Romero, C.; Ventura, S. Predicting student failure at school using genetic programming and different data mining approaches with high dimensional and imbalanced data. Appl. Intell. 2013, 38, 315–330. [Google Scholar] [CrossRef]
- Hassan, H.; Ahmad, N.B.; Anuar, S. Improved students’ performance prediction for multi-class imbalanced problems using hybrid and ensemble approach in educational data mining. J. Phys. Conf. Ser. 2020, 1529, 052041. [Google Scholar] [CrossRef]
- Van Hulse, J.; Khoshgoftaar, T.M.; Napolitano, A. An empirical comparison of repetitive undersampling techniques. In Proceedings of the 2009 IEEE International Conference on Information Reuse & Integration, IEEE, Las Vegas, NA, USA, 10–12 August 2009; pp. 29–34. [Google Scholar] [CrossRef]
- Kovács, G. An empirical comparison and evaluation of minority oversampling techniques on a large number of imbalanced datasets. Appl. Soft Comput. 2019, 83, 105662. [Google Scholar] [CrossRef]
- Guy-Evans, O. Bronfenbrenner’s Ecological Systems Theory. 2020. Available online: https://www.simplypsychology.org/Bronfenbrenner.html (accessed on 3 January 2023).
- Nicoletti, M.d.C. Revisiting the Tinto’s Theoretical Dropout Model. High. Educ. Stud. 2019, 9, 52–64. [Google Scholar] [CrossRef]
- Slim, A.; Hush, D.; Ojah, T.; Babbitt, T. Predicting Student Enrollment Based on Student and College Characteristics. In Proceedings of the International Conference on Educational Data Mining (EDM), Raleigh, NC, USA, 16–20 July 2018. [Google Scholar]
- Japkowicz, N.; Stephen, S. The class imbalance problem: A systematic study. Intell. Data Anal. 2002, 6, 429–449. [Google Scholar] [CrossRef]
- Guo, B.; Zhang, R.; Xu, G.; Shi, C.; Yang, L. Predicting students performance in educational data mining. In Proceedings of the 2015 international symposium on educational technology (ISET), Wuhan, China, 27–29 July 2015; IEEE: Piscataway, NJ, USA, 2015; pp. 125–128. [Google Scholar]
- Johnson, J.M.; Khoshgoftaar, T.M. Survey on deep learning with class imbalance. J. Big Data 2019, 6, 1–54. [Google Scholar] [CrossRef] [Green Version]
- Rashu, R.I.; Haq, N.; Rahman, R.M. Data mining approaches to predict final grade by overcoming class imbalance problem. In Proceedings of the 2014 17th International Conference on Computer and Information Technology (ICCIT), Dhaka, Bangladesh, 22–23 December 2014; IEEE: Piscataway, NJ, USA, 2014; pp. 14–19. [Google Scholar]
- Sun, Y.; Li, Z.; Li, X.; Zhang, J. Classifier selection and ensemble model for multi-class imbalance learning in education grants prediction. Appl. Artif. Intell. 2021, 35, 290–303. [Google Scholar] [CrossRef]
- Lema, G. Imbalanced-learn: A python toolbox to tackle the curse of imbalanced datasets in machine learning. J. Mach. Learn. Res. 2017, 18, 1–5. [Google Scholar]
- Patel, H.; Singh Rajput, D.; Thippa Reddy, G.; Iwendi, C.; Kashif Bashir, A.; Jo, O. A review on classification of imbalanced data for wireless sensor networks. Int. J. Distrib. Sens. Netw. 2020, 16. [Google Scholar] [CrossRef]
- Cieslak, D.A.; Chawla, N.V.; Striegel, A. Combating imbalance in network intrusion datasets. In Proceedings of the GrC, Atlanta, GA, USA, 10–12 May 2006; pp. 732–737. [Google Scholar]
- Kovács, G. smote-variants: A Python Implementation of 85 Minority Oversampling Techniques. Neurocomputing 2019, 366, 352–354. [Google Scholar] [CrossRef]
- Wilson, D.L. Asymptotic properties of nearest neighbor rules using edited data. IEEE Trans. Syst. Man Cybern. 1972, SMC-2, 408–421. [Google Scholar] [CrossRef] [Green Version]
- Gazzah, S.; Amara, N.E.B. New oversampling approaches based on polynomial fitting for imbalanced data sets. In Proceedings of the 2008 the Eighth Iapr International Workshop on Document Analysis Systems, Nara, Japan, 16–19 September 2008; IEEE: Piscataway, NJ, USA, 2008; pp. 677–684. [Google Scholar]
- Lin, W.C.; Tsai, C.F.; Hu, Y.H.; Jhang, J.S. Clustering-based undersampling in class-imbalanced data. Inf. Sci. 2017, 409–410, 17–26. [Google Scholar] [CrossRef]
- Pristyanto, Y.; Pratama, I.; Nugraha, A.F. Data level approach for imbalanced class handling on educational data mining multiclass classification. In Proceedings of the 2018 International Conference on Information and Communications Technology (ICOIACT), Yogyakarta, Indonesia, 6–7 March 2018; IEEE: Piscataway, NJ, USA, 2018; pp. 310–314. [Google Scholar] [CrossRef]
- Menardi, G.; Torelli, N. Training and assessing classification rules with imbalanced data. Data Min. Knowl. Discov. 2014, 28, 92–122. [Google Scholar] [CrossRef]
- Dattagupta, S.J. A Performance Comparison of Oversampling Methods for Data Generation in Imbalanced Learning Tasks. Ph.D. Thesis, Universidade Nova de Lisboa, Lisbon, Portugal, 2018. [Google Scholar]
- Pedregosa, F.; Varoquaux, G.; Gramfort, A.; Michel, V.; Thirion, B.; Grisel, O.; Blondel, M.; Prettenhofer, P.; Weiss, R.; Dubourg, V.; et al. Scikit-learn: Machine Learning in Python. J. Mach. Learn. Res. 2011, 12, 2825–2830. [Google Scholar]
- García-Pedrajas, N.; Pérez-Rodríguez, J.; García-Pedrajas, M.; Ortiz-Boyer, D.; Fyfe, C. Class imbalance methods for translation initiation site recognition in DNA sequences. Knowl.-Based Syst. 2012, 25, 22–34. [Google Scholar] [CrossRef]
- Chawla, N.V.; Bowyer, K.W.; Hall, L.O.; Kegelmeyer, W.P. SMOTE: Synthetic minority oversampling technique. J. Artif. Intell. Res. 2002, 16, 321–357. [Google Scholar] [CrossRef]
- Cheng, K.; Zhang, C.; Yu, H.; Yang, X.; Zou, H.; Gao, S. Grouped SMOTE with noise filtering mechanism for classifying imbalanced data. IEEE Access 2019, 7, 170668–170681. [Google Scholar] [CrossRef]
- National Center for Educational Statistics [NCES]. High School Longitudinal Study of 2009. 2016. Available online: https://nces.ed.gov/surveys/hsls09/ (accessed on 6 January 2023).
- Wickham, H.; Averick, M.; Bryan, J.; Chang, W.; McGowan, L.D.; François, R.; Grolemund, G.; Hayes, A.; Henry, L.; Hester, J.; et al. Welcome to the tidyverse. J. Open Source Softw. 2019, 4, 1686. [Google Scholar] [CrossRef] [Green Version]
- Wickham, H.; Bryan, J. Readxl: Read Excel Files. 2022. Available online: https://readxl.tidyverse.org (accessed on 6 January 2023).
- Cui, B. DataExplorer. 2022. Available online: https://boxuancui.github.io/DataExplorer/ (accessed on 6 January 2023).
- van Buuren, S.; Groothuis-Oudshoorn, K. mice: Multivariate Imputation by Chained Equations in R. J. Stat. Softw. 2011, 45, 1–67. [Google Scholar] [CrossRef] [Green Version]
- Harrell, F.E., Jr.; Dupont, C. Hmisc: Harrell Miscellaneous. 2022. Available online: https://cran.r-project.org/web/packages/Hmisc/index.html (accessed on 6 January 2023).
- Wei, T.; Simko, V. Package ‘Corrplot’: Visualization of a Correlation Matrix , (Version 0.92); 2021. Available online: https://cran.r-project.org/web/packages/corrplot/vignettes/corrplot-intro.html (accessed on 6 January 2023).
- Buuren, S.V. Flexible Imputation of Missing Data, 2nd ed.; Chapman and Hall/CRC Interdisciplinary Statistics Series; CRC Press: Boca Raton, FL, USA; Taylor and Francis Group: Boca Raton, FL, USA, 2018. [Google Scholar]
- Shaik, A.B.; Srinivasan, S. A brief survey on random forest ensembles in classification model. In International Conference on Innovative Computing and Communications; Springer: Berlin/Heidelberg, Germany, 2019; pp. 253–260. [Google Scholar]
- Wyner, A.J.; Olson, M.; Bleich, J.; Mease, D. Explaining the success of adaboost and random forests as interpolating classifiers. J. Mach. Learn. Res. 2017, 18, 1558–1590. [Google Scholar]
- Müller, A.C.; Guido, S. Introduction to Machine Learning with Python: A Guide for Data Scientists; O’Reilly Media, Inc.: Newton, MA, USA, 2016. [Google Scholar]
- Chau, V.T.N.; Phung, N.H. Imbalanced educational data classification: An effective approach with resampling and random forest. In Proceedings of the The 2013 RIVF International Conference on Computing & Communication Technologies-Research, Innovation, and Vision for Future (RIVF), Hanoi, Vietnam, 10–13 November 2013; IEEE: Piscataway, NJ, USA, 2013; pp. 135–140. [Google Scholar]
- Ramaswami, G.; Susnjak, T.; Mathrani, A.; Lim, J.; Garcia, P. Using educational data mining techniques to increase the prediction accuracy of student academic performance. Inf. Learn. Sci. 2019, 120, 451–467. [Google Scholar] [CrossRef]
- Douzas, G.; Bacao, F.; Last, F. Improving imbalanced learning through a heuristic oversampling method based on k-means and SMOTE. Inf. Sci. 2018, 465, 1–20. [Google Scholar] [CrossRef] [Green Version]
- Mohammed, R.; Rawashdeh, J.; Abdullah, M. Machine learning with oversampling and undersampling techniques: Overview study and experimental results. In Proceedings of the 2020 11th International Conference on Information and Communication Systems (ICICS), Irbid, Jordan, 7–9 April 2020; IEEE: Piscataway, NJ, USA, 2020; pp. 243–248. [Google Scholar] [CrossRef]
- Santos, M.S.; Soares, J.P.; Abreu, P.H.; Araujo, H.; Santos, J. Cross-validation for imbalanced datasets: Avoiding overoptimistic and overfitting approaches. IEEE Comput. Intell. Mag. 2018, 13, 59–76. [Google Scholar] [CrossRef]
- Islahulhaq, W.W.; Ratih, I.D. Classification of non-performing financing using logistic regression and synthetic minority oversampling technique-nominal continuous (SMOTE-NC). Int. J. Adv. Soft Comput. Its Appl. 2021, 13, 116–128. [Google Scholar] [CrossRef]
- Kizilcec, R.F.; Lee, H. Algorithmic fairness in education. arXiv 2020, arXiv:2007.05443. [Google Scholar]
- Organisation for Economic Co-operation and Development (OECD). PISA 2018 Results (Volume I): What Students Know and Can Do; OECD: Paris, France, 2018. [Google Scholar]
- Chakravarthy, A.D.; Bonthu, S.; Chen, Z.; Zhu, Q. Predictive models with resampling: A comparative study of machine learning algorithms and their performances on handling imbalanced datasets. In Proceedings of the 2019 18th IEEE International Conference On Machine Learning And Applications (ICMLA), Boca Raton, FL, USA, 16–19 December 2019; IEEE: Piscataway, NJ, USA, 2019; pp. 1492–1495. [Google Scholar] [CrossRef]


| Approach | Operating Principle | Advantages | Disadvantages |
|---|---|---|---|
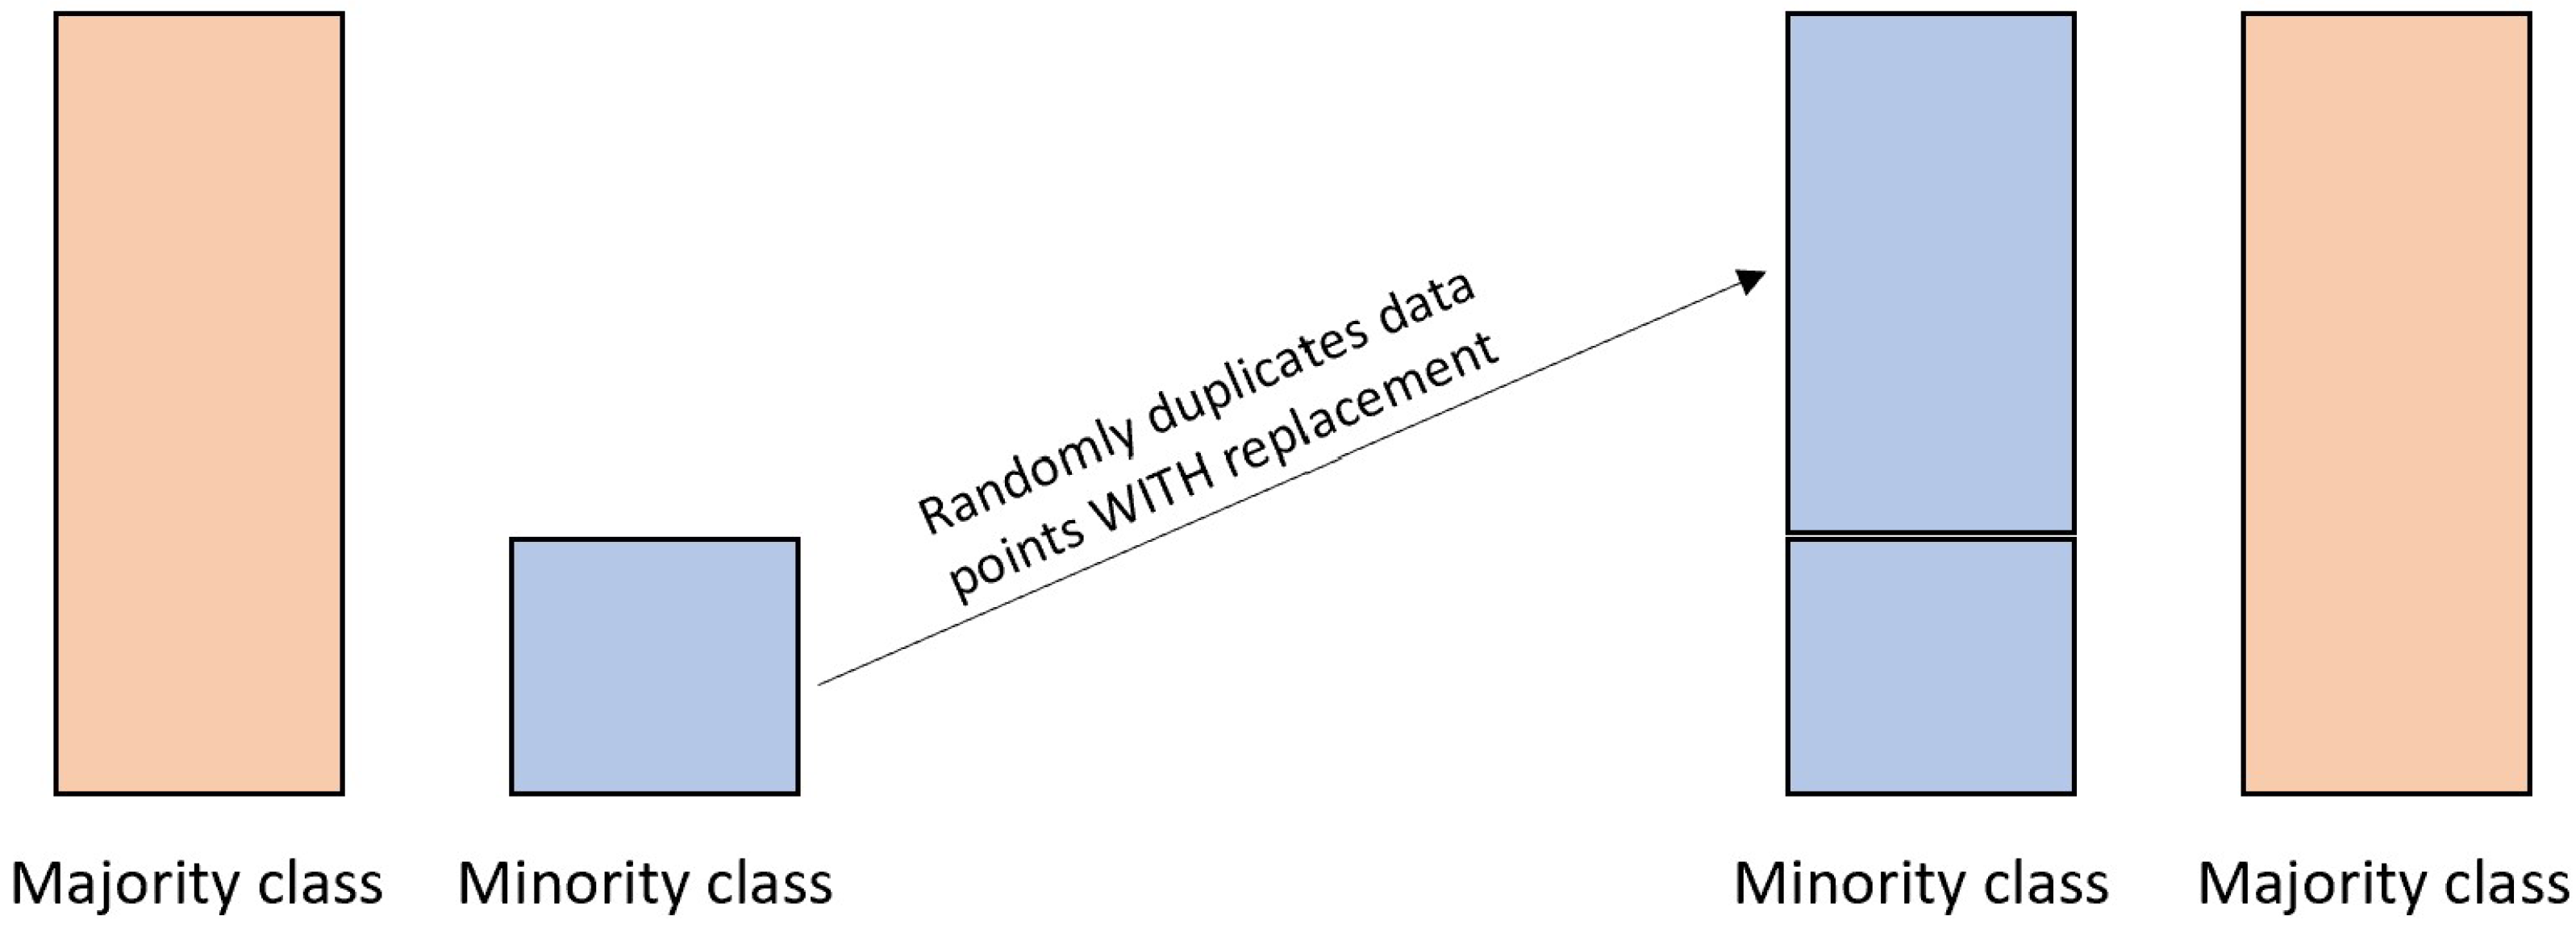
| ROS | Randomly duplicates minority samples with replacement | Provides more replicated minority samples | Increases the likelihood of overfitting by introducing replicated samples Increases training time of the predictive model |
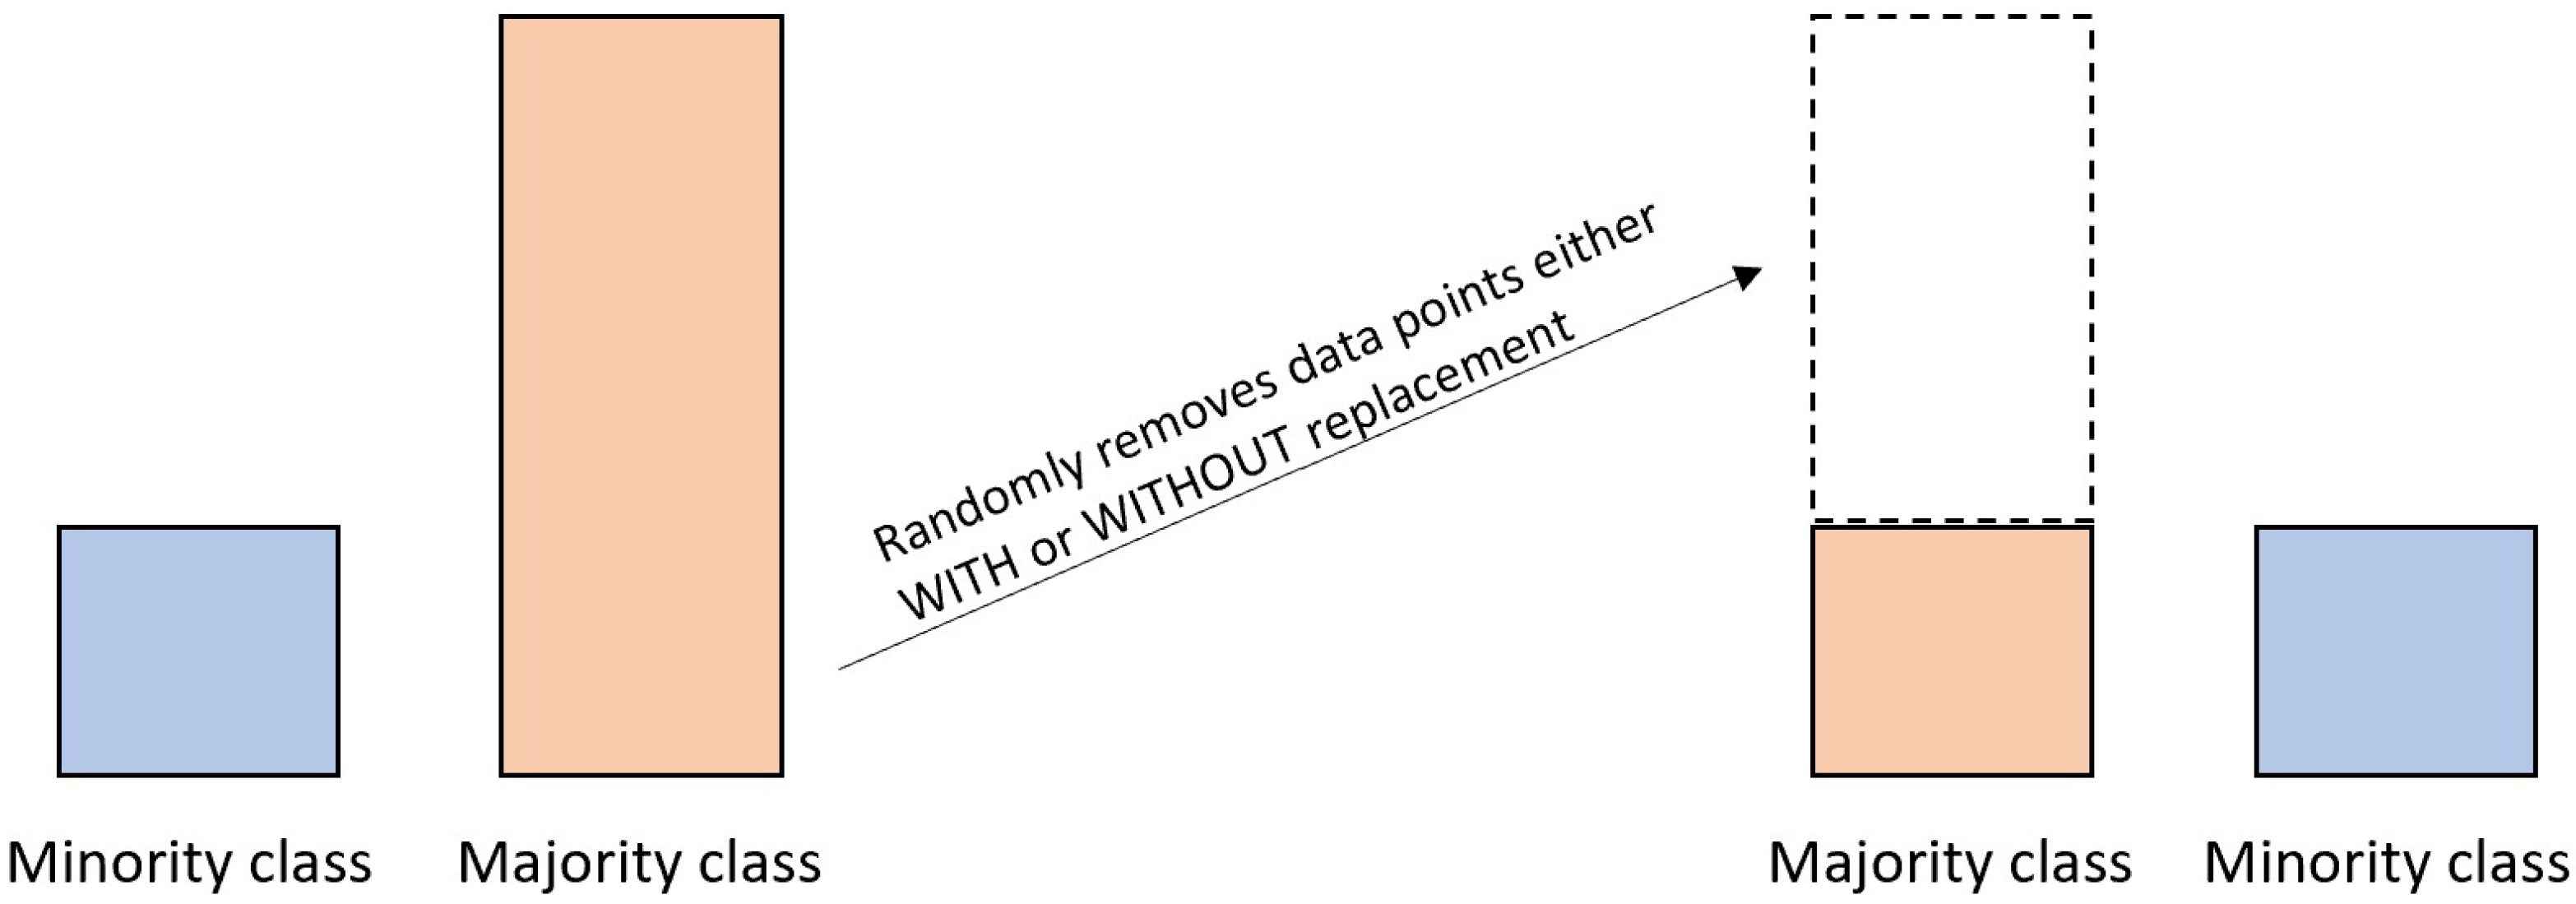
| RUS | Randomly removes majority samples with or without replacement | Reduces excessive majority samples Decreases training time of the predictive model | Potential to exclude helpful information |
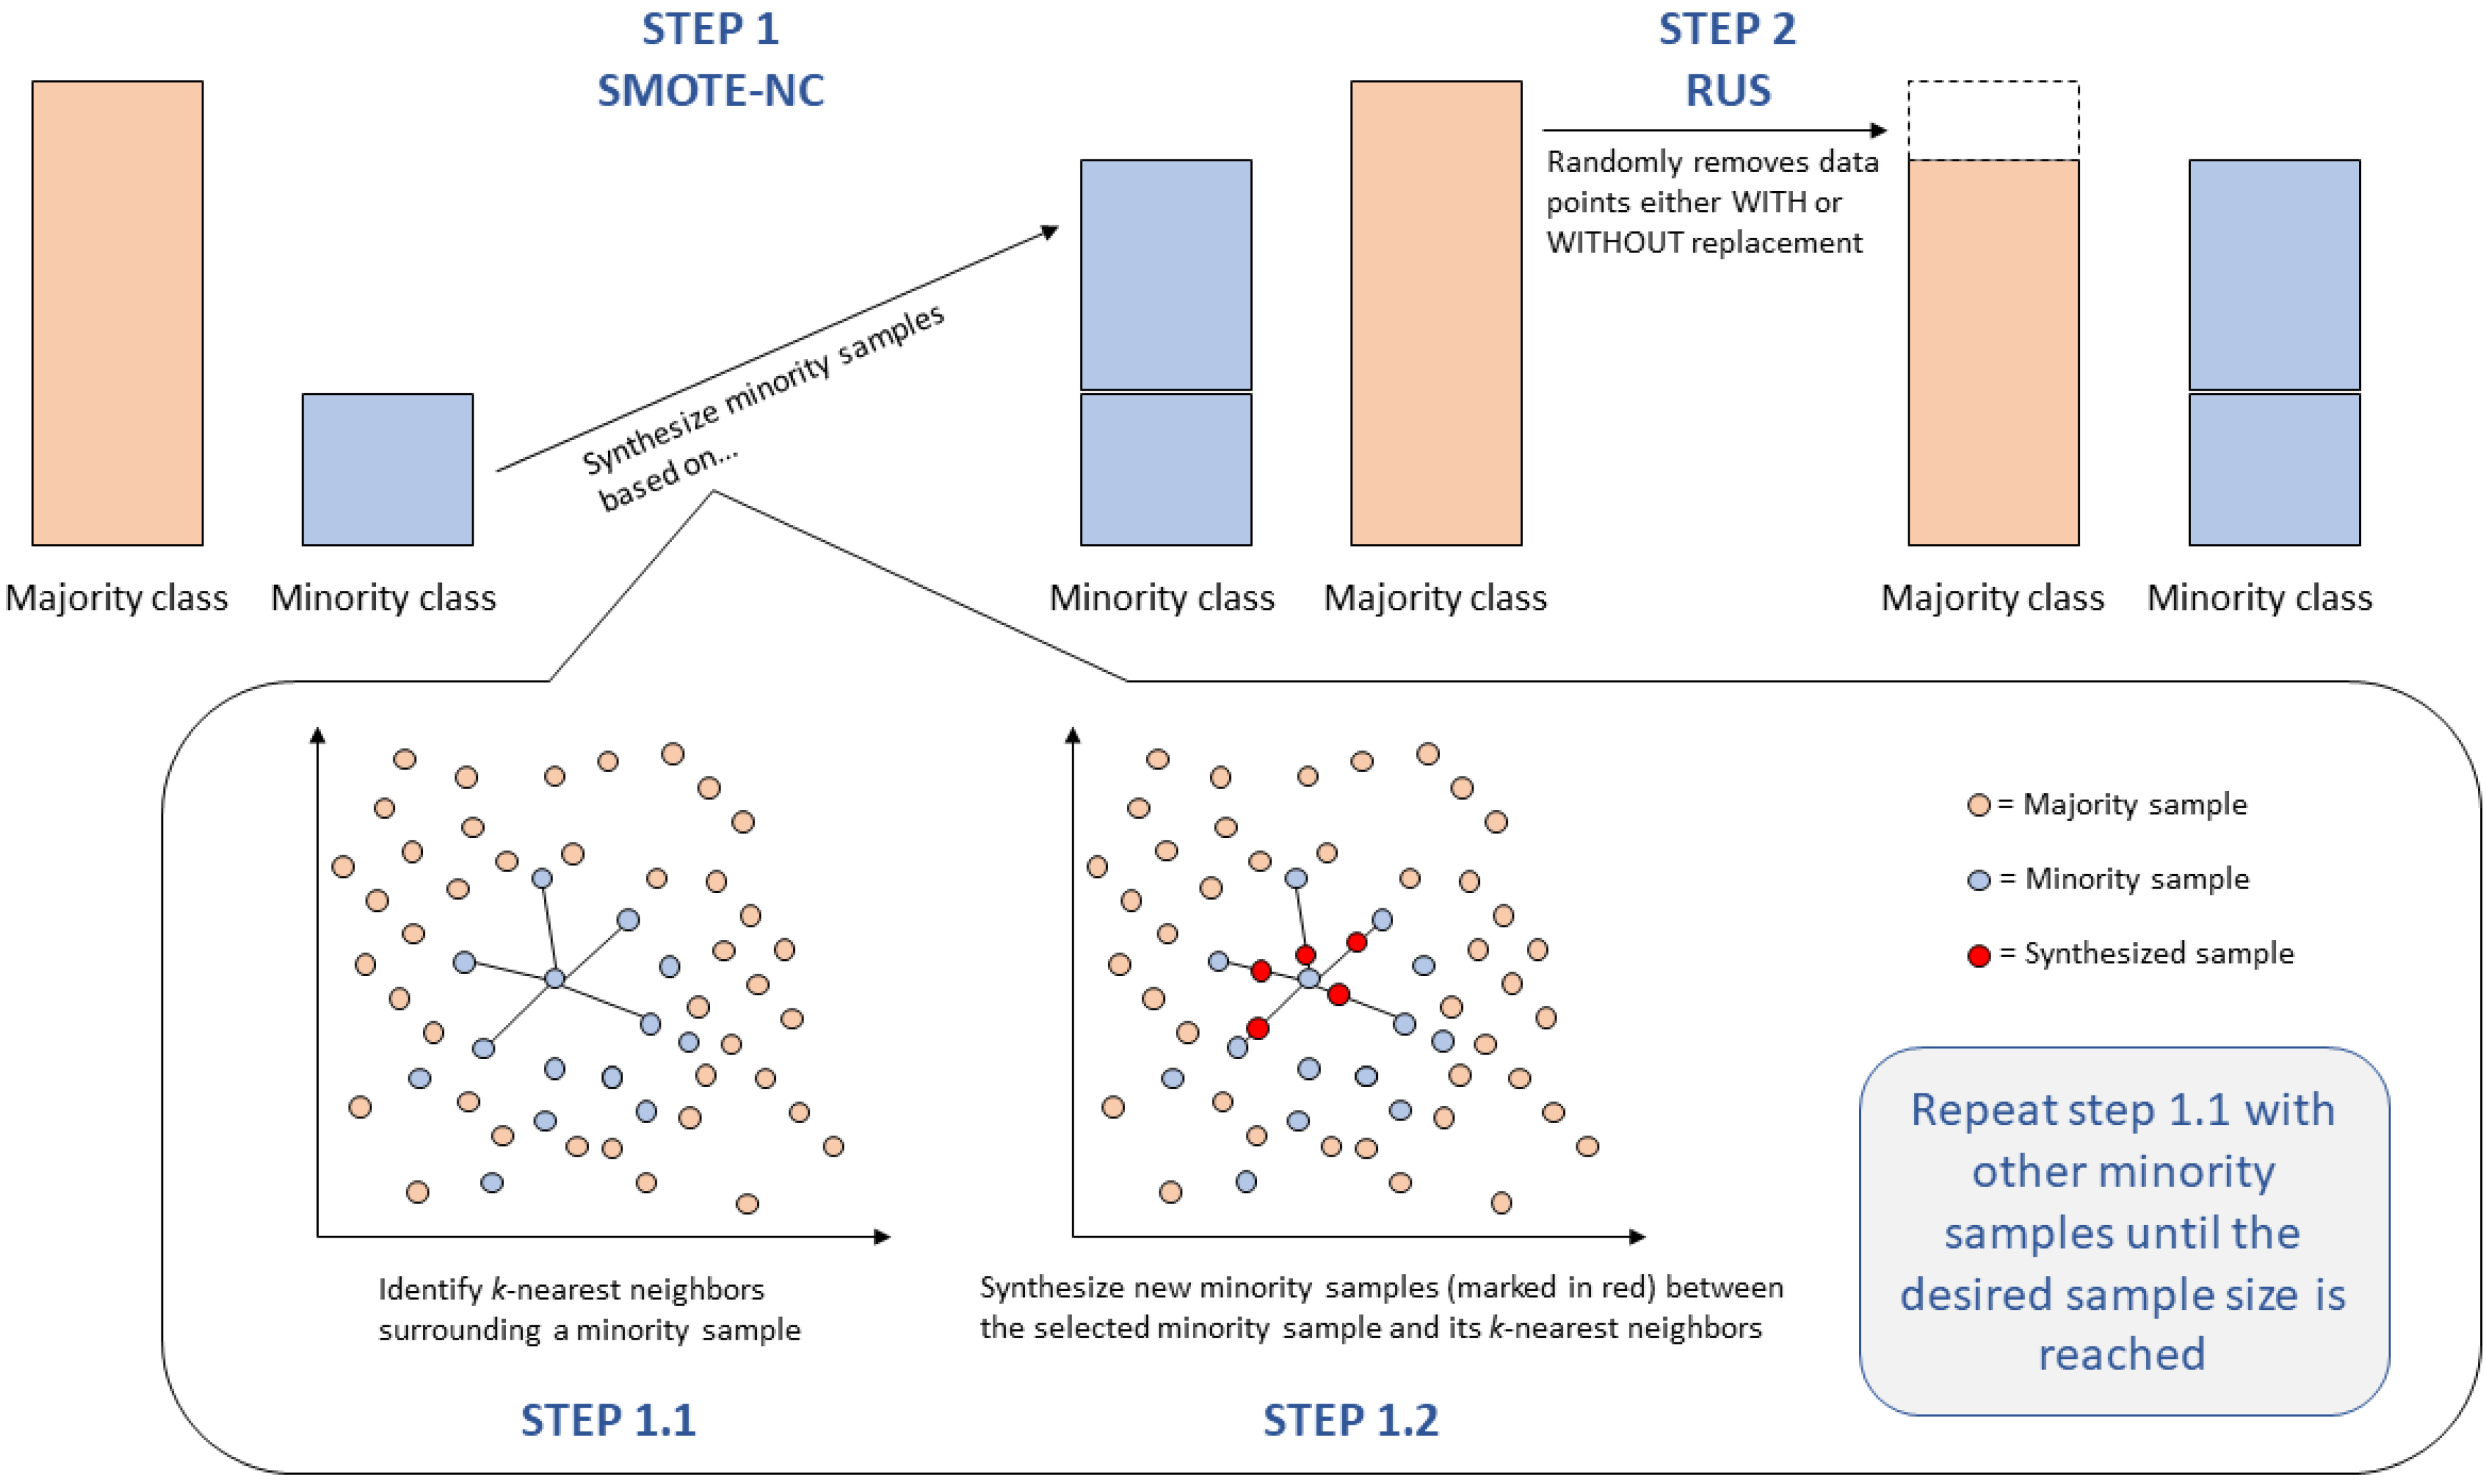
| SMOTE-NC+RUS | Synthesizes minority samples based on nearest neighbors, median of standard deviation, Euclidean distance, and desired ratio of the minority sample Randomly removes majority samples with or without replacement | Provides non-replicated minority samples Can handle categorical variables Less overfitting chance than ROS Decreases training time of the predictive model | Sub-optimal performance with high-dimensional datasets Potential to create noise samples Negligence of local K-neighbor parameter Potential to exclude helpful information |
| Baseline | ROS | RUS | Hybrid (SMOTE-NC + RUS) | |
|---|---|---|---|---|
| Moderate imbalance | 0:4676 1:11,461 | 0:11,461 1:11,461 | 0:4676 1:4676 | 0:9168 1:9168 |
| Extreme imbalance | 0:14,133 1:2004 | 0:14,133 1:14,133 | 0:2004 1:2004 | 0:11,306 1:11,306 |
| No Augmentation | ROS | RUS | Hybrid | |
|---|---|---|---|---|
| Moderately Imbalanced | ‘n_estimators’: 800, ‘max_features’: ‘sqrt’ ‘max_depth’: 180 | ‘n_estimators’: 1000 ‘max_features’: ‘auto’ ‘max_depth’: 140 | ‘n_estimators’: 600 ‘max_features’: ‘auto’ ‘max_depth’: 220 | ‘n_estimators’: 2000 ‘max_features’: ‘sqrt’ ‘max_depth’: 220 |
| Extremely Imbalanced | ‘n_estimators’: 200 ‘max_features’: ‘auto’ ‘max_depth’: 420 | ‘n_estimators’: 600 ‘max_features’: ‘auto’ ‘max_depth’: 220 | ‘n_estimators’: 1000 ‘max_features’: ‘auto’ ‘max_depth’: 140} | ‘n_estimators’: 1200 ‘max_features’: ‘auto’ ‘max_depth’: 260 |
| Performance Metrics | Baseline Mean (SD) | ROS Mean (SD) | RUS Mean (SD) | SMOTE-NC + RUS Mean (SD) | |
|---|---|---|---|---|---|
| Moderately Imbalanced | Accuracy | 0.736 (0.009) | 0.877 (0.006) | 0.705 (0.014) | 0.779 (0.011) |
| Precision | 0.773 (0.006) | 0.926 (0.006) | 0.724 (0.014) | 0.796 (0.013) | |
| Recall | 0.888 (0.007) | 0.819 (0.010) | 0.662 (0.024) | 0.749 (0.018) | |
| ROC-AUC | 0.763 (0.013) | 0.968 (0.003) | 0.763 (0.015) | 0.868 (0.010) | |
| F1 | 0.827 (0.005) | 0.870 (0.006) | 0.692 (0.017) | 0.772 (0.013) | |
| Extremely Imbalanced | Accuracy | 0.887 (0.004) | 0.984 (0.002) | 0.731 (0.021) | 0.905 (0.006) |
| Precision | 0.665 (0.058) | 0.971 (0.003) | 0.736 (0.024) | 0.911 (0.008) | |
| Recall | 0.193 (0.028) | 0.999 (0.001) | 0.721 (0.031) | 0.898 (0.008) | |
| ROC-AUC | 0.801 (0.016) | 0.999 (0.0003) | 0.800 (0.020) | 0.967 (0.002) | |
| F1 | 0.299 (0.038) | 0.985 (0.002) | 0.728 (0.022) | 0.904 (0.006) |
Disclaimer/Publisher’s Note: The statements, opinions and data contained in all publications are solely those of the individual author(s) and contributor(s) and not of MDPI and/or the editor(s). MDPI and/or the editor(s) disclaim responsibility for any injury to people or property resulting from any ideas, methods, instructions or products referred to in the content. |
© 2023 by the authors. Licensee MDPI, Basel, Switzerland. This article is an open access article distributed under the terms and conditions of the Creative Commons Attribution (CC BY) license (https://creativecommons.org/licenses/by/4.0/).
Share and Cite
Wongvorachan, T.; He, S.; Bulut, O. A Comparison of Undersampling, Oversampling, and SMOTE Methods for Dealing with Imbalanced Classification in Educational Data Mining. Information 2023, 14, 54. https://0-doi-org.brum.beds.ac.uk/10.3390/info14010054
Wongvorachan T, He S, Bulut O. A Comparison of Undersampling, Oversampling, and SMOTE Methods for Dealing with Imbalanced Classification in Educational Data Mining. Information. 2023; 14(1):54. https://0-doi-org.brum.beds.ac.uk/10.3390/info14010054
Chicago/Turabian StyleWongvorachan, Tarid, Surina He, and Okan Bulut. 2023. "A Comparison of Undersampling, Oversampling, and SMOTE Methods for Dealing with Imbalanced Classification in Educational Data Mining" Information 14, no. 1: 54. https://0-doi-org.brum.beds.ac.uk/10.3390/info14010054