
Using Natural Language Processing to Analyze Political Party Manifestos from New Zealand †


Computer Science, College of Innovation and Technology, University of Michigan-Flint, Flint, MI 48502, USA
*
Author to whom correspondence should be addressed.
†
This paper is an extended version of our paper published in SBP BRIMS.
Information 2023, 14(3), 152; https://0-doi-org.brum.beds.ac.uk/10.3390/info14030152
Submission received: 20 January 2023
/
Revised: 21 February 2023
/
Accepted: 21 February 2023
/
Published: 1 March 2023
(This article belongs to the Special Issue Advanced Natural Language Processing and Machine Translation)
Abstract
:This study explores how natural language processing (NLP) can supplement content analyses of political documents, particularly the manifestos of political parties. NLP is particularly useful for tasks such as: estimating the similarity between documents, identifying the topics discussed in documents (topic modeling), and sentiment analysis. This study applies each of these techniques to the study of political party manifestos. Document similarity may be used to gain some insight into the way parties change over time and which political parties are successful at bringing attention to their policy agenda. Categorizing text into topics may help objectively categorize and visualize the ideas political parties are discussing. Finally, sentiment analysis has the potential to show each political party’s attitude towards a policy area/topic. This study specifically applies these techniques to the manifestos produced by the political parties of New Zealand, from 1987 to 2017 (a period of significant party system change in New Zealand). It finds that NLP techniques provide valuable insights, although there is a need for significant fine-tuning.
1. Introduction
Text is a common and rich source of data in political science research. However, while there has been a proliferation of studies that use natural language processing (NLP) to analyze political texts, there are still important opportunities to expand the use of NLP, and indeed, some of the best-known and readily available sources of text in the field of political science could benefit from the application of recently developed and powerful NLP techniques. This study applies NLP techniques to one of the richest sources of text in political science: the manifestos of political parties.
Party manifestos present a challenge for NLP applications because they are longer and more complex than many of the documents computer scientists have worked with while developing NLP methods. For example, many NLP methods have been developed on shorter documents, such as product reviews. Often, these documents are labeled and thus are suitable for supervised machine learning. On the other hand, manifestos are easier to work with than many of the other documents analyzed by political scientists (such as political speeches and news media). They contain much less extraneous text (such as ads and procedures) and they are written to express policy ideas more directly.
Party manifestos have been used by political scientists to objectively estimate various types of information produced by political parties, including: their ideological positions, the positions they take on particular policy areas, and the ideas they are trying to promote. Since manifestos can be gathered over many years and across many countries, they also allow researchers to track the behavior of political parties across time and across many countries. Thus, the information gleaned from party manifestos has been used to explore many other political phenomena, including: the relation between parties and voters, the role of parties in legislatures, and the translation of party programs into policy.
NLP has the potential to contribute to the analysis of manifestos in a variety of ways. NLP can be used to estimate: the similarity between documents, the topics or entities discussed in a document/corpus, and the sentiment expressed towards topics/entities. This study applies each of these estimation techniques to the analysis of manifestos. These techniques may help reveal: how party ideology evolves over time, how party positions on specific topics evolve over time, which parties may be most successful in promoting their policy ideas, and how political reforms can influence all of these dynamics. In later research, these techniques might reveal further insights when applied to other political texts, such as legislative speeches and political news media.
This study specifically focuses on the manifestos produced by the political parties of New Zealand, from 1987 to 2017. During this period, New Zealand experienced significant party system change, which provides an opportunity to use a quasi-experimental research design. The study finds that NLP techniques appear promising for the analysis of long political texts, though there remains a need for significant fine-tuning.
If the technologies explored in this paper can be honed and scaled to facilitate the analysis of the political information environment across the world’s democracies, it may be possible to identify beneficial or dangerous features of political discourse. Perhaps, it may also be possible to identify ways to enhance or mitigate these features (e.g., through institutional or media reforms).
1.1. Related Work
Analyses of political texts can be described as having evolved along two paths: one created by political scientists and the other by computer scientists. Political scientists have long analyzed text such as legislative speeches [1], newspapers [2], and party manifestos [3]. In its early stages, the data collection process was driven by hand coding. More recently, it has been enhanced by automated coding performed on machine-readable texts. Much of this automated coding has relied mainly on “bag-of-words” approaches—involving frequencies of words or n-grams [4,5,6].
Computer scientists have also long been interested in text, including political texts. They have developed natural language processing (NLP) methods (such as those described by Jurafsky and Martin [7] and by Manning and Schütze [8]) to perform tasks such as the following: estimating the similarity between documents (often to perform search activities), topic modeling (to detect topics discussed in texts), estimating sentiment (to detect attitudes towards products and ideas), voice recognition, and chat bots that respond to users.
Recently, there has been a rise in political science studies that apply techniques developed by computer scientists. There are now studies in the top political science journals using topic modeling (e.g., [9]), supervised machine learning to categorize texts (e.g., [10]), and sentiment analysis (e.g., [11]). At the same time, there has been a rise in studies of political texts led by computer scientists. These studies, for example, apply cutting-edge algorithms to the detection of ideology (e.g., [12,13,14]) and the detection of misinformation or fake news (e.g., [15,16]).
Thus, political scientists and computer scientists are heading in similar directions, but there is currently space to merge the knowledge of the two fields more directly and purposefully. Perhaps, this space can be partially filled by applying cutting-edge computer science methods to important political science texts (and the questions they were collected to attempt to answer) and then taking measure of the contributions and shortcomings of those methods. In this study, recently developed NLP techniques are applied to the analysis of political party manifestos.
The manifestos have already been analyzed via hand coding. Such an approach has its advantages, but it also has significant disadvantages that NLP may help address. One important limitation, for example, is that the methods of hand coding were designed to be comparable over a wide range of countries and thus, the coding team made the choice to create a set number of topics a priori [17]. Such a decision is difficult or perhaps impossible to change at a later point in time because of the hand-coding resources involved. NLP may be able to provide an important supplement in such cases.
There have been attempts to analyze manifestos with automated coding techniques (e.g., [18]). These are, however, frequency-based approaches not informed by some of the breakthroughs NLP researchers have made available today. This study seeks to apply the products of some these breakthroughs, particularly to the analysis of the manifestos produced by the political parties of New Zealand.
1.2. Case Background
This study focuses on manifestos from New Zealand, first, because the manifestos are written in English, and some NLP techniques were particularly developed for English texts (e.g., lexicon-based sentiment estimators). More importantly, New Zealand provides a quasi-experimental setting in which to explore NLP techniques.
For most of its history, New Zealand’s voters elected their legislators via a single-member-district-plurality (SMDP) system, in which the candidate winning the most votes (not necessarily a majority) wins the district/seat. In the 1990s, however, New Zealand switched to a German-style mixed-member proportional system (MMP) that produces relatively pure proportional results. Since 1996, over half (65 out of 120) of the members of the New Zealand parliament are still elected via SMDP, however, the remaining 55 seats are allocated via compensatory, proportional representation [19]. That is, the remaining seats are awarded to parties according to the percentage of the national vote that they receive, minus the number of seats they win in the single-member districts. Any party that wins at least 5 percent of the vote or that wins at least one seat in the single-member district part of the ballot is entitled to a share of legislative seats roughly proportional to the share of votes they received.
These changes, along with factors such as a long-term trend towards party dealignment [20], led to a significant fragmentation of the party system. In 1993 (the last election under the SMDP system), the two largest parties (Labour and National) garnered over 95 percent of the seats, on slightly less than 70 percent of the vote; while in 1996 (the first election under the MMP system), the two largest parties captured only 67.5 percent of parliamentary seats on 62 percent of the vote. Furthermore, while only two parties won at least 5 percent of the seats in 1993, five parties won over 5 percent of the seats in 1996.
The electoral reforms and changes to the party system likely produced several information effects that may be captured by NLP methods. First, electoral and party systems should affect the number of issue areas considered by the political system. Specifically, more proportional systems with a greater numbers of parties should encourage political competition along a broader range of issue areas [21]. Second, since proportional/multiparty systems also tend to be associated with more parties that are small and have more space to introduce new and sometimes controversial ideas, they should be associated with a broader spectrum of political ideas. That is, proportional/multiparty systems should represent a wider range of positions on a left–right scale and in most other policy dimensions (such as taxation and environmental policy) than do less-proportional/fewer-party systems [22].
Topic modeling, thus, may detect that New Zealand’s political discourse became more diverse under its new MMP system. With document similarity analyses, it may be possible to observe how a party’s ideology evolves over time, as a result of such reforms, and which small parties are more successful in convincing the larger parties to adopt or respond to their agenda. With sentiment analysis, it may be possible to observe how a party’s positions change on specific issues over time, and whether this behavior matches theoretical expectations.
2. Materials and Methods
This section introduces the data used in this study, particularly the manifestos produced by New Zealand’s political parties around the time of a major electoral reform. It also introduces the three NLP techniques used to analyze these manifestos: document similarity, topic modeling, and sentiment analysis.
2.1. Data
A significant advantage of analyzing manifestos is that they are readily accessible via the Manifesto Project Database. This database grew out of the efforts of the Manifesto Research Group (MRG 1979–1989) and the Comparative Manifestos Project (CMP 1989–2009), and it is now currently maintained and expanded by Manifesto Research on Political Representation (MARPOR) [23]. The Manifesto Project Database makes available the manifestos of over 1000 political parties, from over 50 countries, from 1945 to the present. The database also makes available the results of hand-coded content analyses for every manifesto. This hand coding required the support of coders from over 50 countries.
This study particularly analyzes a subset of the manifesto corpus: the political party manifestos produced by New Zealand’s political parties, for the elections that took place between the years 1987 and 2017. New Zealand holds elections every three years, and that amounts to 12 elections, during that period. Roughly 11 parties produced 61 manifestos during that time period. Prior to the electoral reforms (in 1996), only 3 parties were producing manifestos—or researchers only collected manifestos from 3 parties. By 2017, roughly 6 parties were producing manifestos. Some parties were short-lived.
These manifestos were analyzed using the following NLP techniques: estimating the similarity between documents, identifying the topics discussed in documents, and sentiment analysis. Document similarity may help reveal how the ideology of each party changes over time (particularly in relation to one another) and which minor parties are more successful at gaining the attention of the major parties. Topic modeling techniques may detect the topics parties promote and if there were more topics discussed by the party system as a whole, after the electoral reforms. Sentiment analysis techniques may help gauge a party’s position on the topics discovered by topic modeling. The methodology of each of these techniques is briefly discussed in the remainder of this section. Each of these techniques provides valuable insights but also has significant limitations, which are discussed in the final sections.
2.2. Document Similarities
A task to which NLP is frequently applied is the estimation of the similarity between documents (e.g., books, articles, sentences, and even search terms). Once a document is converted to a mathematical object (i.e., a vector) a similarity measurement can be calculated, often using the cosine similarity. The cosine similarity is the cosine of the angle between two vectors, which yields the angular distance between the vectors.
There are multiple ways to turn documents into vectors. One vector type commonly used for this task is the TF-IDF (term-frequency times inverse document frequency) vector. TF-IDF vectors are frequency vectors that adjust the count of each word by the number of documents in which the word occurs [24].
Another commonly used vector type is Word2vec, which accounts for the words around each word—how the neighbors of a word affect the overall meaning of a statement [25]. It learns the meaning of words by processing a large corpus of unlabeled text; it searches for words that tend to be near each other. All words in a corpus are represented by numerical vectors containing scores associated with dimensions of meaning. It can take a significant amount of time to create such vectors, but fortunately, pre-trained representations are available. Word2vec techniques can be applied to entire documents (such as manifestos) and the resultant vectors can then be compared for similarity. This can be achieved using the Doc2vec algorithm, which is an unsupervised learning algorithm that produces vector representations of entire documents (and can also be applied to sentences and paragraphs).
This study relies on BERT (Bidirectional Encoder Representation from Transformers) vector representations. BERT was developed by Google and is considered a state-of-the-art NLP technique [26]. It is trained on unlabeled text including Wikipedia and book corpora. BERT uses transformer architecture (an attention model) to learn embeddings for words. It involves two pre-training steps: Masked Language Modelling (MLM) and Next Sentence Prediction (NSP). The training text is represented via three embeddings: token embeddings, segment embeddings, and position embeddings.
The embeddings used here were created using the BERT base model, made available by the Hugging Face platform. These embeddings for the bert-base-nli-mean-tokens were accessed using the SentenceTransfomer package for Python. This model is a sentence-transformer model that maps sentences and paragraphs to a 768-dimensional dense vector space (hidden size). It also has 12 layers (transformer blocks), 12 attention heads, 110 million parameters. It is particularly useful for tasks such as clustering or semantic search.
2.3. Topic Modeling
Topic modeling can help reveal what policy issues the political parties wish to emphasize. As mentioned, one expectation is that more proportional systems with greater numbers of parties should encourage political competition along a broader range of issue areas. Thus, we should expect that New Zealand’s party system brought attention to more issues after its reforms than before. This is where the quasi-experimental analysis is more directly applied.
This application of topic modeling compares the number of issues covered by the party system in the three elections before the reform (1987, 1990, 1993) and the three elections after the reform (1999, 2002, 2005). Topic modeling analysis was performed on all the manifestos appearing during each of these periods. The 1996 election is left out because it was the first election under the new MMP system. Thus, it is regarded here as a transition period. This design thus matches Campbell and Stanley’s description of a one-group pretest–posttest quasi-experimental design [27], where a group (New Zealand’s party system) is observed prior to being exposed to an event (major electoral reform) and then it is observed again after the event.
This study applies NLP techniques to identify the topics political parties are discussing. It is expected that the topics discussed and emphasized vary across political parties and across time, and thus, unsupervised topic modeling techniques are required. This study specifically applies the topic modeling technique developed by Grootendorst [28], which leverages sentence transformers and c-TF-IDF (a class-based variant of TF-IDF) to create dense clusters that yield interpretable topics.
In this technique, BERT transformer embeddings are used to convert documents into numerical data. BERT extracts word embeddings based on the context of the word. To find topics, documents with similar topics are clustered together, using the UMAP (Uniform Manifold Approximation and Projection) dimensionality reduction algorithm. UMAP stores a large portion of the information of the high-dimensional local structure in a structure of lower dimensionality.
After dimensionality reduction, the documents are clustered using HDBSCAN (Hierarchical Density-Based Spatial Clustering of Applications with Noise), a density-based algorithm. HDBSCAN does not force all data points to cluster, it treats some as outliers. The parameters of HDBSCAN can be tweaked to control the number of topics returned, which may be necessary when the system is returning hundreds of topics.
To derive topics from clustered documents (to extract what makes each set of documents unique compared to the other), a class-based variant of TF-IDF (c-TF-IDF) is used. TF-IDF algorithms basically compare the importance of words between documents. Here, a cluster is treated as a single document, to which a TF-IDF algorithm is applied. The resulting TF-IDF score would demonstrate the important words in a topic. The higher the score, the more representative it should be of its topic—the score is a proxy for information density. The top 10 words (with the highest scores) can be selected to visualize what may be the focus of a topic. Topic sizes can be used to gauge how frequently certain topics appear.
The topic modeling presented here was conducted using Grootendorst’s Python package, BERTopic. The results reported in this study are produced by BERTopic’s default settings. To perform the embedding step, BERTopic uses the Sentence-BERT (SBERT) framework, and its default embedding model is all-MiniLM-L6-v2. (Other default settings include: top_n_words = 10, n_gram_range = (1, 1), min_topic_size = 10).
2.4. Sentiment Analysis
Many sentiment analysis techniques attempt to determine the sentiment (positive or negative) of documents or sentences, and even parts of sentences (aspects). Much of the aspect-based sentiment analysis (ABSA) research conducted to date focuses on documents such as product reviews, which tend to be short and relatively structured—at least when compared with longer documents, such as the manifestos analyzed in this study. Thus, this study currently focuses on detecting sentiment in sentences, particularly by applying the VADER (Valence Aware Dictionary for sEntiment Reasoning) algorithm to each sentence in a manifesto that contains at least one of the words returned by the topic modeling analysis.
VADER is a rule-based sentiment analysis algorithm developed by Hutto and Gilbert [29]. VADER sentimental analysis relies on a dictionary that maps lexical features to emotion intensities known as sentiment scores. Hutto maintains the dictionary and Python package (vaderSentiment) used in this analysis.
The algorithm finds keywords in a document and maps each one to numerical scores or weights in the dictionary (or “mapping”). Stems, lemmas, or n-gram tokens can be used in the dictionary. Vader recognizes that words such as ‘love’, ‘enjoy’, ‘happy’, and ‘like’ convey a positive sentiment. It also recognizes the basic context of these words, particularly modifying words that can change a word or phrase’s sentiment. It can recognize that a statement such as “did not love” is a negative statement. It also understands the emphasis implied by capitalization and punctuation (such as “ENJOY”), as well as emoticons (such as happy faces).
Scores are summed for each keyword in a document. The sentiment score of a text can be obtained by summing up the intensity of each word in the text. Thus, VADER is able to address both polarity (positive/negative) and intensity of emotion.
As mentioned, this study focuses on detecting sentiment in sentences, particularly by applying the VADER algorithm to each sentence in a manifesto that contains at least one of the words returned by the topic modeling analysis. For example, in the analysis in the results section, results are displayed for the sentences containing the words associated with environmentally friendlier transportation: rail, trains, buses, cycling. That is, to estimate the support that each political party shows towards environmentally friendlier forms of transportation, the polarity of each sentence containing at least one of these words is calculated. Then, the average is calculated for all the sentences appearing in each party’s manifesto.
3. Results
This section presents the results of applying the three NLP techniques to the New Zealand manifestos.
3.1. Manifesto Similarities
It is difficult to observe patterns when comparing all the manifestos simultaneously. Thus, the tables in this section present the document similarities for one party at a time, and only for the two major parties: National and Labour. Each column compares the manifesto produced by that party for that year’s election with the manifestos other parties produced for that year’s election and the manifestos of past elections (its own as well as those of other parties). Each column does not show comparisons with manifestos from future elections. This latter comparison adds little theoretical value because we would need to assume that parties anticipate what they themselves or the other parties will say years into the future.
The comparisons with past and present manifestos can provide insights into how a party changes over time, how a party is responding to other parties, and how successful parties were (especially minor parties) in bringing attention to their ideas. Since this analysis uses mainly basic BERT embeddings, it is difficult to determine whether a party is adopting policy positions that are similar to another party’s policy positions, or whether it is mainly talking about the same issues raised by an opposition party. Nonetheless, the output produced by the BERT embeddings appear to hint at important insights—these may be more clearly observed in future work.
Table 1 tracks how the similarity between the Labour Party manifestos and the manifestos of other parties changed across time. In the top row is displayed each Labour Party manifesto, sequentially by year. Manifestos that are most similar to Labour’s manifesto for that year appear closest to the top of that column. Labour Party manifestos are colored blue and a darker shade is used for more recent manifestos. Other parties are shaded in other colors, and darker shades are used for more recent manifestos (see table caption for the color coding scheme).
First, it should be noted that Labour Party manifestos are perfectly correlated with themselves (similarity scores equal 1), and that similarity scores are relatively high with several other manifestos. This latter result may indicate that parties are talking about similar issues, although they may take different positions on those issues.
Second, by the time of the most recent elections, Labour’s manifestos become more consistently similar to those of the Progressive Party (particularly the Progressive Party’s 2002 manifesto). This result suggests that the Labour Party’s policy agenda may have become more progressive in recent years—and this result appears to be corroborated by recent news evaluations of Labour’s positions [30].
On the other hand, there is also some recent—though less consistent—similarity with ACT’s 2002 manifesto, which is a relatively more conservative document. There are also elections when the Labour Party manifestos are relatively similar to the manifestos of the National Party, its long-time rival. Thus, there is a need to fine-tune this technique so that it may be possible to more clearly distinguish the dynamics in play here. Did Labour become more progressive? Did other parties also become more progressive? Is Labour just talking about the same issues, but not necessarily taking more progressive positions?
Table 2 tracks how the similarity between the National Party manifestos and the manifestos of other parties changed across time. In the top row is displayed each National Party manifesto, sequentially by year. National Party manifestos are colored gray and a darker shade is used for more recent manifestos. First, it should be noted that National Party manifestos are perfectly correlated with themselves (similarity scores equal 1), and that similarity scores are relatively high with several other manifestos. Once again, this latter result may indicate that parties are talking about similar issues, although they may take different positions on those issues.
Second, National’s manifestos are consistently more similar to older National manifestos, especially in 2008 and 2014. As with Labour, National’s manifestos do show some similarity with the manifestos of the Progressive Party, along with those of New Zealand First and ACT. These results may indicate that the National Party is focusing on the same policy issues, although not necessarily taking the same positions. On the other hand, if the preferences of New Zealand’s society have become more similar to those espoused by the Progressive Party, it would be reasonable for the National Party to gravitate in that direction, as well. Further research would be required, however, to fully determine the nuances of these dynamics.
3.2. Topic Modeling of Manifestos
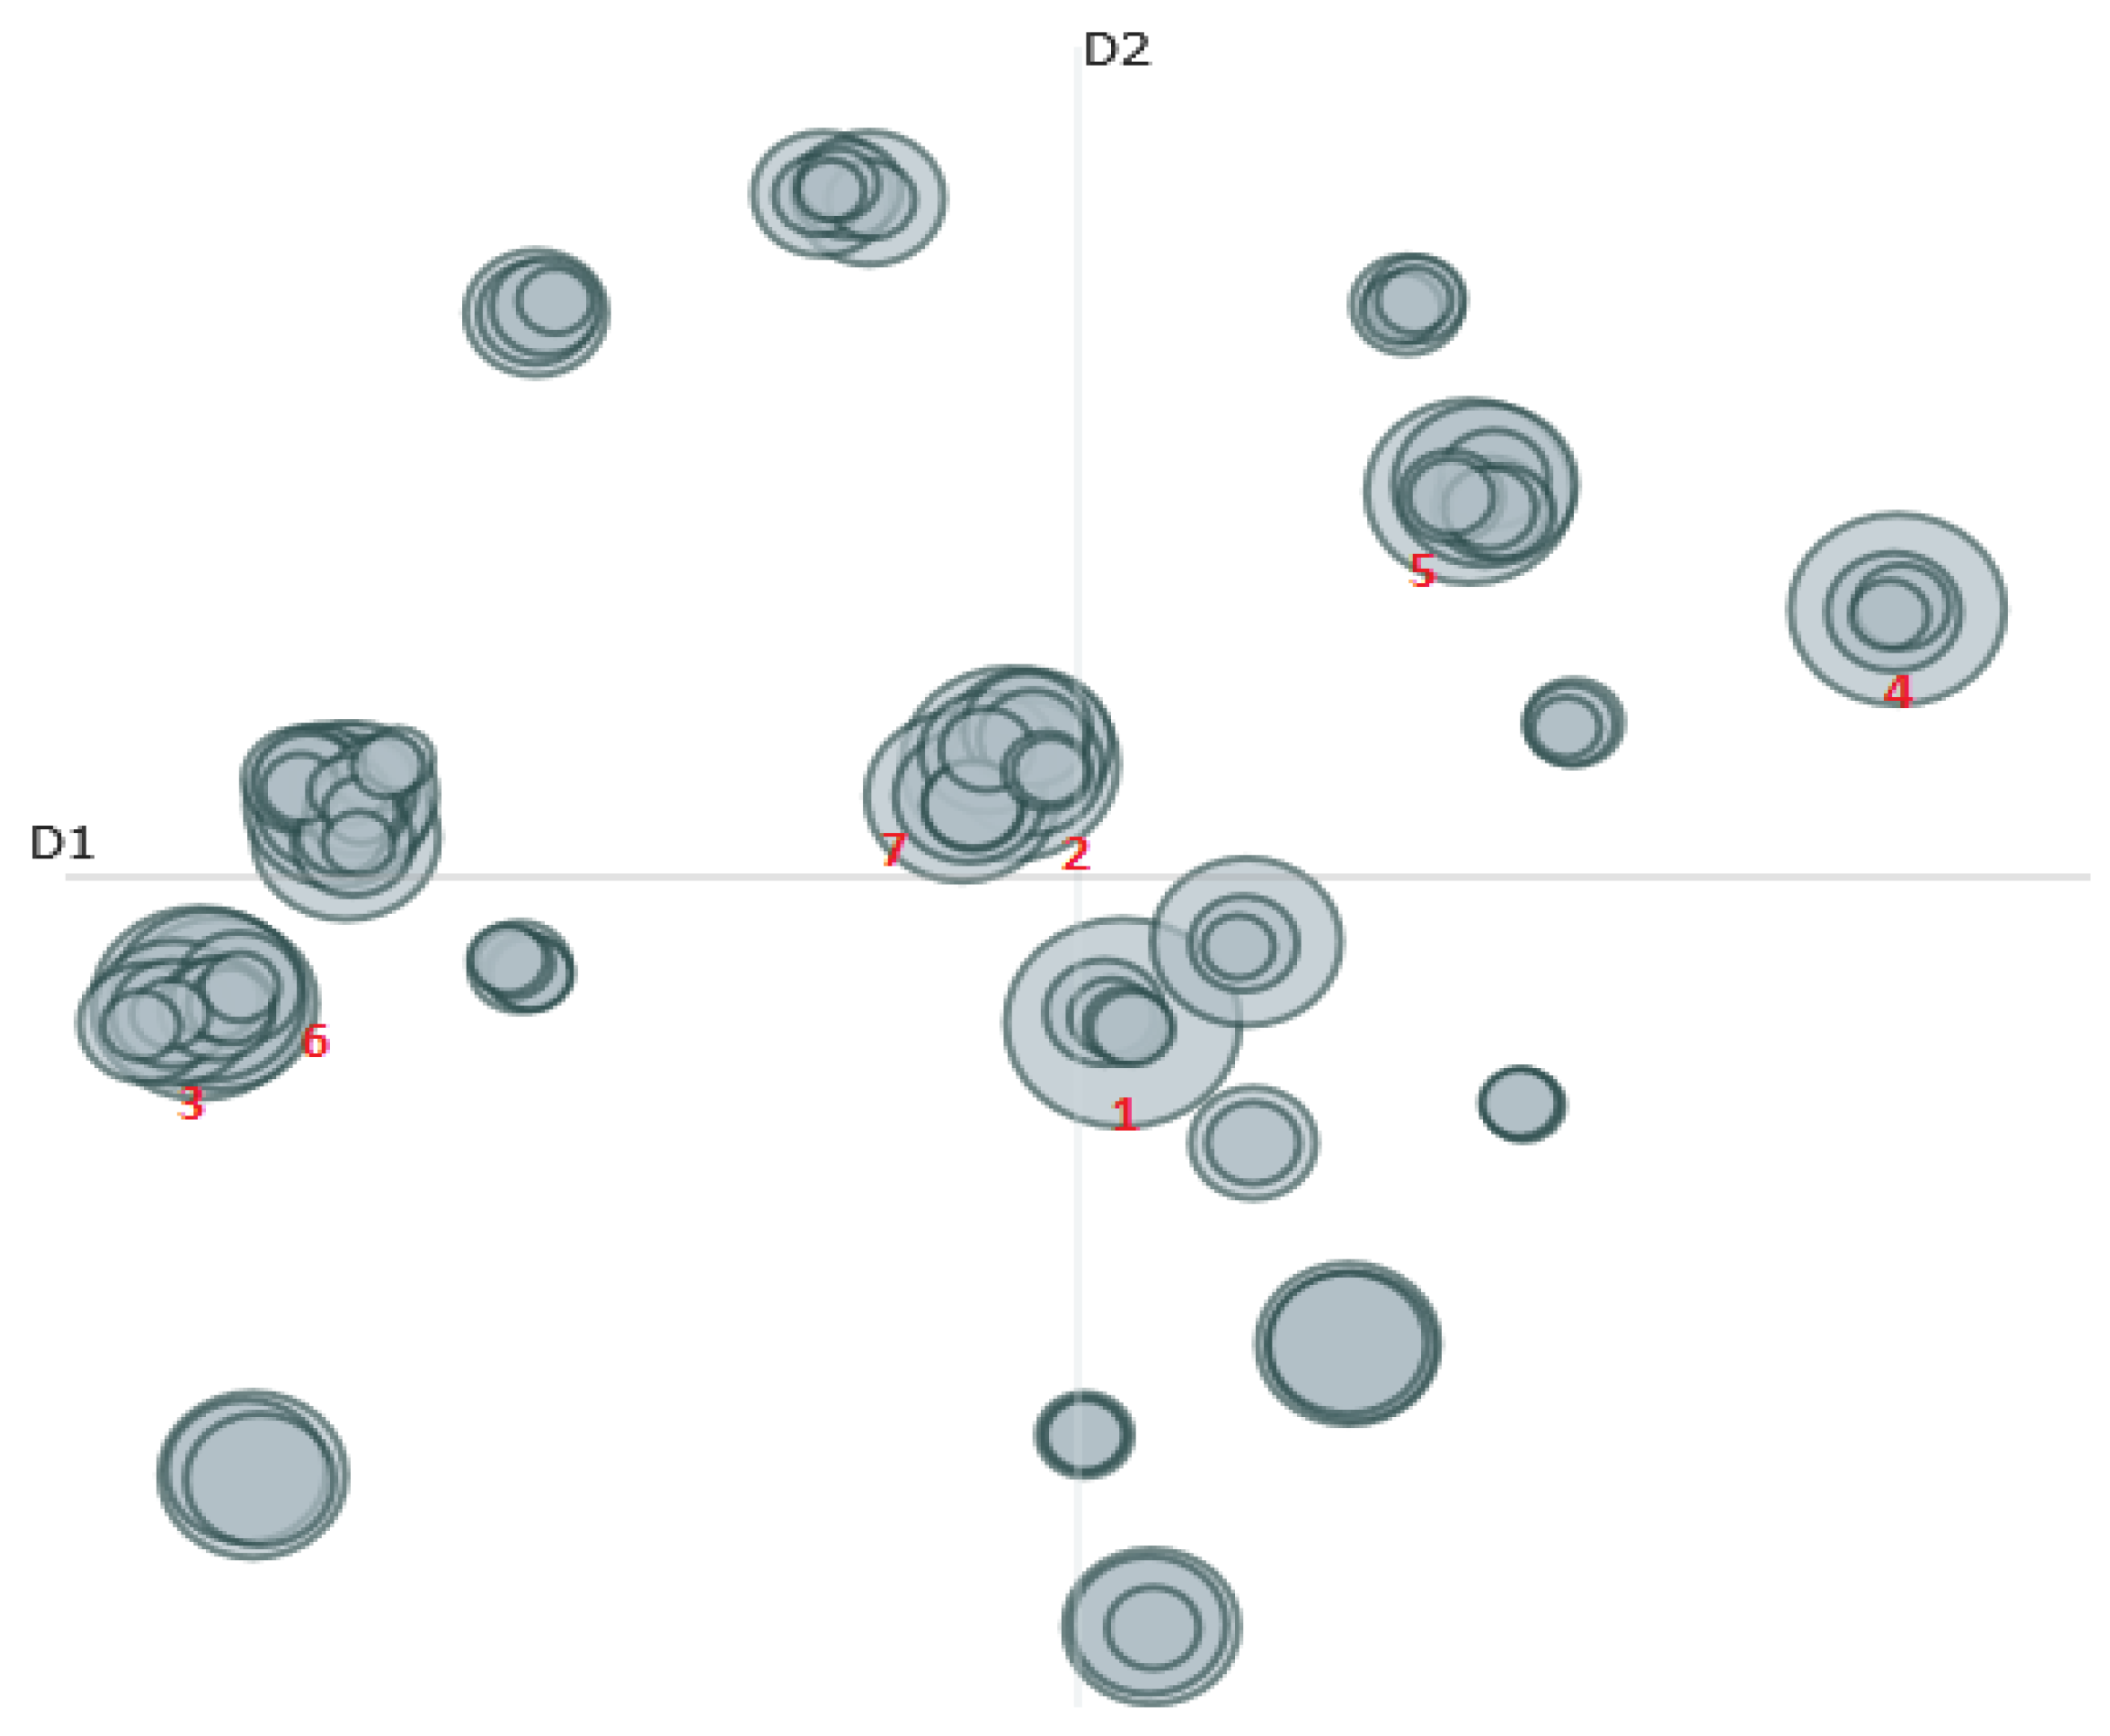
Figure 1 and Figure 2 display the results of the topic modeling analysis. Figure 1 displays the results for the pre-reform period (1987–1993), while Figure 2 presents the results for the post-reform period (1999–2005). It can first be observed that the topic modeling approach returned many topic areas, for each of the two periods (the two-party system period and the multiparty system period). It can also be observed that more distinct topics were discussed under the multiparty system.
In the three elections before the reform, roughly 104 issues were discussed by the political parties. In the three elections after the reforms, roughly 170 issues were discussed by the political parties. (A t-test shows this difference is statistically significant at least at the 0.01 level, although it should be noted that the sample size is n = 2). When overlapping is taken into account, the conclusion is more pronounced. In the three elections before the reform, roughly 18 issues were discussed by the political parties. In the three elections after the reforms, roughly 34 issues were discussed by the political parties. (A t-test shows this difference is statistically significant at least at the 0.05 level, although it should be noted that the sample size is n = 2).
The figures also provide more detail about the largest (most frequent) topics. The largest topics are numbered in the figure and their word composition is displayed in the caption below the figure. The largest topics in Figure 1 include healthcare, families, fishing, and so on. The largest topics in Figure 2 include transport, taxation, housing, and so on. These are topics that appear reasonable—they have high face validity. They are not a combination of nonsense words, they are topic categories that politicians might focus on during a debate or media interview.
Such topics thus appear useful for some types of analyses. For example, they may be used to compare the number of topics that are discussed in different countries or under different electoral systems (as was the case in this study). It may also be possible to use them to gauge how parties feel about particular policies, as in the next section.
3.3. Sentiment Analysis of Manifesto Sentences
To estimate how parties feel about particular policies, this section uses the topics created by the topic modeling technique used in the previous section. As mentioned previously, a party’s position is estimated using the following steps:
- Use topic modeling to find the topics;
- Use the key words making up the topic to find every sentence in a party’s manifesto that mentions that topic;
- Apply the VADER algorithm to each of those sentences to estimate the sentiment of that sentence;
- Create a party’s total sentiment score on that topic by calculating the average polarity score across all the sentences in a manifesto mentioning that topic and multiplying it by the log of the number of times (sentences) a party mentions the topic in their manifesto. Multiplying by the number of times a party mentions a topic helps account for the importance a party places on that topic. Taking the log reduces the effects of sizable variations in the number of mentions. Some parties, for example, will not mention a topic at all.
One weakness to address, before applying these steps, is that the topics returned by the topic modeling performed earlier on all the manifestos (pre and post reform) can be relatively generic. The topic of taxes, for example, contains the words “increase” and “decrease”. Thus, a sentiment analysis may be misleading in such cases.
To mitigate this weakness, a topic modeling analysis was performed on only the Green Party’s 2017 manifesto. Performing topic modeling on one party’s manifesto returns more distinct topics with usually more distinct positions. Thus, a sentiment analysis of these topics is more likely to produce valid policy stances and polarity scores. To gauge the other parties’ stances towards these topics, only their 2017 manifestos were used. The topic modeling step can, of course, be conducted on any of the manifestos from any of the parties. The goal, however, is to show how sentiment analysis may be conducted on the topics produced by topic modeling.
To develop a clearer sense of the sentiment analysis performed here on the topics returned by the topic modeling technique, we first take a closer look at just one of the topics returned from the Green Party’s 2017 manifesto. The list of words composing that topic is presented in Table 3, along with each word’s importance value (a weighted frequency score returned by BERTopic). This topic appears to be about transportation, and perhaps more specifically about environmentally friendly transportation. The full 10-word set captures a focus on transportation. A subset of the words—cycling, walking, rail, buses—suggests this topic is more specifically about environmentally friendly forms of transportation.
Table 4 shows the scores returned by VADER for each of a small sample of sentences from the Green Party’s 2017 manifesto. Each sentence contains at least one of the key words produced by the topic presented in Table 3. The polarity for this small sample ranges from 0.772 (which is close to 1, the top value possible) to 0.273 (which is closer to 0, the value indicating neutrality). Here, we get a first sense of the inaccuracies VADER can produce, because the sentences generating the high and the two low scores are all fairly strongly in support of “rail” transportation.
To get a sense of the total support each party shows on this issue, an average score is calculated across all the sentences, in each party’s 2017 manifesto, that contains at least one of the key words. For each party, Table 5 reports the number of sentences containing at least one of the key words in this transportation topic, the average VADER polarity score, and a weighted polarity score (calculated by multiplying the average polarity score by the log of the number of sentences in that party’s 2017 manifesto).
It can be seen that there is wide variation in terms of how much parties emphasize this topic. The Green Party mentions this topic in 174 sentences, while ACT and New Zealand First each mention this topic in only 14 sentences. The final weighted score shows that the Green Party seems to have the highest level of positive support for this topic, while ACT has the lowest level of support. A surprising finding is that the National Party is a close second. National is a relatively conservative political party. Further analysis will be required to determine if National’s support this issue is driven by its focus on transportation, more broadly, or whether it gravitated towards the Green Party’s position by 2017.
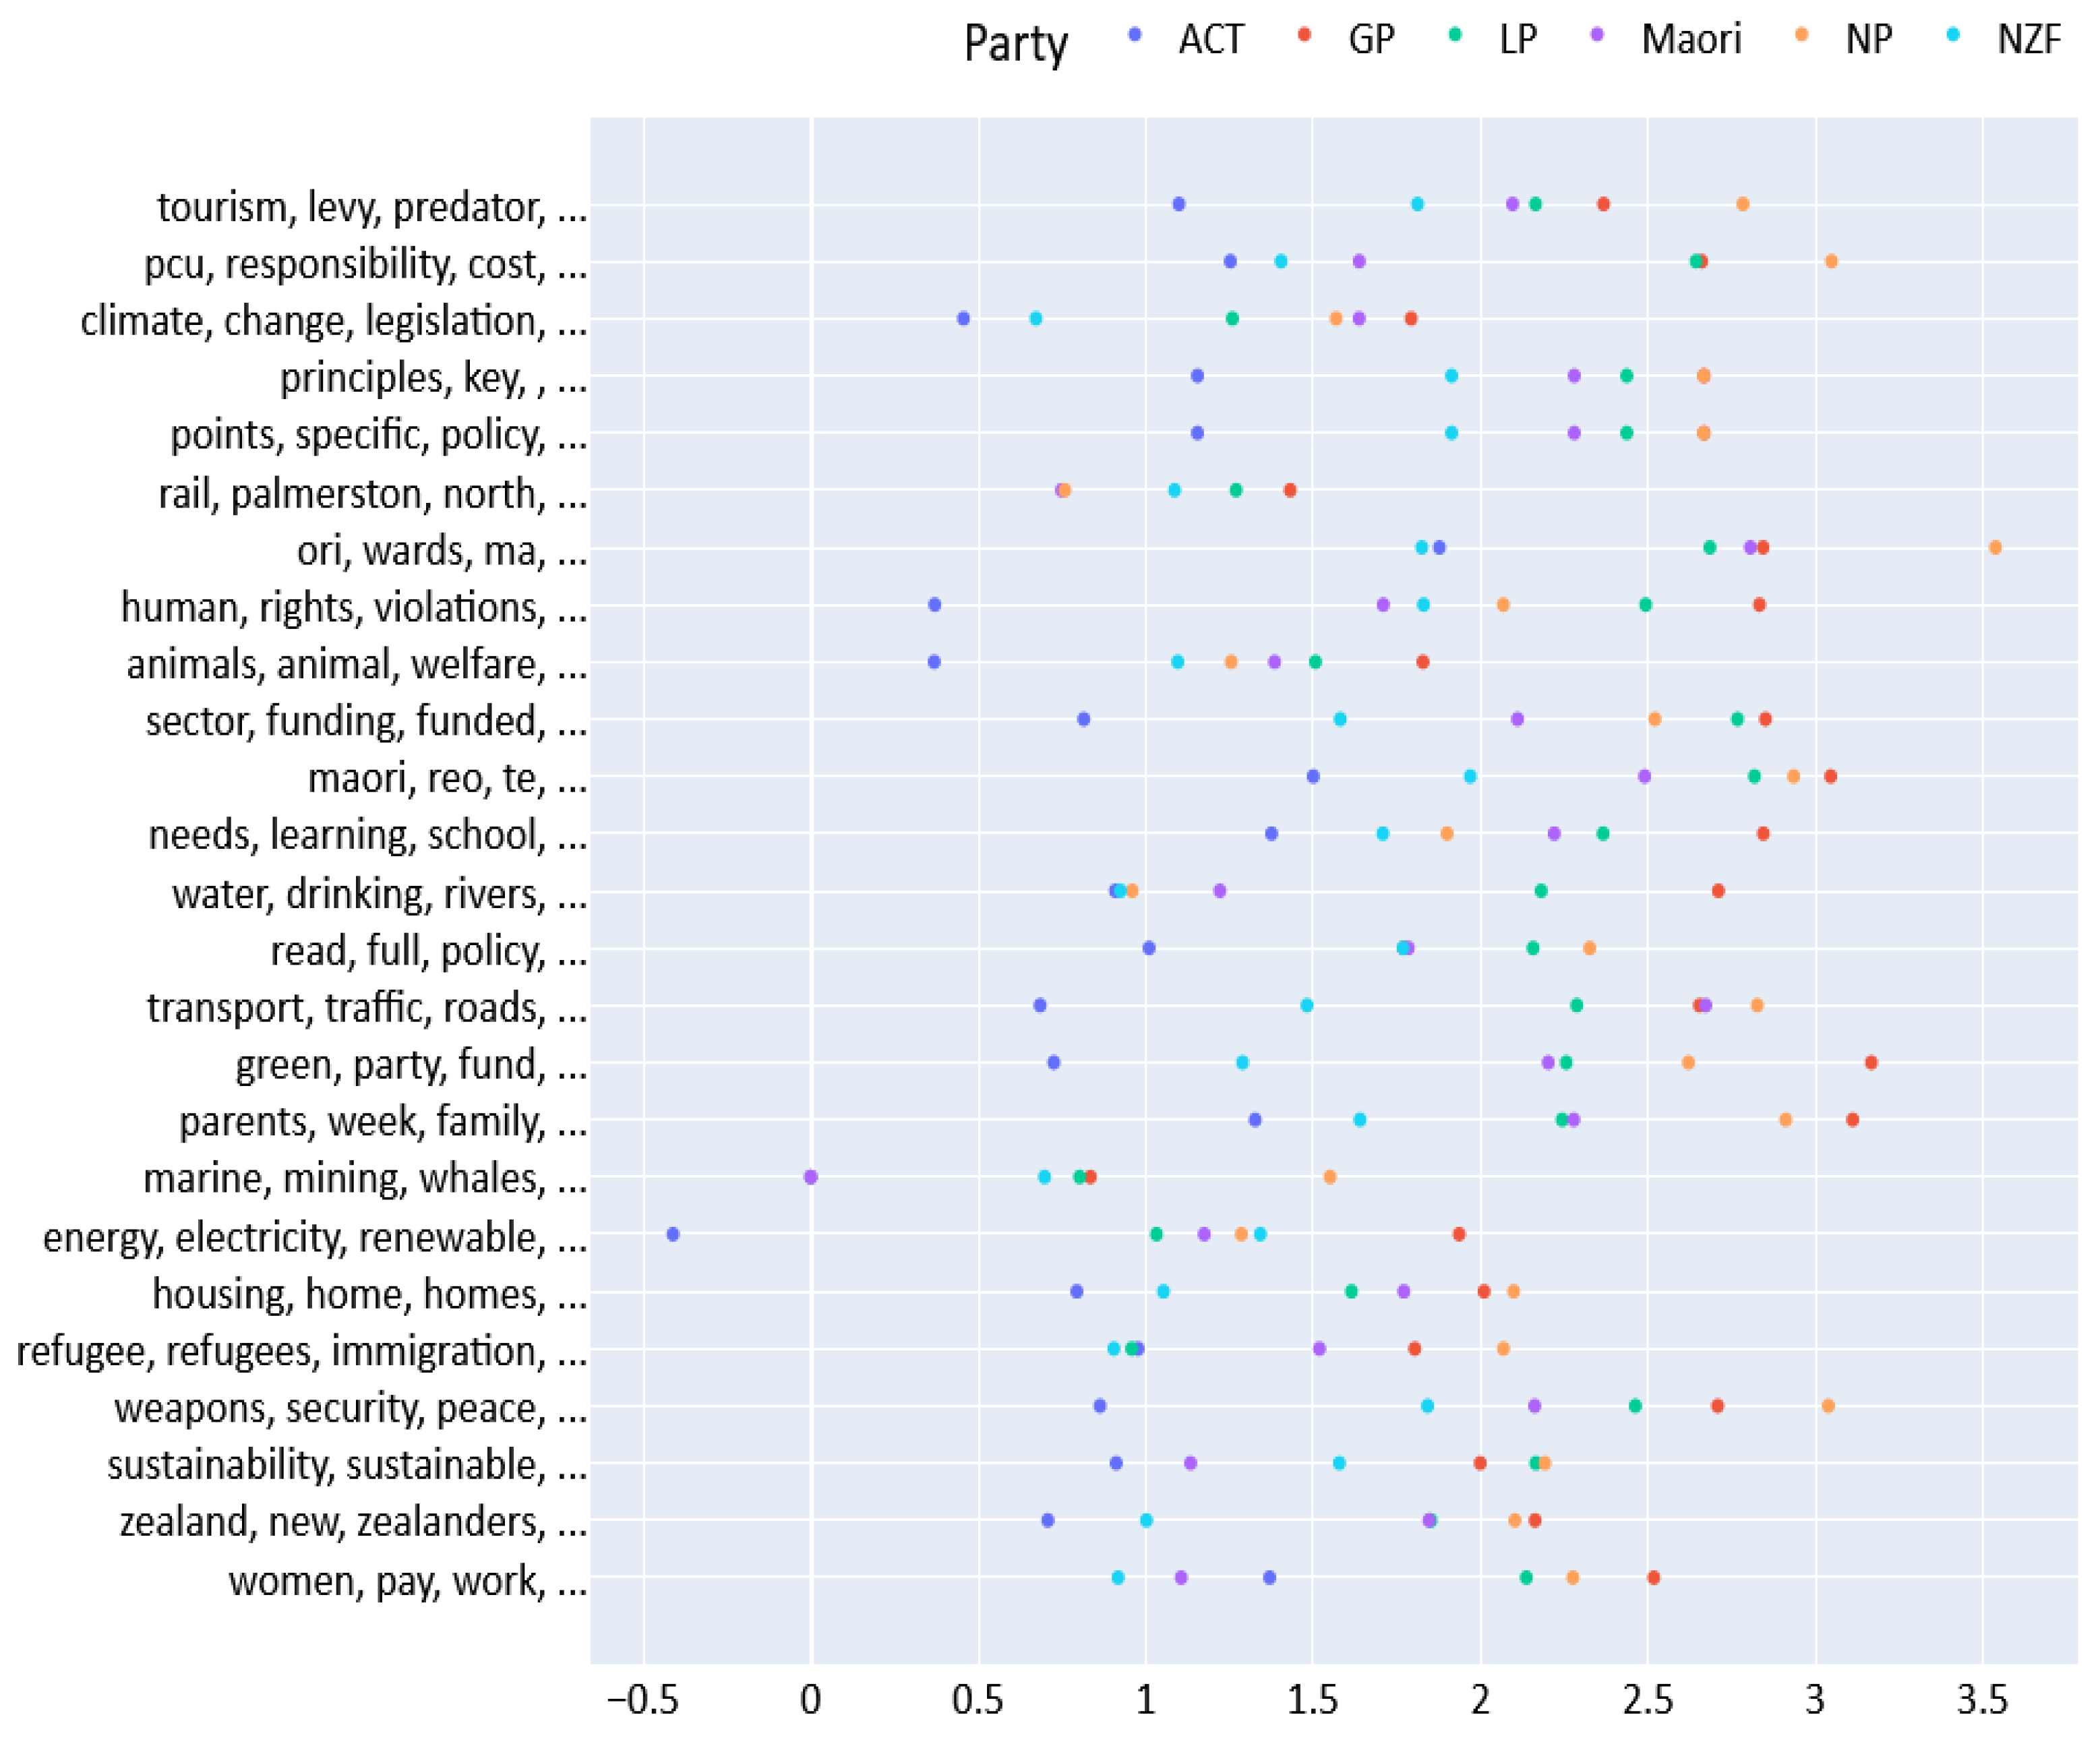
We now apply this sentiment analysis strategy to the top 25 topics returned from the Green Party’s 2017 manifesto. Figure 3 displays each of the party’s weighted VADER scores (average VADER score multiplied by the log of the number of times a party mentions the topic in their manifesto) for each of the 25 topics.
Since the topics are created from the Green Party’s manifesto, it is reasonable that the Green Party (the red dot) tends to have a high positive score on most of these issues. The Green Party is an environmentalist party and it tends to favor redistribution policies, thus, it is also reasonable that it has the highest positive polarity on issues such as “energy, renewable”, “water, drinking” and “needs, learning, schools”.
For some issues, such as “housing,” all the parties are clustered relatively close together. Such clustering may indicate that there is a broad consensus on such issues. On the other hand, some issues have a wider variation of support—for example, “weapons, security, peace” and “human, rights, violations”—which may indicate more polarization.
An interesting and perhaps surprising result is the polarity scores on issues such as “marine, mining, whales”. Almost all the parties appear to show low support for this topic, but the Maori Party is considerably less supportive. The Maori Party advocates for the rights of indigenous New Zealanders, who in turn have traditionally had a strong cultural and religious relationship to whales [31].
While the results of this section appear quite reasonable, there are important limitations requiring attention. These are discussed in the following sections.
4. Discussion
Applying NLP to key texts analyzed by political scientists appears promising. In this study, it was applied to political party manifestos, which are difficult to analyze in comparison to documents such as product reviews. Nevertheless, it was possible to observe that current NLP methods can provide important insights that supplement past work on political texts. These results and opportunities for improvement are summarized in Table 6.
First, document similarity can provide some insights into the behavior of political parties. It can detect how parties position themselves relative to other parties, across multiple elections. It can also detect which minor parties are most successful at having their ideas either adopted by or responded to by the major parties.
Second, topic modeling can provide objective insights into the policy issues the parties talk about. This finding can be considered a useful supplement to existing content analyses of the manifestos, which use set numbers of topic categories and subcategories. (It was deemed that such an approach facilitated comparisons over a widerange of countries irrespective of cultural and socio-economic differences). Even if the unsupervised approach used here suffers from some inaccuracies (e.g., overlapping topics and generic topics on which it is difficult to perform sentiment analysis), it can still give us very useful insights into how electoral systems affect the diversity of political discourse. It was possible to observe that multiparty systems likely produce a more diverse political discourse than do single-member-district systems.
Finally, sentiment analysis can capture the support parties show towards particular policy ideas, such as those found using topic modeling. The results have face validity, and they also appear to be a good supplement to existing hand-coded approaches. It can be efficiently applied to any new categories missed by hand coding or generated by changes in coding strategies. NLP offers a more flexible approach to identifying party positioning, though its accuracy is likely lower than that of hand coding.
In sum, current NLP methods can provide important insights that supplement past work. With fine-tuning and some technological breakthroughs, these methods could become more than supplementary. They might make it possible to ask new questions and detect previously overlooked patterns. Such possibilities are discussed in the following section.
5. Conclusions
This section discusses key limitations of the methods applied in this study. The analyses performed here can likely benefit from significant fine-tuning. First, each type of NLP analysis performed in this study would likely benefit from more appropriate vector representations, especially vector representations that capture a party’s attitude towards a policy issue.
Document similarity would clearly benefit from such an improvement. It would allow it to more accurately compare manifestos and thereby to more clearly establish whether a party’s manifesto is similar to another party’s manifesto because they are talking about the same issues or because they hold similar positions on those issues.
The sentiment analysis conducted here had some value. Many of the results make sense in terms of estimating the support of parties on a topic. However, the topics could be improved. For example, the transportation topic could be sharpened into a topic strictly about environmentally friendly forms of transportation, particularly by selecting only those words relevant to creating such a topic: cycling, walking, rail, buses. This can be currently achieved manually, but ideally, it would be automated, so that this kind of analysis could be conducted across many texts from many countries.
More fine-tuned ABSA techniques might improve the accuracy of measurements of a party’s attitude on an issue (polarity measurements). Such accuracy may allow a more nuanced tracking of the behavior of political parties. It may allow for the detection of new patterns, such as the strategies political parties may pursue when trying to win votes. Unfortunately, this kind of fine-tuning could take significant effort, time, and technological breakthroughs; thus, it is left for future work.
Another important avenue for future work would involve expanding the analysis to more cases. This study presented evidence from one country, but manifestos are available for more than 50 countries. Expanding this kind of NLP analysis to all the manifestos from all the countries might allow for the detection of new patterns, such as the different incentives and obstacles parties may face in different countries. A major limitation, however, is that most of the manifestos in the MARPOR database are not in English. Thus, such an analysis would involve applying algorithms that can either translate text to English or handle different languages. Different languages also present a challenge for sentiment analysis tools such as VADER. Many such tools have been developed to detect sentiment for English text.
A final avenue for future work would involve expanding the analysis to different sources of text. The techniques applied to manifestos in this study could lead to more insights when applied to other texts in the political realm. For example, it is possible that they could be applied to news media and legislative speeches, with relatively few modifications. Such applications would permit researchers to more efficiently gauge how successful political parties are at disseminating and implementing their policy ideas.
Again, if the technologies explored in this paper can be honed and scaled to facilitate the analysis of the political information environment across the world’s democracies, it may be possible to identify beneficial or dangerous features of political discourse. Perhaps it may also be possible to identify ways to enhance or mitigate these features (e.g., through institutional or media reforms).
Author Contributions
Conceptualization, S.O. and H.B.; methodology, S.O. and H.B.; software, S.O.; validation, S.O. and H.B.; investigation, S.O.; data curation, S.O.; writing—original draft preparation, S.O.; writing—review and editing, S.O. and H.B.; visualization, S.O.; supervision, H.B.; project administration, S.O. and H.B. All authors have read and agreed to the published version of the manuscript.
Funding
This work was not funded by any external or internal sources.
Data Availability Statement
The data (manifestos) used in this study are openly available at https://manifestoproject.wzb.eu/ (accessed on 19 January 2023).
Conflicts of Interest
The authors declare no conflict of interest.
References
- Poole, K.T.; Rosenthal, H. D-nominate after 10 years: A comparative update to congress: A political-economic history of roll-call voting. Legis. Stud. Q. 2001, 5–29. [Google Scholar] [CrossRef]
- Hayward, J.; Rudd, C. Metropolitan newspapers and the election. In Left Turn: The New Zealand General Election of 1999; Te Herenga Waka University Press: Wellington, New Zealand, 1999; pp. 89–104. [Google Scholar]
- Volkens, A.; Bara, J.; Budge, I.; McDonald, M.D.; Klingemann, H.D. Mapping Policy Preferences from Texts: Statistical Solutions for Manifesto Analysts; OUP Oxford: Oxford, UK, 2013; Volume 3. [Google Scholar]
- Weber, R.P. Basic Content Analysis; Sage: Thousand Oaks, CA, USA, 1990; Volume 49. [Google Scholar]
- Neuendorf, K.A. The Content Analysis Guidebook; Sage: Thousand Oaks, CA, USA, 2017. [Google Scholar]
- Krippendorff, K. Content Analysis: An Introduction to Its Methodology; Sage: Thousand Oaks, CA, USA, 2018. [Google Scholar]
- Jurafsky, D.; Martin, J.H. Speech and Language Processing: An Introduction to Speech Recognition, Computational Linguistics and Natural Language Processing; Prentice Hall: Upper Saddle River, NJ, USA, 2008. [Google Scholar]
- Manning, C.D.; Schütze, H. Foundations of Statistical Natural Language Processing (Ch. IV); MIT Press: Cambridge, MA, USA, 2002. [Google Scholar]
- Parthasarathy, R.; Rao, V.; Palaniswamy, N. Deliberative democracy in an unequal world: A text-as-data study of south India’s village assemblies. Am. Political Sci. Rev. 2019, 113, 623–640. [Google Scholar] [CrossRef]
- Chang, C.; Masterson, M. Using word order in political text classification with long short-term memory models. Political Anal. 2020, 28, 395–411. [Google Scholar] [CrossRef]
- Soroka, S.; Young, L.; Balmas, M. Bad news or mad news? Sentiment scoring of negativity, fear, and anger in news content. Ann. Am. Acad. Political Soc. Sci. 2015, 659, 108–121. [Google Scholar] [CrossRef]
- Iyyer, M.; Enns, P.; Boyd-Graber, J.; Resnik, P. Political ideology detection using recursive neural networks. In Proceedings of the 52nd Annual Meeting of the Association for Computational Linguistics, Baltimore, MD, USA, 23–24 June 2014; Volume 1, pp. 1113–1122. [Google Scholar]
- Baly, R.; Martino, G.D.S.; Glass, J.; Nakov, P. We can detect your bias: Predicting the political ideology of news articles. arXiv 2020, arXiv:2010.05338. [Google Scholar]
- Liu, Y.; Zhang, X.F.; Wegsman, D.; Beauchamp, N.; Wang, L. POLITICS: Pretraining with Same-story Article Comparison for Ideology Prediction and Stance Detection. arXiv 2022, arXiv:2205.00619. [Google Scholar]
- Yang Zen, T.H.; Hong, C.B.; Mohan, P.M.; Balachandran, V. ABC-Verify: AI-Blockchain Integrated Framework for Tweet Misinformation Detection. In Proceedings of the 2021 IEEE International Conference on Service Operations and Logistics, and Informatics (SOLI), Singapore, 11–12 December 2021; pp. 1–5. [Google Scholar] [CrossRef]
- Pavlov, T.; Mirceva, G. COVID-19 Fake News Detection by Using BERT and RoBERTa models. In Proceedings of the 2022 45th Jubilee International Convention on Information, Communication and Electronic Technology (MIPRO), Opatija, Croatia, 23–27 May 2022; pp. 312–316. [Google Scholar] [CrossRef]
- Volkens, A. Manifesto Coding lnstructions, 1st ed.; Wissenschaftszentrum Berlin für Sozialforschung (WZB): Berlin, Germany, 2001. [Google Scholar]
- Laver, M.; Benoit, K.; Garry, J. Extracting policy positions from political texts using words as data. Am. Political Sci. Rev. 2003, 97, 311–331. [Google Scholar] [CrossRef] [Green Version]
- Johnston, R.J.; Pattie, C.J. Campaigning and split-ticket voting in new electoral systems: The first MMP elections in New Zealand, Scotland and Wales. Elect. Stud. 2002, 21, 583. [Google Scholar] [CrossRef]
- Vowles, J. The Politics of Electoral Reform in New Zealand. Int. Political Sci. Rev. 1995, 16, 95–115. [Google Scholar] [CrossRef]
- Lijphart, A. Patterns of Democracy: Government Forms and Performance in Thirty-Six Countries; Yale University Press: New Haven, CT, USA, 1999. [Google Scholar]
- Katz, R.S. Democracy and Elections; Oxford University Press: Oxford, UK, 1997; pp. 150–160. [Google Scholar]
- Volkens, A.; Burst, T.; Krause, W.; Lehmann, P.; Matthieß, T.; Merz, N.; Weßels, B.; Zehnter, L. The Manifesto Data Collection. Manifesto Project (MRG/CMP/MARPOR); Wissenschaftszentrum Berlin für Sozialforschung (WZB): Berlin, Germany, 2021. [Google Scholar]
- Salton, G.; Buckley, C. Term-weighting approaches in automatic text retrieval. Inf. Process. Manag. 1988, 24, 513–523. [Google Scholar] [CrossRef] [Green Version]
- Mikolov, T.; Yih, W.T.; Zweig, G. Linguistic regularities in continuous space word representations. In Proceedings of the 2013 Conference of the North American Chapter of the Association for Computational Linguistics: Human Language Technologies, Atlanta, GA, USA, 9–14 June 2013; pp. 746–751. [Google Scholar]
- Devlin, J.; Chang, M.W.; Lee, K.; Toutanova, K. Bert: Pre-training of deep bidirectional transformers for language understanding. arXiv 2018, arXiv:1810.04805. [Google Scholar]
- Campbell, D.; Stanley, J. Experimental and Quasi-Experimental Designs for Research; Houghton Mifflin Company: Boston, MA, USA, 1963. [Google Scholar]
- Grootendorst, M. BERTopic: Leveraging BERT and c-TF-IDF to create easily interpretable topics. Zenodo 2020. [Google Scholar] [CrossRef]
- Hutto, C.; Gilbert, E. Vader: A parsimonious rule-based model for sentiment analysis of social media text. In Proceedings of the International AAAI Conference on Web and Social Media, Ann Arbor, MI, USA, 1–4 June 2014; Volume 8, pp. 216–225. [Google Scholar]
- Cave, D. With Progressive Politics on March in New Zealand, Maori Minister Blazes New Trails. The New York Times, 16 November 2020. [Google Scholar]
- Rodgers, R.P. The Connection of Māori to Whales. Available online: https://ir.canterbury.ac.nz/bitstream/handle/10092/14087/The%20Connection%20of%20M%C3%84%20ori%20to%20Whales.pdf?sequence=1 (accessed on 19 January 2023).
Figure 1.
Intertopic Distance Map: Pre-reform Topics. Topic 1: health, hospitals, public, care, hospital, system, patients, services, quality, national. Topic 2: families, children, family, parents, childcare, child, support, social, subsidy, stress. Topic 3: fishing, fisheries, fish, quota, aquaculture, recreational, management, commercial, industry, percent. Topic 4: relations, industrial, unions, employment, union, workers, bargaining, employers, contracts, equity. Topic 5: trade, export, markets, imports, products, tariffs, marketing, market, overseas, goods. Topic 6: environmental, environment, conservation, natural, management, sustainable, resource, resources, accounts, mineral. Topic 7: tax, taxation, small, taxes, businesses, business, duties, applies, definition, which.

Figure 2.
Intertopic Distance Map: Post-reform Topics. Topic 1: transport, road, rail, roads, roading, safety, traffic, infrastructure, congestion, transit. Topic 2: tax, taxation, taxes, rate, income, lower, company, corporate, personal, higher. Topic 3: housing, tenants, houses, state, income, low, rental, rent, accommodation, house. Topic 4: defence, force, forces, maritime, air, capability, allies, navy, peace, army. Topic 5: they, but, we, delivered, it, what, let, now, more, win. Topic 6: radio, broadcasting, television, tvnz, spectrum, fm, air, music, tv, nz. Topic 7: export, business, value, small, growth, economy, exports, commerce, wealth, businesses.

Figure 3.
Average Vader Polarity for Multiple Topics. Topics in this figure were created by applying topic modeling to only the Green Party’s 2017 manifesto. The scores are weighted by the log of the numbers of rows in which one of the topic words appears, for each party’s manifesto. Only manifestos from the 2017 election were used in this analysis.


Table 1.
Similarity between the Labour Party and Other Parties.
| LP 1987 | LP 1990 | LP 1993 | LP 1996 | LP 1999 | LP 2002 |
|---|---|---|---|---|---|
| NP 1987 | NP 1987 | NP 1987 | DP 1987 | NP 1993 | NP 1990 |
| DP 1987 | DP 1987 | LP 1987 | NP 1987 | ACT 1999 | NZF 1999 |
| NP 1990 | NP 1990 | NZF 1996 | NP 1987 | NZF 1996 | |
| LP 1987 | All 1993 | LP 1993 | NP 1999 | NP 2002 | |
| DP 1990 | NP 1993 | NP 1990 | NP 1996 | LP 1993 | |
| DP 1987 | LP 1987 | LP 1993 | All 1999 | ||
| LP 1990 | ACT 1996 | All 1993 | All 1996 | ||
| DP 1990 | NP 1996 | DP 1987 | NP 1996 | ||
| NP 1993 | NZF 1999 | Prog 2002 | |||
| All 1996 | LP 1990 | NZF 2002 | |||
| LP 1990 | All 1999 | LP 1987 | |||
| LP 2005 | LP 2008 | LP 2011 | LP 2014 | LP 2017 | |
| Prog 2002 | NP 2005 | Prog 2002 | LP 1993 | Prog 2002 | |
| NP 1996 | Prog 2005 | ACT 2002 | ACT 2008 | ACT 2002 | |
| All 1999 | NZF 2002 | LP 1987 | GP 2014 | NP 1987 | |
| LP 1999 | LP 1993 | ACT 1999 | NP 1990 | LP 1999 | |
| NP 1993 | NP 1990 | NP 2005 | UF 2014 | NP 1999 | |
| NP 1999 | NZF 1999 | NZF 1999 | ACT 2002 | NP 2008 | |
| ACT 1999 | LP 1987 | DP 1990 | Prog 2002 | ACT 1999 | |
| UF 2002 | ACT 2002 | All 1999 | LP 2005 | NZF 2014 | |
| LP 1993 | Prog 2002 | ACT 2008 | UF 2002 | Prog 2005 | |
| Maori 2005 | ACT 2008 | NZF 2011 | NP 2011 | NP 2011 | |
| Prog 2005 | ACT 1996 | UF 2002 | NP 2002 | GP 2011 | |
Color coding is used to help visualize the similarity of the Labour Party to other parties across time. More recent manifestos appear in darker shades. Manifestos that are most similar to Labour’s manifesto for that year appear closest to the top of that column. LP = Labour Party (blue), NP = National Party (grey), Act = Act Party (purple), All = Alliance (light red), Prog = Progressive Party (darker red), GP = Green Party (green), MP = Maori Pacific (yellow), DP = Democratic Party (light yellow), NZF = New Zealand First (brown), UF = United Future (violet).
Table 2.
Similarity between the National Party and Other Parties.
| NP 1987 | NP 1990 | NP 1993 | NP 1996 | NP 1999 | NP 2002 |
|---|---|---|---|---|---|
| DP 1987 | NP 1987 | NP 1987 | NP 1993 | NP 1996 | LP 1993 |
| LP 1987 | LP 1987 | LP 1993 | NP 1990 | NP 1993 | All 1993 |
| DP 1987 | LP 1987 | NP 1987 | All 1999 | NZF 2002 | |
| LP 1990 | All 1993 | NZF 1996 | LP 1999 | All 1999 | |
| DP 1990 | DP 1987 | All 1993 | ACT 1999 | LP 2002 | |
| LP 1990 | LP 1987 | NP 1987 | NP 1999 | ||
| NP 1990 | LP 1993 | All 1993 | NP 1990 | ||
| DP 1990 | ACT 1996 | LP 1987 | Prog 2002 | ||
| DP 1987 | LP 1993 | ACT 1996 | |||
| LP 1990 | DP 1987 | LP 1987 | |||
| LP 1996 | NP 1990 | NZF 1999 | |||
| NP 2005 | NP 2008 | NP 2011 | NP 2014 | NP 2017 | |
| Prog 2005 | NP 1999 | ACT 2008 | LP 1999 | ACT 2008 | |
| LP 1993 | NP 1993 | Prog 2005 | Maori 2008 | NP 2011 | |
| NP 1987 | Prog 2002 | NP 1987 | NP 2011 | NZF 1999 | |
| Prog 2002 | NP 1987 | ACT 2002 | NP 1993 | Prog 2005 | |
| NZF 1999 | Prog 2005 | LP 2002 | NP 1996 | LP 1993 | |
| LP 1987 | LP 1999 | Prog 2002 | ACT 2014 | NP 1987 | |
| NZF 2002 | ACT 2002 | ACT 1999 | Prog 2005 | LP 2008 | |
| ACT 2002 | LP 1993 | LP 1993 | NP 1987 | NP 2005 | |
| NP 1990 | NP 1996 | NP 2005 | ACT 1999 | NZF 2011 | |
| ACT 1996 | LP 1987 | LP 1999 | NP 1999 | Prog 2002 | |
| NP 1999 | ACT 1999 | UF 2008 | NP 2005 | NP 1996 | |
Color coding is used to help visualize the similarity of the Labour Party to other parties across time. More recent manifestos appear in darker shades. Manifestos that are most similar to National’s manifesto for that year appear closest to the top of that column. LP = Labour Party (blue), NP = National Party (grey), Act = Act Party (purple), All = Alliance (light red), Prog = Progressive Party (darker red), GP = Green Party (green), MP = Maori Pacific (yellow), DP = Democratic Party (light yellow), NZF = New Zealand First (brown), UF = United Future (violet).
Table 3.
Example Topic.
| Top 10 Words | Importance Value |
|---|---|
| transport | 0.047 |
| cycling | 0.039 |
| walking | 0.035 |
| rail | 0.027 |
| safe | 0.023 |
| buses | 0.021 |
| cycle | 0.021 |
| wellington | 0.020 |
| congestion | 0.020 |
| roads | 0.019 |
Table 4.
Sample of VADER Scores for Each Sentence.
| Party | Text | Polarity Vader |
|---|---|---|
| GP | Support locating clusters near transport hubs (rail lines, ports, etc.) | 0.4019 |
| GP | Expand the nationwide network of cycle/pedestrian trails. | 0.3182 |
| GP | Promote rail as a great way to travel and seek to make it more available and reliable. | 0.7717 |
| GP | All goods and services produced or sold in New Zealand to meet quality and sustainability standards (e.g., energy and recycling standards). | 0.2732 |
| GP | Fast, electric rail lines eliminate pollution and create healthier, congestion-free cities. | 0.2732 |
| GP | Safe walking and cycling for kids. | 0.4404 |
| GP | Allocate NZD 50m a year for four years to build modern, convenient walking and cycling infrastructure around schools: separating kids and other users from road traffic, providing a safe choice for families. | 0.6486 |
| GP | Get half of kids walking or cycling to school by 2022: reducing congestion; improving health and learning; saving families time and money. | 0.4215 |
| GP | Better funding will enable more frequent buses on existing routes. | 0.4404 |
Table 5.
VADER Scores for Each Party on Transportation.
| Party | Number of Sentences | Avg Polarity Vader | Weighted Polarity |
|---|---|---|---|
| ACT | 14 | 0.151 | 0.574 |
| GP | 174 | 0.352 | 2.622 |
| LP | 54 | 0.338 | 1.943 |
| Maori | 14 | 0.556 | 2.118 |
| NP | 129 | 0.368 | 2.581 |
| NZF | 30 | 0.225 | 1.102 |
Weighted Polarity = Avg Polarity Vader * Log of Sentence.
Table 6.
Summary of Results.
| NLP Technique | The Good | The Bad |
|---|---|---|
| Document Similarity |
|
|
| Topic Modeling |
|
|
| Sentiment Analysis |
|
|
Disclaimer/Publisher’s Note: The statements, opinions and data contained in all publications are solely those of the individual author(s) and contributor(s) and not of MDPI and/or the editor(s). MDPI and/or the editor(s) disclaim responsibility for any injury to people or property resulting from any ideas, methods, instructions or products referred to in the content. |
© 2023 by the authors. Licensee MDPI, Basel, Switzerland. This article is an open access article distributed under the terms and conditions of the Creative Commons Attribution (CC BY) license (https://creativecommons.org/licenses/by/4.0/).
Share and Cite
MDPI and ACS Style
Orellana, S.; Bisgin, H. Using Natural Language Processing to Analyze Political Party Manifestos from New Zealand. Information 2023, 14, 152. https://0-doi-org.brum.beds.ac.uk/10.3390/info14030152
AMA Style
Orellana S, Bisgin H. Using Natural Language Processing to Analyze Political Party Manifestos from New Zealand. Information. 2023; 14(3):152. https://0-doi-org.brum.beds.ac.uk/10.3390/info14030152
Chicago/Turabian StyleOrellana, Salomon, and Halil Bisgin. 2023. "Using Natural Language Processing to Analyze Political Party Manifestos from New Zealand" Information 14, no. 3: 152. https://0-doi-org.brum.beds.ac.uk/10.3390/info14030152
Note that from the first issue of 2016, this journal uses article numbers instead of page numbers. See further details here.