
Unlocking Sustainable Value through Digital Transformation: An Examination of ESG Performance


1
Department of Management, Faculty of Applied Sciences, WSB University, 41-300 Dabrowa Gornicza, Poland
2
The London Academy of Science and Business, 120 Baker St., London W1U 6TU, UK
3
Department of Marketing, Sumy State University, 2, Rymsky-Korsakov St., 40007 Sumy, Ukraine
*
Author to whom correspondence should be addressed.
Information 2023, 14(8), 444; https://0-doi-org.brum.beds.ac.uk/10.3390/info14080444
Submission received: 13 June 2023
/
Revised: 1 August 2023
/
Accepted: 2 August 2023
/
Published: 7 August 2023
(This article belongs to the Special Issue Digital Work—Information Technology and Commute Choice)
Abstract
:Digital transformation has already begun to play a significant role in helping EU countries to achieve sustainable values by promoting environmental, social and governance (ESG) efficiency. It is rapidly changing the economic landscape, which leads to changes in all sectors and at all levels. The European Union (EU) has set ambitious goals for sustainable development and climate change mitigation, such as the European Green Deal and the 2030 Agenda for Sustainable Development. The paper aims to test the spatial spillover effect of digitalization on ESG performance for EU countries for 2008–2020. The study applies the spatial Durbin model to check the research hypothesis. The empirical results revealed that the EU exhibits varying levels of ESG performance. Digital transformation has the potential to enhance ESG performance and has shown significant spatial spillover effects. The SDM estimates that a 1% increase in digital inclusion results in a minimal 0.001% increase in the ESG index. The statistically significant positive effects observed in key enablers, digital public services for businesses and citizens, highlight the contribution of digitalization to improving ESG performance. In addition, technological innovation serves as a critical conduit for transmitting digital transformation in the business and public sphere to ESG performance. Given these findings, policymakers are advised to strengthen digitalization efforts to narrow the digital divide, leveraging the digital economy as a potent instrument. Additionally, a dynamic and targeted strategy for digital economic development should be implemented to address ESG performance disparities effectively.
1. Introduction
The European Union (EU) has embarked on an ambitious goal toward sustainable development and climate change mitigation with initiatives such as the European Green Deal [1,2] and the 2030 Agenda for Sustainable Development [3,4,5,6]. In this transformative era, digital technologies are reshaping the economic landscape at a rapid pace, influencing all sectors and levels of society. As a result, digital transformation is emerging as a crucial enabler for EU countries to unlock sustainable value while promoting environmental, social, and governance (ESG) efficiency [7,8,9,10].
Digital transformation holds immense potential for driving sustainable development [11,12]. By harnessing innovative technologies and data-driven solutions, countries can optimize resource utilization [13], reduce carbon emissions [14], and enhance operational efficiency across various sectors [15,16,17]. For instance, the adoption of smart grids, IoT-enabled energy management systems, and advanced analytics revolutionize the energy sector, facilitating the integration of renewable energy sources and improving energy efficiency [18,19]. Furthermore, digitalization facilitates better the monitoring, reporting, and management of environmental impacts [19,20,21,22]. The use of digital platforms and real-time data collection allow measuring and tracking of the country’s environmental performance [23], enabling them to identify areas for improvement and implement targeted sustainability measures [23]. This enhanced transparency and accountability contribute to the achievement of ESG goals. The potential of digital transformation extends beyond environmental sustainability [23,24]. It also supports social and governance objectives within the EU. Digital technologies facilitate inclusive and accessible services, ensuring that vulnerable populations are not left behind in the digital era. Additionally, digital platforms enable better stakeholder engagement, allowing citizens, businesses, and governments to collaborate and address societal challenges collectively [25,26,27,28,29,30]. ESG performance has gained significant importance as investors and consumers increasingly prioritize sustainable practices and ethical considerations. By integrating ESG factors into their decision-making processes, countries strengthen their reputation, attract investment, and tap into new market opportunities. Digital transformation plays a vital role in facilitating ESG measurement, reporting, and analysis, providing stakeholders with accurate and timely information about countries’ sustainable development [31,32].
At the same time, Miśkiewicz et al. [33] confirm that the rapid expansion of digital infrastructure, data centers, and high-tech devices can lead to a significant increase in energy consumption. This may result in higher carbon emissions and a strain on limited natural resources. Furthermore, the constant upgrading of digital devices and the disposal of obsolete electronics contribute to the growing problem of electronic waste [34,35]. The improper disposal and recycling of e-waste can lead to environmental pollution and health hazards. The automation and digitization of various processes can result in job losses and workforce displacement. Workers who are not equipped with the necessary digital skills [36,37,38,39,40,41,42,43,44] may find it challenging to transition into new roles, leading to social and economic challenges.
In this case, it is topical to identify the effect of digitalization on ESG performance for countries to develop the appropriate policy for intensifying the positive effect of digitalization on promoting sustainable values. This paper aims to test the spatial spillover effect of digitalization on ESG performance for EU countries in the period of 2008–2020. The study fills the theoretical gaps in promoting sustainable values by developing an approach for assessing the digitalization effect on ESG performance based on applying the spatial Durbin model, which highlights the interconnected nature of digitalization and its influence on ESG outcomes, emphasizing the importance of considering regional dynamics and the diffusion of digital initiatives when evaluating and enhancing ESG performance.
The paper has the following structure: the Literature Review analyses the theoretical landscape of links between digitalization and the ESG performance of the country; Materials and Methods describes the applied instruments and methods to test the research hypotheses and explain the selected variables and sources; Results describes the results of the analysis of the links between digitalization and ESG performance of the country; Discussion and Conclusion outlines the core results of the research, policy implications, limitations, and further directions for research.
2. Literature Review
The linkage between the sustainable development goals (SDGs) and digital inclusion is centered on the idea that access to digital technologies and the internet play a vital role in achieving sustainable development [45,46,47]. Digital inclusion refers to ensuring that everyone has equal access to and can effectively utilize digital technologies, such as computers, the internet, and mobile devices [47]. ICT has a direct impact on economic growth by driving productivity [48], innovation, and efficiency across various sectors. It enables the creation of new industries [49,50], improves business processes [51], and enhances competitiveness [48,49,50]. The adoption and use of ICT tools, such as digital infrastructure, telecommunications, and e-commerce, lead to increased productivity and GDP growth.
Digital inclusion can enhance the access to educational resources, online learning platforms, and digital skills training, thereby improving educational opportunities and outcomes for individuals, especially in underserved communities (which is coherent with SDG4 and the social effect within ESG performance). Kuzior [52] and Zaloznova et al. [53] confirm that digitalization promotes economic empowerment by providing access to online job opportunities, entrepreneurial resources, and digital tools for small businesses, contributing to job creation and economic growth (which is coherent with SDG8: Decent Work and Economic Growth and the social and economic effects within ESG performance). Prior studies [54] outline that digitalization provides equal access to modern infrastructure, technology, and innovation, fostering inclusive and sustainable industrialization. It is relevant to SDG 9: Industry, Innovation, and Infrastructure and allows for attaining the economic and ecological effects within ESG performance. Mahmood et al. [55] emphasize that increasing ESG performance requires relevant digital solutions. Based on the petroleum industry, scholars [55] show that digital technologies allow a decline in carbon dioxide emissions by 43% and improve the well-being of workers. Applying confirmatory factor analysis and structural equation modeling, scholars [56] confirm the close relationships between ESG performance and Industry 4.0. An earlier study [57] shows that the beneficial impact of disclosing ESG information to stakeholders promotes corporate governance and facilitates the organization’s technological and environmentally friendly digital transformation in China. Macchiavello and Siri [58] outline the close relationship between green FinTech and attaining sustainable development goals. In addition, scholars [59] highlight that green FinTech could catalyze the extension and implementation of green innovations.
Clark et al. [60] found that digitalization promotes transparent and accountable governance, citizen engagement, and access to justice through digital platforms, enhancing democratic processes and institutions. It is coherent with SDG 16: Peace, Justice, and Strong Institutions and the social and economic effects within ESG performance. Scholars [61] have explored the development of e-government in European countries, focusing on its socioeconomic and environmental aspects. Applying the TOPSIS method and based on the empirical results, they confirm the significant statistical connections between the e-government and comprehensive indicators encompassing environmental, social, and economic aspects. These findings highlight the clear and favorable influence of digitized administrative procedures on sustainable development. Moreover, scholars [61,62,63,64,65] provide evidence that investments in digital infrastructure and government e-services yield numerous long-term advantages and directly contribute to all three domains crucial for ensuring the sustainability of contemporary progress. Past studies [66,67,68] prove that enterprises with e-commerce and web sales are expected to adhere to ethical business practices and promote transparency. They can ensure fair trade, responsible sourcing, and respect for labor rights throughout their supply chains [67]. By providing clear and accurate information about products, services, and their environmental and social impacts, these enterprises contribute to transparency and accountability. Scholars [66,67,68] prove that digital technologies reduce inequalities by providing marginalized groups, including women, rural communities, and persons with disabilities, with equal access to information, services, and opportunities (SDG10: Reduced Inequalities and social effects within ESG performance). Erturk and Purdon [68] outline that by promoting digital inclusion, countries harness the power of technology to bridge gaps, empower individuals and communities, and ensure that no one is left behind on the way toward sustainable development. It requires addressing barriers such as infrastructure limitations, affordability, digital literacy [69,70,71], and gender disparities to create an inclusive digital society that benefits all. Earlier studies [72,73,74,75] show that digitalization boosts international collaboration [72], knowledge sharing [73,74,75], and capacity building [76,77], enabling partnerships and innovation [78] to accelerate progress toward ESG performance.
Scholars empirically confirm that ICT plays a pivotal role in driving economic growth [79], promoting sustainable development, and improving ESG performance. Leveraging ICT tools and technologies effectively and inclusively contributes to achieving the SDGs and enhancing environmental, social, and governance outcomes. Furthermore, considering Ghouse et al. [80], digital inclusion contributes to sustainable development by enabling a more efficient resource management, reducing environmental impacts, and supporting the transition to a carbon-free economy [81]. Scholars [82,83,84] have confirmed that smart grids, energy management systems, and IoT-based solutions optimize energy consumption, reduce greenhouse gas emissions, and enhance sustainability performance, aligning with SDG 7 (Affordable and Clean Energy) and SDG 13 (Climate Action) and ecological effects within ESG performance. In addition, the studies prove that companies with e-commerce and web sales catalyze the reduction in environmental impact and support climate action. By enabling digital transactions and reducing the need for physical infrastructure [83,84], transportation, and paper-based documentation, these companies are conducive to declining carbon emissions and conserving resources. The results of the analysis of the existing theoretical landscape show that most studies have focused on investigating the direct link between digitalization and ESG performance in attaining sustainable development. Therefore, this paper aims to analyze digitalization’s spillover effect on the ESG performance of a country. Several empirical studies [85,86,87,88,89,90,91] have investigated the spatial spillover effects of digitalization on ESG performance. For instance, researchers [85,86,87,88] have shown that countries with higher levels of digitalization tend to exhibit positive spillover effects on neighboring countries, particularly in terms of environmental performance. The diffusion of digital technologies and knowledge transfer can lead to increased environmental awareness, resource efficiency, and sustainable practices across borders [89,90]. Similarly, digitalization has been found to have positive social and governance spillover effects, fostering social connectivity, inclusive governance, and participatory decision-making processes [91]. Considering the above, the following hypothesis is proposed:
Hypothesis 1.
Digitalization has a spatial spillover effect on the ESG performance of a country.
3. Materials and Methods
3.1. Data and Sources
Based on earlier studies [7,10,24,56,57], this study used the ESG performance index as the explained variable, which contains three subindexes: ecological, social and government effects. The raw data for the ESG performance index are taken from environmental, economic, and ecological indicators by the Word Data Bank experts [92]. Considering the direction of impact, all effects are divided into inhibitors and stimulators within each subindex (Table 1). Entropy methods [93] are applied to estimate the ESG performance index. The timeframe of this study is 2008–2020, and the subject of this research is EU countries (the 27 EU member states).
Digital inclusion, key enablers, and digital public services for businesses and citizens have wide-ranging impacts on ESG performance [52,53,54,55]. These impacts span social equality, economic development, environmental sustainability, governance transparency, resource efficiency, social empowerment, and overall well-being. By leveraging digital technologies and ensuring inclusive access to digital services, organizations and societies enhance their ESG performance across multiple dimensions. Considering this and prior studies [19,22,33,36], this research applies the following explanatory variables for assessment digitalization.
Digital inclusion refers to ensuring equal access to and participation in digital technologies and services. It promotes equal opportunities and reduces the digital divide, ensuring that marginalized groups have access to digital resources [33,36]. This enhances social equality, empowers individuals and communities, and positively contributes to the social dimension of ESG performance. Access to digital technologies and skills enables individuals and businesses to participate in the digital economy [19,22]. This can drive economic growth, create job opportunities, and support sustainable development, positively impacting the economic dimension of ESG performance [22,33]. In addition, it facilitates the adoption of digital tools for remote work, teleconferencing, and e-learning, reducing the need for physical travel and infrastructure. This can contribute to lower carbon emissions, resource conservation, and environmental efficiency, positively influencing the environmental dimension of ESG performance [22,33].
Key enablers represent the infrastructure, policies, and regulations necessary for digital transformation [33,36]. Effective policies and regulations encourage the use of digital technologies for energy management, smart grid systems, and sustainable resource management [33,36]. Key enablers promote eco-friendly practices and technologies, contributing to the environmental dimension of ESG performance. It enhances governance structures, promotes transparency, and facilitates access to information.
Digital public services streamline administrative processes, improve service delivery, and reduce paperwork. This can lead to resource optimization, cost savings, and improved efficiency, positively impacting the economic dimension of ESG performance. Digital public services, such as e-health, e-government, and online education, enhance access to essential services, improve healthcare outcomes, and support lifelong learning [19,22,33,36]. Ensuring robust data protection, privacy regulations, and cybersecurity measures in digital public services enhances trust and confidence in digital systems. This promotes data privacy, safeguards personal information, and positively impacts the governance dimension of ESG performance.
Scholars [93,94,95,96,97,98] outline that green investment and trade openness have positive impacts on the ESG performance of a country. Green investment supports environmental sustainability, social development, and responsible governance, whereas trade openness can drive economic growth, foster social and cultural exchange, and influence environmental outcomes. However, it is important to manage the environmental impacts associated with trade openness to ensure a balanced and sustainable approach to ESG performance. Considering the abovementioned factors, this study applies two control variables: trade openness (TO) and green investment (GFDI).
Prior studies [93,94,95,96] confirm that including trade openness (TO) as a control variable helps account for the economic environment and global integration of a country. It can provide insights into how digitalization influences trade patterns, market access, and the potential impact on SDGs related to economic growth, employment, and industry development.
Digitalization and green investment (GFDI) have complementary effects on ESG performance [96,97,98]. For instance, digital technologies enhance the efficiency and effectiveness of green projects, facilitate the data collection and monitoring of environmental indicators, and enable sustainable practices across various sectors. Incorporating green investment allows us to understand the specific impact of digitalization on ESG performance beyond the combined effect of both factors.
The descriptive values of the independent and control variables are shown in Table 2.
3.2. Model Development
The nature of the EU data suggests that the observations might not be independent, indicating the potential presence of spatial dependency. This spatial dependency in the data is influenced by various factors, such as geographical proximity, economic interactions, shared policies, cultural influences, and spillover effects. Due to this spatial dependency, the assumption of independence among observations is violated, leading to the need to consider spatial relationships in the analysis. Importantly, ordinary regression methods assume independence among observations, and this spatial dependency challenges that assumption. Consequently, it can result in inefficient standard errors and introduce uncertainty in modeling, given the unknown nature of spatial interaction effects.
This study applies Moran’s I test, as proposed by Moran [100], to investigate the potential spatial effects of ESG performance. Moran’s I test allows for the estimating of spatial autocorrelation, addresses the nonindependence of observations, has policy implications, and provides statistically valid and robust results.
where Moran’s I measures the spatial autocorrelation; n means the number of observations or regions in the dataset; W is the sum of the weights in the spatial weights matrix, which represents the spatial relationships among regions; means the weight between region i and region j in the spatial weights matrix; are the values of the variable of ESG performance for regions i and j, respectively; and is the average value of ESG across all regions.
Moran’s I coefficient ranges from −1 to +1. A value higher than 0 indicates a positive spatial autocorrelation, meaning that similar values tend to cluster together (high ESG performance countries are surrounded by high ESG performance regions). A value less than 0 indicates negative spatial autocorrelation, where dissimilar values tend to cluster together (high ESG performance countries are surrounded by low ESG performance countries). A value close to zero indicates no significant spatial autocorrelation.
This study applies the spatial autoregressive model (SAR), spatial error model (SEM), and spatial Durbin model (SDM) to examine the relationship between digitalization and ESG performance at the country level:
Spatial autoregression model (SAR)
where ESG represents the ESG performance level of the EU countries; W is the spatial weight matrix; X is the n × k data matrix of independent variables; are coefficients of spatial impacts; and is the error term.
Spatial error model (SEM)
where M is the spatial weight matrix and is the function of unexplained error (residuals).
Spatial Durbin model (SDM)
where are the spatially weighted regressors.
The model selection process involved assessing the test results described by LeSage and Pace [101]. To capture both the dynamic and spatial effects, a fixed-effects dynamic spatial panel model is employed, allowing for the identification of the temporal and spatiotemporal lags that capture the impacts of various factors on ESG while accounting for disequilibrium shocks:
where is a fixed-effect parameter; and , , are the endogenous and exogenous spatial impacts prospectively; is the level of country digitalization expressed by DI, eGovke, eGovbuss, eGovcit; , , are coefficients of different kinds of spatial impacts; and is a residuals term.
4. Results
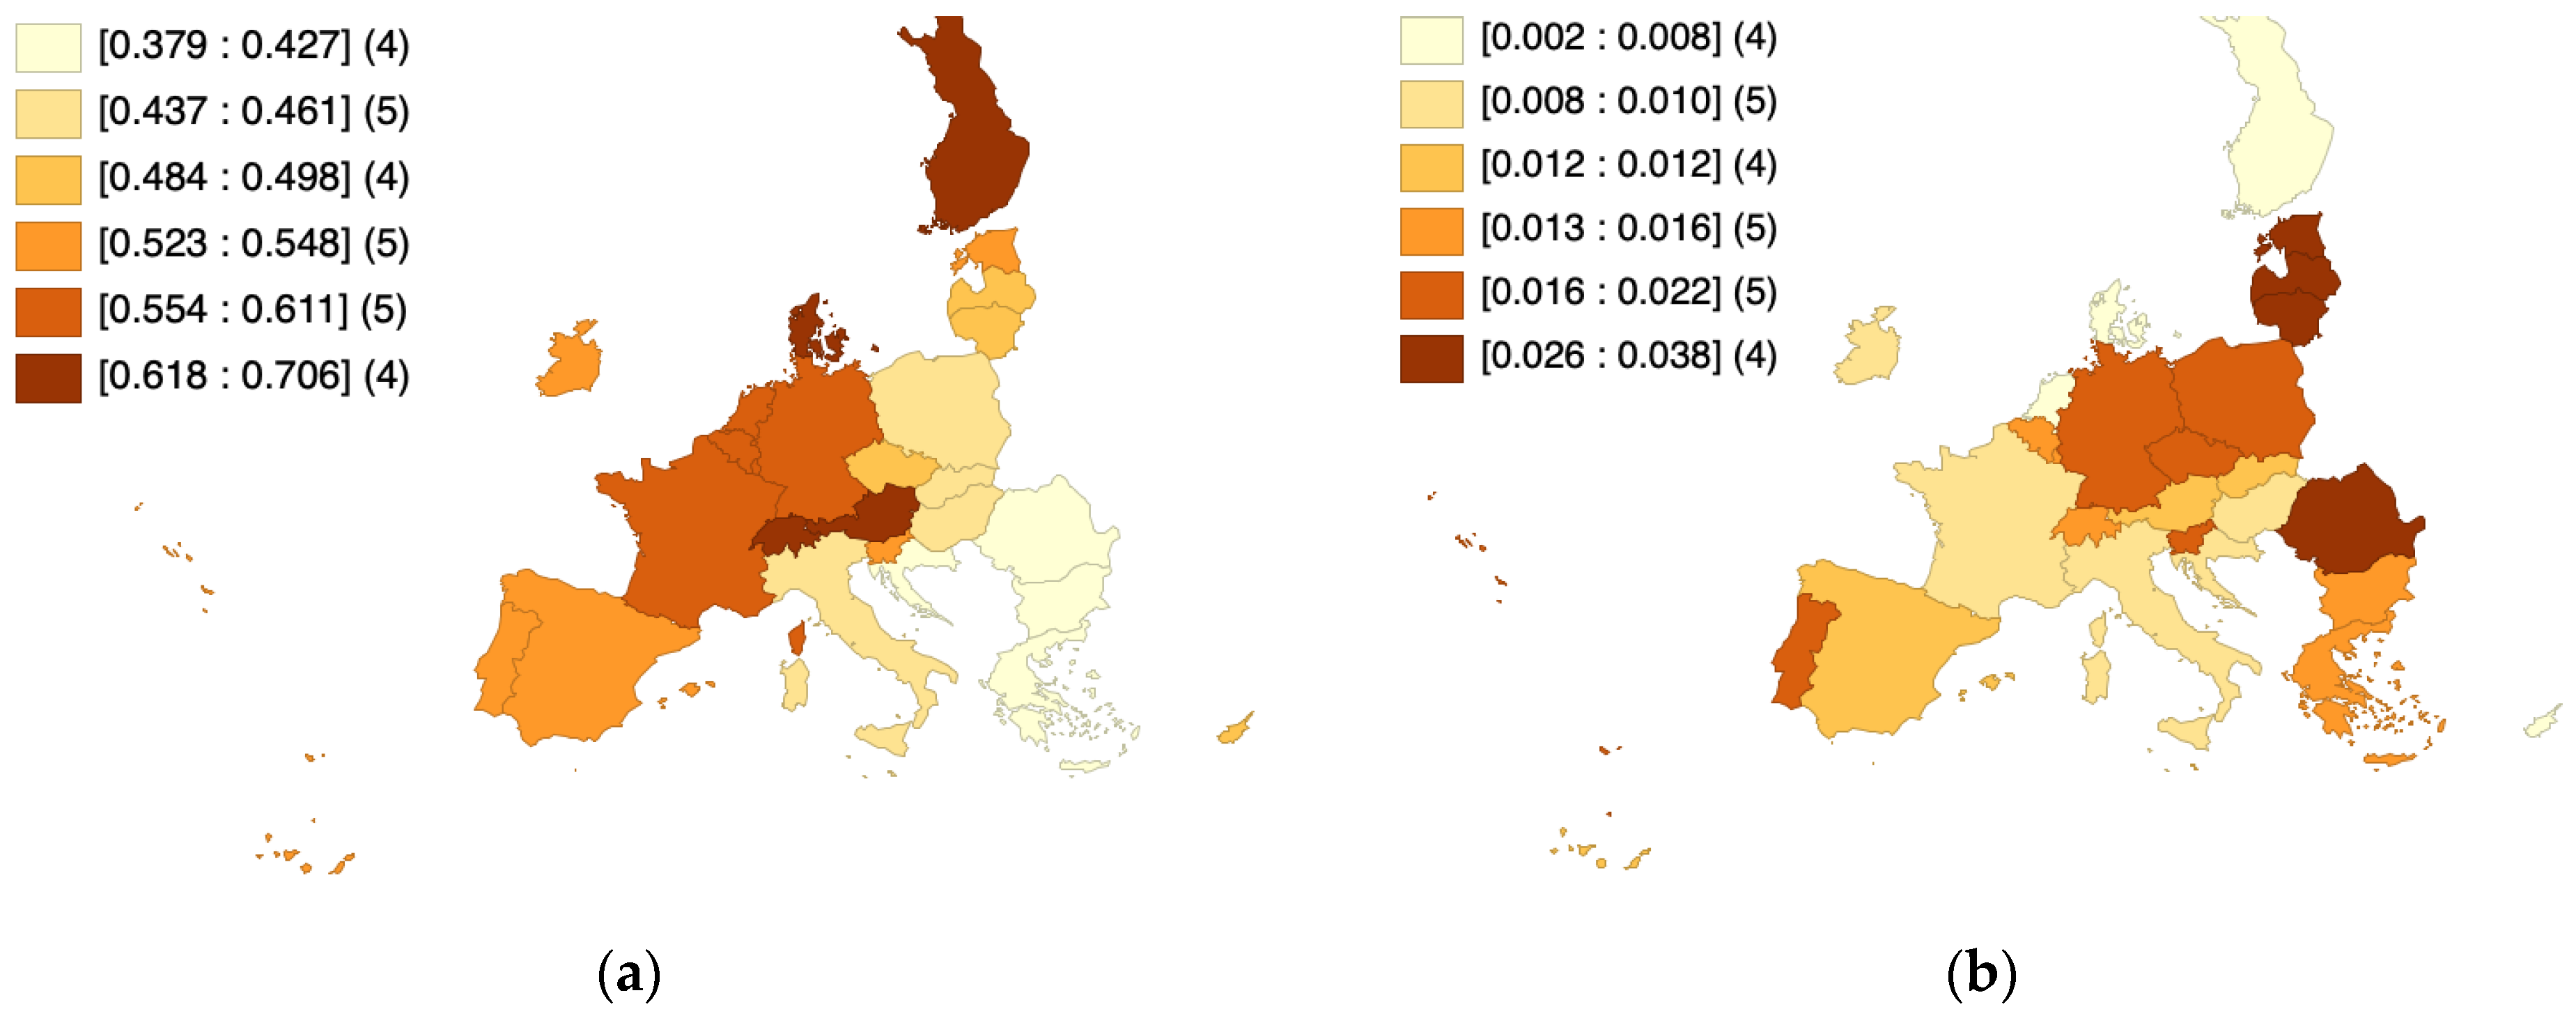
In the first stage, this study checks the spatial connection distributions of the mean and standard deviation of ESG performance within EU countries (Figure 1).
The results (Figure 1a) show that the highest average value of ESG in the interval of 0.2–0.71 for 2011–2020 is observed in the following countries: Austria, Sweden, Finland, and Denmark. These countries could serve as examples for others in terms of their successful practices and policies in promoting environmental sustainability, social responsibility, and good governance. At the same time, Romania, Bulgaria, Greece, and Croatia have the lowest ESG values (0.38–0.43). This highlights the need for targeted interventions and policies in these countries to improve their ESG performance and align with sustainable development goals. However, the fluctuation of ESG has a different pattern compared to the mean value (Figure 1b). Thus, the value of ESG has lower volatility in Greece, Finland, and Denmark. This suggests that these countries have been able to maintain more stable and consistent ESG performance over the analyzed period. Examining the policies, practices, and initiatives implemented in these countries can provide valuable insights for others looking to enhance their ESG stability and reduce fluctuations. The following EU countries have huge fluctuations in ESG values: Latvia, Lithuania, Romania, and Estonia. These countries may benefit from focused efforts to identify the underlying factors contributing to these fluctuations and to implement measures to enhance stability and improve their overall ESG performance.
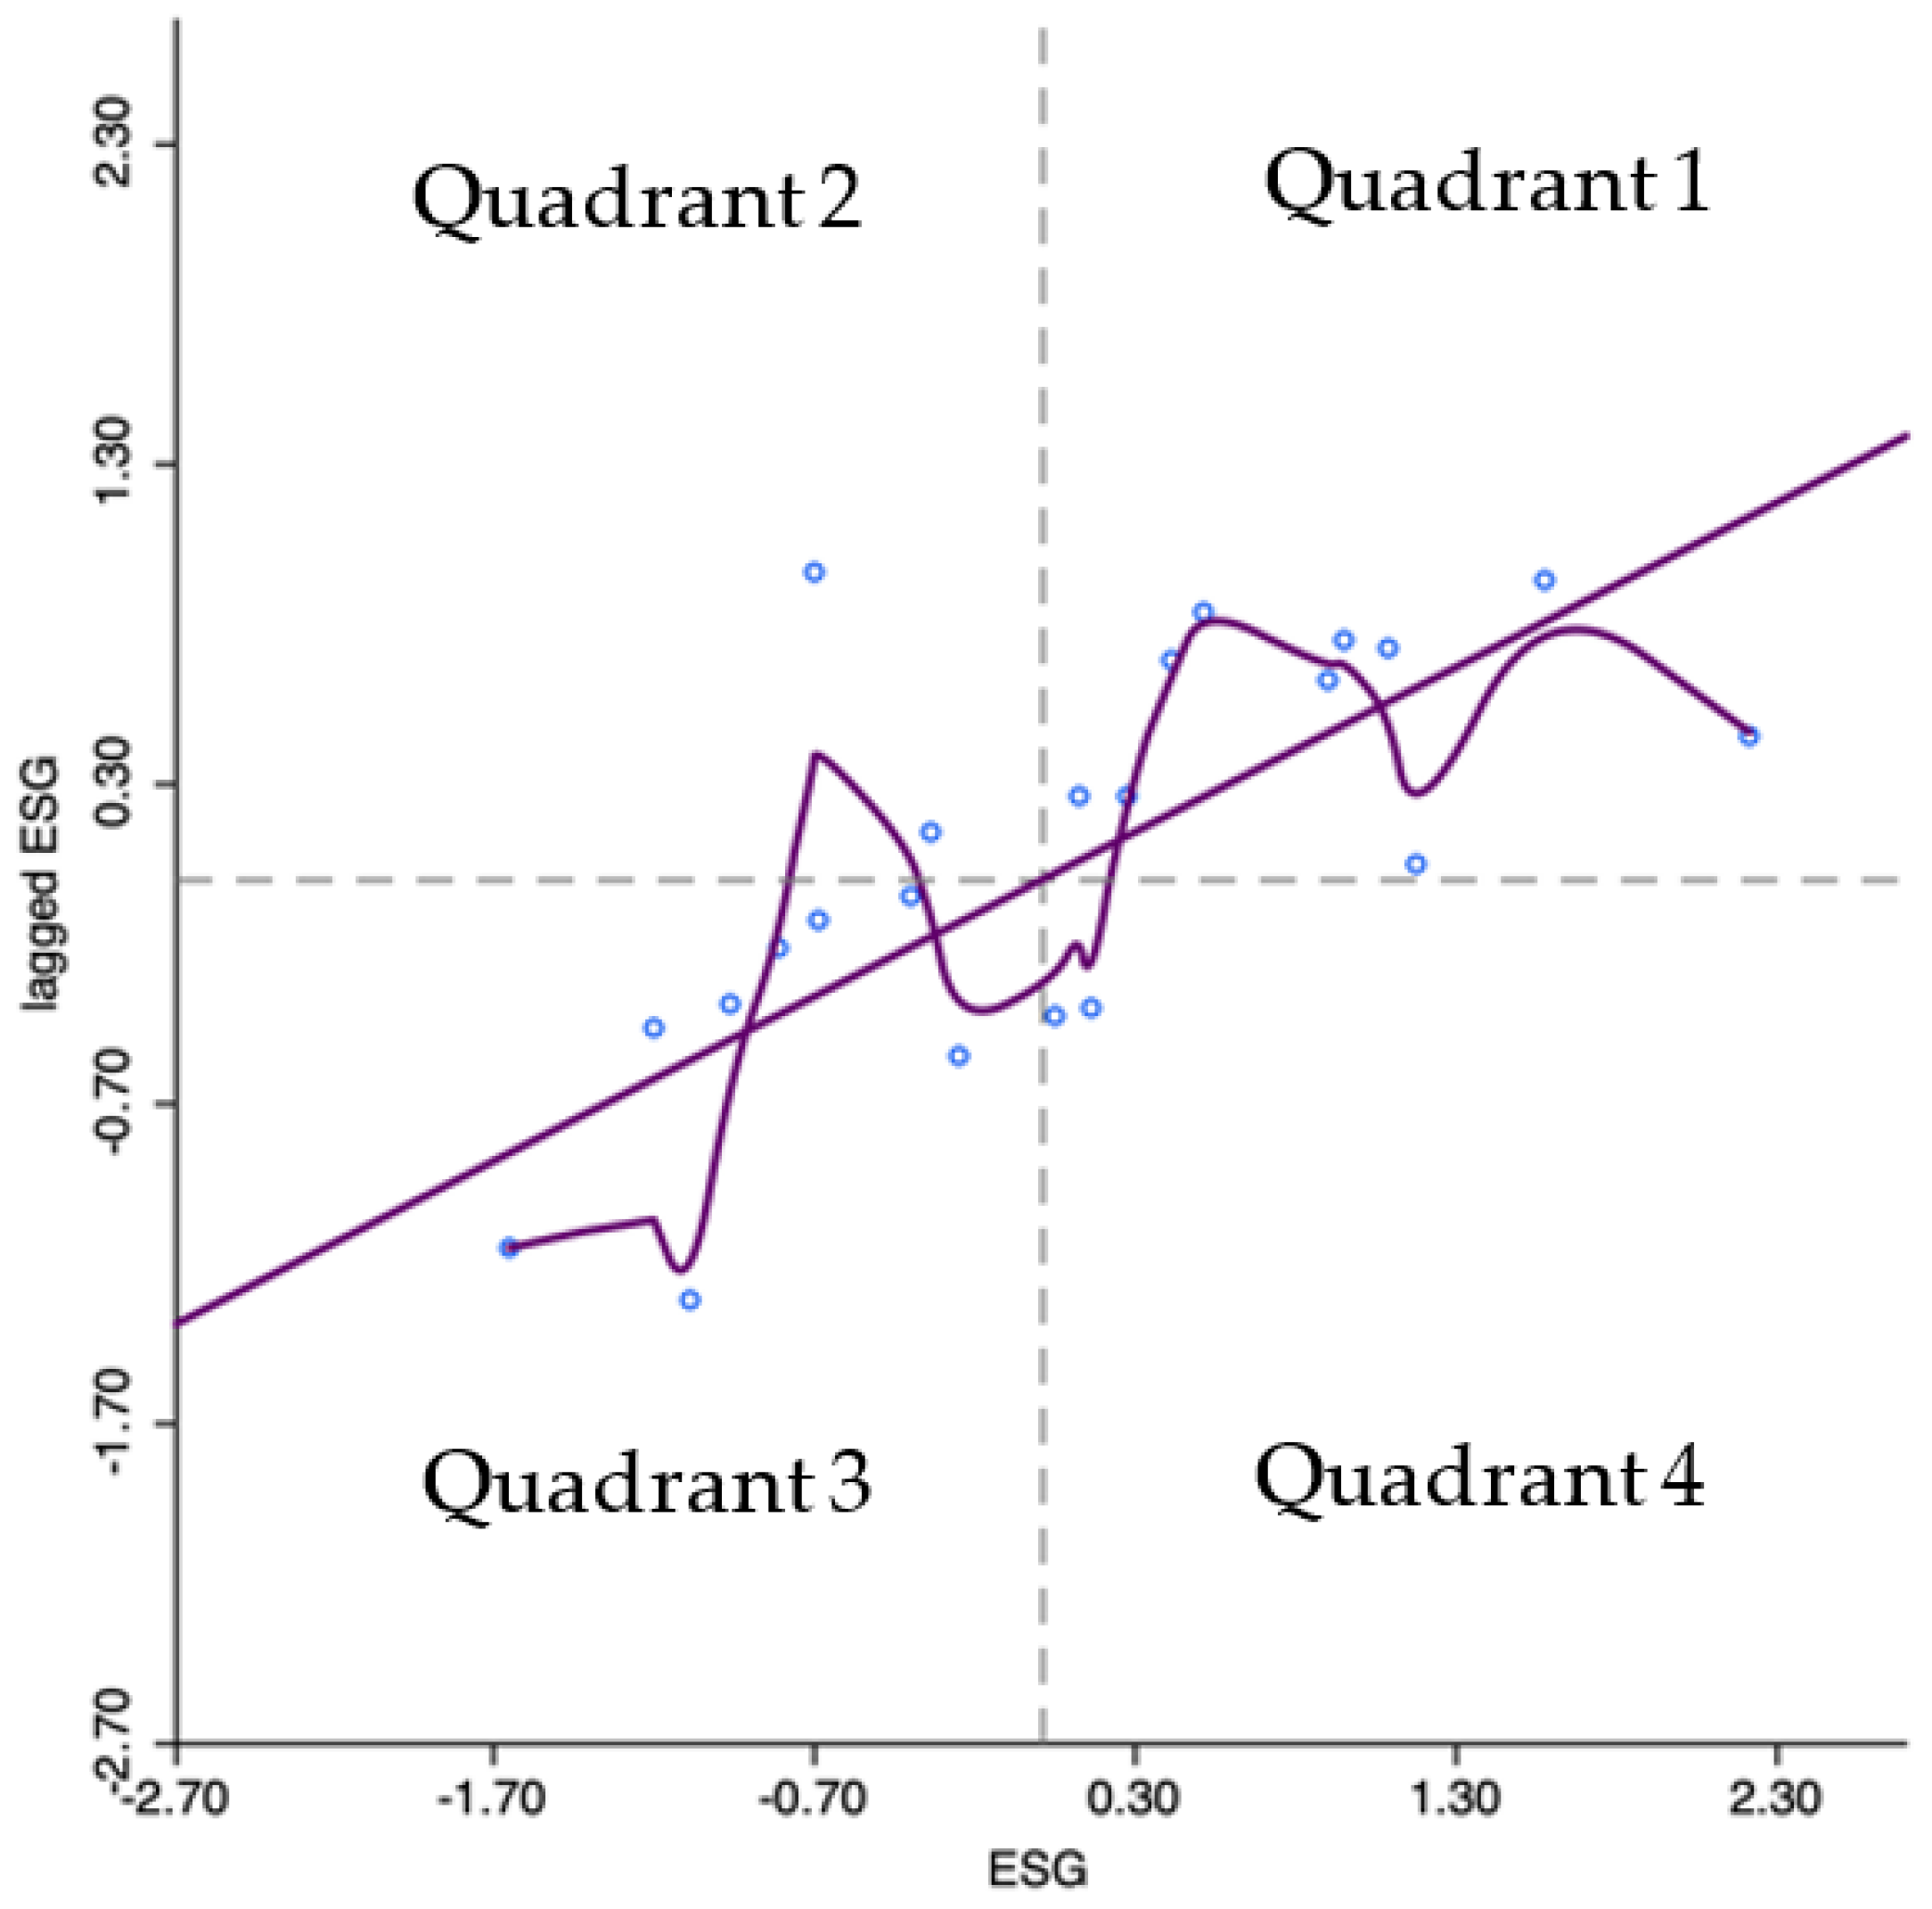
The Moran scatterplot allows the relationship between a value and the average value of its neighbors for the same variable to be checked. The findings (Figure 2) of Moran’s I show that most countries are in the 1st and 3rd quadrants. Thus, the 1st quadrant means that countries with high ESG values are surrounded by countries with high ESG values: France, Austria, Belgium, Sweden, Germany, Denmark, Spain, Portugal, Luxembourg, and the Netherlands.
The 3rd quadrant contains countries with lower ESG values and is surrounded by countries with lower ESG values. The 3rd quadrant includes the following countries: Croatia, Hungary, Bulgaria, Greece, Romania, Slovakia, Lithuania, Latvia, and Poland. This confirms the positive spatial autocorrelation. The 4th quadrant (low value is surrounded by high value) contains Estonia and Slovenia. The second cluster (high value is surrounded by lower value) contains Czechia and Italy. The results allow for outlining the cluster effects, which means that countries with similar ESG values are likely to be located in closed areas.
To evaluate the presence of spatial relationships, a nonspatial panel model was employed as a point of comparison with the spatial panel model. The outcomes presented in Table 3 reveal that augmenting digital inclusion, fortifying key enablers, expanding digital public services for businesses, and offering digital public services for citizens have statistically significant positive effects on ESG. These findings suggest that the adoption of digitalization initiatives and the leveraging of digital technologies and services can contribute to enhanced ESG performance. The growth of increases ESG performance by 0.390 in the model with digital inclusion, by 0.089 in the model with eGovke, by 0.137 in the model with eGovbuss, and by 0.165 in the model with eGovcit. All results are statistically significant with a probability of 0.000.
To examine the persistence of the observed effects in geographic space, a spatial model was employed for verification and assessment. The first two rows of Table 4 compare the spatial autoregressive (SAR) model with the spatial Durbin model (SDM) and the spatial error model (SEM) with the SDM. For each digitalization variable (DI, eGovke, eGovbuss, eGovcit), the chi-square test statistic () and its corresponding p value (all equal to 0.000) indicate that there is strong enough evidence to reject the null hypothesis, suggesting that the SDM is a more suitable model than both the SAR and SEM for analyzing the relationship between ESG and . The results of the Hausman test, reported in the third row of Table 4, reveal significant chi-square test statistics () and corresponding p values (0.001, 0.031, 0.045, and 0.000). These findings strongly reject the null hypothesis, suggesting that the fixed-effects spatial Durbin model (SDM) is the appropriate model to detect the impact of digitalization on ESG.
The results of the SDM models (Table 5) suggest that digitalization has a positive impact on ESG, with varying degrees of significance depending on the specific independent variables (DI, eGovke, eGovbuss, eGovcit) included in each model. The coefficient for the main effect of DI is 0.048 (significant at 0.002), indicating a positive impact of digitalization on ESG. It suggests that policies and initiatives aimed at promoting digital inclusion contribute to improving ESG performance. The EU should focus on enhancing digital accessibility, bridging the digital divide, and ensuring equal opportunities for individuals and businesses to access and utilize digital technologies. This can include measures such as improving internet infrastructure, providing affordable access to digital services, and promoting digital literacy and skills development.
However, the coefficients for TO and GFDI are not statistically significant, suggesting that trade openness and green field investment do not have a significant impact on ESG in this model. It is important to note that trade openness could still have indirect effects on ESG performance. Policymakers should consider integrating sustainability criteria into trade agreements and promoting sustainable practices within international trade. This can include measures to encourage environmentally friendly production processes, the responsible sourcing of raw materials, and the adoption of sustainable supply chain management practices. In addition, the EU should create an enabling environment for green investment by offering incentives for sustainable investments, promoting green technologies and innovation, and ensuring transparent and accountable governance frameworks to monitor and regulate environmental impacts.
On the other hand, eGovke has a positive and significant impact on ESG with a coefficient of 0.011 (significant at 0.010) and a significant positive effect on GFDI. This suggests that the EU should focus on developing and implementing digital platforms and services that facilitate business operations, promote sustainability practices, and enhance collaboration between businesses and government entities.
Furthermore, both eGovbuss and eGovcit exhibit a positive impact on ESG, with both TO and GFDI showing significant positive associations. This suggests that investing in digital public services for citizens contributes to improving the overall ESG performance. The EU should prioritize the development of user-friendly digital platforms and services that enable citizens to access essential public services, participate in decision-making processes, and engage in sustainable behaviors. It could include enhancing online platforms for e-government services, digital channels for citizen engagement, and initiatives promoting digital inclusion among marginalized and vulnerable groups.
In all models (Table 5), the coefficients for the main effect of Digital in the Wx term are significant and positive, indicating a positive spatial spillover effect. This suggests that higher levels of digitalization in neighboring regions positively affect the ESG performance of the targeted region. The spatial rho values in all models are positive and statistically significant, suggesting the presence of spatial autocorrelation in the data. This implies that there is a spatial pattern or clustering in the relationship between digitalization, trade openness, green field investment, and ESG performance. The variance of sigma2_e represents the error variance in the model, capturing the unexplained variation in the dependent variable (ESG) not accounted for by the independent variables. In all models, the sigma2_e variance values are small and statistically significant at 0.000. This indicates a low level of unexplained variation, suggesting that the models effectively capture the relationships between the independent variables and ESG performance.
The regression results presented in Table 6 demonstrate a significant and positive effect of the lagged value of ESG on the current value of ESG, underscoring the persistence of ESG performance over time. This finding emphasizes the need for sustained efforts and long-term strategies in fostering and maintaining a positive ESG performance. By recognizing the lasting influence of historical ESG practices, stakeholders can better understand the importance of continuous commitment to sustainable practices and policies. The variable DI (Digital Inclusion) exhibits a statistically significant yet relatively modest positive effect on ESG. This suggests that initiatives aimed at improving digital inclusion can contribute favorably to ESG outcomes. More precisely, the dynamic SDM model estimates that a 1% increase in DI results in a minimal 0.001% increase in the ESG index. These findings align with prior studies [102,103], providing further validation of the significance of digital inclusion in advancing ESG objectives. The statistically significant positive effects observed in the variables eGovke (Key Enablers), eGovbuss (Digital Public Services for Businesses), and eGovcit (Digital Public Services for Citizens) highlight the contribution of digitalization to improving ESG performance. These findings suggest that the digitalization of key enablers and the provision of digital public services for businesses and citizens play a crucial role in fostering positive ESG outcomes. One plausible explanation for these positive impacts is that digitalization enhances the efficiency, transparency, and accessibility of ESG-related processes and information. By leveraging digital platforms and services, organizations can streamline the reporting and monitoring of environmental practices, facilitate stakeholder engagement, and empower individuals and businesses to make more sustainable choices. The EU has been actively promoting digitalization across various ESG domains [104]. However, to fully realize the potential positive impacts on ESG, further improvements in digitalization strategies and infrastructure are necessary. Government interventions aimed at enhancing ESG performance should prioritize refining digitalization strategies and infrastructure to effectively leverage digital technologies and services. It allows us to boost progress in ESG areas and contribute to a more sustainable and inclusive future.
Additionally, the coefficients of greenfield investment (GFDI) in all dynamic SDM models are found to be significantly positive at the 1% level, indicating a positive association between GFDI and ESG outcomes. Specifically, according to the dynamic SDM model, a 1% increase in GFDI corresponds to a 0.002–0.004% increase in ESG. One possible explanation for these positive impacts is that the allocation of resources toward greenfield investments can promote sustainable practices and technologies, thereby positively influencing ESG performance. Across all models of dynamic SDM, the coefficients associated with the main effect of Digital in the Wx term consistently display statistical significance and a positive direction. These findings provide evidence of a positive spatial spillover effect, indicating that increased levels of digitalization in neighboring regions have a beneficial impact on the ESG performance of the focal region. The results highlight the interconnected nature of digitalization and its influence on ESG outcomes, emphasizing the importance of considering regional dynamics and the diffusion of digital initiatives when evaluating and enhancing ESG performance.
Table 7 presents the direct, indirect, and total effects of digitalization on ESG. The coefficients for both the direct and indirect effects of DI (Digital Inclusion), eGovke (Key Enablers), eGovbuss (Digital Public Services for Businesses), and eGovcit (Digital Public Services for Citizens) on ESG are positive, indicating a beneficial influence. These results support the hypothesis that digitalization has a spatial effect on ESG performance. Notably, the indirect effect coefficients of DI, eGovke, eGovbuss, and eGovcit on ESG are all significant with p values of 0.000, indicating a strong statistical relationship. This finding is in line with prior research [24,64] and suggests that digitalization initiatives focusing on these areas have a significant impact on promoting positive ESG outcomes.
Considering the other variables, TO (trade openness) and GFDI (greenfield investment), their coefficients and probabilities indicate mixed results. In general, the coefficients for TO show relatively weak and statistically insignificant effects on ESG. However, the coefficients for GFDI suggest a statistically significant positive impact on ESG, with probabilities ranging from 0.027 to 0.051, indicating the potential importance of greenfield investments in promoting ESG outcomes.
5. Discussion
The abovementioned findings provide valuable insights into the complex relationship between digitalization and ESG performance. The evidence strongly suggests that digitalization has a significant and positive direct impact on ESG performance within individual countries. Moreover, the spillover effect observed indicates that the benefits of digitalization extend beyond national borders, positively influencing ESG performance in neighboring countries as well. This interconnectedness highlights the global nature of the impact of digitalization on sustainability and responsible business practices.
The positive spatial effect of digitalization on ESG performance, as supported by studies [45,46,47,53,54,55,56], indicates that as digital technologies advance and become more prevalent in a region or group of countries, the overall sustainability and environmental, social, and governance performance of those countries tend to improve. This finding holds particular promise for international cooperation and collaboration in fostering sustainable development, as countries can potentially work together to harness the benefits of digitalization for a more sustainable future.
However, it is crucial to acknowledge the contrasting results presented by studies [102,103,104], which propose a U-shaped impact of digitalization on ESG effects. This U-shaped pattern implies that, initially, as digitalization progresses, there may be challenges or negative consequences for certain aspects of ESG performance. These studies might highlight specific concerns related to the rapid adoption of digital technologies, such as environmental impacts, privacy issues, or unequal access to technology, which could affect ESG metrics.
The existence of both positive and U-shaped impacts of digitalization on ESG performance warrants further exploration and examination. It could be indicative of differing circumstances and contexts in which digitalization is deployed, underscoring the need for tailored approaches to sustainability strategies based on a country’s unique characteristics, policies, and development stages.
6. Conclusions
Based on the aforementioned findings, it can be inferred that digitalization has a favorable impact on Environmental, Social, and Governance (ESG) performance, both directly and through spillover effects. This indicates that as digitalization increases in neighboring countries, it positively influences the ESG performance of all countries involved. These results highlight the interconnectedness and potential benefits of embracing digitalization for sustainable development and responsible business practices globally.
Considering the abovementioned results, the following policy implication could be outlined:
- Policymakers should prioritize initiatives that aim to bridge the digital divide and ensure equal access to digital technologies and services. This includes providing affordable internet access [12] and digital literacy programs [41]. By promoting digital inclusion, countries can create a more equitable and inclusive digital society [9].
- Governments should reinforce the development of robust digital infrastructure [19,33], such as high-speed internet connectivity, reliable data networks, and advanced technology platforms. By investing in key enablers, countries can create an enabling environment for digital innovation [17,18], entrepreneurship [23,34], and sustainable economic growth [19,21], ultimately contributing to an enhanced ESG performance.
- EU policymakers should prioritize the development and expansion of digital public services for businesses and citizens. This includes digital platforms for e-government services [33], online business registration [46,49,51], electronic tax filing, and access to digital healthcare and education [66,73]. By streamlining administrative processes, reducing bureaucracy, and improving access to essential services, countries can enhance their efficiency, transparency, and sustainability.
- It is necessary to pursue policies that promote open and inclusive trade practices. This includes reducing trade barriers, facilitating cross-border digital transactions, and fostering international collaboration. It allows the exchange of knowledge [43,44], technology [55], and sustainable practices [48,49] to be boosted, leading to an improved ESG performance through an enhanced global cooperation.
- EU countries should continue to develop the relevant mechanisms for creating an attractive climate for green investments and sustainable business practices. This involves implementing supportive policies, such as tax incentives, subsidies, and regulations that promote clean energy, resource efficiency, and environmentally friendly technologies [74,102,105,106,107]. By attracting and incentivizing green investments, the EU could drive the transition toward a low-carbon economy [14,21,66] and promote sustainable development.
Despite the valuable findings, this study could be further advanced in the following aspects. While the paper identifies a correlation between digital transformation and ESG performance, it is important to note that correlation does not imply causation. The study does not establish a causal relationship between digitalization and an improved ESG performance, as there may be other factors at play that contribute to these outcomes. EU countries exhibit varying levels of economic development, digital readiness, and ESG performance. The heterogeneity among countries may introduce additional complexities and nuances that may not be fully captured in the analysis. Further investigations require extending the list of control variables which could have influenced the results. Additionally, it is necessary to conduct sensitivity analyses to assess the robustness of the findings against potential confounding variables.
Author Contributions
Conceptualization, A.K., O.L. and T.P.; methodology, A.K., O.L. and T.P.; software, A.K., O.L. and T.P.; validation, A.K., O.L. and T.P.; formal analysis, A.K., O.L. and T.P.; investigation, A.K., O.L. and T.P.; resources, A.K., O.L. and T.P.; data curation, A.K., O.L. and T.P.; writing—original draft preparation, A.K., O.L. and T.P.; writing—review and editing, A.K., O.L. and T.P.; visualization, A.K., O.L. and T.P. All authors have read and agreed to the published version of the manuscript.
Funding
This research was funded by the Ministry of Education and Science of Ukraine, 0121U100468.
Data Availability Statement
Not applicable.
Conflicts of Interest
The authors declare no conflict of interest.
References
- Green Deal: Key to a Climate-Neutral and Sustainable EU. Available online: https://www.europarl.europa.eu/news/en/headlines/society/20200618STO81513/green-deal-key-to-a-climate-neutral-and-sustainable-eu?&at_campaign=20234-Green&at_medium=Google_Ads&at_platform=Search&at_creation=RSA&at_goal=TR_G&at_audience=european%20green%20deal&at_topic=Green_Deal&at_location=IT&gclid=Cj0KCQjw7PCjBhDwARIsANo7Cgl3pgtGVVgGxDHV497xfcmvi4iXXliDPb6R0bzfLGM5eBwIooteyF0aAg__EALw_wcB (accessed on 10 April 2023).
- A European Green Deal. Available online: https://commission.europa.eu/strategy-and-policy/priorities-2019-2024/european-green-deal_en (accessed on 10 April 2023).
- UN Agenda 2030. Available online: https://www.coe.int/en/web/programmes/un-2030-agenda#:~:text=The%202030%20Agenda%20for%20Sustainable,equality%20and%20non%2Ddiscrimination (accessed on 10 April 2023).
- Pudryk, D.; Kwilinski, A.; Lyulyov, O.; Pimonenko, T. Toward Achieving Sustainable Development: Interactions between Migration and Education. Forum Sci. Oeconomia 2023, 11, 113–132. [Google Scholar] [CrossRef]
- Chen, Y.; Lyulyov, O.; Pimonenko, T.; Kwilinski, A. Green development of the country: Role of macroeconomic stability. Energy Environ. 2023. [Google Scholar] [CrossRef]
- Transforming Our World: The 2030 Agenda for Sustainable Development. Available online: https://sdgs.un.org/2030agenda (accessed on 10 April 2023).
- Puriwat, W.; Tripopsakul, S. From ESG to DESG: The Impact of DESG (Digital Environmental, Social, and Governance) on Customer Attitudes and Brand Equity. Sustainability 2022, 14, 10480. [Google Scholar] [CrossRef]
- Saxena, A.; Singh, R.; Gehlot, A.; Akram, S.V.; Twala, B.; Singh, A.; Montero, E.C.; Priyadarshi, N. Technologies Empowered Environmental, Social, and Governance (ESG): An Industry 4.0 Landscape. Sustainability 2023, 15, 309. [Google Scholar] [CrossRef]
- Verina, N.; Titko, J.; Shina, I. Digital transformation outcomes in higher education: Pilot study in Latvia. Int. J. Learn. Chang. 2021, 13, 459–473. [Google Scholar] [CrossRef]
- Popescu, C.; Hysa, E.; Kruja, A.; Mansi, E. Social Innovation, Circularity and Energy Transition for Environmental, Social and Governance (ESG) Practices—A Comprehensive Review. Energies 2022, 15, 9028. [Google Scholar] [CrossRef]
- Hoyos Muñoz, J.A.; Cardona Valencia, D. Trends and challenges of digital divide and digital inclusion: A bibliometric analysis. J. Inf. Sci. 2023. [Google Scholar] [CrossRef]
- Vyshnevskyi, O. Unity of digital and virtual economies within concept of dataism. Virtual Econ. 2019, 2, 7–21. [Google Scholar] [CrossRef]
- Riesener, M.; Dölle, C.; Mattern, C.; Kreß, J. Circular economy: Challenges and potentials for the manufacturing industry by digital transformation. In Proceedings of the 2019 IEEE International Symposium on Innovation and Entrepreneurship (TEMS-ISIE), Hangzhou, China, 24–26 October 2019; pp. 1–7. [Google Scholar]
- Shang, Y.; Raza, S.A.; Huo, Z.; Shahzad, U.; Zhao, X. Does enterprise digital transformation contribute to the carbon emission reduction? Microlevel evidence from China. Int. Rev. Econ. Financ. 2023, 86, 1–13. [Google Scholar] [CrossRef]
- Maroufkhani, P.; Desouza, K.C.; Perrons, R.K.; Iranmanesh, M. Digital transformation in the resource and energy sectors: A systematic review. Resour. Policy 2022, 76, 102622. [Google Scholar] [CrossRef]
- Skvarciany, V.; Jurevičienë, D. An approach to the measurement of the digital economy. Forum Sci. Oeconomia 2021, 9, 89–102. [Google Scholar] [CrossRef]
- Zhai, H.; Yang, M.; Chan, K.C. Does digital transformation enhance a firm’s performance? Evidence from China. Technol. Soc. 2022, 68, 101841. [Google Scholar] [CrossRef]
- Kharazishvili, Y.; Kwilinski, A.; Sukhodolia, O.; Dzwigol, H.; Bobro, D.; Kotowicz, J. The systemic approach for estimating and strategizing energy security: The case of Ukraine. Energies 2021, 14, 2126. [Google Scholar] [CrossRef]
- Miśkiewicz, R. The Impact of Innovation and Information Technology on Greenhouse Gas Emissions: A Case of the Visegrád Countries. J. Risk Financ. Manag. 2021, 14, 59. [Google Scholar] [CrossRef]
- Kwilinski, A.; Slatvitskaya, I.; Dugar, T.; Khodakivska, L.; Derevyanko, B. Main Effects of Mergers and Acquisitions in International Enterprise Activities. Int. J. Entrep. 2020, 24, 1–8. [Google Scholar]
- Chygryn, O.; Kuzior, A.; Olefirenko, O.; Uzik, J. Green Brand as a New Pattern of Energy-Efficient Consumption. Mark. Manag. Innov. 2022, 3, 78–87. [Google Scholar] [CrossRef]
- Miśkiewicz, R.; Rzepka, A.; Borowiecki, R.; Olesińki, Z. Energy Efficiency in the Industry 4.0 Era: Attributes of Teal Organizations. Energies 2021, 14, 6776. [Google Scholar] [CrossRef]
- Perotto, E.; Canziani, R.; Marchesi, R.; Butelli, P. Environmental performance, indicators and measurement uncertainty in EMS context: A case study. J. Clean. Prod. 2008, 16, 517–530. [Google Scholar] [CrossRef]
- Ahmadova, G.; Delgado-Márquez, B.L.; Pedauga, L.E.; Leyva-de la Hiz, D.I. Too good to be true: The inverted U-shaped relationship between home-country digitalization and environmental performance. Ecol. Econ. 2022, 196, 107393. [Google Scholar] [CrossRef]
- Carrasco-Farré, C.; Snihur, Y.; Berrone, P.; Ricart, J.E. The stakeholder value proposition of digital platforms in an urban ecosystem. Res. Policy 2022, 51, 104488. [Google Scholar] [CrossRef]
- Dementyev, V.; Dalevska, N.; Kwilinski, A. Innovation and Information Aspects of the Structural Organization of the World Political and Economic Space. Virtual Econ. 2021, 4, 54–76. [Google Scholar] [CrossRef]
- Hussain, H.I.; Haseeb, M.; Kamarudin, F.; Dacko-Pikiewicz, Z.; Szczepańska-Woszczyna, K. The role of globalization, economic growth and natural resources on the ecological footprint in Thailand: Evidence from nonlinear causal estimations. Processes 2021, 9, 1103. [Google Scholar] [CrossRef]
- Zhanibek, A.; Abazov, R.; Khazbulatov, A. Digital Transformation of a Country’s Image: The Case of the Astana International Finance Centre in Kazakhstan. Virtual Econ. 2022, 5, 71–94. [Google Scholar] [CrossRef] [PubMed]
- Miśkiewicz, R. Challenges facing management practice in the light of Industry 4.0: The example of Poland. Virtual Econ. 2019, 2, 37–47. [Google Scholar] [CrossRef] [Green Version]
- Katsamakas, E.; Miliaresis, K.; Pavlov, O.V. Digital Platforms for the Common Good: Social Innovation for Active Citizenship and ESG. Sustainability 2022, 14, 639. [Google Scholar] [CrossRef]
- Baker, C. Derivatives and ESG. Am. Bus. Law J. 2022, 59, 725–772. [Google Scholar] [CrossRef]
- Klungseth, N.J.; Nielsen, S.B.; Alves da Graça, M.E.; Lavy, S. Research and evidence-based standards paving the way for a digital and sustainable transformation of the built environment. Facilities 2023, 41, 454–475. [Google Scholar] [CrossRef]
- Miśkiewicz, R.; Matan, K.; Karnowski, J. The Role of Crypto Trading in the Economy, Renewable Energy Consumption and Ecological Degradation. Energies 2022, 15, 3805. [Google Scholar] [CrossRef]
- Tang, Z.; Chen, L. Understanding seller resistance to digital device recycling platform: An innovation resistance perspective. Electron. Commer. Res. Appl. 2022, 51, 101114. [Google Scholar] [CrossRef]
- Alblooshi, B.G.K.M.; Ahmad, S.Z.; Hussain, M.; Singh, S.K. Sustainable management of electronic waste: Empirical evidence from a stakeholders’ perspective. Bus. Strategy Environ. 2022, 31, 1856–1874. [Google Scholar] [CrossRef]
- Miśkiewicz, R. The importance of knowledge transfer on the energy market. Polityka Energetyczna 2018, 21, 49–62. [Google Scholar] [CrossRef]
- Dacko-Pikiewicz, Z. Building a family business brand in the context of the concept of stakeholder-oriented value. Forum Sci. Oeconomia 2019, 7, 37–51. [Google Scholar] [CrossRef]
- Dzwigol, H. Research Methodology in Management Science: Triangulation. Virtual Econ. 2022, 5, 78–93. [Google Scholar] [CrossRef] [PubMed]
- Melnychenko, O. Application of artificial intelligence in control systems of economic activity. Virtual Econ. 2019, 2, 30–40. [Google Scholar] [CrossRef] [Green Version]
- Jamel, L.; Ben Ltaifa, M.; Elnagar, A.K.; Derbali, A.; Lamouchi, A. The nexus between education and economic growth: Analyzing empirically a case of middle-income countries. Virtual Econ. 2020, 3, 43–60. [Google Scholar] [CrossRef]
- Szczepańska-Woszczyna, K.; Gatnar, S. Key Competences of Research and Development Project Managers in High Technology Sector. Forum Sci. Oeconomia 2022, 10, 107–130. [Google Scholar] [CrossRef]
- Trzeciak, M.; Jonek-Kowalska, I. Monitoring and Control in Program Management as Effectiveness Drivers in Polish Energy Sector. Diagnosis and Directions of Improvement. Energies 2021, 14, 4661. [Google Scholar] [CrossRef]
- Dzwigol, H.; Aleinikova, O.; Umanska, Y.; Shmygol, N.; Pushak, Y. An Entrepreneurship Model for Assessing the Investment Attractiveness of Regions. J. Entrep. Educ. 2019, 22, 1–7. [Google Scholar]
- Trzeciak, M.; Kopec, T.P.; Kwilinski, A. Constructs of Project Programme Management Supporting Open Innovation at the Strategic Level of the Organization. J. Open Innov. Technol. Mark. Complex. 2022, 8, 58. [Google Scholar] [CrossRef]
- Trushkina, N. Development of the information economy under the conditions of global economic transformations: Features, factors and prospects. Virtual Econ. 2019, 2, 7–25. [Google Scholar] [CrossRef]
- Sadigov, R. Impact of Digitalization on Entrepreneurship Development in the Context of Business Innovation Management. Mark. Manag. Innov. 2022, 1, 167–175. [Google Scholar] [CrossRef]
- Lahouirich, M.W.; Oulfarsi, S.; Eddine, A.S.; Sakalli, H.E.B.; Boutti, R. From financial performance to sustainable development: A great evolution and an endless debate. Financ. Mark. Inst. Risks 2022, 6, 68–79. [Google Scholar] [CrossRef]
- Gajdzik, B.; Grabowska, S.; Saniuk, S. Key socioeconomic megatrends and trends in the context of the industry 4.0 framework. Forum Sci. Oeconomia 2021, 9, 5–21. [Google Scholar] [CrossRef]
- Belhadi, A.; Abdellah, N.; Nezai, A. The Effect of Big Data on the Development of the Insurance Industry. Bus. Ethics Leadersh. 2023, 7, 1–11. [Google Scholar] [CrossRef]
- Gurbanov, N.; Yagublu, N.; Akbarli, N.; Niftiyev, I. Digitalization and the Covid-19-led public crisis management: An evaluation of financial sustainability in the Azerbaijan business sector. SocioEcon. Chall. 2022, 6, 23–38. [Google Scholar] [CrossRef]
- Bilan, S.; Šuleř, P.; Skrynnyk, O.; Krajňáková, E.; Vasilyeva, T. Systematic bibliometric review of artificial intelligence technology in organizational management, development, change and culture. Bus. Theory Pract. 2022, 23, 1–13. [Google Scholar] [CrossRef]
- Kuzior, A. Technological unemployment in the perspective of Industry 4.0 development. Virtual Econ. 2022, 5, 7–23. [Google Scholar] [CrossRef]
- Zaloznova, Y.; Pankova, O.; Ostafiichuk, Y. Global and Ukrainian labor markets in the face of digitalization challenges and the threats of the COVID-19 pandemic. Virtual Econ. 2020, 3, 106–130. [Google Scholar] [CrossRef] [PubMed]
- Pietrzak, P.; Takala, J. Digital trust–asystematic literature review. Forum Sci. Oeconomia 2021, 9, 59–71. [Google Scholar] [CrossRef]
- Mahmood, A.; Thibodeaux, R.; Angelle, J.; Smith, L. Digital transformation for promoting renewable energy & sustainability: A systematic approach for carbon footprint reduction in well construction. In Proceedings of the Annual Offshore Technology Conference, Houston, TX, USA, 2–5 May 2022. [Google Scholar] [CrossRef]
- Nitlarp, T.; Kiattisin, S. The impact factors of industry 4.0 on ESG in the energy sector. Sustainability 2022, 14, 9198. [Google Scholar] [CrossRef]
- Pan, C.-L.; Yu, Y.-L.; Xu, Y.-C.; Huang, K.; Gao, F.-J.; Xu, H.-N.; Chen, W.-S.; Xie, J.-T. ESG and carbon disclosure practices in China: An analysis of PwC China’s tech-enabled approach. In Proceedings of the 2022 IEEE Technology and Engineering Management Society Conference—Asia Pacific (TEMSCON-ASPAC), Bangkok, Thailand, 19–22 September 2022; pp. 96–100. [Google Scholar] [CrossRef]
- Macchiavello, E.; Siri, M. Sustainable finance and fintech: Can technology contribute to achieving environmental goals? A preliminary assessment of ‘green fintech’ and ‘sustainable digital finance’. Eur. Co. Financ. Law Rev. 2022, 19, 128–174. [Google Scholar] [CrossRef]
- Bharadwaj, S.; Deka, S. Behavioral intention toward investment in cryptocurrency: An integration of rogers’ diffusion of innovation theory and the technology acceptance model. Forum Sci. Oeconomia 2021, 9, 137–159. [Google Scholar] [CrossRef]
- Clark, S.; MacLachlan, M.; Marshall, K.; Morahan, N.; Carroll, C.; Hand, K.; Boyle, N.; O’Sullivan, K. Including Digital Connection in the United Nations Sustainable Development Goals: A Systems Thinking Approach for Achieving the SDGs. Sustainability 2022, 14, 1883. [Google Scholar] [CrossRef]
- Zioło, M.; Niedzielski, P.; Kuzionko-Ochrymiuk, E.; Marcinkiewicz, J.; Łobacz, K.; Dyl, K.; Szanter, R. E-government development in European countries: Socioeconomic and environmental aspects. Energies 2022, 15, 8870. [Google Scholar] [CrossRef]
- Pakhnenko, O.; Kuan, Z. Ethics of Digital Innovation in Public Administration. Bus. Ethics Leadersh. 2023, 7, 113–121. [Google Scholar] [CrossRef]
- Kolosok, S.; Vasylieva, T.; Lyeonov, S. Machine analysis of the UK electrical energy initiatives based on the e-petitions to the UK government and parliament. Inf. Technol. Nanotechnol. 2021, 2870, 1562–1573. [Google Scholar]
- Vasilyeva, T.; Ziółko, A.; Kuzmenko, O.; Kapinos, A.; Humenna, Y. Impact of digitalization and the COVID-19 pandemic on the aml scenario: Data mining analysis for good governance. Econ. Sociol. 2021, 14, 326–354. [Google Scholar] [CrossRef]
- Rybnikova, I.; Juknevičienė, V.; Toleikienė, R.; Leach, N.; Āboliņa, I.; Reinholde, I.; Sillamäe, J. Digitalization and e-leadership in local government before COVID-19: Results of an exploratory study. Forum Sci. Oeconomia 2022, 10, 173–191. [Google Scholar] [CrossRef]
- Pimonenko, T.; Lyulyov, O.; Us, Y.; Dubyna, O.; Kumah, O.O.E. Gender Stereotypes and Green Banking Toward Carbon-Free Economy. Financ. Mark. Inst. Risks 2021, 5, 29–38. [Google Scholar] [CrossRef]
- Titko, J.; Smatkova, I.; Cerkovskis, E. Demand for IT students in Latvian labour market: Viewpoint of employers. In Proceedings of the 28th International Business Information Management Association Conference—Vision 2020: Innovation Management, Development Sustainability, and Competitive Economic Growth, Seville, Spain, 9–10 November 2016; pp. 1812–1823. [Google Scholar]
- Erturk, E.; Purdon, I. A case study in digital inclusion and sustainability in regional New Zealand. In Proceedings of the 2022 8th International Conference on Information Management (ICIM), Cambridge, UK, 25–27 March 2022; pp. 251–256. [Google Scholar] [CrossRef]
- Bertot, J.C. Building digitally inclusive communities: The roles of public libraries in digital inclusion and development. In Proceedings of the ACM International Conference Proceeding Series, Montevideo, Uruguay, 1–3 March 2016; pp. 95–102. [Google Scholar] [CrossRef]
- Sharma, R.; Fantin, A.-R.; Prabhu, N.; Guan, C.; Dattakumar, A. Digital literacy and knowledge societies: A grounded theory investigation of sustainable development. Telecommun. Policy 2016, 40, 628–643. [Google Scholar] [CrossRef]
- Radovanović, D.; Holst, C.; Belur, S.B.; Srivastava, R.; Houngbonon, G.V.; Le Quentrec, E.; Miliza, J.; Winkler, A.S.; Noll, J. Digital literacy key performance indicators for sustainable development. Soc. Incl. 2020, 8, 151–167. [Google Scholar] [CrossRef]
- Lyashenko, V.; Pidorycheva, I. The formation of interstate and cross-border scientific-educational and innovative spaces between Ukraine and the European union member states in the digital economy. Virtual Econ. 2019, 2, 48–60. [Google Scholar] [CrossRef] [PubMed]
- Launer, M.; Çetin, F.; Paliszkiewicz, J. Digital trust in the workplace: Testing a new instrument on a multicultural sample. Forum Sci. Oeconomia 2022, 10, 29–47. [Google Scholar] [CrossRef]
- Titko, J.; Veidenberga, Z.; Shina, I. Financial knowledge of youth in Latvia: Pilot survey results. In Proceedings of the 30th International Business Information Management Association Conference, IBIMA 2017—Vision 2020: Sustainable Economic Development, Innovation Management, and Global Growth, Madrid, Spain, 8–9 November 2017; pp. 1545–1556. [Google Scholar]
- Yamoah, F.A.; Ul Haque, A. Strategic management through digital platforms for remote working in the higher education industry during and after the COVID-19 pandemic. Forum Sci. Oeconomia 2022, 10, 111–128. [Google Scholar] [CrossRef]
- MacNeil, P.; Khare, A.; Jugdev, K. International Inequity Patterns in Youth and Young Adults Related to COVID-19: Advancing Sustainable Development Goals on Well-Being, Education, and Employment. Health Econ. Manag. Rev. 2022, 3, 60–72. [Google Scholar] [CrossRef]
- Bierne, J.; Titko, J.; Svirina, A. Perceived value of E-teaching: Pilot study in Latvia. In Proceedings of the 32nd International Business Information Management Association Conference, IBIMA 2018—Vision 2020: Sustainable Economic Development and Application of Innovation Management from Regional Expansion to Global Growth, Seville, Spain, 15–16 November 2018; pp. 6988–6998. [Google Scholar]
- Lyeonov, S.; Toušek, Z.; Bozhenko, V.; Kérmárki-Gally, S.E. The impact of corruption in climate finance on achieving net zero emissions. J. Int. Stud. 2023, 16, 142–159. [Google Scholar] [CrossRef]
- Trushkina, N.; Abazov, R.; Rynkevych, N.; Bakhautdinova, G. Digital transformation of organizational culture under conditions of the information economy. Virtual Econ. 2020, 3, 7–38. [Google Scholar] [CrossRef]
- Ghouse, G.; Aslam, A.; Bhatti, M.I. The Impact of the Environment, Digital–Social Inclusion, and Institutions on Inclusive Growth: A Conceptual and Empirical Analysis. Energies 2022, 15, 7098. [Google Scholar] [CrossRef]
- Miskiewicz, R. Efficiency of electricity production technology from postprocess gas heat: Ecological, economic and social benefits. Energies 2020, 13, 6106. [Google Scholar] [CrossRef]
- Šulyová, D.; Kubina, M. Quality of life in the concept of strategic management for smart cities. Forum Sci. Oeconomia 2022, 10, 9–24. [Google Scholar] [CrossRef]
- Kolosok, S.; Saher, L.; Kovalenko, Y.; Delibasic, M. Renewable Energy and Energy Innovations: Examining Relationships Using Markov Switching Regression Model. Mark. Manag. Innov. 2022, 2, 151–160. [Google Scholar] [CrossRef]
- Vakulenko, I.; Saher, L.; Shymoshenko, A. Systematic literature review of carbon-neutral economy concept. SocioEcon. Chall. 2023, 7, 139–148. [Google Scholar] [CrossRef]
- Wang, J.; Song, Z.; Xue, L. Digital Technology for Good: Path and Influence—Based on the Study of ESG Performance of Listed Companies in China. Appl. Sci. 2023, 13, 2862. [Google Scholar] [CrossRef]
- Li, J.; Lian, G.; Xu, A. How do ESG affect the spillover of green innovation among peer firms? Mechanism discussion and performance study. J. Bus. Res. 2023, 158, 113648. [Google Scholar] [CrossRef]
- Shen, Y.; Yang, Z.; Zhang, X. Impact of digital technology on carbon emissions: Evidence from Chinese cities. Front. Ecol. Evol. 2023, 11, 1166376. [Google Scholar] [CrossRef]
- Dong, F.; Li, Y.; Qin, C.; Zhang, X.; Chen, Y.; Zhao, X.; Wang, C. Information infrastructure and greenhouse gas emission performance in urban China: A difference-in-differences analysis. J. Environ. Manag. 2022, 316, 115252. [Google Scholar] [CrossRef]
- Tao, Z.; Zhi, Z.; Shangkun, L. Digital Economy, Entrepreneurship, and High Quality Economic Development: Empirical Evidence from Urban China. Front. Econ. China 2022, 17, 393–426. [Google Scholar]
- Escalante, E.F.; Sánchez, R.C.; Hernández, M.L. Dissemination, technology transfer and environmental education criteria applied to hydrogeology, and specially, to managed aquifer recharge: Proposal for a strategy to introduce these techniques to the population, and some examples for Spain. Environ. Earth Sci. 2013, 70, 2009–2031. [Google Scholar] [CrossRef]
- Papadonikolaki, E.; Krystallis, I.; Morgan, B. Digital technologies in built environment projects: Review and future directions. Proj. Manag. J. 2022, 53, 501–519. [Google Scholar] [CrossRef]
- World Data Bank. Available online: https://databank.worldbank.org (accessed on 10 April 2023).
- Hassani, H.; Unger, S.; Entezarian, M.R. Information Content Measurement of ESG Factors via Entropy and Its Impact on Society and Security. Information 2021, 12, 391. [Google Scholar] [CrossRef]
- Cai, Z.; Qian, M.; Wang, L. Comprehensive ESG Score and Financial Performance of Carbon-Neutral Concept Enterprises—Based on Entropy Weight-TOPSIS and Gray Relational Analysis. Open J. Bus. Manag. 2022, 11, 133–148. [Google Scholar] [CrossRef]
- Lopez-de-Silanes, F.; McCahery, J.A.; Pudschedl, P.C. ESG performance and disclosure: A cross-country analysis. Singap. J. Leg. Stud. 2020, 2020, 217–241. [Google Scholar]
- Gonçalves, T.; Pimentel, D.; Gaio, C. Risk and Performance of European Green and Conventional Funds. Sustainability 2021, 13, 4226. [Google Scholar] [CrossRef]
- Crifo, P.; Diaye, M.A.; Oueghlissi, R. The effect of countries’ ESG ratings on their sovereign borrowing costs. Q. Rev. Econ. Financ. 2017, 66, 13–20. [Google Scholar] [CrossRef]
- Ng, T.H.; Lye, C.T.; Chan, K.H.; Lim, Y.Z.; Lim, Y.S. Sustainability in Asia: The roles of financial development in environmental, social and governance (ESG) performance. Soc. Indic. Res. 2020, 150, 17–44. [Google Scholar] [CrossRef]
- Eurostat. Available online: https://ec.europa.eu/eurostat (accessed on 10 April 2023).
- Moran, P.A. Notes on continuous stochastic phenomena. Biometrika 1950, 37, 17–23. [Google Scholar] [CrossRef]
- LeSage, J.P.; Pace, R.K. Interpreting spatial econometric models. In Handbook of Regional Science; Springer: Berlin/Heidelberg, Germany, 2014; pp. 1535–1552. [Google Scholar]
- Li, W.; Pang, W. The impact of digital inclusive finance on corporate ESG performance: Based on the perspective of corporate green technology innovation. Environ. Sci. Pollut. Res. 2023, 30, 65314–65327. [Google Scholar] [CrossRef]
- Chen, G.; Han, J.; Yuan, H. Urban digital economy development, enterprise innovation, and ESG performance in China. ESG Invest. Its Soc. Impacts 2023, 10, 144. [Google Scholar] [CrossRef]
- Teixeira, J.E.; Tavares-Lehmann, A.T.C. Industry 4.0 in the European Union: Policies and national strategies. Technol. Forecast. Soc. Chang. 2022, 180, 121664. [Google Scholar] [CrossRef]
- Letunovska, N.; Abazov, R.; Chen, Y. Framing a Regional Spatial Development Perspective: The Relation between Health and Regional Performance. Virtual Econ. 2022, 5, 87–99. [Google Scholar] [CrossRef]
- Szczepańska-Woszczyna, K.; Gedvilaitė, D.; Nazarko, J.; Stasiukynas, A.; Rubina, A. Assessment of Economic Convergence among Countries in the European Union. Technol. Econ. Dev. Econ. 2022, 28, 1572–1588. [Google Scholar] [CrossRef]
- Kharazishvili, Y.; Kwilinski, A. Methodology for Determining the Limit Values of National Security Indicators Using Artificial Intelligence Methods. Virtual Econ. 2022, 5, 7–26. [Google Scholar] [CrossRef] [PubMed]
Figure 1.
Spatial distribution of ESG performance within (a) mean values and (b) standard deviation.
Figure 1.
Spatial distribution of ESG performance within (a) mean values and (b) standard deviation.

Figure 2.
Visualization of Moran’s I plot of ESG performance.


Table 1.
Variables for assessment of ESG performance.
| Variables | Meaning | Impact |
|---|---|---|
| Social performance | ||
| Fertility rate, total (births per woman) | The average number of children born per a woman. Higher fertility rates can be seen as a stimulator for social development, as it may indicate a younger and potentially growing population | ↑ |
| Gini index | Higher values indicate greater inequality, which hinders social development | ↓ |
| Government expenditure on education | Higher government expenditure on education suggests a greater commitment to investing in human capital, which boosts social development | ↑ |
| Income share held by lowest 20% | A lower share suggests a higher level of income inequality, which can be considered an inhibitor | ↓ |
| Labor force participation rate | A higher rate indicates greater economic engagement and stimulates social development | ↑ |
| Life expectancy at birth | A positive indicator of social well-being and development | ↑ |
| Mortality rate, under 5 | Restricts social development and well-being | ↓ |
| People using safely managed sanitation service | Access to safe sanitation services promotes public health and can be seen as a stimulator for social development | ↑ |
| Population ages 65 and above | A higher value restricts development due to strain on social security systems and healthcare | ↓ |
| School enrollment, primary | Higher rates indicate increased access to education, which is a stimulator for social development | ↑ |
| Unemployment | A lower unemployment rate stimulates social development, as it indicates a higher level of economic participation and well-being | ↓ |
| Environmental performance | ||
| Agricultural land | Sustainable agricultural practices and land management can help increase agricultural productivity while minimizing environmental impact | ↑ |
| Agriculture, forestry, and fishing, | It stimulates the environmental performance when sustainable practices are implemented. | ↑ |
| CO2 emissions | Pollution reduces the environmental performance | ↓ |
| Energy intensity level of primary energy | Continued efforts to improve energy efficiency will reduce energy consumption and contribute to environmental sustainability. Growth of energy intensity decreases environmental performance. | ↓ |
| Food production index | Improving agricultural practices, including sustainable farming techniques and reduced food waste, contributes to increased food production while minimizing environmental impact | ↑ |
| Level of water stress: freshwater withdrawal as a proportion of available freshwater resources | High levels of water stress decrease environmental performance within ecosystem degradation, water scarcity and drought, saltwater intrusion and land subsidence | ↓ |
| Methane emissions | Implementing measures to reduce methane emissions from various sources, such as agriculture and waste management, contributes to environmental sustainability | ↓ |
| Nitrous oxide emissions | Efforts to reduce nitrous oxide emissions, particularly from agricultural activities, can contribute to environmental sustainability | ↓ |
| Population density | Encouraging sustainable urban planning and development practices can help manage population density and minimize environmental impacts | ↓ |
| Forest area | Increasing forest area and promoting sustainable forest management practices positively influences environmental performance | ↑ |
| Renewable energy consumption | Promoting renewable energy sources will reduce reliance on fossil fuels and contribute to increased environmental sustainability | ↑ |
| Governance performance | ||
| Control of Corruption | Lower control of corruption indicates governance issues and can be considered an inhibitor to good governance | ↑ |
| GDP growth | Higher value reflects a healthy economy and can stimulate good governance through economic development and resource availability | ↑ |
| Research and development expenditure | Higher value reflects commitment to innovation and knowledge creation, stimulating good governance | ↑ |
| Individuals using the Internet | Higher value indicates digital connectivity and access to information, which can stimulate transparency and participation in governance | ↑ |
| Proportion of seats held by women in the national parliaments | Higher rate of women in the national parliaments promotes gender equality and diversity in decision-making processes, stimulating good governance | ↑ |
| Political stability and absence of violence/terrorism | Higher levels of political stability and higher incidence of violence/terrorism stimulate good governance | ↑ |
| Net migration | Positive net migration indicates favorable conditions that attract talent and contribute to economic and social development | ↑ |
| Ratio of female to male labor force participation rate | Higher rate signifies inclusive policies and promotes good governance | ↑ |
| Regulatory quality | High value indicates adequate regulatory frameworks and enforcement | ↑ |
| Rule of law | Strong adherence to the rule of law promotes stability, accountability, and fairness | ↑ |
| School enrollment, primary and secondary, gender parity index | It promotes education equity and inclusivity, stimulating good governance | ↑ |
| Government effectiveness | Government effectiveness suggests efficiencies in public administration | ↑ |
| Voice and accountability | Voice and accountability suggest engagement of citizen in governance | ↑ |
Note: ↑—stimulator; ↓—inhibitor.
Table 2.
Descriptive statistics of the data for the selected variables for EU courtiers 2008–2020.
| Symbols | Description | Meaning | Source | Mean | SD | Min | Max |
|---|---|---|---|---|---|---|---|
| DI | Digital inclusion | Refers to the equitable access and effective use of digital technologies and resources by individuals and communities | Eurostat [99] | 72.643 | 15.183 | 26.340 | 96.750 |
| eGovke | Key enablers | Elements or factors that facilitate and support the successful implementation and utilization of digital technologies and initiatives. | 58.218 | 25.664 | 5.0 | 101.321 | |
| eGovbuss | Digital public services for businesses | Online services provided by public authorities to facilitate interactions between businesses and government entities | 64.629 | 18.054 | 16.0 | 100.786 | |
| eGovcit | Digital public services for citizens | Online services provided by public authorities to individuals | 49.001 | 20.348 | 12.0 | 89.0 | |
| GFDI | Green investment | Investments made in developing new projects or initiatives with the aim of contributing to climate finance | 9145.863 | 15,734.580 | 3.0 | 84,826.0 | |
| TO | Trade | Degree to which a country engages in international trade activities | World Data Bank [92] | 127.369 | 66.632 | 45.419 | 380.104 |
Table 3.
Pooled OLS estimator.
| DI | eGovke | eGovbuss | eGovcit | |||||
|---|---|---|---|---|---|---|---|---|
| coef. | prob. | coef. | prob. | coef. | prob. | coef. | prob. | |
| 0.390 | 0.000 | 0.089 | 0.000 | 0.137 | 0.000 | 0.165 | 0.000 | |
| −0.002 | 0.850 | 0.048 | 0.005 | 0.036 | 0.057 | 0.018 | 0.053 | |
| GFDI | 0.038 | 0.000 | 0.044 | 0.000 | 0.044 | 0.000 | 0.043 | 0.000 |
| const | −2.615 | 0.000 | −1.568 | 0.000 | −1.724 | 0.000 | −1.694 | 0.000 |
| R-squared | 0.699 | 0.563 | 0.531 | 0.659 | ||||
| Adj R-squared | 0.697 | 0.557 | 0.524 | 0.655 | ||||
Table 4.
Test for model selection.
| DI | eGovke | eGovbuss | eGovcit | |||||
|---|---|---|---|---|---|---|---|---|
| p Value | p Value | p Value | p Value | |||||
| SAR versus SDM | 62.05 | 0.000 | 44.12 | 0.000 | 40.78 | 0.000 | 23.47 | 0.000 |
| SEM versus SDM | 54.71 | 0.000 | 49.69 | 0.000 | 50.51 | 0.000 | 30.16 | 0.000 |
| Hausman test | 24.02 | 0.001 | 15.39 | 0.031 | 14.38 | 0.045 | 33.87 | 0.000 |
Table 5.
Results of SDM.
| DI | eGovke | eGovbuss | eGovcit | |||||
|---|---|---|---|---|---|---|---|---|
| coef. | prob. | coef. | prob. | coef. | prob. | coef. | prob. | |
| Main | ||||||||
| 0.048 | 0.002 | 0.011 | 0.010 | 0.020 | 0.042 | 0.030 | 0.000 | |
| −0.006 | 0.792 | −0.019 | 0.486 | −0.011 | 0.664 | −0.035 | 0.193 | |
| GFDI | 0.006 | 0.810 | 0.006 | 0.002 | 0.005 | 0.003 | 0.005 | 0.008 |
| Wx | ||||||||
| 0.125 | 0.000 | 0.028 | 0.000 | 0.048 | 0.000 | 0.033 | 0.001 | |
| −0.005 | 0.838 | 0.080 | 0.014 | 0.054 | 0.103 | 0.047 | 0.170 | |
| GFDI | 0.004 | 0.166 | 0.004 | 0.082 | 0.007 | 0.003 | 0.006 | 0.008 |
| Spatial rho | 0.077 | 0.093 | 0.110 | 0.150 | 0.047 | 0.043 | 0.190 | 0.009 |
| Variance sigma2_e | 0.001 | 0.000 | 0.001 | 0.000 | 0.001 | 0.000 | 0.001 | 0.000 |
Note: Wx—spatially weighted regressors.
Table 6.
Results of dynamic SDM.
| DI | eGovke | eGovbuss | eGovcit | |||||
|---|---|---|---|---|---|---|---|---|
| coef. | prob. | coef. | prob. | coef. | prob. | coef. | prob. | |
| Main | ||||||||
| L.ESG | 0.908 | 0.000 | 0.725 | 0.000 | 0.773 | 0.000 | 0.749 | 0.000 |
| 0.001 | 0.019 | 0.003 | 0.076 | 0.019 | 0.076 | 0.005 | 0.018 | |
| 0.040 | 0.007 | 0.051 | 0.048 | 0.055 | 0.030 | 0.051 | 0.045 | |
| GFDI | 0.002 | 0.038 | 0.004 | 0.011 | 0.003 | 0.051 | 0.004 | 0.013 |
| Wx | ||||||||
| L.ESG | 0.082 | 0.269 | 0.073 | 0.486 | 0.115 | 0.278 | 0.129 | 0.211 |
| 0.047 | 0.004 | 0.005 | 0.032 | 0.017 | 0.016 | 0.001 | 0.061 | |
| 0.060 | 0.004 | 0.041 | 0.193 | 0.047 | 0.134 | 0.045 | 0.170 | |
| GFDI | 0.002 | 0.333 | 0.003 | 0.029 | 0.002 | 0.028 | 0.003 | 0.023 |
| Spatial rho | 0.009 | 0.082 | 0.055 | 0.050 | 0.078 | 0.037 | 0.074 | 0.062 |
| Variance sigma2_e | 0.000 | 0.000 | 0.000 | 0.000 | 0.000 | 0.000 | 0.000 | 0.000 |
Note: Wx—spatially weighted regressors; L. ESG—value of ESG with lag.
Table 7.
Results of direct, indirect and total effects.
| DI | eGovke | eGovbuss | eGovcit | |||||
|---|---|---|---|---|---|---|---|---|
| coef. | prob. | coef. | prob. | coef. | prob. | coef. | prob. | |
| LR Direct | ||||||||
| 0.045 | 0.004 | 0.012 | 0.004 | 0.023 | 0.019 | 0.033 | 0.000 | |
| −0.007 | 0.755 | −0.017 | 0.507 | −0.010 | 0.690 | −0.034 | 0.197 | |
| GFDI | 0.000 | 0.043 | 0.005 | 0.002 | 0.005 | 0.006 | 0.004 | 0.016 |
| LR Indirect | ||||||||
| 0.116 | 0.000 | 0.032 | 0.000 | 0.057 | 0.000 | 0.045 | 0.000 | |
| −0.004 | 0.871 | 0.085 | 0.010 | 0.059 | 0.092 | 0.047 | 0.214 | |
| GFDI | 0.004 | 0.043 | 0.004 | 0.029 | 0.007 | 0.007 | 0.006 | 0.025 |
| LR Total | ||||||||
| 0.161 | 0.000 | 0.044 | 0.000 | 0.080 | 0.000 | 0.079 | 0.000 | |
| −0.011 | 0.653 | 0.068 | 0.092 | 0.049 | 0.245 | 0.013 | 0.785 | |
| GFDI | 0.003 | 0.027 | 0.001 | 0.005 | 0.003 | 0.046 | 0.002 | 0.051 |
Disclaimer/Publisher’s Note: The statements, opinions and data contained in all publications are solely those of the individual author(s) and contributor(s) and not of MDPI and/or the editor(s). MDPI and/or the editor(s) disclaim responsibility for any injury to people or property resulting from any ideas, methods, instructions or products referred to in the content. |
© 2023 by the authors. Licensee MDPI, Basel, Switzerland. This article is an open access article distributed under the terms and conditions of the Creative Commons Attribution (CC BY) license (https://creativecommons.org/licenses/by/4.0/).
Share and Cite
MDPI and ACS Style
Kwilinski, A.; Lyulyov, O.; Pimonenko, T. Unlocking Sustainable Value through Digital Transformation: An Examination of ESG Performance. Information 2023, 14, 444. https://0-doi-org.brum.beds.ac.uk/10.3390/info14080444
AMA Style
Kwilinski A, Lyulyov O, Pimonenko T. Unlocking Sustainable Value through Digital Transformation: An Examination of ESG Performance. Information. 2023; 14(8):444. https://0-doi-org.brum.beds.ac.uk/10.3390/info14080444
Chicago/Turabian StyleKwilinski, Aleksy, Oleksii Lyulyov, and Tetyana Pimonenko. 2023. "Unlocking Sustainable Value through Digital Transformation: An Examination of ESG Performance" Information 14, no. 8: 444. https://0-doi-org.brum.beds.ac.uk/10.3390/info14080444
Note that from the first issue of 2016, this journal uses article numbers instead of page numbers. See further details here.