
The Impact of Digital Business on Energy Efficiency in EU Countries


1
Department of Management, Faculty of Applied Sciences, WSB University, 41-300 Dabrowa Gornicza, Poland
2
The London Academy of Science and Business, 120 Baker St., London W1U 6TU, UK
3
Department of Marketing, Sumy State University, 2, Rymsky-Korsakov St., 40007 Sumy, Ukraine
*
Author to whom correspondence should be addressed.
Information 2023, 14(9), 480; https://0-doi-org.brum.beds.ac.uk/10.3390/info14090480
Submission received: 5 July 2023
/
Revised: 1 August 2023
/
Accepted: 3 August 2023
/
Published: 29 August 2023
(This article belongs to the Special Issue Artificial Intelligence and Big Data Applications)
Abstract
:Digital business plays a crucial role in driving energy efficiency and sustainability by enabling innovative solutions such as smart grid technologies, data analytics for energy optimization, and remote monitoring and control systems. Through digitalization, businesses can streamline processes, minimize energy waste, and make informed decisions that lead to more efficient resource utilization and reduced environmental impact. This paper aims at analyzing the character of digital business’ impact on energy efficiency to outline the relevant instruments to unleash EU countries’ potential for attaining sustainable development. The study applies the panel-corrected standard errors technique to check the effect of digital business on energy efficiency for the EU countries in 2011–2020. The findings show that digital business has a significant negative effect on energy intensity, implying that increased digital business leads to decreased energy intensity. Additionally, digital business practices positively contribute to reducing CO2 emissions and promoting renewable energy, although the impact on final energy consumption varies across different indicators. The findings underscore the significance of integrating digital business practices to improve energy efficiency, lower energy intensity, and advance the adoption of renewable energy sources within the EU. Policymakers and businesses should prioritize the adoption of digital technologies and e-commerce strategies to facilitate sustainable energy transitions and accomplish environmental objectives.
1. Introduction
The rapid advancement of digital technologies and digital business models has reshaped various aspects of the world’s development. Digital business continues to expand across industries, and it becomes crucial to examine its implications for energy efficiency and sustainability [1,2,3,4,5,6]. Digital business encompasses a wide range of activities, including e-commerce, cloud computing, data analytics, Internet of Things (IoT) applications, and smart city initiatives, among others [7,8,9,10]. These technologies and business models have the potential to transform traditional energy systems [11,12,13], providing new avenues for energy management, resource optimization [14,15,16,17], and environmental stewardship [18,19,20,21,22]. However, the full implications of digital business on energy efficiency are multifaceted and require a comprehensive analysis. One of the key areas where digital business intersects with energy efficiency is through its influence on energy demand and consumption patterns [23,24,25]. For instance, the growth of e-commerce has significantly changed the way products are distributed and delivered, affecting logistics and transportation systems. Digital business facilitates the integration of renewable energy sources into the power grid, enabling more efficient management of energy generation and consumption, declining carbon dioxide emissions, and improving the well-being of society [26,27,28]. Smart grid technologies, coupled with advanced data analytics, enable real-time monitoring and control, demand response mechanisms, and grid optimization, leading to more sustainable and efficient energy systems. However, digital business also poses challenges to energy efficiency and sustainability. The rapid proliferation of digital devices, data centers, and communication networks has led to increased energy consumption and associated environmental impacts [29,30,31]. Furthermore, issues such as electronic waste management, cybersecurity risks, and the ethical use of data in digital business need to be addressed to ensure a sustainable digital future [32,33,34]. In addition, digitalization requires sufficient green financial resources [35,36,37,38] and relevant digital knowledge and skills [39,40,41,42,43,44,45,46,47,48,49,50]. To fully harness the potential of digital business for energy efficiency and sustainability, it is essential to identify best practices, technological innovations, and policy frameworks that can promote energy-efficient digital transformation. This paper aims at analyzing the character of digital business’ impact on energy efficiency to outline the relevant instruments to unleash EU countries’ potential for attaining sustainable development. This study fills the scientific gaps on energy efficiency by developing approaches to explore the character of the digital business’ impact on energy efficiency based on the panel-corrected standard errors technique (PSCE). The PCSE method is chosen for its appropriateness in analyzing small panel data while accounting for cross-sectional dependence. Furthermore, the approaches developed in this study provide accurate estimation of variability considering the panel error structures. This study makes an original contribution by using the panel-corrected standard errors technique (PCSE) to analyze the impact of digital business on energy efficiency. The accurate estimation of variability provided by the PCSE method enhances the robustness of the findings. Additionally, the research contributes to the existing literature by providing evidence of the positive relationship between digital business practices and energy intensity reduction, aligning with broader efforts towards a more sustainable and low-carbon economy in the EU. The research implications of this study underscore the potential of digital business in improving energy efficiency and reducing CO2 emissions in the EU. Policymakers could utilize these findings to develop targeted policies that promote digitalization strategies among businesses to enhance sustainability efforts. However, the study acknowledges the complexity of the relationship between digitalization and energy intensity, highlighting the need for further research to understand the nonlinear dynamics and mediating factors involved.
The paper has the following structure: the literature review explores the theoretical background of energy efficiency, digital business, and links among them; materials and methods section describes the variables for analysis and sources for them and provides an explanation of the core stages of research and methodology to check the research hypothesis on digital business’ effect on energy efficiency; the results section overviews empirical findings on testing the research hypothesis; and the discussion and conclusion sections explain the core results of the analysis, outlining the policy implication considering the findings, whilst identifying the limitations and further directions for research.
2. Literature Review
2.1. Energy Efficiency Assessment
Scholars [51] conclude that energy efficiency plays a crucial role in decarbonizing economic development. The findings of energy efficiency assessments could be used to identify opportunities for energy savings and propose cost-effective solutions to enhance energy efficiency, which is the primary goal of sustainable development. It should be noted that scholars developed a vast range of approaches for assessing energy efficiency. Scholars [52,53,54,55] outline that energy intensity refers to the amount of energy required to produce a unit of output or provide a specific service. It is a measure of the efficiency with which energy is utilized. Lower energy intensity indicates higher energy efficiency. Based on empirical findings, Dong et al. [52] outline that declining energy intensity allows increasing energy efficiency among Chinese provinces and promotes the energy capabilities of the country. Shahiduzzaman and Alam [53] empirically justify that energy intensity and carbon dioxide emissions are closely related to each other, which consequently affects the Australian energy efficiency. Applying the Granger causality test, scholars [54] conclude that energy efficiency depends on the energy consumption structure, economic structure, and energy intensity. Based on the results, scholars suggest decreasing coal energy consumption and boosting the development of green energy. Hosan et al. [55] show that energy intensity directly impacts sustainable economic growth within the energy efficiency of a country. Su et al. [56] developed the composite energy efficiency index to develop policy recommendations to improve energy efficiency in OECD countries. Scholars justify the crucial role of final energy consumption in energy independence. Furthermore, scholars [56,57] highlight that energy efficiency has a significantly positive effect on final energy consumption in a country. Paramati et al. [58] confirm that environmental technologies have a significant positive impact on energy efficiency by reducing energy consumption. These findings indicate that environmental technologies contribute to reducing overall energy consumption and improving energy efficiency in OECD countries. Studies [59,60,61,62] confirm that decreasing CO2 emissions from fuel combustion improve the energy efficiency of a country. In addition, studies [63,64,65,66,67] show that renewable energy has the most significant impact on energy efficiency among all other dimensions. Thus, extending renewable energy allows for boosting the rapid growth of a country’s energy efficiency [68,69].
2.2. Digital Business and Energy Efficiency
The analysis of the theoretical background on energy efficiency shows that digital business can have both linear and nonlinear effects on energy efficiency, depending on how it is implemented and utilized. Scholars [70,71,72] outline that digital technologies and solutions are used to optimize energy consumption and improve energy efficiency. Digital systems and smart meters enable real-time monitoring of energy consumption, allowing businesses to identify inefficiencies and implement corrective measures promptly. By analyzing large volumes of data generated by digital systems, businesses gain insights into energy usage patterns, identify areas of potential energy waste, and proactively schedule maintenance to prevent energy losses [73,74]. Digitalization facilitates the implementation of energy-efficient processes, such as automated controls, smart grid technologies, and demand response systems. These technologies allow optimization of energy use and reduction of waste. Pålsson et al. [75] found that e-commerce eliminates the need for physical retail spaces, and the increased reliance on transportation could result in energy consumption and associated environmental impacts. However, studies [76] outline that efficient logistics practices, such as route optimization, consolidation of shipments, and the use of electric vehicles or alternative fuels, help minimize the energy intensity of e-commerce delivery operations.
At the same time, studies [77,78,79,80] justify the nonlinear effect of digitalization on energy efficiency. Morley et al. [81] confirm that digitalization leads to increased energy consumption if the efficiency gains are offset by increased usage or new applications. For instance, the proliferation of digital devices and data centers contributes to higher overall energy consumption. Babu et al. [82] highlight that the production, use, and disposal of digital devices generates electronic waste. Improper handling and disposal of e-waste negatively impacts the environment, including energy-intensive recycling processes and resource depletion. The growth of digital business often requires expanding data centers and related infrastructure. Gunasekaran et al. [83] explain that e-commerce businesses often operate large-scale warehouses to manage inventory and fulfill online orders. These facilities require energy for lighting, heating, cooling, and operating material handling equipment. Optimizing warehouse design, implementing energy-efficient technologies, and adopting sustainable practices such as energy management systems and renewable energy integration enhance energy efficiency in these operations. Chen et al. [84] confirm the nonlinear effect of e-commerce on energy efficiency. This means that the initial effects of e-commerce on energy efficiency could be negative, but over time, as technology and practices evolve, they lead to positive energy efficiency outcomes. The U-shaped impact is represented by a curve that initially dips downward (indicating a negative impact) and then rises upward (indicating a positive impact). The U-shaped impact of e-commerce on energy efficiency underscores the importance of proactive measures, technological advancements, and sustainable practices to mitigate initial negative impacts and capitalize on the long-term potential for energy efficiency gains. It highlights the need for continuous improvement and collaboration among e-commerce businesses, policymakers, and consumers to ensure a sustainable and energy-efficient e-commerce ecosystem. Considering the abovementioned factors, this study tests the following hypotheses:
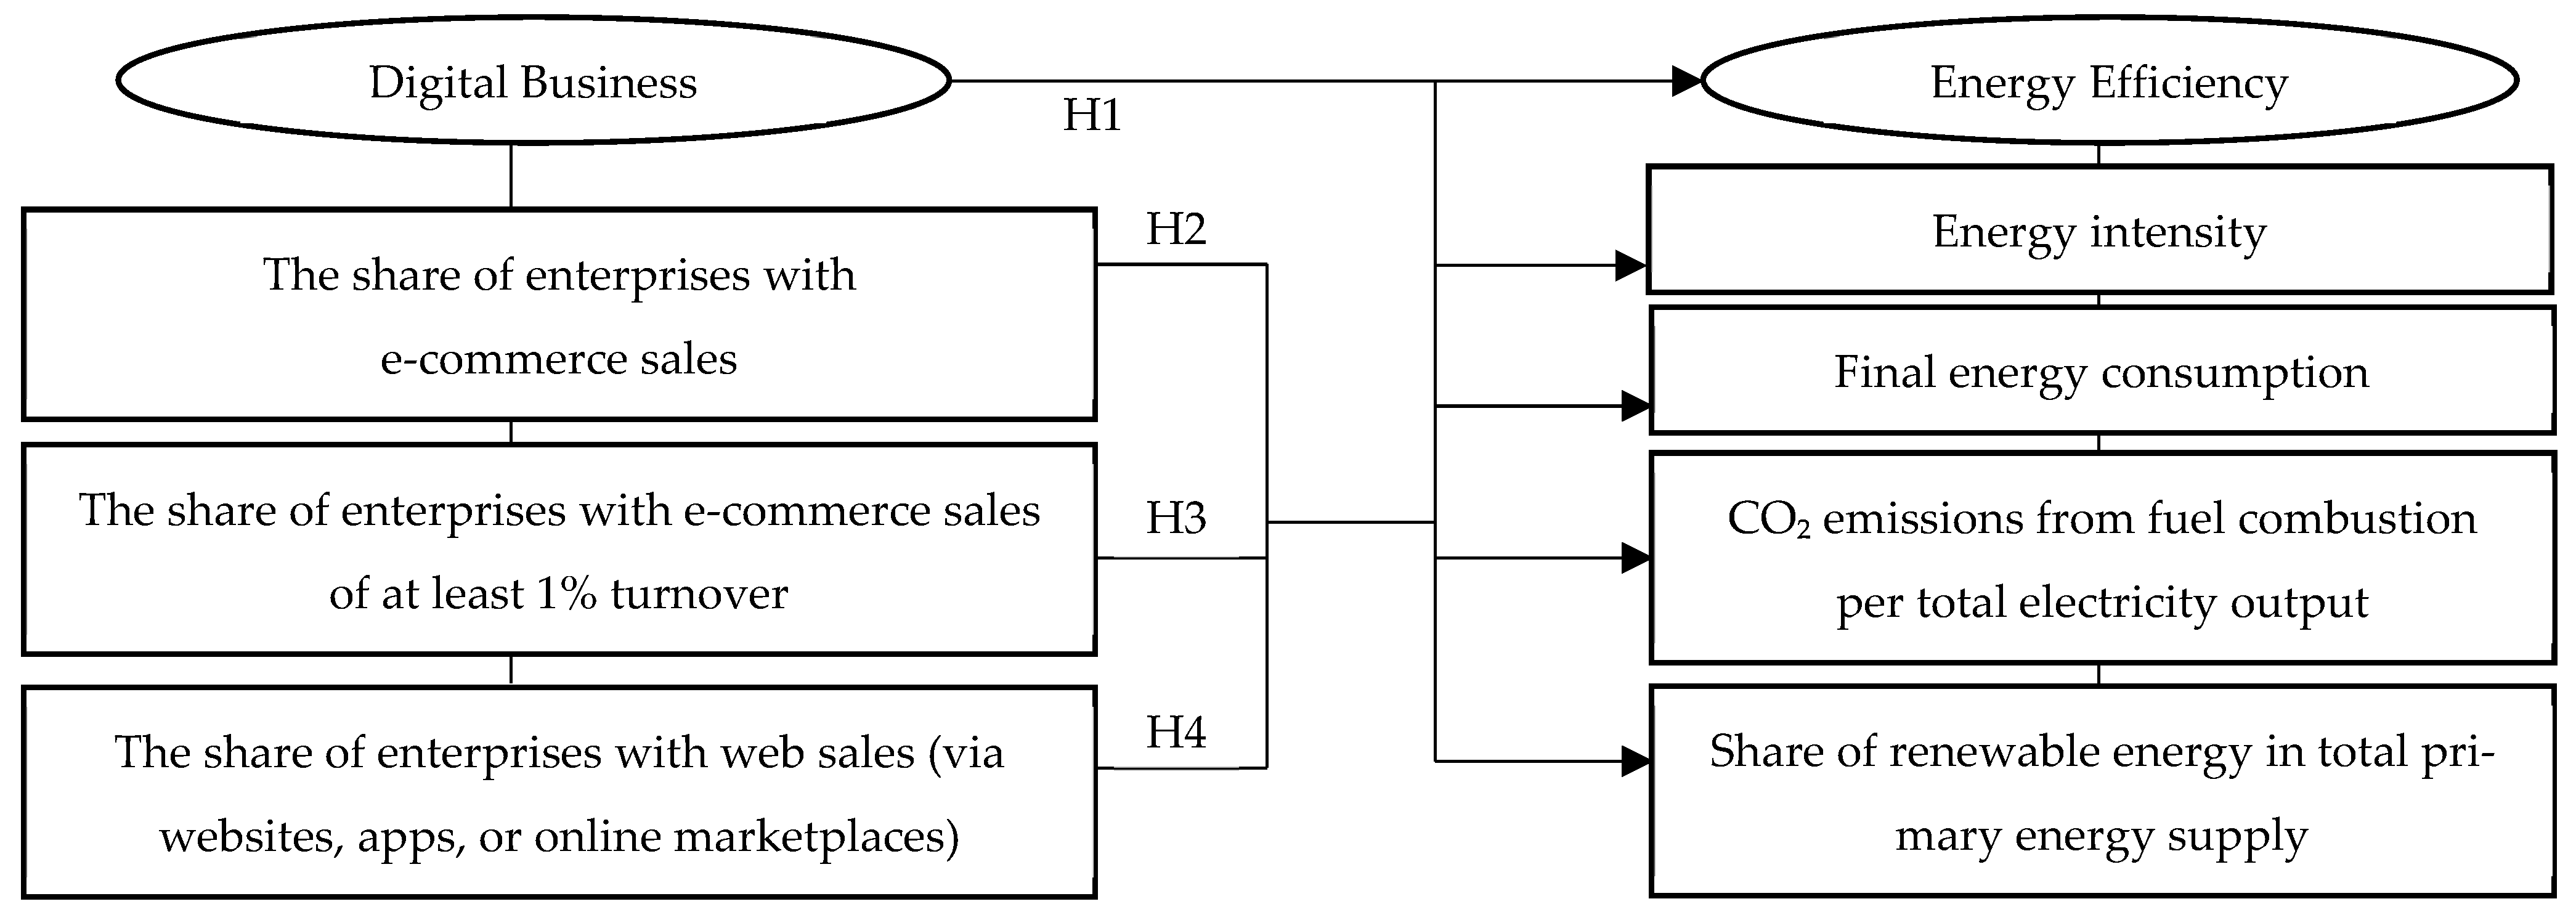
H1:
Digital business has a statistically significant impact on energy efficiency.
H2:
The share of enterprises with e-commerce sales impacts energy efficiency.
H3:
The share of enterprises with e-commerce sales of at least 1% turnover impacts energy efficiency.
H4:
The share of enterprises with web sales impacts energy efficiency.
The theoretical framework and core hypotheses are shown in Figure 1.
3. Materials and Methods
3.1. The Model and Estimation Procedure
The model specification for exploring the impact of digital business on energy efficiency and sustainability is built upon the foundational structure proposed by previous studies [6,13,17,22]:
where is an explained variable; is a vector of explanatory variables; is a vector of control variables; is constant; are search parameters of the model; and is an error term.
The estimation and verification process for the models involves the following steps: In the initial step, a series of diagnostic tests are conducted to ensure that the model is appropriately fitted. One crucial aspect is examining the correlation matrix, which provides an insight into the strength and direction of relationships among variables. Analyzing the correlation matrix can identify variables that exhibit strong associations or potential dependencies. Furthermore, the focus is on detecting multicollinearity, which occurs when independent variables are highly correlated with each other. Multicollinearity can lead to unreliable coefficient estimates and hinder the interpretability of the model. To assess the extent of multicollinearity, the variance inflation factor (VIF) is calculated for each variable. A high VIF suggests a high degree of multicollinearity, indicating the need for reconsideration or removal of variables from the model.
The second step involves conducting unit root tests to evaluate the stationarity of variables in the panel dataset. Stationarity refers to the property of a variable where its statistical properties, such as the mean and variance, remain constant over time. If variables are nonstationary, it can lead to spurious regression results and invalidate the model’s conclusions. All data in the models are transformed into logarithmic form to address potential stationarity issues.
In the third step, panel data estimates are utilised, taking advantage of the larger availability of cross-sectional data units (27 EU countries) compared to the time series data (10 years). By including Croatia, which joined the EU in 2013, the study showed how adopting digital business practices and its impact on energy efficiency evolved during the new membership period. It offers valuable insights into how a relatively newer member state incorporates digital technologies into its economic practices and energy management strategies. This can be particularly enlightening for understanding how digital transformation and energy efficiency policies are adopted and adapted by countries that have recently joined the EU. On the other hand, excluding the United Kingdom, which exited the EU in 2020, allows the study to analyse the impact of digital business practices on energy efficiency without the influence of a country going through a significant political and economic separation from the Union. The withdrawal of the UK from the EU brought unique challenges and uncertainties, which overshadowed the focus on digital business practices’ direct impact on energy efficiency during that period. Before proceeding with the estimation using fixed effects, random effects, or panel-corrected standard errors (PCSE), it is crucial to conduct various statistical tests to examine the characteristics of the data and carefully select the appropriate model specification and econometric method. These statistical tests serve the purpose of identifying specific characteristics within the data. First, the presence of heteroscedasticity is examined using the Wald test [85,86]. This test helps determine whether the variance of the errors varies across different observations. If heteroscedasticity is detected, it indicates that the assumption of constant error variance may be violated, and appropriate corrective measures need to be taken. Second, temporal autocorrelation is assessed using the Wooldridge test [87,88]. This test is employed to determine if there is a correlation between the error terms of the model at different time points. If temporal autocorrelation is detected, it implies that the assumption of independently distributed errors over time may not hold, necessitating appropriate adjustments in the model specification. Finally, the contemporaneous correlation among the cross-sectional units is examined using Pesaran’s cross-section dependence test [89,90]. This test helps identify potential interdependence or spatial autocorrelation among observations across different countries. If cross-sectional dependence is found to exist, it indicates that the assumption of independently distributed errors across countries may not be valid, and alternative estimation methods or robust standard errors may be needed. To address potential issues of heteroscedasticity and the correlation of errors within the panel data, the panel-corrected standard errors (PCSE) technique was employed in the analysis. Heteroscedasticity refers to the situation where the variance of the error term varies across different levels of the independent variables. The correlation of errors within the panel arises due to unobserved factors affecting multiple observations within the panel. The PCSE technique adjusts the standard errors of the estimated coefficients to account for these issues, leading to robust statistical inference. By considering the heteroscedasticity and correlation structure of the data, the PCSE method yields more reliable coefficient estimates and valid hypothesis tests. Furthermore, applying this method helped minimize the impact of the disturbance at the end of the series, arising from a significant difference in the use of e-business during the COVID-19 pandemic. Additionally, robustness checks were conducted to assess the sensitivity of the results to the disturbance caused by the pandemic.
3.2. Data and Sources
Energy efficiency is a critical aspect to measure and evaluate progress towards sustainable energy practices and environmental goals. In the framework of this study, considering the studies [52,53,54,55,56,57,58,59], energy efficiency is explained via indicators (dependent variables): energy intensity; final energy consumption; CO2 emissions from fuel combustion per total electricity output; and share of renewable energy in total primary energy supply.
- Energy intensity refers to the amount of energy used per unit of economic output, typically measured as energy consumed per unit of GDP. A decline in energy intensity over time indicates that an economy is becoming more energy efficient, producing more goods and services with less energy consumption. This indicator is essential for tracking the overall energy efficiency improvements of a country or region’s economy.
- Final energy consumption represents the total energy utilized for end-use activities, such as transportation, residential, commercial, and industrial sectors. Monitoring final energy consumption helps identify trends in energy demand and highlights areas where energy-saving measures and technological advancements can lead to more efficient energy usage.
- CO2 Emissions from Fuel Combustion per Total Electricity Output indicator relates to the amount of carbon dioxide (CO2) emitted per unit of electricity generated from fuel combustion. A lower value indicates a cleaner and more energy-efficient electricity generation system, with reduced greenhouse gas emissions. By tracking this indicator, policymakers can gauge the environmental impact of electricity production methods and identify opportunities for transitioning to cleaner and more energy-efficient energy sources.
- The proportion of renewable energy sources in the total primary energy supply provides insights into the extent to which a country or region is transitioning towards more sustainable and environmentally friendly energy sources. A higher share of renewables suggests a reduced reliance on fossil fuels, contributing to energy diversification and improved energy efficiency.
These indicators offer a comprehensive assessment of energy efficiency from different angles, enabling policymakers and stakeholders to identify areas of improvement, set energy efficiency targets, and develop effective strategies to enhance energy performance and mitigate environmental impacts. By monitoring and analyzing these indicators over time, countries and regions can make informed decisions to foster a more sustainable energy landscape, promoting economic growth while reducing energy consumption and greenhouse gas emissions.
Based on prior studies [70,71,72,73,74,75,76], digital business is measured within the following independent variables: the share of enterprises with e-commerce sales, the share of enterprises with e-commerce sales of at least 1% turnover, and the share of enterprises with web sales (via websites, apps, or online marketplaces). Considering studies [70,71,72,73,74,75,76], digital business positively impacts energy efficiency by reducing the energy consumption associated with physical operations, optimizing supply chains, and enabling data-driven energy management strategies. Embracing digital business practices contributes to more sustainable and energy-efficient operations across various sectors. The first independent variable, the share of enterprises with e-commerce sales, is a crucial indicator of how businesses utilise digital platforms to conduct their transactions. By engaging in e-commerce, companies can reduce the need for physical operations, such as brick-and-mortar stores, potentially lowering their overall energy consumption associated with maintaining and running traditional retail outlets. The second variable, the share of enterprises with e-commerce sales of at least 1% turnover, further emphasises the significance of e-commerce in relation to energy efficiency. When businesses derive a substantial portion of their revenue from online sales, it indicates a higher reliance on digital technologies and a decreased reliance on energy-intensive physical infrastructure. The third variable, the share of enterprises with web sales through various digital channels, encompasses a broader spectrum of digital business practices, including sales via websites, apps, or online marketplaces. By leveraging these digital avenues, businesses can optimise their supply chains, streamline operations, and implement data-driven energy management strategies. This can lead to more efficient use of resources and reduced energy consumption in the production, distribution, and sales processes.
The study applies the following control variables:
- GDP per capita: GDP per capita is an important indicator of economic development and can have a significant impact on energy intensity, final energy consumption, CO2 emissions, and the adoption of digital business practices [5,91,92,93]. Higher GDP per capita generally indicates greater economic resources and technological advancements, which can influence energy efficiency and sustainability outcomes. Countries with higher GDP per capita may have more financial capacity to invest in energy-efficient technologies, implement sustainable practices, and adopt digital business strategies.
- Trade openness [94,95,96,97]: Trade openness refers to the degree of integration of a country’s economy with the global market. It can have implications for energy consumption and environmental impact. Countries with higher trade openness may have greater access to international markets, which can affect their energy consumption patterns, including imports and exports of energy-intensive goods.
- Governance efficiency [98,99]: Governance efficiency reflects the effectiveness of a country’s institutions and their ability to implement and enforce policies and regulations. Good governance can promote sustainable practices and enhance energy efficiency initiatives. Countries with more efficient governance systems may be better equipped to implement and enforce energy efficiency policies, incentivize digital business practices, and ensure compliance with sustainability standards.
- Land Surface Temperature: The temperature conditions of the Earth’s surface, as captured by Land Surface Temperature, have both direct and indirect effects on energy consumption and intensity [100,101]. Temperature variations directly impact heating and cooling demands, thereby influencing energy consumption patterns. Additionally, temperature conditions indirectly influence energy efficiency by affecting the need for energy-intensive processes such as air conditioning or heating systems.
- Population density: Population density can affect energy consumption patterns [102,103,104]. Urban areas with higher population densities tend to have different energy requirements compared to rural areas. Factors such as the concentration of residential and commercial buildings, transportation needs, and infrastructure availability can all influence energy consumption. Furthermore, areas with higher population densities are more likely to have advanced infrastructure, including digital connectivity and technological innovations. This may facilitate the adoption of digital business practices, as well as the implementation of energy-efficient technologies.
The list of variables, their explanations, sources, and descriptive statistics is shown in Table 1.
The correlation coefficients in the matrix range (Table 2) from −1 to 1, with values closer to −1 indicating a strong negative correlation, values closer to 1 indicating a strong positive correlation, and values close to 0 indicating a weak or no correlation. Positive correlations between digital business metrics (such as e-commerce sales, e-commerce turnover, or e-commerce web sales) and energy efficiency variables would suggest a positive relationship, indicating that an increase in digital business activities is associated with improved energy efficiency. All data are significant at 1% and 5%.
Based on the outputs of the correlation analysis, the regression model (1) was estimated separately for each explained variable (EI, FEC, , ). The results of the variance inflation factor (VIF) show that all values are less than threshold 5 (Table 3). This means that the variable is not highly correlated with other independent variables in the model [107]. The fundings allow rejection of the multicollinearity among selected variables.
4. Results
The stationarity of the variables was examined using the Im-Pesaran-Shin unit root test [108] and the Fisher-based augmented Dickey–Fuller unit root test [109]. The results presented in Table 4 demonstrate that all variables become stationary after taking the first difference.
The results of the Hausman test presented in Table 5 indicate that all models exhibit statistically significant chi-square test statistics, with p values of 0.000. This implies a substantial disparity between the estimated coefficients of the fixed effects (FE) and random effects (RE) models for all variables. These findings suggest that the random effects model may not be suitable for the regression analysis, favoring the adoption of the fixed effects model instead. The significance of the results indicates the presence of unobserved time-invariant factors that impact the relationship between the explained and explanatory variables. Consequently, incorporating these fixed effects within the model enhances the reliability and accuracy of the coefficient estimates.
The statistically significant F-statistic values and low p values of the Wooldridge test (Table 6) suggest that heteroscedasticity is present in the regression models for all variables (EI, FEC, , ) and their respective explanatory variables (, , ).
The outputs presented in Table 7 provide the results of the modified Wald test, which aims to detect groupwise heteroscedasticity in the regression models. Groupwise heteroscedasticity occurs when the variances of the error terms in a regression model differ across distinct groups or subsets within the data.
Table 7 displays the Chi-square test statistics and their corresponding p values for each variable included in the regression models. The chi-square test statistic assesses the overall significance of the groupwise heteroscedasticity in the models. A statistically significant chi-square value, indicated by a very low p value (p = 0.000), suggests the presence of substantial groupwise heteroscedasticity. The presence of groupwise heteroscedasticity has implications for the interpretation of the regression results, similar to the implications of overall heteroscedasticity. When groupwise heteroscedasticity is present, the standard errors of the coefficient estimates could be biased, leading to incorrect inference and hypothesis testing.
The results presented in Table 8 showcase the outcomes of Pesaran’s cross-section dependence test. This test is conducted to examine the hypothesis of cross-sectional independence in panel data models with N > T. It is specifically designed to detect contemporaneous correlation or cross-sectional dependence among the variables in the model. The decision to employ Pesaran’s test over the Breusch–Pagan test is due to its suitability for detecting contemporaneous correlation in the model residuals. The Breusch–Pagan test is not well suited for panel data analysis with cross-sectional dependence [110]. Therefore, Pesaran’s alternative approach is adopted to accurately assess the presence of cross-sectional dependence.
The Pesaran’s cross-section dependence test presented in Table 8 evaluates the null hypothesis of cross-sectional independence, which assumes no contemporaneous correlation among the variables. The test statistics (stat) and corresponding p values (Pr) for each dependent variable in the panel data models indicate that the null hypothesis of cross-sectional independence is rejected. This suggests the presence of cross-sectional dependence or contemporaneous correlation among the variables.
Based on the results of the Wooldridge test, the modified Wald test for groupwise heteroscedasticity, and Pesaran’s cross-section dependence test, it is evident that the panel data models suffer from heteroscedasticity, contemporaneous correlation, and cross-sectional dependence. Considering these findings, employing panel-corrected standard error (PCSE) estimations would be a more appropriate approach. PCSE estimations effectively address the issues of heteroscedasticity and cross-sectional dependence in panel data models, providing robust standard errors that account for within-group correlation.
To validate the results obtained through PCSE estimations, the fixed effects model is employed. The results of the fixed effects model regression analysis (Table 9) indicate significant relationships between the independent variables , , and and the explained variables EI, , and . However, for the variable FEC, the coefficient estimates for all indicators of digital business are not statistically significant (p > 0.05), suggesting a lack of significant relationship between these indicators and the explained variable. The F-statistic for all models is statistically significant with a p value of 0.000. This indicates that the regression models are a good fit for the data and that at least one independent variable has a significant relationship with the dependent variable. The high significance level suggests that the chosen independent variables collectively contribute to explaining the variation in the dependent variable. Furthermore, the correlation coefficient (rho) for all models in Table 9 is higher than 0.99, indicating a strong positive correlation between the dependent variable and the individual-specific effects. This suggests that a large proportion of the variation in the dependent variable is accounted for by the individual-specific effects. The high rho values reinforce the importance of considering the fixed effects in the model and suggest a substantial influence of the individual-specific effects on the dependent variable.
Table 10 presents the results of the regression analysis using PCSE estimations. For the dependent variable EI (Energy Intensity), all indicators of digital business show a statistically significant impact (p < 0.05). The negative coefficients for the indicators of digital business (, , are −0.112, −0.112, and −0.076, respectively) suggest that an increase in the levels of digital business is associated with a decrease in energy intensity in the EU. This implies that as the share of enterprises with e-commerce sales, the share of enterprises with e-commerce sales of at least 1% turnover, and the share of enterprises with web sales increase, the energy intensity in the EU is expected to decline. These findings have significant implications for the EU’s sustainability goals and its efforts to reduce carbon emissions. The results indicate that embracing digitalization and promoting e-commerce practices contribute to improving energy efficiency and potentially lead to reduced energy consumption across various sectors. By actively supporting and encouraging digital business practices, the EU could enhance its energy efficiency measures, mitigate environmental impacts, and progress toward a more sustainable and environmentally friendly economy. The values range from 0.978 to 0.981, suggesting that the independent variables collectively explain a substantial portion of the variation in energy intensity. Additionally, the outputs for the variable reveal that the adoption and expansion of digital business practices in the EU could also contribute to the reduction of CO2 emissions. The coefficients for , , and are −0.179 (p = 0.003), −0.118 (p = 0.002), and −0.056 (p = 0.033), respectively. However, the values range from 0.215 to 0.245, indicating a moderate level of explanation.
In contrast, the components of digital business have a positive impact on the share of renewable energy in the total primary energy supply (, , are 0.033 (p = 0.046), −0.011 (p = 0.018), and 0.020 (p = 0.046), respectively). This implies that when digitization is implemented in the business sector, it leads to an increase in the adoption of renewable energy sources. By embracing digitalization and integrating modern technologies (big data and cloud computing) into the business sector, the EU countries could enhance their efforts to promote renewable energy. These technologies enable businesses to optimize their energy consumption, improve resource efficiency, and facilitate the integration of renewable energy sources. Conversely, the results of Table 10 suggest that the variables , , and have varying impacts on final energy consumption. While the share of enterprises with e-commerce sales of at least 1% turnover shows a statistically significant positive impact ( = 0.152, p = 0.018), the relationship for the share of enterprises with e-commerce sales ( = 0.130, p = 0.089) and the share of enterprises with web sales ( = 0.021, p = 0.668) is not statistically significant. This finding underscores the importance of considering the characteristics and scale of enterprises when assessing the energy implications of e-commerce activities and highlights the need for targeted policies and measures to encourage energy-efficient practices among businesses with significant e-commerce operations. The values for both models range from 0.837 to 0.853, suggesting that the independent variables collectively explain a substantial portion of the variation in the explanatory variables. The Wald chi2 statistics for all models demonstrate the overall significance of the regression models, with high chi2 values indicating a significant relationship between the independent variables , , and EI, FEC, , and . The intraclass correlation (rho) values for all models in the analysis range from 0.663 to 0.904. These values indicate that a substantial proportion of the variance in the output is attributable to the differences across entities, accounting for approximately 66.3% to 90.4% of the total variance.
Based on the provided results, governance efficiency (WGI) has a significant influence on the dependent variables, excluding final energy consumption. This indicates that the effectiveness of governance in terms of efficiency and regulatory frameworks directly affects energy intensity, CO2 emissions, or the adoption of renewable energy sources in the analyzed context. At the same time, WGI is conducive to extending renewable energy, and the growth of WGI provokes a decline in carbon dioxide emissions and energy intensity. GDP has a significant positive impact on final energy consumption, renewable energy, and energy intensity, but it does not significantly affect CO2 emissions. The results show that TO has different effects on the dependent variables. It is positively associated with final energy consumption and the share of renewable energy, suggesting that countries with more open trade policies tend to prioritize the use of renewable energy sources. However, it has a negative effect on energy intensity. This means that countries with more open trade policies tend to have less energy intensity. Growth of TO leads to declining EI on average for all models with variables , , and by 0.17.
Land surface temperature (LST) is negatively associated with all dependent variables, excluding CO2 emissions. It allows the conclusion that countries experiencing higher temperatures tend to have lower energy intensity, renewable energy, and energy consumption. This shows that countries with higher temperatures could face obstacles in increasing the adoption of renewable energy sources. Thus, LST growth led to declining energy intensity on average by 0.09, final energy consumption by 0.25, and renewable energy consumption by 0.08. However, LST is positively associated with CO2 emissions, indicating that higher land surface temperatures may contribute to higher carbon emissions. Increasing LST provokes an increase in CO2 emissions by 0.1. Population density has significant positive effects on all variables, excluding energy intensity. This means that higher population density is associated with less energy intensity and with higher final energy consumption, CO2 emissions, and renewable energy. The significant positive effect between population density and the share of renewable energy indicates that areas with higher population density have a greater potential for adopting and integrating renewable energy sources. This could be driven by factors such as policy support, economies of scale, and the availability of infrastructure for renewable energy installations.
5. Discussion
The empirical findings from this investigation support our four hypotheses, indicating that digital business, the share of enterprises with e-commerce sales, enterprises with e-commerce sales of at least 1% turnover, and enterprises with web sales have a statistically significant impact on energy efficiency.
The substantial impact of all digital business indicators on energy intensity reinforces the potential of digitalization to enhance energy efficiency and reduce energy consumption in the EU. This aligns with the conclusions drawn by previous scholars [73,74,75], providing further evidence of the positive relationship between digital business practices and energy intensity reduction. These consistent findings highlight the importance of embracing digital technologies and strategies to promote energy efficiency across various sectors.
However, it is essential to acknowledge the presence of contrasting results in some studies [77,78,79,80], suggesting a nonlinear effect of digitalization on energy intensity. These divergent outcomes emphasize the complexity of the relationship, indicating that the impact of digital business practices on energy efficiency may vary based on specific contextual factors or interactions with other influencing variables. Such complexities warrant further investigation and in-depth analysis to better understand the nuanced nature of this relationship.
Additionally, the statistically significant positive impact of the share of enterprises with e-commerce sales of at least 1% turnover on final energy consumption echoes findings from another study [76]. This finding indicates that the energy demands associated with e-commerce activities, including order fulfillment, warehousing, and transportation, contribute to increased energy consumption. It underscores the importance of considering energy-efficient measures in e-commerce operations and implementing strategies to mitigate their energy-intensive processes.
6. Conclusions
This study aims at analyzing the impact of the share of enterprises with e-commerce sales, enterprises with e-commerce sales of at least 1% turnover, and enterprises with web sales (via websites, apps, or online marketplaces) on energy efficiency. This study arises from the increasing significance of digital business practices in the EU and their potential impact on energy efficiency and sustainability. As digitalization and e-commerce continue to expand, there is a growing need to understand how these trends influence energy consumption, CO2 emissions, and the adoption of renewable energy sources. By exploring the associations between digital business indicators and energy efficiency, this research aims to provide valuable insights for policymakers and businesses to enhance energy-saving strategies, promote renewable energy integration, and advance the transition to a more sustainable and low-carbon economy. Understanding the implications of digital business on energy efficiency is essential in shaping effective policies and practices to tackle environmental challenges and meet energy sustainability targets in the EU.
The empirical results demonstrate the significant impact of digital business on energy intensity, CO2 emissions, and the share of renewable energy in the EU. All indicators of digital business exhibit a statistically significant negative association with energy intensity, indicating that increased levels of digital business contribute to improved energy efficiency and reduced energy consumption. Moreover, the findings highlight the positive role of digital business practices in reducing CO2 emissions. By embracing digitalization and integrating modern technologies like big data and cloud computing, EU countries can enhance their efforts to promote renewable energy implementation and mitigate carbon emissions. The share of enterprises with e-commerce sales of at least 1% turnover has a statistically significant positive impact on final energy consumption, emphasizing the need for energy-efficient measures in e-commerce operations. However, the relationships for the share of enterprises with e-commerce sales and the share of enterprises with web sales are not statistically significant.
7. Policy Implications
Considering the findings, the following policy implications for improving energy efficiency within digital business could be outlined:
- It is necessary to establish energy efficiency standards specifically tailored for digital businesses, including e-commerce platforms. These standards should cover areas such as data centers, server utilization, packaging practices, and logistics operations. Implementing mandatory energy efficiency standards will promote sustainable practices and optimize energy consumption in the digital business sector.
- The government should incentivize and facilitate the adoption of renewable energy sources by digital businesses, including e-commerce platforms. This could be achieved by providing financial incentives, tax breaks, or grants for investing in renewable energy infrastructure, such as on-site solar panels or wind turbines.
- Policymakers should facilitate collaboration between digital businesses and energy providers to optimize energy consumption and promote energy efficiency. This should involve partnerships that offer preferential energy pricing for e-commerce platforms based on their commitment to energy efficiency and demand response programs. By collaborating with energy providers, digital businesses access expertise and technologies to improve their energy efficiency performance.
- The EU countries should intensify investment in smart grid infrastructure to support the energy needs of an expanding digital business sector. Smart grids enable real-time monitoring, efficient energy distribution, and demand-side management. This facilitates the integration of renewable energy sources, enhances energy efficiency, and enables load balancing to optimize energy consumption. In addition, it is crucial to allocate funding for research and innovation projects that address energy efficiency challenges in the digital business sector. Encouraging collaboration between academia, industry, and research institutions will drive innovation and the development of energy-efficient practices and technologies.
- Governments should mandate energy audits and reporting for digital businesses, particularly those engaged in e-commerce activities. Energy audits help identify energy-saving opportunities and enable businesses to track their energy consumption over time. Requiring regular reports of energy performance will drive transparency and accountability, encouraging businesses to improve their energy efficiency practices.
- It is necessary to promote skills development and training programs focused on energy efficiency for digital businesses. This can include initiatives to upskill and reskill professionals in energy management, data analytics, and sustainable practices. The EU countries should launch public awareness campaigns to educate consumers about the energy implications of e-commerce and the importance of sustainable purchasing behaviors. This could include raising awareness about energy-efficient delivery options, encouraging consolidated shipments, and promoting responsible consumption. Informed consumer choices could drive market demand for energy-efficient digital services and products.
8. Research Limitations and Further Investigations
Despite the reliable and valuable findings, this study has limitations that could be investigated in future analyses. The results highlight the importance of digital business practices in enhancing energy efficiency, reducing energy intensity, and promoting using renewable energy sources in the EU. Policymakers and businesses should consider the adoption of digital technologies and e-commerce practices to drive sustainable energy transitions and achieve environmental goals. However, further research is needed to explore the mechanisms through which digital business practices impact energy consumption and better understand these relationships’ nuances. Furthermore, the chosen data series of analysis include the period of the COVID-19 pandemic. The pandemic’s unprecedented disruptions to daily life and business operations may have significantly influenced energy consumption patterns, digital business practices, and overall economic activity. This aspect should be thoroughly investigated to understand the impact of pandemic-induced changes in consumer behavior, work-from-home practices, and supply chain disruptions on energy efficiency and adopting renewable energy sources. In addition, this study focuses on analyzing the EU countries, limiting the findings’ implications for other countries. Future studies should extend the list of variables that could boost energy efficiency improvement and digital business development, such as investment, e-governance, and internet penetration. The study’s limitation lies in the neglect of technology-related cause-effect relationships and the absence of considering the time-factor influence (time lag), suggesting that future investigations should incorporate these factors to gain a more comprehensive understanding of the digital business–energy efficiency relationship. Additionally, future investigations should incorporate different stakeholders (energy companies; digital enterprises; etc.) and develop the recommendations for them for improving energy efficiency. Future investigations should consider the influence of global indicators, such as GDP per capita, on both e-commerce and traditional trade. Accounting for these broader economic factors, the study will consider significant drivers that affect energy efficiency in both spheres and do not miss the opportunity for a comprehensive comparison between digital and traditional business models.
Author Contributions
Conceptualization, A.K., O.L. and T.P.; methodology, A.K., O.L. and T.P.; software, A.K., O.L. and T.P.; validation, A.K., O.L. and T.P.; formal analysis, A.K., O.L. and T.P.; investigation, A.K., O.L. and T.P.; resources, A.K., O.L. and T.P.; data curation, A.K., O.L. and T.P.; writing—original draft preparation, A.K., O.L. and T.P.; writing—review and editing, A.K., O.L. and T.P.; visualization, A.K., O.L. and T.P. All authors have read and agreed to the published version of the manuscript.
Funding
This research was funded by the Ministry of Education and Science of Ukraine, grant number 0121U100468.
Data Availability Statement
Not applicable.
Conflicts of Interest
The authors declare no conflict of interest.
References
- Pietrzak, P.; Takala, J. Digital trust—Asystematic literature review. Forum Sci. Oeconomia 2021, 9, 59–71. [Google Scholar] [CrossRef]
- Skvarciany, V.; Jurevičienë, D. An approach to the measurement of the digital economy. Forum Sci. Oeconomia 2021, 9, 89–102. [Google Scholar] [CrossRef]
- Pudryk, D.; Kwilinski, A.; Lyulyov, O.; Pimonenko, T. Towards Achieving Sustainable Development: Interactions between Migration and Education. Forum Sci. Oeconomia 2023, 11, 113–132. [Google Scholar] [CrossRef]
- Chen, Y.; Lyulyov, O.; Pimonenko, T.; Kwilinski, A. Green development of the country: Role of macroeconomic stability. Energy Environ. 2023. [Google Scholar] [CrossRef]
- Hussain, H.I.; Haseeb, M.; Kamarudin, F.; Dacko-Pikiewicz, Z.; Szczepańska-Woszczyna, K. The role of globalization, economic growth and natural resources on the ecological footprint in Thailand: Evidence from nonlinear causal estimations. Processes 2021, 9, 1103. [Google Scholar] [CrossRef]
- Kuzior, A.; Sira, M.; Brozek, P. Using blockchain and artificial intelligence in energy management as a tool to achieve energy efficiency. Virtual Econ. 2022, 5, 69–90. [Google Scholar] [CrossRef]
- Zhanibek, A.; Abazov, R.; Khazbulatov, A. Digital transformation of a country’s image: The case of the Astana international finance center in Kazakhstan. Virtual Econ. 2022, 5, 71–94. [Google Scholar] [CrossRef]
- Chygryn, O.; Kuzior, A.; Olefirenko, O.; Uzik, J. Green Brand as a New Pattern of Energy-Efficient Consumption. Mark. Manag. Innov. 2022, 3, 78–87. [Google Scholar] [CrossRef]
- Chygryn, O.; Bektas, C.; Havrylenko, O. Innovation and Management of Smart Transformation Global Energy Sector: Systematic Literature Review. Bus. Ethics Leadersh. 2023, 7, 105–112. [Google Scholar] [CrossRef]
- Szczepańska-Woszczyna, K.; Gatnar, S. Key Competences of Research and Development Project Managers in High Technology Sector. Forum Sci. Oeconomia 2022, 10, 107–130. [Google Scholar] [CrossRef]
- Bag, S.; Omrane, A. The relationship between the personality traits of entrepreneurs and their decision-making process: The role of manufacturing SMEs’ institutional environment in India. Forum Sci. Oeconomia 2021, 9, 103–122. [Google Scholar] [CrossRef]
- Wyrwa, J.; Zaraś, M.; Wolak, K. Smart solutions in cities during the COVID-19 pandemic. Virtual Econ. 2021, 4, 88–103. [Google Scholar] [CrossRef]
- Ziabina, Y.; Navickas, V. Innovations in Energy Efficiency Management: Role of Public Governance. Mark. Manag. Innov. 2022, 4, 218–227. [Google Scholar] [CrossRef]
- Saługa, P.W.; Zamasz, K.; Dacko-Pikiewicz, Z.; Szczepańska-Woszczyna, K.; Malec, M. Risk-adjusted discount rate and its components for onshore wind farms at the feasibility stage. Energies 2021, 14, 6840. [Google Scholar] [CrossRef]
- Trushkina, N.; Abazov, R.; Rynkevych, N.; Bakhautdinova, G. Digital Transformation of Organizational Culture under Conditions of the Information Economy. Virtual Econ. 2020, 3, 7–38. [Google Scholar] [CrossRef]
- Dzwigol, H.; Aleinikova, O.; Umanska, Y.; Shmygol, N.; Pushak, Y. An Entrepreneurship Model for Assessing the Investment Attractiveness of Regions. J. Entrep. Educ. 2019, 22 (Suppl. S1), 1–7. [Google Scholar]
- Vaníčková, R.; Szczepańska-Woszczyna, K. Innovation of business and marketing plan of growth strategy and competitive advantage in exhibition industry. Pol. J. Manag. Stud. 2020, 21, 425–445. [Google Scholar] [CrossRef]
- Kolosok, S.; Saher, L.; Kovalenko, Y.; Delibasic, M. Renewable Energy and Energy Innovations: Examining Relationships Using Markov Switching Regression Model. Mark. Manag. Innov. 2022, 2, 151–160. [Google Scholar] [CrossRef]
- Karnowski, J.; Miśkiewicz, R. Climate Challenges and Financial Institutions: An Overview of the Polish Banking Sector’s Practices. Eur. Res. Stud. J. 2021, XXIV, 120–139. [Google Scholar] [CrossRef]
- Arefieva, O.; Polous, O.; Arefiev, S.; Tytykalo, V.; Kwilinski, A. Managing sustainable development by human capital reproduction in the system of company`s organizational behavior. IOP Conf. Ser. Earth Environ. Sci. 2021, 628, 012039. [Google Scholar] [CrossRef]
- Kharazishvili, Y.; Kwilinski, A.; Sukhodolia, O.; Dzwigol, H.; Bobro, D.; Kotowicz, J. The systemic approach for estimating and strategizing energy security: The case of Ukraine. Energies 2021, 14, 2126. [Google Scholar] [CrossRef]
- Miśkiewicz, R.; Rzepka, A.; Borowiecki, R.; Olesińki, Z. Energy Efficiency in the Industry 4.0 Era: Attributes of Teal Organizations. Energies 2021, 14, 6776. [Google Scholar] [CrossRef]
- Dźwigoł, H. The uncertainty factor in the market economic system: The microeconomic aspect of sustainable development. Virtual Econ. 2021, 4, 98–117. [Google Scholar] [CrossRef]
- Miśkiewicz, R.; Matan, K.; Karnowski, J. The Role of Crypto Trading in the Economy, Renewable Energy Consumption and Ecological Degradation. Energies 2022, 15, 3805. [Google Scholar] [CrossRef]
- Miśkiewicz, R. The Impact of Innovation and Information Technology on Greenhouse Gas Emissions: A Case of the Visegrád Countries. J. Risk Financ. Manag. 2021, 14, 59. [Google Scholar] [CrossRef]
- Matvieieva, Y.; Hamida, H.B. Modeling and Forecasting Energy Efficiency Impact on the Human Health. Health Econ. Manag. Rev. 2022, 3, 78–85. [Google Scholar] [CrossRef]
- Vakulenko, I.; Lieonov, H. Renewable Energy and Health: Bibliometric Review of Non-Medical Research. Health Econ. Manag. Rev. 2022, 3, 44–53. [Google Scholar] [CrossRef]
- Letunovska, N.; Saher, L.; Vasylieva, T.; Lieonov, S. Dependence of public health on energy consumption: A cross-regional analysis. In Proceedings of the E3S Web of Conferences, Odesa, Ukraine, 16 April 2021; p. 250. [Google Scholar] [CrossRef]
- Zhou, X.; Zhou, D.; Zhao, Z.; Wang, Q. A framework to analyze carbon impacts of digital economy: The case of China. Sustain. Prod. Consum. 2022, 31, 357–369. [Google Scholar] [CrossRef]
- Sovacool, B.K.; Upham, P.; Monyei, C.G. The “whole systems” energy sustainability of digitalization: Humanizing the community risks and benefits of Nordic datacenter development. Energy Res. Soc. Sci. 2022, 88, 102493. [Google Scholar] [CrossRef]
- Katal, A.; Dahiya, S.; Choudhury, T. Energy efficiency in cloud computing data centers: A survey on software technologies. Clust. Comput. 2022, 26, 1845–1875. [Google Scholar] [CrossRef] [PubMed]
- Dzwigol, H.; Trushkina, N.; Kwilinski, A. The organizational and economic mechanism of implementing the concept of green logistics. Virtual Econ. 2021, 4, 41–75. [Google Scholar] [CrossRef]
- Ziabina, Y.; Kovalenko, Y. Regularities in the Development of The Theory of Energy Efficiency Management. SocioEconomic Chall. 2021, 5, 117–132. [Google Scholar] [CrossRef]
- Drożdż, W.; Kinelski, G.; Czarnecka, M.; Wójcik-Jurkiewicz, M.; Maroušková, A.; Zych, G. Determinants of Decarbonization—How to Realize Sustainable and Low Carbon Cities? Energies 2021, 14, 2640. [Google Scholar] [CrossRef]
- Chygryn, O.; Miskiewicz, R. New trends and patterns in green competitiveness: A bibliometric analysis of evolution. Virtual Econ. 2022, 5, 24–41. [Google Scholar] [CrossRef] [PubMed]
- Gao, X.; Huang, W.; Wang, H. Financial twitter sentiment on bitcoin return and high-frequency volatility. Virtual Econ. 2021, 4, 7–18. [Google Scholar] [CrossRef]
- Pavlyk, V. Assessment of green investment impact on the energy efficiency gap of the national economy. Financ. Mark. Inst. Risks 2020, 4, 117–123. [Google Scholar] [CrossRef]
- Prokopenko, O.; Miśkiewicz, R. Perception of “green shipping” in the contemporary conditions. Entrep. Sustain. Issues 2020, 8, 269–284. [Google Scholar] [CrossRef]
- Hmoud, B. The adoption of artificial intelligence in human resource management. Forum Sci. Oeconomia 2021, 9, 105–118. [Google Scholar] [CrossRef]
- Dacko-Pikiewicz, Z. Building a family business brand in the context of the concept of stakeholder-oriented value. Forum Sci. Oeconomia 2019, 7, 37–51. [Google Scholar] [CrossRef]
- Miśkiewicz, R. Challenges facing management practice in the light of Industry 4.0: The example of Poland. Virtual Econ. 2019, 2, 37–47. [Google Scholar] [CrossRef]
- Dzwigol, H. Research Methodology in Management Science: Triangulation. Virtual Econ. 2022, 5, 78–93. [Google Scholar] [CrossRef]
- Stępień, S.; Smędzik-Ambroży, K.; Polcyn, J.; Kwiliński, A.; Maican, I. Are small farms sustainable and technologically smart? Evidence from Poland, Romania, and Lithuania. Cent. Eur. Econ. J. 2023, 10, 116–132. [Google Scholar] [CrossRef]
- Yamoah, F.A.; Ul Haque, A. Strategic management through digital platforms for remote working in the higher education industry during and after the COVID-19 pandemic. Forum Sci. Oeconomia 2022, 10, 111–128. [Google Scholar] [CrossRef]
- Ramadania, R.; Ratnawati, R.; Juniwati, J.; Afifah, N.; Heriyadi, H.; Darma, D.C. Impulse buying and hedonic behavior: A mediation effect of positive emotions. Virtual Econ. 2022, 5, 43–64. [Google Scholar] [CrossRef] [PubMed]
- Novikov, V.V. Digitalization of Economy and Education: Path to Business Leadership and National Security. Bus. Ethics Leadersh. 2021, 5, 147–155. [Google Scholar] [CrossRef]
- Miśkiewicz, R. The importance of knowledge transfer on the energy market. Polityka Energetyczna 2018, 21, 49–62. [Google Scholar] [CrossRef]
- Trzeciak, M.; Jonek-Kowalska, I. Monitoring and Control in Program Management as Effectiveness Drivers in Polish Energy Sector. Diagnosis and Directions of Improvement. Energies 2021, 14, 4661. [Google Scholar] [CrossRef]
- Trzeciak, M.; Kopec, T.P.; Kwilinski, A. Constructs of Project Programme Management Supporting Open Innovation at the Strategic Level of the Organization. J. Open Innov. Technol. Mark. Complex. 2022, 8, 58. [Google Scholar] [CrossRef]
- Vorontsova, A.; Vasylieva, T.; Lyeonov, S.; Artyukhov, A.; Mayboroda, T. Education expenditures as a factor in bridging the gap at the level of digitalization. In Proceedings of the 2021 11th International Conference on Advanced Computer Information Technologies, ACIT 2021—Proceedings 2021, Deggendorf, Germany, 15–17 September 2021; pp. 242–245. [Google Scholar] [CrossRef]
- Hassan, T.; Song, H.; Khan, Y.; Kirikkaleli, D. Energy efficiency a source of low carbon energy sources? Evidence from 16 high-income OECD economies. Energy 2022, 243, 123063. [Google Scholar] [CrossRef]
- Dong, K.; Sun, R.; Hochman, G.; Li, H. Energy intensity and energy conservation potential in China: A regional comparison perspective. Energy 2018, 155, 782–795. [Google Scholar] [CrossRef]
- Shahiduzzaman, M.; Alam, K. Changes in energy efficiency in Australia: A decomposition of aggregate energy intensity using logarithmic mean Divisia approach. Energy Policy 2013, 56, 341–351. [Google Scholar] [CrossRef]
- Feng, T.; Sun, L.; Zhang, Y. The relationship between energy consumption structure, economic structure and energy intensity in China. Energy Policy 2009, 37, 5475–5483. [Google Scholar] [CrossRef]
- Hosan, S.; Karmaker, S.C.; Rahman, M.M.; Chapman, A.J.; Saha, B.B. Dynamic links among the demographic dividend, digitalization, energy intensity and sustainable economic growth: Empirical evidence from emerging economies. J. Clean. Prod. 2022, 330, 129858. [Google Scholar] [CrossRef]
- Su, B.; Goh, T.; Ang, B.W.; Ng, T.S. Energy consumption and energy efficiency trends in Singapore: The case of a meticulously planned city. Energy Policy 2022, 161, 112732. [Google Scholar] [CrossRef]
- Taylor, P.G.; d’Ortigue, O.L.; Francoeur, M.; Trudeau, N. Final energy use in IEA countries: The role of energy efficiency. Energy Policy 2010, 38, 6463–6474. [Google Scholar] [CrossRef]
- Paramati, S.R.; Shahzad, U.; Doğan, B. The role of environmental technology for energy demand and energy efficiency: Evidence from OECD countries. Renew. Sustain. Energy Rev. 2022, 153, 111735. [Google Scholar] [CrossRef]
- Khan, S.; Murshed, M.; Ozturk, I.; Khudoykulov, K. The roles of energy efficiency improvement, renewable electricity production, and financial inclusion in stimulating environmental sustainability in the Next Eleven countries. Renew. Energy 2022, 193, 1164–1176. [Google Scholar] [CrossRef]
- McLaughlin, E.; Choi, J.K.; Kissock, K. Techno-economic impact assessments of energy efficiency improvements in the industrial combustion systems. J. Energy Resour. Technol. 2022, 144, 082109. [Google Scholar] [CrossRef]
- Lipiäinen, S.; Kuparinen, K.; Sermyagina, E.; Vakkilainen, E. Pulp and paper industry in energy transition: Toward energy-efficient and low carbon operation in Finland and Sweden. Sustain. Prod. Consum. 2022, 29, 421–431. [Google Scholar] [CrossRef]
- Alajmi, R.G. Carbon emissions and electricity generation modeling in Saudi Arabia. Environ. Sci. Pollut. Res. 2022, 29, 23169–23179. [Google Scholar] [CrossRef]
- Zhao, J.; Dong, K.; Dong, X.; Shahbaz, M. How renewable energy alleviate energy poverty? A global analysis. Renew. Energy 2022, 186, 299–311. [Google Scholar] [CrossRef]
- Wen, J.; Okolo, C.V.; Ugwuoke, I.C.; Kolani, K. Research on influencing factors of renewable energy, energy efficiency, on technological innovation. Does trade, investment and human capital development matter? Energy Policy 2022, 160, 112718. [Google Scholar] [CrossRef]
- Akadiri, S.S.; Adebayo, T.S. Asymmetric nexus among financial globalization, nonrenewable energy, renewable energy use, economic growth, and carbon emissions: Impact on environmental sustainability targets in India. Environ. Sci. Pollut. Res. 2022, 29, 16311–16323. [Google Scholar] [CrossRef] [PubMed]
- Jahanger, A.; Ozturk, I.; Onwe, J.C.; Joseph, T.E.; Hossain, M.R. Do technology and renewable energy contribute to energy efficiency and carbon neutrality? Evidence from top ten manufacturing countries. Sustain. Energy Technol. Assess. 2023, 56, 103084. [Google Scholar] [CrossRef]
- Chen, H.; Shi, Y.; Zhao, X. Investment in renewable energy resources, sustainable financial inclusion, and energy efficiency: A case of US economy. Resour. Policy 2022, 77, 102680. [Google Scholar] [CrossRef]
- Miskiewicz, R. Efficiency of electricity production technology from postprocess gas heat: Ecological, economic and social benefits. Energies 2020, 13, 6106. [Google Scholar] [CrossRef]
- Saługa, P.W.; Szczepańska-Woszczyna, K.; Miśkiewicz, R.; Chład, M. Cost of equity of coal-fired power generation projects in Poland: Its importance for the management of decision-making process. Energies 2020, 13, 4833. [Google Scholar] [CrossRef]
- Iqbal, N.; Kim, D.H. An Iot task management mechanism based on predictive optimization for efficient energy consumption in smart residential buildings. Energy Build. 2022, 257, 111762. [Google Scholar]
- Rusch, M.; Schöggl, J.P.; Baumgartner, R.J. Application of digital technologies for sustainable product management in a circular economy: A review. Bus. Strategy Environ. 2023, 32, 1159–1174. [Google Scholar] [CrossRef]
- Xue, Y.; Tang, C.; Wu, H.; Liu, J.; Hao, Y. The emerging driving force of energy consumption in China: Does digital economy development matter? Energy Policy 2022, 165, 112997. [Google Scholar] [CrossRef]
- Ghaffarianhoseini, A.; Ghaffarianhoseini, A.; Tookey, J.; Omrany, H.; Fleury, A.; Naismith, N.; Ghaffarianhoseini, M. The essence of smart homes: Application of intelligent technologies toward smarter urban future. In Artificial Intelligence: Concepts, Methodologies, Tools, and Applications; IGI Global: Hershey, PA, USA, 2017; pp. 79–121. [Google Scholar]
- Yang, A.; Han, M.; Zeng, Q.; Sun, Y. Adopting building information modeling (BIM) for the development of smart buildings: A review of enabling applications and challenges. Adv. Civ. Eng. 2021, 2021, 1–26. [Google Scholar] [CrossRef]
- Pålsson, H.; Pettersson, F.; Hiselius, L.W. Energy consumption in e-commerce versus conventional trade channels-Insights into packaging, the last mile, unsold products and product returns. J. Clean. Prod. 2017, 164, 765–778. [Google Scholar] [CrossRef]
- Reijnders, L.; Hoogeveen, M.J. Energy effects associated with e-commerce: A case-study concerning online sales of personal computers in The Netherlands. J. Environ. Manag. 2001, 62, 317–321. [Google Scholar] [CrossRef]
- Lei, X.; Ma, Y.; Ke, J.; Zhang, C. The Non-Linear Impact of the Digital Economy on Carbon Emissions Based on a Mediated Effects Model. Sustainability 2023, 15, 7438. [Google Scholar] [CrossRef]
- Xu, Q.; Zhong, M.; Li, X. How does digitalization affect energy? International evidence. Energy Econ. 2022, 107, 105879. [Google Scholar] [CrossRef]
- Cardinali, P.G.; De Giovanni, P. Responsible digitalization through digital technologies and green practices. Corp. Soc. Responsib. Environ. Manag. 2022, 29, 984–995. [Google Scholar] [CrossRef]
- Wang, W.; Yang, X.; Cao, J.; Bu, W.; Adebayo, T.S.; Dilanchiev, A.; Ren, S. Energy internet, digital economy, and green economic growth: Evidence from China. Innov. Green Dev. 2022, 1, 100011. [Google Scholar] [CrossRef]
- Morley, J.; Widdicks, K.; Hazas, M. Digitalization, energy and data demand: The impact of Internet traffic on overall and peak electricity consumption. Energy Res. Soc. Sci. 2018, 38, 128–137. [Google Scholar] [CrossRef]
- Babu, B.R.; Parande, A.K.; Basha, C.A. Electrical and electronic waste: A global environmental problem. Waste Manag. Res. 2007, 25, 307–318. [Google Scholar]
- Gunasekaran, A.; Marri, H.B.; McGaughey, R.E.; Nebhwani, M.D. E-commerce and its impact on operations management. Int. J. Prod. Econ. 2002, 75, 185–197. [Google Scholar] [CrossRef]
- Chen, X.; Mao, S.; Lv, S.; Fang, Z. A Study on the Non-Linear Impact of Digital Technology Innovation on Carbon Emissions in the Transportation Industry. Int. J. Environ. Res. Public Health 2022, 19, 12432. [Google Scholar] [CrossRef]
- Dogan, E.; Majeed, M.T.; Luni, T. Are clean energy and carbon emission allowances caused by bitcoin? A novel time-varying method. J. Clean. Prod. 2022, 347, 131089. [Google Scholar] [CrossRef]
- Huang, F.L.; Wiedermann, W.; Zhang, B. Accounting for heteroskedasticity resulting from between-group differences in multilevel models. Multivar. Behav. Res. 2022, 58, 637–657. [Google Scholar] [CrossRef]
- Orji, E.N.; John-Akamelu, C.R. Book Tax Differences and Financial Distress of Public Listed Consumer Goods Firms in Nigeria. J. Glob. Account. 2023, 9, 346–382. [Google Scholar]
- Bhimavarapu, V.M.; Rastogi, S.; Gupte, R.; Pinto, G.; Shingade, S. Does the Impact of Transparency and Disclosure on the Firm’s Valuation Depend on the ESG? J. Risk Financ. Manag. 2022, 15, 410. [Google Scholar] [CrossRef]
- Pesaran, M.H. A simple panel unit root test in the presence of cross-section dependence. J. Appl. Econom. 2007, 22, 265–312. [Google Scholar]
- Baltagi, B.H.; Hashem Pesaran, M. Heterogeneity and cross section dependence in panel data models: Theory and applications introduction. J. Appl. Econom. 2007, 22, 229–232. [Google Scholar] [CrossRef]
- Pao, H.T.; Tsai, C.M. Multivariate Granger causality between CO2 emissions, energy consumption, FDI (foreign direct investment) and GDP (gross domestic product): Evidence from a panel of BRIC (Brazil, Russian Federation, India, and China) countries. Energy 2011, 36, 685–693. [Google Scholar] [CrossRef]
- Bakhsh, K.; Rose, S.; Ali, M.F.; Ahmad, N.; Shahbaz, M. Economic growth, CO2 emissions, renewable waste and FDI relation in Pakistan: New evidence from 3SLS. J. Environ. Manag. 2017, 196, 627–632. [Google Scholar] [CrossRef]
- Alqaralleh, H. On the nexus of CO2 emissions and renewable and nonrenewable energy consumption in Europe: A new insight from panel smooth transition. Energy Environ. 2021, 32, 443–457. [Google Scholar] [CrossRef]
- Liu, Y.; Sadiq, F.; Ali, W.; Kumail, T. Does tourism development, energy consumption, trade openness and economic growth matters for ecological footprint: Testing the Environmental Kuznets Curve and pollution haven hypothesis for Pakistan. Energy 2022, 245, 123208. [Google Scholar] [CrossRef]
- Szczepańska-Woszczyna, K.; Gedvilaitė, D.; Nazarko, J.; Stasiukynas, A.; Rubina, A. Assessment of Economic Convergence among Countries in the European Union. Technological and Economic Development of Economy 2022, 28, 1572–1588. [Google Scholar] [CrossRef]
- Karnowski, J.; Rzońca, A. Should Poland join the euro area? The challenge of the boom-bust cycle. Argum. Oeconomica 2023, 1, 227–262. [Google Scholar] [CrossRef]
- Shahbaz, M.; Nasreen, S.; Ahmed, K.; Hammoudeh, S. Trade openness–carbon emissions nexus: The importance of turning points of trade openness for country panels. Energy Econ. 2017, 61, 221–232. [Google Scholar] [CrossRef]
- Ziabina, Y.; Pimonenko, T.; Starchenko, L. Energy Efficiency of National Economy: Social, Economic and Ecological Indicators. SocioEconomic Chall. 2020, 4, 160–174. [Google Scholar] [CrossRef]
- Wołowiec, T.; Kolosok, S.; Vasylieva, T.; Artyukhov, A.; Skowron, Ł.; Dluhopolskyi, O.; Sergiienko, L. Sustainable governance, energy security, and energy losses of Europe in turbulent times. Energies 2022, 15, 8857. [Google Scholar] [CrossRef]
- Kafy, A.A.; Al Rakib, A.; Fattah, M.A.; Rahaman, Z.A.; Sattar, G.S. Impact of vegetation cover loss on surface temperature and carbon emission in a fastest-growing city, Cumilla, Bangladesh. Build. Environ. 2022, 208, 108573. [Google Scholar] [CrossRef]
- Jamali, A.A.; Kalkhajeh, R.G.; Randhir, T.O.; He, S. Modeling relationship between land surface temperature anomaly and environmental factors using GEE and Giovanni. J. Environ. Manag. 2022, 302, 113970. [Google Scholar] [CrossRef]
- Luan, F.; Yang, X.; Chen, Y.; Regis, P.J. Industrial robots and air environment: A moderated mediation model of population density and energy consumption. Sustain. Prod. Consum. 2022, 30, 870–888. [Google Scholar] [CrossRef]
- Mahumane, G.; Mulder, P. Urbanization of energy poverty? The case of Mozambique. Renew. Sustain. Energy Rev. 2022, 159, 112089. [Google Scholar] [CrossRef]
- Jiang, L.; Shi, X.; Wu, S.; Ding, B.; Chen, Y. What factors affect household energy consumption in mega-cities? A case study of Guangzhou, China. J. Clean. Prod. 2022, 363, 132388. [Google Scholar] [CrossRef]
- Eurostat. Available online: https://ec.europa.eu/eurostat (accessed on 10 April 2023).
- World Data Bank. Available online: https://databank.worldbank.org (accessed on 10 April 2023).
- Anderson, B.J.; Slater, L.J.; Dadson, S.J.; Blum, A.G.; Prosdocimi, I. Statistical attribution of the influence of urban and tree cover change on streamflow: A comparison of large sample statistical approaches. Water Resour. Res. 2022, 58, e2021WR030742. [Google Scholar] [CrossRef]
- Im, K.S.; Pesaran, M.H.; Shin, Y. Testing for unit roots in heterogeneous panels. J. Econom. 2003, 115, 53–74. [Google Scholar] [CrossRef]
- Choi, I. Unit root tests for panel data. J. Int. Money Financ. 2001, 20, 249–272. [Google Scholar] [CrossRef]
- Marques, A.C.; Junqueira, T.M. European energy transition: Decomposing the performance of nuclear power. Energy 2022, 245, 123244. [Google Scholar] [CrossRef]
Figure 1.
The theoretical framework of the research.


Table 1.
Descriptive statistics of the selected variables for analysis of the digital business effect on energy efficiency.
Table 1.
Descriptive statistics of the selected variables for analysis of the digital business effect on energy efficiency.
| Variable | Explanation | Source | Mean | CV | Min | Max |
|---|---|---|---|---|---|---|
| Energy intensity | Eurostat [105] | 5.076 | 0.090 | 3.798 | 6.201 | |
| Final energy consumption | 2.763 | 0.495 | −0.713 | 5.398 | ||
| CO2 emissions from fuel combustion per total electricity output | 0.215 | 3.057 | −1.544 | 3.590 | ||
| Share of renewable energy in total primary energy supply | 2.591 | 0.255 | −0.010 | 3.783 | ||
| The share of enterprises with e-commerce sales | 2.853 | 0.166 | 1.335 | 3.846 | ||
| The share of enterprises with e-commerce sales of at least 1% turnover | 2.698 | 0.193 | 0.916 | 3.757 | ||
| The share of enterprises with web sales (via websites, apps, or online marketplaces) | 2.299 | 0.226 | 0.875 | 3.329 | ||
| GDP per capita | World Data Bank [106] | 10.226 | 0.061 | 8.864 | 11.725 | |
| Governance efficiency | −0.141 | −4.636 | −2.442 | 0.627 | ||
| Trade openness | 4.768 | 0.096 | 4.005 | 5.940 | ||
| Land Surface Temperature | 2.676 | 0.186 | 0.272 | 3.416 | ||
| PD | Population density | 4.679 | 0.195 | 2.875 | 7.384 |
Table 2.
The correlation matrix between the selected variables for analysis of the digital business’ effect on energy efficiency.
Table 2.
The correlation matrix between the selected variables for analysis of the digital business’ effect on energy efficiency.
| Variables | PD | |||||||||||
|---|---|---|---|---|---|---|---|---|---|---|---|---|
| 1.000 | ||||||||||||
| −0.351 | 1.000 | |||||||||||
| 0.021 | −0.313 | 1.000 | ||||||||||
| −0.126 | 0.158 | −0.379 | 1.000 | |||||||||
| −0.392 | 0.070 | −0.174 | −0.066 | 1.000 | ||||||||
| −0.318 | 0.028 | −0.212 | 0.007 | 0.966 | 1.000 | |||||||
| −0.328 | 0.061 | −0.036 | −0.095 | 0.924 | 0.878 | 1.000 | ||||||
| −0.501 | 0.063 | 0.010 | 0.004 | 0.673 | 0.601 | 0.530 | 1.000 | |||||
| 0.155 | −0.055 | 0.546 | −0.534 | 0.174 | 0.143 | 0.185 | 0.239 | 1.000 | ||||
| 0.041 | −0.097 | 0.267 | −0.498 | −0.369 | −0.383 | −0.323 | −0.434 | 0.069 | 1.000 | |||
| −0.124 | 0.002 | 0.249 | −0.719 | −0.054 | −0.160 | 0.003 | 0.105 | 0.355 | 0.424 | 1.000 | ||
| −0.124 | 0.002 | 0.249 | −0.719 | −0.054 | −0.160 | 0.003 | −0.124 | 0.105 | 0.355 | 0.624 | 1.000 |
Table 3.
The results of VIF for the selected variables for analysis of the digital business’ effect on energy efficiency.
Table 3.
The results of VIF for the selected variables for analysis of the digital business’ effect on energy efficiency.
| Variables | ||||||||||||
|---|---|---|---|---|---|---|---|---|---|---|---|---|
| 1.85 | – | – | 1.85 | – | – | 1.85 | – | – | 1.85 | – | – | |
| – | 1.63 | – | – | 1.63 | – | – | 1.63 | – | – | 1.63 | – | |
| – | – | 1.45 | – | – | 1.63 | – | – | 1.45 | – | – | 1.45 | |
| 3.21 | 3.21 | 3.21 | 3.21 | 3.21 | 3.21 | 3.21 | 3.21 | 3.21 | 3.21 | 3.21 | 3.21 | |
| 4.01 | 3.97 | 3.57 | 4.01 | 3.97 | 3.97 | 4.01 | 3.97 | 3.57 | 4.01 | 3.97 | 3.57 | |
| 1.07 | 1.07 | 1.08 | 1.07 | 1.07 | 1.07 | 1.07 | 1.07 | 1.08 | 1.07 | 1.07 | 1.08 | |
| 3.29 | 3.28 | 3.38 | 3.29 | 3.28 | 3.28 | 3.29 | 3.28 | 3.38 | 3.29 | 3.28 | 3.38 | |
| 2.93 | 2.96 | 2.97 | 2.93 | 2.96 | 2.96 | 2.93 | 2.96 | 2.97 | 2.93 | 2.96 | 2.97 | |
Table 4.
The results of the unit root test.
| Variables | Im–Pesaran–Shin | Augmented Dickey–Fuller | ||||||
|---|---|---|---|---|---|---|---|---|
| At Level | At 1-st Difference | At Level | At 1-st Difference | |||||
| Statistic | p Value | Statistic | p Value | Statistic | p Value | Statistic | p Value | |
| 2.069 | 0.981 | −10.884 | 0.000 | 1.422 | 0.078 | 32.594 | 0.000 | |
| 1.303 | 0.904 | −7.100 | 0.000 | 0.691 | 0.245 | 36.072 | 0.000 | |
| 1.804 | 0.964 | −5.439 | 0.000 | 5.238 | 0.000 | 28.548 | 0.000 | |
| −2.776 | 0.003 | −9.272 | 0.000 | 0.295 | 0.384 | 8.697 | 0.000 | |
| −3.856 | 0.000 | −5.517 | 0.000 | 0.629 | 0.265 | 28.540 | 0.000 | |
| −5.560 | 0.000 | −4.068 | 0.000 | −1.458 | 0.928 | 2.651 | 0.004 | |
| −12.630 | 0.000 | −14.190 | 0.000 | 9.914 | 0.000 | 35.966 | 0.000 | |
| −5.804 | 0.000 | −5.976 | 0.000 | 2.523 | 0.006 | 12.155 | 0.000 | |
Table 5.
Results of the Hausman test.
| Statistics | ||||||||||||
|---|---|---|---|---|---|---|---|---|---|---|---|---|
| chi2 | 25.75 | 29.44 | 27.61 | 57.54 | 57.66 | 56.29 | 21.09 | 18.59 | 21.15 | 83.72 | 85.97 | 82.27 |
| Prob > chi2 | 0.000 | 0.000 | 0.000 | 0.000 | 0.000 | 0.000 | 0.000 | 0.002 | 0.000 | 0.000 | 0.000 | 0.000 |
Table 6.
Results of the Wooldridge test.
| Statistics | ||||||||||||
|---|---|---|---|---|---|---|---|---|---|---|---|---|
| F(1,21) | 41.045 | 40.989 | 45.229 | 82.008 | 82.164 | 83.051 | 50.510 | 72.701 | 55.248 | 30.908 | 30.547 | 31.383 |
| Prob > F | 0.000 | 0.000 | 0.000 | 0.000 | 0.000 | 0.000 | 0.000 | 0.000 | 0.000 | 0.000 | 0.000 | 0.000 |
Table 7.
The results of the modified Wald test for groupwise heteroscedasticity.
| Statistics | ||||||||||||
|---|---|---|---|---|---|---|---|---|---|---|---|---|
| chi2 | 469.19 | 257.77 | 1180.56 | 127.10 | 132.70 | 135.52 | 6939.78 | 4547.71 | 4467.72 | 391.29 | 250.14 | 198.59 |
| Prob > chi2 | 0.000 | 0.000 | 0.000 | 0.000 | 0.000 | 0.000 | 0.000 | 0.000 | 0.000 | 0.000 | 0.000 | 0.000 |
Table 8.
The results of Pesaran’s cross-section dependence test.
| Statistics | ||||||||||||
|---|---|---|---|---|---|---|---|---|---|---|---|---|
| stat | 20.519 | 20.748 | 23.443 | 8.603 | 7.732 | 9.275 | 2.033 | 2.098 | 3.555 | 14.976 | 14.952 | 17.449 |
| Pr | 0.000 | 0.000 | 0.000 | 0.000 | 0.000 | 0.000 | 0.042 | 0.036 | 0.000 | 0.000 | 0.000 | 0.000 |
Table 9.
The results of regression analysis: fixed effects model.
| Variables | ||||||||||||
|---|---|---|---|---|---|---|---|---|---|---|---|---|
| Coef. | Prob. | Coef. | Prob. | Coef. | Prob. | Coef. | Prob. | Coef. | Prob. | Coef. | Prob. | |
| −0.166 | 0.000 | −0.166 | 0.000 | −0.101 | 0.000 | −0.016 | 0.241 | −0.011 | 0.440 | −0.006 | 0.548 | |
| −0.397 | 0.000 | −0.410 | 0.000 | −0.427 | 0.000 | 0.195 | 0.000 | 0.192 | 0.000 | 0.190 | 0.000 | |
| −0.068 | 0.111 | −0.067 | 0.122 | −0.092 | 0.036 | −0.066 | 0.011 | −0.067 | 0.010 | −0.069 | 0.007 | |
| −0.284 | 0.001 | −0.264 | 0.002 | −0.335 | 0.000 | 0.204 | 0.000 | 0.204 | 0.000 | 0.200 | 0.000 | |
| −0.095 | 0.007 | −0.100 | 0.005 | −0.100 | 0.006 | −0.030 | 0.157 | −0.031 | 0.146 | −0.031 | 0.145 | |
| −1.390 | 0.000 | −1.536 | 0.000 | −1.411 | 0.000 | −0.430 | 0.001 | −0.442 | 0.001 | −0.434 | 0.001 | |
| const | 17.457 | 0.000 | 18.139 | 0.000 | 17.871 | 0.000 | 2.101 | 0.001 | 2.170 | 0.001 | 2.156 | 0.001 |
| F | 46.54 | 0.000 | 45.30 | 0.000 | 42.27 | 0.000 | 14.43 | 0.000 | 14.24 | 0.000 | 14.18 | 0.000 |
| sigma_u | 1.101 | 1.203 | 1.133 | 1.452 | 1.457 | 1.453 | ||||||
| sigma_e | 0.059 | 0.060 | 0.061 | 0.036 | 0.036 | 0.036 | ||||||
| rho | 0.997 | 0.998 | 0.997 | 0.999 | 0.999 | 0.999 | ||||||
| −0.246 | 0.000 | −0.280 | 0.000 | −0.155 | 0.000 | 0.156 | 0.000 | 0.164 | 0.000 | 0.073 | 0.011 | |
| 0.136 | 0.309 | 0.130 | 0.325 | 0.094 | 0.477 | 0.308 | 0.001 | 0.317 | 0.000 | 0.345 | 0.000 | |
| 0.088 | 0.462 | 0.099 | 0.402 | 0.054 | 0.649 | 0.226 | 0.004 | 0.222 | 0.005 | 0.252 | 0.002 | |
| −0.071 | 0.764 | −0.030 | 0.898 | −0.148 | 0.536 | 0.421 | 0.007 | 0.399 | 0.011 | 0.466 | 0.004 | |
| 0.067 | 0.492 | 0.064 | 0.512 | 0.061 | 0.536 | 0.126 | 0.049 | 0.129 | 0.043 | 0.133 | 0.041 | |
| 2.663 | 0.000 | 2.431 | 0.000 | 2.635 | 0.000 | 3.544 | 0.000 | 3.685 | 0.000 | 3.574 | 0.000 | |
| const | −12.368 | 0.000 | −11.385 | 0.000 | −11.779 | 0.000 | −19.233 | 0.000 | −19.866 | 0.000 | −19.703 | 0.000 |
| F | 6.15 | 0.000 | 6.85 | 0.000 | 5.73 | 0.000 | 28.79 | 0.000 | 29.02 | 0.000 | 26.48 | 0.000 |
| sigma_u | 2.043 | 1.883 | 2.017 | 3.380 | 3.480 | 3.420 | ||||||
| sigma_e | 0.165 | 0.164 | 0.166 | 0.108 | 0.108 | 0.110 | ||||||
| rho | 0.993 | 0.992 | 0.993 | 0.999 | 0.999 | 0.999 | ||||||
Table 10.
The results of regression analysis: PCSE estimations.
| Variables | ||||||||||||
|---|---|---|---|---|---|---|---|---|---|---|---|---|
| Coef. | Prob. | Coef. | Prob. | Coef. | Prob. | Coef. | Prob. | Coef. | Prob. | Coef. | Prob. | |
| −0.112 | 0.001 | −0.112 | 0.000 | −0.076 | 0.002 | 0.130 | 0.089 | 0.152 | 0.032 | 0.021 | 0.668 | |
| 0.628 | 0.000 | 0.622 | 0.000 | 0.639 | 0.000 | 0.284 | 0.003 | 0.291 | 0.002 | 0.311 | 0.001 | |
| −0.170 | 0.000 | −0.166 | 0.000 | −0.153 | 0.001 | −0.011 | 0.916 | −0.027 | 0.797 | 0.020 | 0.810 | |
| −0.176 | 0.000 | −0.178 | 0.000 | −0.175 | 0.000 | 1.958 | 0.000 | 1.968 | 0.000 | 1.849 | 0.000 | |
| −0.096 | 0.023 | −0.085 | 0.036 | −0.103 | 0.018 | −0.280 | 0.000 | −0.286 | 0.000 | −0.215 | 0.001 | |
| −0.055 | 0.091 | −0.068 | 0.034 | −0.046 | 0.163 | 0.848 | 0.000 | 0.861 | 0.000 | 0.799 | 0.000 | |
| const | 11.461 | 0.000 | 11.413 | 0.000 | 11.412 | 0.000 | 5.817 | 0.000 | 5.715 | 0.000 | 5.399 | 0.000 |
| Wald chi2 | 527.73 | 0.000 | 507.37 | 0.000 | 547.35 | 0.000 | 699.06 | 0.000 | 737.31 | 0.000 | 533.59 | 0.000 |
| 0.979 | 0.981 | 0.978 | 0.837 | 0.836 | 0.853 | |||||||
| rho | 0.663 | 0.682 | 0.656 | 0.736 | 0.728 | 0.851 | ||||||
| −0.179 | 0.003 | −0.118 | 0.002 | −0.056 | 0.033 | 0.033 | 0.046 | 0.011 | 0.018 | 0.020 | 0.046 | |
| −0.044 | 0.731 | −0.053 | 0.681 | −0.064 | 0.620 | 0.022 | 0.048 | 0.019 | 0.083 | 0.018 | 0.073 | |
| −0.044 | 0.020 | −0.058 | 0.044 | −0.075 | 0.027 | 0.032 | 0.087 | 0.038 | 0.052 | 0.036 | 0.053 | |
| 0.816 | 0.563 | 0.852 | 0.493 | 0.806 | 0.542 | 0.462 | 0.000 | 0.458 | 0.000 | 0.452 | 0.000 | |
| 0.100 | 0.057 | 0.106 | 0.051 | 0.106 | 0.049 | −0.082 | 0.028 | −0.084 | 0.024 | −0.085 | 0.018 | |
| 0.197 | 0.008 | 0.189 | 0.007 | 0.206 | 0.008 | 0.416 | 0.000 | 0.416 | 0.000 | 0.417 | 0.000 | |
| const | −3.804 | 0.071 | −4.060 | 0.053 | −3.999 | 0.063 | 7.128 | 0.000 | 7.153 | 0.000 | 7.096 | 0.000 |
| Wald chi2 | 47.06 | 0.000 | 47.90 | 0.000 | 41.62 | 0.000 | 196.83 | 0.000 | 190.72 | 0.000 | 178.35 | 0.000 |
| 0.232 | 0.245 | 0.215 | 0.844 | 0.844 | 0.846 | |||||||
| rho | 0.904 | 0.889 | 0.903 | 0.836 | 0.840 | 0.852 | ||||||
Disclaimer/Publisher’s Note: The statements, opinions and data contained in all publications are solely those of the individual author(s) and contributor(s) and not of MDPI and/or the editor(s). MDPI and/or the editor(s) disclaim responsibility for any injury to people or property resulting from any ideas, methods, instructions or products referred to in the content. |
© 2023 by the authors. Licensee MDPI, Basel, Switzerland. This article is an open access article distributed under the terms and conditions of the Creative Commons Attribution (CC BY) license (https://creativecommons.org/licenses/by/4.0/).
Share and Cite
MDPI and ACS Style
Kwilinski, A.; Lyulyov, O.; Pimonenko, T. The Impact of Digital Business on Energy Efficiency in EU Countries. Information 2023, 14, 480. https://0-doi-org.brum.beds.ac.uk/10.3390/info14090480
AMA Style
Kwilinski A, Lyulyov O, Pimonenko T. The Impact of Digital Business on Energy Efficiency in EU Countries. Information. 2023; 14(9):480. https://0-doi-org.brum.beds.ac.uk/10.3390/info14090480
Chicago/Turabian StyleKwilinski, Aleksy, Oleksii Lyulyov, and Tetyana Pimonenko. 2023. "The Impact of Digital Business on Energy Efficiency in EU Countries" Information 14, no. 9: 480. https://0-doi-org.brum.beds.ac.uk/10.3390/info14090480
Note that from the first issue of 2016, this journal uses article numbers instead of page numbers. See further details here.