
Mapping the Landscape of Misinformation Detection: A Bibliometric Approach
by
 ,
,
Andra Sandu
1, 
Ioana Ioanăș
2,
Camelia Delcea
1,* ,
,
Laura-Mădălina Geantă
3 and
Liviu-Adrian Cotfas
1
1
Department of Economic Informatics and Cybernetics, Bucharest University of Economic Studies, 010552 Bucharest, Romania
2
Department of Business and Administration, University of Bucharest, 030018 Bucharest, Romania
3
Department of Accounting and Audit, Bucharest University of Economic Studies, 010552 Bucharest, Romania
*
Author to whom correspondence should be addressed.
Information 2024, 15(1), 60; https://0-doi-org.brum.beds.ac.uk/10.3390/info15010060
Submission received: 11 December 2023
/
Revised: 13 January 2024
/
Accepted: 15 January 2024
/
Published: 19 January 2024
(This article belongs to the Special Issue Recent Advances in Social Media Mining and Analysis)
Abstract
:The proliferation of misinformation presents a significant challenge in today’s information landscape, impacting various aspects of society. While misinformation is often confused with terms like disinformation and fake news, it is crucial to distinguish that misinformation involves, in mostcases, inaccurate information without the intent to cause harm. In some instances, individuals unwittingly share misinformation, driven by a desire to assist others without thorough research. However, there are also situations where misinformation involves negligence, or even intentional manipulation, with the aim of shaping the opinions and decisions of the target audience. Another key factor contributing to misinformation is its alignment with individual beliefs and emotions. This alignment magnifies the impact and influence of misinformation, as people tend to seek information that reinforces their existing beliefs. As a starting point, some 56 papers containing ‘misinformation detection’ in the title, abstract, or keywords, marked as “articles”, written in English, published between 2016 and 2022, were extracted from the Web of Science platform and further analyzed using Biblioshiny. This bibliometric study aims to offer a comprehensive perspective on the field of misinformation detection by examining its evolution and identifying emerging trends, influential authors, collaborative networks, highly cited articles, key terms, institutional affiliations, themes, and other relevant factors. Additionally, the study reviews the most cited papers and provides an overview of all selected papers in the dataset, shedding light on methods employed to counter misinformation and the primary research areas where misinformation detection has been explored, including sources such as online social networks, communities, and news platforms. Recent events related to health issues stemming from the COVID-19 pandemic have heightened interest within the research community regarding misinformation detection, a statistic which is also supported by the fact that half of the papers included in top 10 papers based on number of citations have addressed this subject. The insights derived from this analysis contribute valuable knowledge to address the issue, enhancing our understanding of the field’s dynamics and aiding in the development of effective strategies to detect and mitigate the impact of misinformation. The results spotlight that IEEE Access occupies the first position in the current analysis based on the number of published papers, the King Saud University is listed as the top contributor for the misinformation detection, while in terms of countries, the top-5 list based on the highest contribution to this area is made by the USA, India, China, Spain, and the UK. Moreover, the study supports the promotion of verified and reliable sources of data, fostering a more informed and trustworthy information environment.
1. Introduction
The fast advancement of technology has completely revolutionized the way people live, communicate, and carry out their daily activities. This, in addition to the multitude of benefits it offers, also brings with it disadvantages and serious problems that humanity faces today.
One of the most widely debated and popular issues encountered nowadays, due to the advancement of technology, is the spread of false information.
Before going further with the discussion, we need to state that there is a difference between the terms regarding “misinformation”, “disinformation”, “malinformation”, “propaganda”, and “fake news”.
As Gradon et al. [1] mention, citing Wardle and Dias [2], misinformation refers to false information that is not distributed with the intent to cause harm. Thus, in this case, the individuals might choose to distribute the information via different channels (e.g., online social networks) from the desire to be helpful in a given situation. The quick progress in technology has made it possible for anyone to access the Internet and social media platforms [3,4]. Fake, misleading, or manipulative information spreads incredibly easily and has an extreme impact on our society, making it harder to discern between truth and fiction. Conspiracy theories, photos, video manipulation, and fake news are just a few examples of the various types of misinformation that can be distributed effortlessly through the use of social media and communication technology. Among the main causes of the spread of misinformation is that it often matches individual beliefs and feelings, amplifying its impact and influence, as people tend to look for information that supports what they already believe. On the other hand, there are situations in which the users of social media are spreading misinformation as an act of being present on social media, without even thinking about fact-checking [5]. As Del Vicario et al. [6] observed, selective exposure to content represents the main primary driver of content diffusion, while the homogeneity and polarization in each group of people determine the dynamics and the size of the misinformation outcome.
On the contrary, “disinformation” is also a popular word associated with this field, but its correct definition is false information that is created/disseminated with a clear purpose to cause harm. As Gradon et al. [1] mention, when disinformation occurs, it is specifically produced by individuals/organizations that have a political, psychological, social, and/or financial motivations.
The term “malinformation” refers to a situation in which the information is true, but the intent is to produce harm—it usually refers to cases in which private information is revealed with the purpose of harming/destroying the reputation of a person/company.
On the other hand, “propaganda” can be either true or false information and has the purpose to persuade an audience [1], often bearing a political connotation.
Regarding the term “fake news”, there is an entire controversy about how it is meant to be used. Carmi et al. [7] pointed out that the initial intention regarding the use of the term was to signify both the use of misinformation and disinformation. With all these, some political actors have begun to use it as an accuse to discredit the news sources that were not in line with their political views, which were conducted in a confusion related to the true meaning of the term [1]. In this context, a report by the UK Government has highlighted the decision to no longer use the term “fake news” [1,8]. Dennis et al. [9] underline the fact that such news has the capacity to spread faster, farther, and more broadly than the true news, producing major societal impacts. In this context, Siino et al. [10] underline the fact that in order to prevent the fake news from spreading, a near-real-time reaction is crucial. The spread of fake news may lead to serious problems, including the harming of democratic processes, intensifying instability in society and politics, and diminishing public confidence in public institutions [11], thereby making combating this phenomenon of utter importance [12].
Similar definitions related to the use of the abovementioned terms are provided in a post on the Taylor & Francis website [13], while Lazer et al. [14] provide an insightful discussion related to “the science of fake news”.
As a result, in this paper, we are only discussing the issues related to misinformation detection, and we use the misinformation definition as presented above. It should be noted that combating the misinformation phenomenon is a complex and challenging task. When addressing it, one should consider the limits between freedom of expression and the need for a society protected from misinformation. Thus, the subject is under a continuous debating process [15,16].
A recent event in the healthcare domain that has triggered an abundance of uncertainty and fear in people across the globe is the COVID-19 pandemic [17]. Some of the news and information surrounding this significant event included conspiracy theories that caused fear and suspicion of medical authorities, as well as false information regarding the virus’s origins, vaccines, and unconfirmed efficacy of treatments [18]. Additionally, false information that exaggerated or minimized the pandemic’s severity was spread around the globe, leading to a negative impact on public awareness of risks and safety measures [19]. This event attracted the attention of scientific researchers from all around the world who, based on the conducted studies, tried to better determine the causes, trends, and possible strategies to combat the disinformation phenomenon. For example, Barua et al. [20] discuss the effects of misinformation on COVID-19 individual responses, suggesting to the authorities to initiate proper safety measures in order to protect public health from being exploited. Krittanawong et al. [21] focus their misinformation dissemination study on the data taken from Twitter, as the authors have observed that Twitter has also played an important role in the propagation of misinformation in the case of other endemics that the world has faced (such as Zika, and Ebola). As a result, the authors extracted a dataset from Twitter based on specific keywords and observed that the selected tweets contain unverifiable information and blatant misinformation [21]. As the authors underline, the misinformation in the selected tweets has mainly been of three causes: the assumption that there is a relationship between influenza infection and COVID-19, the assumption that the influenza vaccina can lead to a positive COVID-19 test, and the assumption that some of the death cases related to influenza- and allergy-related situations have been reported as death cases due to COVID-19 [21].
Furthermore, politics is another field where misinformation is a serious concern. Disinformation may spread rapidly through the use of information shared on social media platforms to manipulate voters and democratic processes in unanticipated ways. It comes from the desire to control society, achieve profit, as well as gain specific goals, like different benefits and positions. Several researchers have been interested in this topic since the dissemination of misleading information in politics can have detrimental effects, including decreasing public confidence in institutions and causing disorder and tensions in society [22,23,24].
Other than that, the economic domain is also impacted by misleading information. People can make wrong financial choices or conduct risky transactions as a result of inaccurate or manipulated information about financial markets, economic trends, or business opportunities. These actions can directly affect people’s well-being and the general condition of the economy as a whole, respectively, causing instability in financial markets. Thus, combating misinformation in the economics domain requires a responsible and cautious approach to verifying sources and trusting financial and objective information [25].
Since misinformation represents an actual danger in today’s globalized society, education and the practice of professional journalism have become essential weapons in the ongoing battle against it. It is crucial to comprehend this phenomenon, determine its origins, and implement efficient countermeasures against misinformation in order to protect truth, democracy, and information integrity in our current age.
Critical thinking skills, examining the sources of the information one consumes, and recognizing the dangers of false information and the serious consequences it may have on both personal and societal levels have become of utter importance in present-day society, highly affected by various uncertainties. Misinformation affects trust in public institutions, political, economic, and financial decisions, as well as social relations, public health, safety, and education of the population. Spreading misinformation on social networks and beyond is a very severe concern in today’s society. Focusing on the misinformation and the artificial intelligence tools to deal with it, Vicari and Komendatova [26] highlighted that misinformation can strongly influence risk management. According to the authors, policies and programs to encourage the topic of artificial intelligence tools for reducing misinformation on social media are of utter importance [26].
Having said this, the present study focusses on performing a bibliometric analysis in the context of a misinformation detection area, starting from the selection of a relevant set of articles in this field and their in-depth evaluation. The use of the bibliometric approach relies on the fact that this type of analysis offers the required information for analyzing the main contributors to the field in terms of either authors, sources, universities, and countries, while highlighting information related to the used keywords, trends, and connections among the authors [27]. Thus, the aim of the paper is to identify hidden trends and to offer new perspectives and possible strategies to combat this dangerous phenomenon. In order to achieve this aim, the paper tries to answer a series of research questions, as highlighted in the following:
- Q1: What are the cutting-edge trends that research articles on misinformation detection are unveiling?
- Q2: Which are the tendencies in the area of misinformation detection?
- Q3: Which countries have made significant contributions to misinformation detection, and what insights can be drawn regarding intra-country and inter-country collaborations?
- Q4: What is the impact of the extracted articles, how relevant is this domain nowadays, and what findings can be drawn concerning the number of citations, over the period under analysis?
- Q5: Is there any connection between the geographical area of a country and the number of published articles related to misinformation detection?
- Q6: How can the collaboration network among authors who have published in the field of misinformation detection be characterized?
In order to answer the formulated research questions, a dataset has been extracted using the Web of Science (also known as Web of Knowledge; WoS) platform [28] and has been analyzed as described in Section 2 of the paper.
Thus, the subsequent sections of the paper deal with the methodology used for dataset extraction and bibliometric analysis (Section 2), analysis of the dataset through bibliometric-specific indicators, including a review of the top 10 most cited papers (Section 3), discussions (Section 4) and limitations (Section 5), and concluding remarks (Section 6).
2. Materials and Methods
As Block and Fisch [27] stated, there should be noted the difference between the bibliometric analysis and a review analysis. While the latter deals with providing a summary of the content and of the most important findings within a field, the bibliometric analysis is mainly used for highlighting the structure of a particular field, focusing on its development [27].
From a methodological point of view, the bibliometric analysis comprises mainly two parts: one related to the dataset extraction, and another one dedicated to performing the bibliometric analysis [29,30]. The two parts are described in the following sub-sections.
2.1. Part 1: Dataset Extraction
In the dataset extraction part, a series of filters are applied to the WoS platform in order to extract the papers associated to the misinformation detection area (please consider steps 1–4 in Table 1).
The choice for the WoS platform is in line with the observations made by Bakir et al. [31], who underline that the platform covers a wide range of disciplines and journals, being at the same time highly recognized by the research community. Similar ideas are highlighted by Cobo et al. [32], Modak et al. [33], and Mulet-Forteza et al. [34]. Furthermore, in order to support the choice of this platform, we must mention that two of the most well-known software programs for conducting the bibliometric analysis, namely VOSviewer [35] and Biblioshiny [36], provide the option to process the files extracted from a limited amount of databases, including WoS.
Another point that should be highlighted in the paper is related to the access to the papers offered by the WoS platform. As Liu [37] and Liu [38] observed, the WoS platforms offer access to the user based on subscription. Thus, different types of subscriptions might lead to differences in the dataset extraction. In this context, we have to mention that we have had access to all ten indexes offered by the WoS platform.
The first exploration step included in the dataset extraction part consists of a search action performed on title, abstract, and keywords. Fifty-six articles were obtained from a query that searched in all available titles and returned only the ones that contain keywords related to misinformation detection, namely “misinformation_detection” and “detect_misinformation”. The choice for the search keywords is in line with similar studies on the same topic. For example, Vicari and Komendatova [26], in a study dealing with artificial intelligence tools to deal with misinformation, use “misinformation” as a research keyword for extracting the database from the WoS platform. Yeung et al. [39], in a paper discussing medical- and health-related misinformation, used the term “misinformati” (which is only the first part of the “misinformation” keyword) along with other specific keywords related to online media and the medical field. In addition, “misinformation” has been used by Mahajan and Gupta [40] in the context of COVID-19 vaccine misinformation on social media. The second and third queries used were similar to the previous one, with the same filtering criteria, respectively the same keywords, but this time applied to the abstract and keywords. The results showed that the second query returned 151 documents, while the third one returned 58 articles. The last query that was executed in the first exploration step applied the OR operation between all the previously used queries. Hence, after merging, 185 documents resulted that contain words related to misinformation detection, either in the title, abstract, or keyword sections (Table 1).
The second and the third exploration steps restricted the dataset collected exclusively to articles written in English. This was decided based on the fact that the majority of the researchers and the intended readership for the papers understand the English language. Furthermore, it should be stated that through the idea of “article”, the WoS platform indexes all the papers that represent relevant (new and original) research [41]. Therefore, in the type of document marked as “article”, the WoS platform also includes conference proceedings [41]. As Donner [42] stated, choosing a particular type of document for the bibliometric analysis is mandatory for differentiating and properly comparing the selected documents. Thus, as can be observed from Table 1, the number of articles returned, namely 185, was not affected after applying the language criteria, as the keywords relevant to misinformation detection utilized in the first step were in English; therefore, the articles returned in the first phase were all written in English. On the other hand, the dataset acquired was limited after applying the “article” condition, which led to a significant reduction in data collection, specifically 79 articles (Table 1).
The final step, the fourth one, involved imposing a restriction regarding the year of publication. Since the study was conducted in early November 2023, the year 2023 was excluded from the investigation, as it is still ongoing at the moment of analysis and incomplete in comparison to the other years. As a result, the timestamp chosen covers the years 2016–2022, and after making use of this filter, the total number of articles obtained and included in the examination is 56 (Table 1).
2.2. Part 2: Performing Bibilometric Analysis
For conducting the bibliometric study, it was exploited the well-known R tool, respectively the Biblioshiny 4.1 software, developed by Aria and Cuccurullo [43]. Biblioshiny provides insights about the analyzed area, along with highlighting crucial linkages between different aspects, considering its outstanding ability to evaluate data, design graphs, and create illustrations, interactive tables, and images [44]. Considering the scientific literature, it has been chosen for bibliometric analyses from various research areas, such as, but not being limited to: software testing [45], analyzing oil prices and financial assets [46], education [47], Industry 5.0 [48], the use of artificial intelligence in agent-based modeling [49], the use of agent-based modeling in transportation [50], grey systems theory [51], neutrosophic theory [52], and cybernetics [53].
The steps taken for conducting the bibliometric analysis are highlighted in Table 2.
While most of the indicators used are self-explained through their name, there are some indicators on which more information should be provided.
For example, Bradford’s law on source clustering delineates the most-cited journals within the selected dataset. According to Bradford’s law, the journals are divided into three categories by taking into account the number of articles published by each of them [54,55]. Basically, it is expected that when considering the proportion of the papers in every cluster to represent 1/3 of all the papers, the number of sources in each cluster is 1:n:n2 [54,55].
Furthermore, an interesting indicator that needs further explanation is the normalized total citations (NTC). This indicator is obtained by dividing the total number of citations acquired by an article by the average number of citations of the papers published in the same year in which the paper has been published [51]. Also, the metric gives equal credit to all the authors; therefore, its values are obtained without further division of the metric by the number of the authors. In the particular case in which in the dataset only one paper is published in a specific year, the value of the NTC is equal to 1. Therefore, the metric indicates how many times the current paper has scored more citations than the average publication from the same year. The metric depends both on the number of the total citations of the paper to be analyzed but also on the scientific production of the same year in which the paper has been published.
In addition to the information provided in Table 2 regarding the bibliometric analysis conducted in this study, it should be stated that in the fourth step dedicated to papers analysis, we have provided an overview on the top 10 most cited papers, followed by a review of the top 10 most cited papers for better highlighting the research interests of the papers that have succeeded in attaining the attention of the research community. Furthermore, as the resulted database contains a relatively low number of documents, in the papers analysis step, we have divided the dataset into several categories based on the analysis conducted in the paper, the purpose of the analysis, used methodologies and results, for the purpose of better shaping the research interest in the papers published in the area of misinformation detection.
3. Dataset Analysis
The data collected in the previous section, associated with mapping the landscape of misinformation detection, are meticulously analyzed from different perspectives in the next pages, by providing precise details in terms of sources, citations, authors, existing literature, and many more aspects.
3.1. Dataset Overview
Table 3 provides the main information about the dataset collection, which is comprised of an overall number of 56 papers published in 41 different journals throughout a seven-year period, from 2016 to 2022. The small value obtained for the average years from publication, namely 2.04, suggests that a considerable number of articles included in the analysis are recent papers.
Furthermore, from Table 3 it results that articles written in the area of misinformation detection have considerably caught the attention of the scientific community, a hypothesis proved by the increased value obtained for the average citations per documents of 15.27, along with 4.621, the average citations per year per document. The number of references is also significative in this field, namely 2821.
By analyzing the graph corresponding to annual scientific production evolution, captured in Figure 1, a significant upward trend can be clearly spotted. In the period between 2016 and 2018, a maximum of two documents were published per year, followed by a substantial increase registered later in 2022, reaching up to 23 documents, presenting an annual growth rate of 68.64%. The upward trend depicted in Figure 1 in the latest years of the analysis might be due to the occurrence of the COVID-19 pandemic, which has boosted the misinformation content on all media channels, including social networks.
Figure 2 captures the annual average article citations per year evolution, with values that oscillate within 1.5 and 8.3, suggesting that the papers written in the area of mapping the landscape of misinformation detection had a remarkable visibility in the selected timestamp of 2016–2022. The trend is characterized by fluctuations—the greatest value was registered in 2020, while the smallest one, in 2017. Analyzing the peak in Figure 2, we can anticipate that a great number of the papers included in the dataset are related to the misinformation detection in the period of the COVID-19 pandemic. The downward trend depicted for 2021 and 2022 in Figure 2, correlated with the high number of papers published in the 2021–2022 period as presented in Figure 1, might be due to the limited period of time between the year in which the papers have been published (2021, respectively 2022) and the moment in which the dataset has been extracted (2023) and might not be related to a decrease in the interest in the topic of misinformation detection.
The information regarding the documents’ contents is presented in Table 4. A total of 199 keywords have been documented, with an average of 3.55 keywords associated with each document. The obtained value is in line with other research from the field which has featured the use of a bibliometric analysis, being positioned at the superior limit of the expected data [52]. As the extracted papers on misinformation detection have been published mostly in the recent year, it has been observed that the issues related to keywords retrieval by WoS from the journals’ websites or the situations in which the journals did not require for the papers to have keywords specified within their content—as discussed by Liu [56]—have been overcome.
Keywords plus, known as index terms that were automatically generated from the titles of cited articles, have a value of 78, resulting in an average of 1.39 such terms per document.
Table 5 reveals insights about the authors, distinguishing a total of 178 researchers with 191 appearances. By analyzing the small value for authors of single-authored documents, specifically 2, and comparing it with 56, the total number of extracted documents, it can be highlighted that this discrepancy suggests a strong possibility of a dense collaboration network among authors in the field of mapping the landscape of misinformation detection. This inference is strengthened by the fact that 176 writers are involved in multi-authored papers, a substantial proportion when compared to the total number of authors, which stands at 178, as illustrated in Table 5.
As depicted in Table 6, the number of single-authored documents is 2, the same value as the one for authors of single-authored documents. This can be interpreted as an indication of the fact that the researchers who have opted for the choice of publishing papers as single authors have, on average, contributed to approximately 1 document.
Given that the number of authors surpasses the number of selected papers in the bibliometric analysis, the documents per author indicator achieves a value of 0.315, showing an average of 3.18 authors contributing to each publication. The number of co-authors per document is 3.41, and the increased value of the collaboration index, namely 3.26, suggests that the authors opted to collaborate in this area.
3.2. Sources Analysis
Figure 3 brings to the foreground the top 8 most relevant journals based on the number of published documents in the area of misinformation detection. The top has been obtained by imposing that each journal should have a minimum of 2 publications in the area of misinformation detection. The leadership position is held by the 2 prominent sources, IEEE Access, and Information Processing & Management, both with 5 papers. The International Journal of Advanced Computer Science and Applications is ranked in the third place, with a close value of 3 documents.
Other essential journals, addressing topics ranging from big data’s societal impact to environmental research, IT, computer science, and social network analysis and mining, all with 2 documents, are listed in alphabetical order: Big Data & Society, International Journal of Environmental Research and Public Health, IT Professional, Peerj Computer Science, Social Network Analysis and Mining.
Considering the journals that have been included in the top 8 most relevant sources, it should be noted that most of the sources are in the area of computer sciences, while some of them are in the area of social sciences and public health. Given that most of the papers included in the dataset belong to the COVID-19 period, it was expected that the profile of the journals in which the papers dealing with misinformation detection have been published be of either computer science or social networks—public health.
The application of Bradford’s law emphasizes the essential significance of the aforementioned sources, thus requiring creating three separate zones in accordance with the concept at hand. The first, zone 1, consists of a few extremely prolific publications that are renowned for their frequent citations in scientific literature. Moving on to zone 2, we find a broader range of sources classified as moderate producers, each with a solid, but average, citation count. Finally, in the last one, zone 3, we find a substantial store of publications, their production showing a noticeable and steady fall, with citations in scientific literature occurring only occasionally.
Figure 4 presents the Bradford’s law on source clustering. Based on this, there can be distinguished a group of 6 sources allocated to the popular zone 1, underlining their remarkable status as highly cited journals: IEEE Access, Information Processing & Management, International Journal of Advanced Computer Science and Applications, Big Data & Society, International Journal of Environmental Research and Public Health, and IT Professional.
Furthermore, the relevance of the journals’ significance has been analyzed through the use of the H-index indicator. The H-index, as it is typically referred to, measures the number of papers in a journal that have accumulated at least H citations, demonstrating the scientific significance of these publications.
The Information Processing & Management journal is ranked in the first position based on the H-index value, with 5 papers that gained 5 or more citations in the area of misinformation detection. As expected, the sources that belong to zone 1, according to Bradford’s law, occupy the foremost positions in the ranking and score high values for H-index, between 4 and 2. For more details, please see Figure 5.
Furthermore, it has been observed that all the papers listed as top journals based on H-index (in Figure 5) have also been listed as top journals based on the number of published documents (Figure 3), highlighting the important contribution of these journals to the body of literature associated with misinformation detection.
The journals’ growth based on the number of published papers is captured in Figure 6. As anticipated, IEEE Access presents the most substantial growth, followed closely by Information Processing & Management.
3.3. Authors Analysis
Figure 7 shines a spotlight on the top 11 authors who demonstrated remarkable productivity in publishing papers in the area of misinformation detection.
The most prolific authors are Barve Y and Saini JR, both with 3 published documents, each constituting 5.36% of the total papers extracted. Other relevant authors with 2 published papers are listed in alphabetical order: Alsmadi I, Apostol ES, Ashok N, Ekbal A, Ghosal T, Kotecha K, Kumari R, Truica CO, and Zhou F.
An obvious pattern can be identified in Figure 8, suggesting that most misinformation detection efforts have met an obvious increase since 2021. The substantial boost in research output can plausibly be linked to the lasting effects of the global catastrophic event, namely the COVID-19 pandemic. This unexpected health disaster has highlighted the need for innovative strategies to stop the widespread transmission of misleading information in times of crisis, along with the vital need for effective detection of misinformation, an area that attracted the interest of numerous researchers.
The top 13 most relevant affiliations based on the number of published articles are shown in Figure 9.
The leadership position is held by King Saud University (4 articles), followed closely by the Suryadatta College of Management, Information Research and Technology (3 articles), Symbiosis International Deemed University (3 articles), Texas A&M University (3 articles), and the University of Mannheim (3 articles). For the entire list, please consider Figure 9.
Figure 10 depicts the top 8 most relevant corresponding author’s country. As can be observed, the USA is in the number one spot, with a quantity of 14 documents out of 56, the total amount of extracted papers, representing 25% of the whole dataset collection. Furthermore, the USA encompasses a remarkable position when it comes to the values registered for both the intra-country collaboration index, Single-Country Publications (SCP) (11 documents) and the inter-country collaboration index, Multiple-Country Publications (MCP) (3 documents).
Other relevant countries that must be mentioned here are India (8 articles, SCP = 6, MCP = 2), China (7 articles, SCP = 4, MCP = 3), Spain (3 articles, SCP = 3, MCP = 0), the United Kingdom (3 articles, SCP = 1, MCP = 2), Australia (2 articles, SCP = 2, MCP = 0), Germany (2 articles, SCP = 2, MCP = 0), and Romania (2 articles, SCP = 0, MCP = 2). For more information, please see Figure 10.
One can effortlessly comprehend the distinctive contributions that come from various countries throughout the world by using a global map perspective. Figure 11 displays scientific contributions in a simple manner, with colors that range from shades of gray, that indicate the lack of published documents in the subject of misinformation detection, such as for Turkey, Greece, and Canada, to dark blue, which reflects significant contributions in this area, as in the case of the USA.
Figure 12 captures the top 20 most cited countries. As expected, the USA holds the leadership position with an impressive number of 382 total citations and an average of citations per paper of 27.30.
China is ranked in second place (total citations = 120 citations, average of article citations = 17.10), while in third place is situated Saudi Arabia (total citations = 62, average of article citations = 62.00). For more details, please see Figure 12.
Figure 13 depicts the country collaboration map, and as it can be observed, the USA presents the highest number of collaborations with other countries, more specifically 11. Among the researchers who collaborate with authors from the USA, there are included members from China, the Netherlands, and Poland.
Figure 14 shows the collaboration network in a graphical representation, including the top 50 most relevant researchers in the area of misinformation detection.
3.4. Papers Analysis
To shed light on a diversity of aspects such as the main author’s name, the year of publication, the journal in which the paper was published, the digital object identifier (DOI), the number of authors involved in the research, their country of origin, alongside with the numerical values for key indicators useful in the analysis, such as the total number of citations (TC), total citations per year (TCY), and normalized TC (NTC), the first 10 most cited globally documents belonging to misinformation detection area are extracted and listed in Table 7.
With the aim of providing an in-depth understanding of the content and assisting readers in determining their level of interest in this study, a brief summary of each paper is offered, together with a concise extraction of the methods employed, the data analyzed, and the research’s purpose.
The latter component of this section additionally encompasses a textual analysis, evaluating the most frequently used words found in the entire data collection set. This investigation provides precious details of the dominant themes, patterns, and terminology in the research carried out, by offering a comprehensive resource for grasping the topic being studied. Therefore, the pages that follow provide complete explanations enhanced by interactive graphical representations, such as word clouds.
3.4.1. Top 10 Most Cited Papers—Overview
Based on the information presented in Table 7, the paper that is placed in the first position according to the number of citations is the one written by Shorten et al. [57], which has accumulated 125 total citations, and impressive values for TCY of 41.67, NTC of 6.45, in a period of 2 years since its publishing. Furthermore, the value of the NTC for this paper is 6.45, showing that it has received 6.45 times more citations than the average of the publications in the same year (2021) from the dataset.
The primary article is closely followed by another noteworthy publication in the domain of misinformation detection, belonging to Khan et al. [58], which has also gathered high values in terms of citations: TC—92, TCY—18.40, NTC—3.25.
The idea that the impact, influence, and popularity of these articles stand as indeed substantial is additionally supported by the increased values regarding the indices analyzed in the table below—for each of the extracted articles, the value for total citations exceeds 27, TCY surpasses 9.00, and NTC is greater than 1.39.
As anticipated, in light of the preceding data, there is an increased degree of collaboration among researchers. Based on the data presented in Table 7, the number of authors varies between 2 and 5; hence, a quick computation reveals that the first 10 most cited articles have an average number of 3.1 authors. This suggests that scientists in the aforementioned area opt for collaborating, rather than carrying out individual studies.
3.4.2. Top 10 Most Cited Papers—Review
The articles which reached the top 10 most referenced list are reviewed and summarized in brief form in the ensuing section.
Highlighting the ways in which deep learning technology could benefit in the fight against the global pandemic was the principal objective of the study conducted in the article that belongs to Shorten et al. [57], which investigated a variety of deep learning technologies associated to the COVID-19 outbreak. In summary, the paper illustrates how deep learning can be extremely helpful in managing the COVID-19 pandemic and how useful it can be when it is applied to biomedical research, medical image analysis for the diagnosis and identification of disease in images, epidemiology, and the detection of disinformation, having the potential to significantly reduce false information and truly aid in situations of panic and crises.
The purpose of the study performed by Khan et al. [58] was to detect the variables that affect people’s capacity to identify false information and the tendency to share unverified content on social media. Multiple linear regression models were used to analyze the data collected in the study to examine the relationships between various independent variables (including demographic factors, information literacy skills, and attitude) and the two dependent variables: perceived self-efficacy to recognize misinformation (PSERM) and social media sharing behavior without verification (SWV). The research used survey data that were collected from 396 participants in Indonesia, and the results demonstrated that people’s perceived self-efficacy in identifying misinformation was significantly impacted by multiple criteria including income, education level, information-checking skills, and attitude toward verifying information. The outcomes emphasize the necessity of educational initiatives to address this emerging issue and the crucial role that information literacy and verification skills play in preventing the spread of misleading information.
As the title suggests, the in-depth investigation carried out in the article by Al-Rakhami et al. [59] attempts to better understand the effects of COVID-19 on Twitter and combat misinformation. A consistent collection of tweets, comprising 287,534 non-credible and 121,950 credible tweets, was gathered over a three-month period. The research performed a complete evaluation of the methodologies used in this context, including data collection, annotation, and feature extraction, along with machine learning algorithms, with the ultimate objective of developing an efficient ensemble learning model for misinformation detection. The results of the study demonstrated that, in terms of detection accuracy, the ensemble learning model performed better than the individual machine learning models, with the C4.5 model obtaining the best accuracy of all. The aforementioned findings emphasize the significance of recognizing and responding to misinformation in times of crisis, the need for effective security measures, and also brings to the fore how rapidly false information spreads on social media and how significant it is to support and promote trustworthy sources of information as a means to prevent misleading information during situations of emergency.
The primary objective of this study by Zhao et al. [60] was indeed to offer a framework for content analysis and data-modeling-based disinformation detection in the online health sector. With the goal to build models capable of distinguishing false information in online communities, five popular classification models, such as Random Forest, were used as part of the whole process. In order to achieve this, the study used 151,719 records that were gathered from a particular website that addressed autism-related subjects. The results of the present research demonstrated that user behavior characteristics, as compared to linguistic, thematic, or sentimental characteristics, were more significant for detecting misinformation. Such techniques highlighted here may be helpful in identifying and combating misinformation in online health communities.
The fifth article, by Ayoub et al. [61], aims to counteract misinformation about COVID-19 through the use of a powerful natural language processing model that has its foundation on SHAP and DistilBERT. After collecting a dataset of 984 COVID-19 claims and further augmenting this dataset through the implementation of reverse translation techniques, the authors were able to identify false information with an impressive level of accuracy. The results showed that, when it comes to identifying misleading data regarding COVID-19, the DistilBERT model performs better than traditional machine learning models. Furthermore, using SHAP explanations to improve model transparency in conjunction with an experimental investigation revealed notable outcomes. Participants’ tendency to trust and share information significantly increased in these experimental settings with SHAP explanations; this finding emphasizes the effectiveness of explanatory approaches in raising the degrees of confidence and trust. In other words, the main purpose of this article is to provide an effective tool for detecting false information about COVID-19, raising an alarm signal about the serious impact that misinformation has, promoting trust models and, at the same time, increasing public confidence.
The primary goal of the study conducted by Asr et al. [62] is to address the pressing issue of misleading information and fake news. In order to automatically identify inaccurate information, it encourages the application of text classification techniques and underlines the importance of using large, labeled datasets in order to establish reliable classifiers. The authors used both automatic and manual verification techniques for gathering datasets from a variety of sources, including Buzzfeed and Snopes. They utilized Latent Dirichlet Allocation (LDA) for topic modeling for the purposes of achieving an understanding of the various types of news that have been extracted in these datasets. In order to effectively combat disinformation, the study draws attention to the dearth of trustworthy labeled data and encourages collaboration throughout the scientific community.
The problem of identifying disinformation in online social networks (OSN) has also been addressed by the author Zhang et al. [63]. They evaluated the efficacy of monitor placement in identifying misinformation using three realistic datasets with a significant number of nodes and connections from well-known sites including Twitter, Epinion, and Slashdot. The article’s primary objective was to provide efficient placement techniques for monitors in order to reduce the overall number of monitors required to successfully identify misinformation in social networks. The outcomes from this research showed that, in comparison to other traditional approaches, the authors’ strategies, which were based on sampling techniques and a probability-based approach, were shown to be positive. The study’s primary conclusion was that social network monitor installation could play a major role in the efficient identification of misinformation and, consequently, reduce its spread across networks.
The main focus of the study conducted by Baeth et al. [64] was to evaluate the accuracy of information, with priority on identifying disinformation, examine social behavior patterns using data gathered from Twitter, and evaluate user confidence on social networks. The analysis encompassed a number of methodologies, including the examination of social workflows, the computation of the positivity metric’s distance, and the determination of weights and their ranking through the application of both the Fuzzy Analytic Hierarchy Process (AHP) and the Analytic Hierarchy Process (AHP). Additionally, it also examines an artificial dataset with machine learning techniques to detect disinformation. The analysis’s findings indicate that there are positive correlations between the number of active users and the distance from the positivity metric as well as between the distance from the positivity meter and the information originator’s credibility. Furthermore, the quantity of people leaving negative feedback varies as well.
The next article on the list of the most cited documents in the area of misinformation detection belongs to Hayawi et al. [65]. An innovative technique for spotting false information about the COVID-19 vaccination on Twitter, a well-known social media site, is presented in this research paper, since misinformation regarding vaccinations has become a serious issue from the time when the COVID-19 epidemic started, and this study attempts to address it. A sizable dataset of tweets was gathered for the investigation, and they are divided into two categories: general vaccination content and disinformation about vaccines. These tweets are classified using machine learning models such as XGBoost, LSTM, and BERT, and the results showed that with a 0.98 F1-score on the test data, BERT in particular was proven to be the most successful. This research has real-world implications due to the fact that it can help social media businesses police disinformation, detect social bots that spread false data, and raise public awareness of vaccination misinformation. It also suggests other paths for further exploration, such as multilingual tweet analysis to improve model performance, and contributes additional knowledge to our awareness of how to combat false information in the context of social media and public health.
The last reviewed article on the list is written by Kumari et al. [66]. The authors aim to improve the process of detecting fake news on social media platforms. The authors examined the means through which two variables, namely novelty and emotion, could potentially be used to detect misleading information. In order to accomplish this, they developed a multitasking learning framework that handles these two elements as well as fake news recognition. Natural language processing techniques, which enable the extraction of information related to novelty and emotion from articles, were used in this investigation, together with neural networks to train and test the model’s ability for recognizing false information. After this, experiments on different public datasets were carried out to validate the efficacy of the new identified framework, and the results demonstrated that this approach outperformed existing false news detection algorithms, particularly on the ByteDance platform, with a considerable improvement in accuracy. This suggests that techniques which include novelty and emotional variables in the detection process might be highly useful in fighting the spread of fake news on social media.
Table 8 outlines some essential data about each of the 10 most globally cited documents, including the name of the first author, the year of the publication, the journal, along with the title, the main methods, techniques, steps used, the data analyzed, the purpose of the study, the goals, and objectives that authors want to achieve through the conducted research.
Furthermore, by analyzing in a more detailed manner the data captured in Table 8, we notice that 4 out of 10 articles address the problem of misinformation detection in the case of the COVID-19 pandemic [57,59,61,65].
The techniques used are diverse, including machine learning techniques, deep learning techniques, deep neural networks, feature selection, classification models, topic modeling techniques, and the list goes on with many others.
3.4.3. Papers Brief Overview
Considering the entire dataset, we have been interested in determining which are the most prominent life situations analyzed in the scientific literature that have captured the attention of the research community when discussing the misinformation detection. As a result, by considering all the 56 papers, it has been observed that health aspects retain the first position—counting for 33 papers, representing 55.35% of the dataset—with issues related to general health, occurrence of the COVID-19 pandemic, vaccines and vaccines in the context of the COVID-19 pandemic (please see the information in Table 9). Other issues that have been addressed are related to politics, personal issues, environment, science, sports, market, police, legislation, technology—4 papers (7.14%), while the remainder of the papers put emphasis more on other aspects (such as the modeling approach of the misinformation detection), paying less attention to the category of misinformation to which the proposed approach can be applied.
Regarding the source of the misinformation, it has been observed that most of the papers have used social media as the data source (37 papers, representing 66.07%), while fewer papers have used news (16 papers, 28.57%)—some of the listed papers have used a combination of social media information and news. Among the social media platforms, Twitter has been remarked as a preferred data source, accounting for 19 papers (33.92%), followed by Weibo, its Chinese equivalent, with 5 papers (8.92%). Other social media platforms used have been Facebook, Reddit, ByteDance, Epinion, and Slashdot (Table 9).
In terms of methodological approach, most of the papers have used classification methods based on machine learning techniques in order to detect misinformation. As a result, 32 papers have been identified as using machine learning, representing 57.14%. Fewer papers have provided a survey either on other papers dealing with misinformation detection or by asking individuals about their opinion regarding misinformation detection on various social media platforms (8 papers, 14.28). The remainder of the papers have proposed proofs of concepts, ontologies, greedy algorithms, blockchain, eye-tracking techniques, text and/or writing style analysis in order to address various misinformation issues or have provided proofs of concepts in connection with this subject (please consider the information in Table 9).
The papers listed in Table 9 are included in decreasing order of their total citations number.
3.4.4. Words Analysis
The primary objective of this section is to conduct an in-depth and systematic examination of titles, abstracts, keywords, and keywords’ plus in order to identify the most frequently encountered terms used in the chosen papers. This thorough analysis is intended to give a deep comprehension of the research that has been carried out, the corresponding fields of study, the topics that are being discussed in the scientific community right now, as well as the preferred approaches, goals, and areas of attention.
Table 10 includes the top 10 most frequent words in keywords plus, and, as it can be observed, most of them belong to the media and communication domain, suggesting that the main purpose of the extracted dataset collection is to detect the misinformation news phenomenon, especially related to the health area in the context of the pandemic: “social media”—6 occurrences; “credibility”, “fake news”, “information”—each with 5 occurrences; “classification”, “communication”, “media”, “news”—each with 3 occurrences; “engagement”, “health”—each with 2 occurrences.
Table 11 brings to the fore the top 10 most frequent words in authors’ keywords, based on the number of occurrences: “misinformation detection”—19, “COVID-19”—13, “misinformation”—13, “deep learning”—10, “fake news”—9, “machine learning”—9, “natural language processing”—8, “twitter”—6, “feature extraction”—5, “social media”—5.
As expected, the extracted author’s keywords provide a glimpse into the key aspects of the articles, being highlighted based on the fact that the papers explore the use of advanced technology, data analysis, and techniques like natural language processing to address the spread of misinformation, particularly in the context of the COVID-19 pandemic and on popular social media platforms like Twitter.
Figure 15 illustrates an artistic visual depiction of the keywords plus and authors’ keywords. The top 50 most frequently used significant and relevant terms found in the authors’ articles have been carefully selected and colored, with the scope of enhancing the clarity and attractiveness of the analysis.
The next analysis carried out in this study consisted of the extraction of the top 10 most frequent bigrams found in abstracts and titles. As anticipated, the “misinformation detection” bigram unquestionably asserts its top spot in the hierarchy based on the number of occurrences determined for both abstracts, 43, and titles, 11. The second place is occupied by the “social media” bigram, with 41 occurrences in abstracts and 8 in titles. For more information, kindly inspect Table 12.
The top 10 most frequent trigrams are highlighted in Table 13.
In the case of abstracts, the foremost positions in the ranking are occupied by “natural language processing” (12 occurrences), “fake news detection” (8 occurrences), and “social media platforms” (7 occurrences), while for the titles the most popular trigrams based on the number of occurrences are comprised of “online social networks” (5 occurrences), and “covid-vaccine misinformation”, “detecting covid-misinformation”, “fake news detection”, “natural language processing”, each with 2 occurrences.
Also from the trigram examination, as it was previously deduced in the earlier analysis, it results that the research carried out in the selected articles is related to the detection of misinformation using modern techniques, in the context of the COVID-19 pandemic.
Furthermore, following the terms co-occurrence network in authors’ keywords, it has been observed the connections depicted in Figure 16. As a result, four clusters have been identified:
- Cluster 1 (in red): misinformation detection; deep learning; fake news detection; transformers; bert; novelty prediction; social networks; task analysis.
- Cluster 2 (in blue): COVID-19; misinformation; machine learning; natural language processing; twitter; social media.
- Cluster 3 (in green): feature extraction; fake news; artificial intelligence; social networking (online); blogs.
- Cluster 4 (in violet): healthcare; document similarity; sentiment analysis; incremental learning.
Considering the information in the four clusters, it can be observed that it matches the profile of the papers highlighted in Table 9.
In terms of themes approached in the selected dataset, a thematic map has been created based on the author’s keywords. The identified themes are divided into four categories: motor themes, niche themes, emerging or declining themes, and basic themes, as depicted in Figure 17. As it can be observed, the highlighted motor themes refer to the use of deep learning algorithms, feature extraction, fake news, and natural language processing, with the health misinformation theme being placed at the border of niche themes and motor themes. Among the basic themes, one can identify themes related to healthcare, COVID-19, and the use of machine learning, while as emerging or declining themes, rumor detection, social media, and fake news detection have been identified (Figure 17). The division of the themes among the four categories reflects the distribution of the papers in the dataset (most of the papers being published in the last year) and the issues previously highlighted in the analysis conducted in this paper in terms of used methods and category of misinformation.
Further dividing the dataset into two periods according to the change in the number of papers depicted in Figure 1—where one can observe an increase in the number of papers starting from 2019—namely 2016–2018 and 2019–2022, the thematic for each time slice can be observed in Figure 18 and Figure 19.
As a result, it can be observed that, for the first slice period (Figure 18), online social networks have been identified as a basic theme, while the fake news were at the borderline between niche and emerging/declining themes. On the other hand, for the second slice period (Figure 19), the occurrence of the COVID-19 pandemic is more evident, being listed as one of the motor themes.
3.5. Mixed Analysis
A rigorous mixed analysis is performed in this section, making use of the power of the three-field plots and the knowledge acquired from the discussions that have come before, to point out the complex connections between a variety of categories, including countries, authors, journals, affiliations, and keywords.
Figure 20 depicts a three-field plot for an in-depth examination, carried out to establish a few noteworthy trends and connections between the top 20 entities in the categories of countries (left), authors (middle), journals (right). As predicted, the findings demonstrate that India is the dominant affiliation for famous writers, with Alsmadi I. holding the top position. Moreover, based on the data provided, the journal Information Processing & Management has the greatest number of published articles in the field of misinformation detection.
Additionally, throughout the community of authors considered, it became noticeable that numerous writers had collaborations throughout the globe, demonstrating that there were multiple worldwide research partnerships in the analyzed area of misinformation detection. Also, an increasing pattern becomes visible whereby an important percentage of researchers choose to publish their study results in multiple scientific journals rather than merely in a single one.
The next three-field plot is captured in Figure 21, having the purpose of bringing to the fore the examination conducted to establish connections between affiliations (left), authors (middle), and keywords (right).
Upon a brief inspection of the most popular keywords used in the extracted data collection set, it can be noted that all of them revolve around the basic idea of developing technologies and methods to effectively identify and address misinformation and sentiments in the online environment, especially in the context of the COVID-19 pandemic.
Regarding affiliations, Symbiosis International University holds the leadership position, succeeded by other famous esteemed universities.
It is also critical to draw attention to another crucial finding that this figure makes clear: a substantial percentage of the selected authors show up to be affiliated with foreign universities, which is a factor that significantly influences the growth of international collaborations. Authors who had no affiliation with any of the universities illustrated in the picture are also included below. For more information, please see Figure 21.
4. Discussions
The current research investigation uses bibliometrics to identify major trends, viewpoints, insights, and perspectives in the field of misinformation detection analysis, placing attention on key authors and popular research publications, highlighting the outstanding amount of literature available on this subject. In order to achieve this, a collection of 56 articles was extracted and analyzed, from the WoS platform, by following some filtering rules in the initial phase. Moreover, the increase in citations clearly proves that there was definitely a rise in interest from writers in this topic during most of the period under consideration time, namely 2016–2022.
The study encompassed numerous facets, including the main information about the data, the author appearances, the annual scientific production, the annual average article citations per year evolution, the most relevant sources, the Bradford’s law on source clustering, the journals’ impact based on H-index, the sources’ growth, the authors who published articles in the area of the analyzed research domain, their countries of origin, and affiliations with universities.
In terms of sources, it has been observed that some of the journals listed as the top contributors to the field of misinformation detection—either by considering the number of published papers or by considering their impact—have been the same as in other bibliometric works conducted on related areas. For example, the IEEE Access journal, which occupies the first position in the current analysis based on the number of published papers and the second position based on impact, has been listed as one of the top journals for publishing works in areas of social media research in the age of COVID-19 [112], deep learning in the context of sentiment analysis [113], sentiment analysis for the COVID-19 vaccines [114], sentiment analysis in times of COVID-19 [115], and COVID-19 vaccination misinformation [40]. Furthermore, the International Journal of Advanced Computer Science and Applications—which retains the third, respectively the fourth position in the present paper based on the number of papers, respectively based on the impact—has been listed among the top journals by Sanchez-Nunez et al. [116] in a paper featuring a bibliometric analysis on sentiment analysis, opinion mining, and emotion understanding and by Sandu et al. [115] in a paper dealing with sentiment analysis in times of COVID-19. Also, the International Journal of Environmental Research and Public Health has been listed as a top-contributor journal in the bibliometric studies in the area of social media in the age of COVID-19 [112], health-related misinformation in social media [39], and sentiment analysis in times of COVID-19 [115], while Social Network Analysis and Mining has been listed among the top contributors by Yu and Munoz-Justicia [117], who have conducted a bibliometric analysis in the area of Twitter-related studies. The fact that certain journals identified as top contributors to the field of misinformation detection also appear prominently in other bibliometric studies covering similar areas further underscores the significance and representativeness of these journals within the broader research domain associated with misinformation detection.
Regarding the affiliations of the authors who have been listed as top contributors to the field of misinformation detection, it has been observed that, even in this case, some of the universities have been listed as top contributors by other bibliometric studies in related fields. For example, King Saud University, listed as a top contributor for the misinformation detection, has also been listed as a first contributor for the studies published in the area of sentiment analysis in times of COVID-19 [115] and a top-3 contributor for the studies in the area of sentiment analysis in marketing [118].
Considering the countries with the highest contribution to the misinformation detection, the top-5 list is comprised of the USA, India, China, Spain, and the UK. By analyzing other bibliometric papers, it has been observed that the abovementioned countries are also listed among the top contributors for the social media research in the age of COVID-19 [112], COVID-19 vaccination misinformation [40], health-related misinformation in social media [39], and sentiment analysis in times of COVID-19 [115]. Furthermore, it has been observed that both the USA and China have assumed top positions (either first or second position) regarding the contribution to the various fields such as investors sentiments [119], network public opinion [120], sentiment analysis in library and information science [121], social media sentiment in the stock market [122], and the tourism industry [123].
Thus, it can be observed that, in the current scientific literature, there are many articles that conducted bibliometric studies as it is considered a strong analysis method, but all the papers have different focuses, addressing a large variety of subjects, including opposite areas such as health, tourism, and public opinion. By analyzing our results obtained in this research with other results from existing bibliometric studies, this helped us to draw some conclusions and discover interesting insights, such as observing the most popular journal and the country with the highest contribution in this field.
Compared to existing bibliometric studies carried out by other researchers, the present study approaches the extremely current and important topic of misinformation detection in the world of technology, approaching a rigorous methodology. Using the well-known WoS platform that hosts an impressively large collection of articles and by pre-establishing well-defined criteria in choosing the collected articles, this bibliometric analysis, unlike other existing papers, ensures the transparency of methodological decisions within the data selection process. For example, the choice of a limited time frame, 2016–2022, suggests the desire to focus especially on recent studies to reveal the most current aspects regarding emerging trends.
Also, unlike other papers, the present study pays substantial attention to the existing literature. In order to give readers a wider perspective on the misinformation detection area, the top 10 most cited articles in this field were extracted and reviewed, being included in the analysis a short summary of each of them, offering insights into the data, methods employed, and the purpose behind the analysis to enhance the comprehension of this subject. Thus, it has been observed that half of the papers included in top-10 papers based on number of citations have addressed themes related to COVID-19 pandemic and COVID-19 vaccination. Moreover, half of the papers included in the top 10 most cited papers have extracted the data used in their studies from Twitter, while 6 of the 10 papers have used an approach based on machine learning when dealing with misinformation detection. This trend—related to the main misinformation category, preferred source for data, and preferred approach—has been further observed even in the remainder of the papers included in the dataset, highlighting their importance to the misinformation detection area.
Furthermore, contrasting other articles in this area, this paper has a well-defined structure, addressing not only common aspects such as statistics about authors, journals, affiliations, and countries. It also includes valuable graphs and visual representations revealing significant information about collaborations, complex analysis of words, word clouds, co-occurrence network, thematic maps, three-field plots, and many other aspects that are not found in most of the published articles.
5. Limitations
Apart from these valuable and crucial findings, it is also important to address an essential topic and shape the discourse toward another perspective: limitations of the research.
Prior to anything else, it is necessary to highlight that the scientific articles used for research were completely collected from the WoS database. This choice might be interpreted as a restriction because it could possibly have omitted articles that are not included in this specific database. On the other hand, as presented in Section 2, in the scientific literature, there seems to be a preference for this database.
In addition to this, the use of specifically chosen keywords for article selection have influenced the composition of the dataset, as the dataset is highly dependent on the used keywords.
Language constitutes another noteworthy limitation. The study exclusively concentrated on publications written in English. However, as depicted in Table 1, even with the application of the language exclusion criterion, the number of papers in the dataset remains unchanged, as all the papers related to misinformation detection were authored in English.
Moreover, the inquiry was confined to papers specifically categorized as articles on the WoS platform. While this limitation led to a notable reduction in the number of articles included in the dataset, the chosen approach ensured that the retained papers were of high relevance, encompassing new and original research. This selection not only enhanced the value of the information within the dataset but also provided a consistent basis for a meaningful comparison among the included articles, as highlighted in Section 2.1.
6. Conclusions
In conclusion, the main objective of this research was to bring attention to bibliometric analysis in the field of misinformation detection and highlight the insights and results discovered based on the existing literature. The lightning-fast development of technology and the speed at which news circulates in today’s world contributed to a context in which misinformation may spread rapidly and reach a wide audience. This reality underlines the rising necessity to detect and combat misinformation, along with developing new strategies in order to ensure the accuracy of information and prevent possible adverse consequences on society, ranging from trust in news sources to actual implications in areas such as public health, politics, and many more.
As a result of the bibliometric analysis, we extracted the articles with the highest impact in the field of misinformation detection, determined by the number of citations. Upon analyzing the top 10 most cited papers, a noteworthy observation emerged—half of them focused on themes related to misinformation detection during the COVID-19 pandemic and COVID-19 vaccination. Additionally, two papers addressed misinformation in health-related issues. In essence, the top 10 most cited papers highlighted a predominant research interest in misinformation detection within the health and healthcare domain.
A broader examination of the entire dataset reinforced this trend, revealing that 55.35% of the selected papers were primarily concerned with misinformation detection in the health and healthcare sector—this idea has been further observed when analyzing the co-occurrence network for the terms in author’s keywords, where “COVID-19” and “healthcare” occurred among extracted terms, or by the bigrams identified in titles: “covid- misinformation”, “health misinformation”, and “vaccine misinformation”. The remaining papers delved into a diverse range of topics, including misinformation detection in politics, personal matters, environment, science, sports, market, police, legislation, or technology. However, it is important to note that some papers did not specifically focus on the area of application for misinformation detection; instead, they concentrated on discussing methodological or modeling aspects related to the subject.
In this context, we conducted an analysis of the methodological aspects presented in the selected papers. Notably, among the top 10 most cited papers, 6 employed an approach based on machine learning for misinformation detection. This prevalent trend, pertaining to the use of the machine learning approach, was consistently observed throughout the entire dataset. It underscores the significant role of machine learning in the field of misinformation detection, emphasizing its importance as a preferred and effective approach in this domain.
Concerning the source of misinformation in the entire dataset, a predominant trend emerged, with the majority of papers relying on social media as their primary data source (37 papers). In contrast, fewer papers were drawn from news sources, while some studies opted for a combination of social media information and news. Notably, Twitter emerged as the most favored social media platform, featured in 19 papers, followed by Weibo, its Chinese counterpart, with 5 papers. The role played by Twitter in the misinformation detection papers as a primary source for the data has been further highlighted by the appearance of the “Twitter” term in the co-occurrence network for the terms in author’s keywords.
In terms of the most prominent authors, the contribution of Barve Y and Saini JR has been highlighted—each of the mentioned authors contributed with 3 papers. Other notable authors with 2 published papers have been Alsmadi I, Apostol ES, Ashok N, Ekbal A, Ghosal T, Kotecha K, Kumari R, Truica CO, and Zhou F.
Concerning the preferred journals for misinformation detection, IEEE Access and Information Processing & Management stand out, not only in terms of the quantity of published papers but also in terms of impact, as indicated by their H-index. As discussed in the corresponding section, the majority of journals that have featured papers in the realm of misinformation detection have consistently been chosen as the primary outlets even for works covering similar subjects. This emphasizes the significant and consistent contributions of these journals to the field.
King Saud University has been identified as the leading contributor in terms of published papers in the field of misinformation detection.
When it comes to countries, the leading contributors are the USA, India, and China. It is noteworthy to mention that the presence of these countries in the top three contributors is not surprising, given their historically significant contributions across various domains related to social media and sentiment analysis.
Last, the bibliometric analysis provided insights on the evolution of trends in misinformation detection, showing the rise of the COVID-19 misinformation theme as a motor theme for the 2019–2022 period and the evolving path followed by the “fake news” theme from an emerging theme in the 2016–2018 period to a motor theme in the 2019–2022 period.
Taking all of this into consideration, the paper is highly useful for specialized literature and beyond, as it attempts to raise awareness about the identification of misinformation. Everyone should be conscious of how serious this issue is and take appropriate actions to prevent any potentially severe consequences.
From the desire to illustrate the practical applicability of the insights gained from research, we want to bring to the fore some strategies that can reduce or even combat the spread of false information on social networks. It is recommended to use the personal filter, double-check the accuracy of the sources, share only the information you have complete confidence in, use diverse platforms for reading the news, as well as utilize a variety of tools that aim to provide a more accurate assessment, such as Google Fact Check Explorer, NewsGuard, PolitiFact, Snopes, and others.
The results obtained in the study show significant details, such as the country with the highest number of articles published in the area of misinformation detection, the relevant researchers, the popular journals, etc., which directs the researchers to the most appropriate decisions in choosing collaboration partners in this field. At the same time, the results obtained from bibliometric studies can influence the decisions of the authorities regarding the funding of researchers and can contribute to increasing the visibility of research and international recognition.
Regarding future work, future research in this field may aim to overcome the aforementioned limitations identified in this study. Additionally, researchers could explore other dimensions related to disinformation detection, such as detecting fake news or disinformation, and compare the findings with those obtained for disinformation detection. This comparative analysis could provide valuable insights into the nuances and effectiveness of different strategies for detecting different types of misleading information. Furthermore, future researchers can start from the study carried out in this article, to develop a tool for detecting false information as efficiently as possible, using, for example, machine learning algorithms and natural language processing methods.
Addressing these aspects could contribute to a more comprehensive understanding of the challenges and opportunities in the broader landscape of information integrity and trustworthiness.
Author Contributions
Conceptualization, A.S., I.I., C.D., L.-M.G. and L.-A.C.; data curation, A.S., I.I., C.D., L.-M.G. and L.-A.C.; formal analysis, A.S., I.I., C.D., L.-M.G. and L.-A.C.; investigation, A.S., I.I., C.D., L.-M.G. and L.-A.C.; methodology, A.S., C.D. and L.-A.C.; resources, A.S., I.I., C.D., L.-M.G. and L.-A.C.; software, A.S., C.D. and L.-A.C.; supervision, C.D. and L.-A.C.; validation, A.S., I.I., C.D., L.-M.G. and L.-A.C.; visualization, A.S., I.I., C.D. and L.-A.C.; writing—original draft, A.S., C.D. and L.-A.C.; writing—review and editing, I.I. and L.-M.G. All authors have read and agreed to the published version of the manuscript.
Funding
The work is supported by a grant from the Romanian Ministry of Research and Innovation, project No. CNFIS-FDI-2023-0499—‘The development and promotion of excellence research in BUES by strengthening the R&D processes, supporting the visibility of the results and the impact on the economic environment, in an Open Science context’, and by a grant from the Romanian Ministry of Research and Innovation, project No. 42PFE/30.12.2021—‘Increasing institutional performance through the development of the infrastructure and research ecosystem of transdisciplinary excellence in the socio-economic field’.
Institutional Review Board Statement
Not applicable.
Informed Consent Statement
Not applicable.
Data Availability Statement
Data are contained within the article.
Conflicts of Interest
The authors declare no conflicts of interest.
References
- Gradoń, K.T.; Hołyst, J.A.; Moy, W.R.; Sienkiewicz, J.; Suchecki, K. Countering Misinformation: A Multidisciplinary Approach. Big Data Soc. 2021, 8, 205395172110138. [Google Scholar] [CrossRef]
- Wardle, C.; Dias, P. Information Disorder: Toward an Interdisciplinary Framework for Research and Policy Making (2017); Council of Europe: Strasbourg, France, 2017. [Google Scholar]
- Segura-Bedmar, I.; Alonso-Bartolome, S. Multimodal Fake News Detection. Information 2022, 13, 284. [Google Scholar] [CrossRef]
- Thakur, N. Social Media Mining and Analysis: A Brief Review of Recent Challenges. Information 2023, 14, 484. [Google Scholar] [CrossRef]
- Leonardi, S.; Rizzo, G.; Morisio, M. Automated Classification of Fake News Spreaders to Break the Misinformation Chain. Information 2021, 12, 248. [Google Scholar] [CrossRef]
- Del Vicario, M.; Bessi, A.; Zollo, F.; Petroni, F.; Scala, A.; Caldarelli, G.; Stanley, H.E.; Quattrociocchi, W. The Spreading of Misinformation Online. Proc. Natl. Acad. Sci. USA 2016, 113, 554–559. [Google Scholar] [CrossRef] [PubMed]
- Carmi, E.; Yates, S.J.; Lockley, E.; Pawluczuk, A. Data Citizenship: Rethinking Data Literacy in the Age of Disinformation, Misinformation, and Malinformation. Internet Policy Rev. 2020, 9, 1–22. [Google Scholar] [CrossRef]
- House of Commons. Disinformation and ‘Fake News’: Final Report; House of Commons: London, UK, 2019. [Google Scholar]
- Dennis, A.R.; Galletta, D.F.; Webster, J. Special Issue: Fake News on the Internet. J. Manag. Inf. Syst. 2022, 38, 893–897. [Google Scholar] [CrossRef]
- Siino, M.; Di Nuovo, E.; Tinniriello, I.; La Cascia, M. Fake News Spreaders Detection: Sometimes Attention Is Not All You Need. Information 2022, 13, 426. [Google Scholar] [CrossRef]
- Tsfati, Y.; Boomgaarden, H.G.; Strömbäck, J.; Vliegenthart, R.; Damstra, A.; Lindgren, E. Causes and Consequences of Mainstream Media Dissemination of Fake News: Literature Review and Synthesis. Ann. Int. Commun. Assoc. 2020, 44, 157–173. [Google Scholar] [CrossRef]
- Kasnesis, P.; Toumanidis, L.; Patrikakis, C. Combating Fake News with Transformers: A Comparative Analysis of Stance Detection and Subjectivity Analysis. Information 2021, 12, 409. [Google Scholar] [CrossRef]
- Taylor and Francis Website Misinformation, vs. Disinformation—Taylor & Francis Insights. Available online: https://insights.taylorandfrancis.com/social-justice/misinformation-vs-disinformation/ (accessed on 9 December 2023).
- Lazer, D.M.J.; Baum, M.A.; Benkler, Y.; Berinsky, A.J.; Greenhill, K.M.; Menczer, F.; Metzger, M.J.; Nyhan, B.; Pennycook, G.; Rothschild, D.; et al. The Science of Fake News. Science 2018, 359, 1094–1096. [Google Scholar] [CrossRef] [PubMed]
- Zareie, A.; Sakellariou, R. Minimizing the Spread of Misinformation in Online Social Networks: A Survey. J. Netw. Comput. Appl. 2021, 186, 103094. [Google Scholar] [CrossRef]
- Chen, S.; Xiao, L.; Kumar, A. Spread of Misinformation on Social Media: What Contributes to It and How to Combat It. Comput. Hum. Behav. 2023, 141, 107643. [Google Scholar] [CrossRef]
- Cotfas, L.-A.; Delcea, C.; Roxin, I.; Ioanas, C.; Gherai, D.S.; Tajariol, F. The Longest Month: Analyzing COVID-19 Vaccination Opinions Dynamics from Tweets in the Month Following the First Vaccine Announcement. IEEE Access 2021, 9, 33203–33223. [Google Scholar] [CrossRef] [PubMed]
- Delcea, C.; Cotfas, L.-A.; Crăciun, L.; Molănescu, A.G. New Wave of COVID-19 Vaccine Opinions in the Month the 3rd Booster Dose Arrived. Vaccines 2022, 10, 881. [Google Scholar] [CrossRef]
- Caceres, M.M.F.; Sosa, J.P.; Lawrence, J.A.; Sestacovschi, C.; Tidd-Johnson, A.; Rasool, M.H.U.; Gadamidi, V.K.; Ozair, S.; Pandav, K.; Cuevas-Lou, C.; et al. The Impact of Misinformation on the COVID-19 Pandemic. AIMS Public Health 2022, 9, 262–277. [Google Scholar] [CrossRef] [PubMed]
- Barua, Z.; Barua, S.; Aktar, S.; Kabir, N.; Li, M. Effects of Misinformation on COVID-19 Individual Responses and Recommendations for Resilience of Disastrous Consequences of Misinformation. Prog. Disaster Sci. 2020, 8, 100119. [Google Scholar] [CrossRef] [PubMed]
- Krittanawong, C.; Kagan, N.; Narasimhan, B.; Virk, H.U.H.; Narasimhan, H.; Hahn, J.; Wang, Z.; Tang, W.H.W. Misinformation Dissemination in Twitter in the COVID-19 Era. Am. J. Med. 2020, 133, 1367–1369. [Google Scholar] [CrossRef]
- Jerit, J.; Zhao, Y. Political Misinformation. Annu. Rev. Polit. Sci. 2020, 23, 77–94. [Google Scholar] [CrossRef]
- De Angelis, A.; Farhart, C.E.; Merkley, E.; Stecula, D.A. Editorial: Political Misinformation in the Digital Age During a Pandemic: Partisanship, Propaganda, and Democratic Decision-Making. Front. Polit. Sci. 2022, 4, 897095. [Google Scholar] [CrossRef]
- Porter, E.; Wood, T.J. Political Misinformation and Factual Corrections on the Facebook News Feed: Experimental Evidence. J. Polit. 2022, 84, 1812–1817. [Google Scholar] [CrossRef]
- Flynn, D.J.; Horiuchi, Y.; Zhang, D. Misinformation, Economic Threat and Public Support for International Trade. Rev. Int. Political Econ. 2022, 29, 571–597. [Google Scholar] [CrossRef]
- Vicari, R.; Komendatova, N. Systematic Meta-Analysis of Research on AI Tools to Deal with Misinformation on Social Media during Natural and Anthropogenic Hazards and Disasters. Humanit. Soc. Sci. Commun. 2023, 10, 332. [Google Scholar] [CrossRef]
- Block, J.H.; Fisch, C. Eight Tips and Questions for Your Bibliographic Study in Business and Management Research. Manag. Rev. Q. 2020, 70, 307–312. [Google Scholar] [CrossRef]
- WoS Web of Science. Available online: http://webofknowledge.com (accessed on 9 September 2023).
- Anaç, M.; Gumusburun Ayalp, G.; Erdayandi, K. Prefabricated Construction Risks: A Holistic Exploration through Advanced Bibliometric Tool and Content Analysis. Sustainability 2023, 15, 11916. [Google Scholar] [CrossRef]
- Marín-Rodríguez, N.J.; González-Ruiz, J.D.; Valencia-Arias, A. Incorporating Green Bonds into Portfolio Investments: Recent Trends and Further Research. Sustainability 2023, 15, 14897. [Google Scholar] [CrossRef]
- Bakır, M.; Özdemir, E.; Akan, Ş.; Atalık, Ö. A Bibliometric Analysis of Airport Service Quality. J. Air Transp. Manag. 2022, 104, 102273. [Google Scholar] [CrossRef]
- Cobo, M.J.; Martínez, M.A.; Gutiérrez-Salcedo, M.; Fujita, H.; Herrera-Viedma, E. 25 Years at Knowledge-Based Systems: A Bibliometric Analysis. Knowl. Based Syst. 2015, 80, 3–13. [Google Scholar] [CrossRef]
- Modak, N.M.; Merigó, J.M.; Weber, R.; Manzor, F.; Ortúzar, J.D.D. Fifty Years of Transportation Research Journals: A Bibliometric Overview. Transp. Res. Part Policy Pract. 2019, 120, 188–223. [Google Scholar] [CrossRef]
- Mulet-Forteza, C.; Martorell-Cunill, O.; Merigó, J.M.; Genovart-Balaguer, J.; Mauleon-Mendez, E. Twenty Five Years of the Journal of Travel & Tourism Marketing: A Bibliometric Ranking. J. Travel Tour. Mark. 2018, 35, 1201–1221. [Google Scholar] [CrossRef]
- VOSviewer—Visualizing Scientific Landscapes. Available online: https://www.vosviewer.com// (accessed on 5 December 2023).
- Aria, M.; Cuccurullo, C. Bibliometrix: An R-Tool for Comprehensive Science Mapping Analysis. J. Informetr. 2017, 11, 959–975. [Google Scholar] [CrossRef]
- Liu, W. The Data Source of This Study Is Web of Science Core Collection? Not Enough. Scientometrics 2019, 121, 1815–1824. [Google Scholar] [CrossRef]
- Liu, F. Retrieval Strategy and Possible Explanations for the Abnormal Growth of Research Publications: Re-Evaluating a Bibliometric Analysis of Climate Change. Scientometrics 2023, 128, 853–859. [Google Scholar] [CrossRef] [PubMed]
- Yeung, A.W.K.; Tosevska, A.; Klager, E.; Eibensteiner, F.; Tsagkaris, C.; Parvanov, E.D.; Nawaz, F.A.; Völkl-Kernstock, S.; Schaden, E.; Kletecka-Pulker, M.; et al. Medical and Health-Related Misinformation on Social Media: Bibliometric Study of the Scientific Literature. J. Med. Internet Res. 2022, 24, e28152. [Google Scholar] [CrossRef] [PubMed]
- Mahajan, R.; Gupta, P. A Bibliometric Analysis On The Dissemination Of COVID-19 Vaccine Misinformation On Social Media. J. Content Community Commun. 2021, 14, 218–229. [Google Scholar] [CrossRef]
- WoS Document Types. Available online: https://webofscience.help.clarivate.com/en-us/Content/document-types.html (accessed on 3 December 2023).
- Donner, P. Document Type Assignment Accuracy in the Journal Citation Index Data of Web of Science. Scientometrics 2017, 113, 219–236. [Google Scholar] [CrossRef]
- Aria, M.; Cuccurullo, C. A Brief Introduction to Bibliometrix. Available online: https://www.bibliometrix.org/vignettes/Introduction_to_bibliometrix.html (accessed on 22 November 2023).
- Delcea, C.; Cotfas, L.-A. Hybrid Approaches Featuring Grey Systems Theory. In Advancements of Grey Systems Theory in Economics and Social Sciences; Series on Grey System; Springer Nature: Singapore, 2023; pp. 281–333. ISBN 978-981-19993-1-4. [Google Scholar]
- Zardari, S.; Alam, S.; Al Salem, H.A.; Al Reshan, M.S.; Shaikh, A.; Malik, A.F.K.; Masood Ur Rehman, M.; Mouratidis, H. A Comprehensive Bibliometric Assessment on Software Testing (2016–2021). Electronics 2022, 11, 1984. [Google Scholar] [CrossRef]
- Marín-Rodríguez, N.J.; González-Ruiz, J.D.; Botero Botero, S. Dynamic Co-Movements among Oil Prices and Financial Assets: A Scientometric Analysis. Sustainability 2022, 14, 12796. [Google Scholar] [CrossRef]
- Gorski, A.-T.; Ranf, E.-D.; Badea, D.; Halmaghi, E.-E.; Gorski, H. Education for Sustainability—Some Bibliometric Insights. Sustainability 2023, 15, 14916. [Google Scholar] [CrossRef]
- Madsen, D.Ø.; Berg, T.; Di Nardo, M. Bibliometric Trends in Industry 5.0 Research: An Updated Overview. Appl. Syst. Innov. 2023, 6, 63. [Google Scholar] [CrossRef]
- Ionescu, Ș.; Delcea, C.; Chiriță, N.; Nica, I. Exploring the Use of Artificial Intelligence in Agent-Based Modeling Applications: A Bibliometric Study. Algorithms 2024, 17, 21. [Google Scholar] [CrossRef]
- Domenteanu, A.; Delcea, C.; Chiriță, N.; Ioanăș, C. From Data to Insights: A Bibliometric Assessment of Agent-Based Modeling Applications in Transportation. Appl. Sci. 2023, 13, 12693. [Google Scholar] [CrossRef]
- Delcea, C.; Javed, S.A.; Florescu, M.-S.; Ioanas, C.; Cotfas, L.-A. 35 Years of Grey System Theory in Economics and Education. Kybernetes 2023. [Google Scholar] [CrossRef]
- Delcea, C.; Domenteanu, A.; Ioanăș, C.; Vargas, V.M.; Ciucu-Durnoi, A.N. Quantifying Neutrosophic Research: A Bibliometric Study. Axioms 2023, 12, 1083. [Google Scholar] [CrossRef]
- Cibu, B.; Delcea, C.; Domenteanu, A.; Dumitrescu, G. Mapping the Evolution of Cybernetics: A Bibliometric Perspective. Computers 2023, 12, 237. [Google Scholar] [CrossRef]
- Wardikar, V. Application of Bradford’s Law of Scattering to the Literature of Library & Information Science: A Study of Doctoral Theses Citations Submitted to the Universities of Maharashtra, India. Libr. Philos. Pract. 2013, 1–45. Available online: https://digitalcommons.unl.edu/cgi/viewcontent.cgi?article=2569&context=libphilprac (accessed on 21 November 2023).
- RDRR Website Bradford: Bradford’s Law in Bibliometrix: Comprehensive Science Mapping Analysis. Available online: https://rdrr.io/cran/bibliometrix/man/bradford.html (accessed on 21 November 2023).
- Liu, W. Caveats for the Use of Web of Science Core Collection in Old Literature Retrieval and Historical Bibliometric Analysis. Technol. Forecast. Soc. Change 2021, 172, 121023. [Google Scholar] [CrossRef]
- Shorten, C.; Khoshgoftaar, T.M.; Furht, B. Deep Learning Applications for COVID-19. J. Big Data 2021, 8, 18. [Google Scholar] [CrossRef]
- Khan, M.L.; Idris, I.K. Recognise Misinformation and Verify before Sharing: A Reasoned Action and Information Literacy Perspective. Behav. Inf. Technol. 2019, 38, 1194–1212. [Google Scholar] [CrossRef]
- Al-Rakhami, M.S.; Al-Amri, A.M. Lies Kill, Facts Save: Detecting COVID-19 Misinformation in Twitter. IEEE Access 2020, 8, 155961–155970. [Google Scholar] [CrossRef]
- Zhao, Y.; Da, J.; Yan, J. Detecting Health Misinformation in Online Health Communities: Incorporating Behavioral Features into Machine Learning Based Approaches. Inf. Process. Manag. 2021, 58, 102390. [Google Scholar] [CrossRef]
- Ayoub, J.; Yang, X.J.; Zhou, F. Combat COVID-19 Infodemic Using Explainable Natural Language Processing Models. Inf. Process. Manag. 2021, 58, 102569. [Google Scholar] [CrossRef]
- Asr, F.T.; Taboada, M. Big Data and Quality Data for Fake News and Misinformation Detection. Big Data Soc. Sage J. 2019, 6, 2053951719843310. [Google Scholar] [CrossRef]
- Zhang, H.; Alim, M.A.; Li, X.; Thai, M.T.; Nguyen, H.T. Misinformation in Online Social Networks: Detect Them All with a Limited Budget. ACM Trans. Inf. Syst. 2016, 34, 1–24. [Google Scholar] [CrossRef]
- Baeth, M.J.; Aktas, M.S. Detecting Misinformation in Social Networks Using Provenance Data. Concurr. Comput. Pract. Exp. 2018, 31, e4793. [Google Scholar] [CrossRef]
- Hayawi, K.; Shahriar, S.; Serhani, M.A.; Taleb, I.; Mathew, S.S. ANTi-Vax: A Novel Twitter Dataset for COVID-19 Vaccine Misinformation Detection. Public Health 2022, 203, 23–30. [Google Scholar] [CrossRef] [PubMed]
- Kumari, R.; Ashok, N.; Ghosal, T.; Ekbal, A. Misinformation Detection Using Multitask Learning with Mutual Learning for Novelty Detection and Emotion Recognition. Inf. Process. Manag. 2021, 58, 102631. [Google Scholar] [CrossRef]
- Zhou, C.; Li, K.; Lu, Y. Linguistic Characteristics and the Dissemination of Misinformation in Social Media: The Moderating Effect of Information Richness. Inf. Process. Manag. 2021, 58, 102679. [Google Scholar] [CrossRef]
- Schuster, T.; Schuster, R.; Shah, D.J.; Barzilay, R. The Limitations of Stylometry for Detecting Machine-Generated Fake News. Comput. Linguist. 2020, 46, 499–510. [Google Scholar] [CrossRef]
- Thornhill, C.; Meeus, Q.; Peperkamp, J.; Berendt, B. A Digital Nudge to Counter Confirmation Bias. Front. Big Data 2019, 2, 11. [Google Scholar] [CrossRef]
- Gläßel, C.; Paula, K. Sometimes Less Is More: Censorship, News Falsification, and Disapproval in 1989 East Germany. Am. J. Polit. Sci. 2020, 64, 682–698. [Google Scholar] [CrossRef]
- Yeo, S.K.; McKasy, M. Emotion and Humor as Misinformation Antidotes. Proc. Natl. Acad. Sci. USA 2021, 118, e2002484118. [Google Scholar] [CrossRef] [PubMed]
- Chen, X.; Zhou, F.; Trajcevski, G.; Bonsangue, M. Multi-View Learning with Distinguishable Feature Fusion for Rumor Detection. Knowl. Based Syst. 2022, 240, 108085. [Google Scholar] [CrossRef]
- Chen, Q.; Leaman, R.; Allot, A.; Luo, L.; Wei, C.-H.; Yan, S.; Lu, Z. Artificial Intelligence in Action: Addressing the COVID-19 Pandemic with Natural Language Processing. Annu. Rev. Biomed. Data Sci. 2021, 4, 313–339. [Google Scholar] [CrossRef] [PubMed]
- Liu, Y.; Yu, K.; Wu, X.; Qing, L.; Peng, Y. Analysis and Detection of Health-Related Misinformation on Chinese Social Media. IEEE Access 2019, 7, 154480–154489. [Google Scholar] [CrossRef]
- Alenezi, M.N.; Alqenaei, Z.M. Machine Learning in Detecting COVID-19 Misinformation on Twitter. Future Internet 2021, 13, 244. [Google Scholar] [CrossRef]
- Cheng, Y.; Chen, Z.F. Encountering Misinformation Online: Antecedents of Trust and Distrust and Their Impact on the Intensity of Facebook Use. Online Inf. Rev. 2020, 45, 372–388. [Google Scholar] [CrossRef]
- Ilie, V.-I.; Truica, C.-O.; Apostol, E.-S.; Paschke, A. Context-Aware Misinformation Detection: A Benchmark of Deep Learning Architectures Using Word Embeddings. IEEE Access 2021, 9, 162122–162146. [Google Scholar] [CrossRef]
- Kumari, R.; Ashok, N.; Ghosal, T.; Ekbal, A. What the Fake? Probing Misinformation Detection Standing on the Shoulder of Novelty and Emotion. Inf. Process. Manag. 2022, 59, 102740. [Google Scholar] [CrossRef]
- Di Sotto, S.; Viviani, M. Health Misinformation Detection in the Social Web: An Overview and a Data Science Approach. Int. J. Environ. Res. Public. Health 2022, 19, 2173. [Google Scholar] [CrossRef]
- Amith, M.; Tao, C. Representing Vaccine Misinformation Using Ontologies. J. Biomed. Semant. 2018, 9, 22. [Google Scholar] [CrossRef] [PubMed]
- Martin-Gutierrez, D.; Hernandez-Penaloza, G.; Hernandez, A.B.; Lozano-Diez, A.; Alvarez, F. A Deep Learning Approach for Robust Detection of Bots in Twitter Using Transformers. IEEE Access 2021, 9, 54591–54601. [Google Scholar] [CrossRef]
- Komendantova, N.; Ekenberg, L.; Svahn, M.; Larsson, A.; Shah, S.I.H.; Glinos, M.; Koulolias, V.; Danielson, M. A Value-Driven Approach to Addressing Misinformation in Social Media. Humanit. Soc. Sci. Commun. 2021, 8, 33. [Google Scholar] [CrossRef]
- Pham, C.V.; Pham, D.V.; Bui, B.Q.; Nguyen, A.V. Minimum Budget for Misinformation Detection in Online Social Networks with Provable Guarantees. Optim. Lett. 2022, 16, 515–544. [Google Scholar] [CrossRef]
- Balasubramaniam, T.; Nayak, R.; Luong, K.; Bashar, M.A. Identifying COVID-19 Misinformation Tweets and Learning Their Spatio-Temporal Topic Dynamics Using Nonnegative Coupled Matrix Tensor Factorization. Soc. Netw. Anal. Min. 2021, 11, 57. [Google Scholar] [CrossRef]
- Weinzierl, M.A.; Harabagiu, S.M. Automatic Detection of COVID-19 Vaccine Misinformation with Graph Link Prediction. J. Biomed. Inform. 2021, 124, 103955. [Google Scholar] [CrossRef]
- Karnyoto, A.; Sun, C.; Liu, B.; Wang, X. Transfer Learning and GRU-CRF Augmentation for COVID-19 Fake News Detection. Comput. Sci. Inf. Syst. 2022, 19, 639–658. [Google Scholar] [CrossRef]
- Mishima, K.; Yamana, H. A Survey on Explainable Fake News Detection. IEICE Trans. Inf. Syst. 2022, 105, 1249–1257. [Google Scholar] [CrossRef]
- Arquam, M.; Singh, A.; Sharma, R. A Blockchain-Based Secured and Trusted Framework for Information Propagation on Online Social Networks. Soc. Netw. Anal. Min. 2021, 11, 49. [Google Scholar] [CrossRef]
- Truică, C.-O.; Apostol, E.-S. MisRoBÆRTa: Transformers versus Misinformation. Mathematics 2022, 10, 569. [Google Scholar] [CrossRef]
- Kim, M.G.; Kim, M.; Kim, J.H.; Kim, K. Fine-Tuning BERT Models to Classify Misinformation on Garlic and COVID-19 on Twitter. Int. J. Environ. Res. Public. Health 2022, 19, 5126. [Google Scholar] [CrossRef] [PubMed]
- Simko, J.; Racsko, P.; Tomlein, M.; Hanakova, M.; Moro, R.; Bielikova, M. A Study of Fake News Reading and Annotating in Social Media Context. New Rev. Hypermedia Multimed. 2021, 27, 97–127. [Google Scholar] [CrossRef]
- Hashemi, M. Discovering Social Media Topics and Patterns in the Coronavirus and Election Era. J. Inf. Commun. Ethics Soc. 2021, 20, 1–17. [Google Scholar] [CrossRef]
- Safarnejad, L.; Xu, Q.; Ge, Y.; Chen, S. A Multiple Feature Category Data Mining and Machine Learning Approach to Characterize and Detect Health Misinformation on Social Media. IEEE Internet Comput. 2021, 25, 43–51. [Google Scholar] [CrossRef]
- Alsudias, L.; Rayson, P. Social Media Monitoring of the COVID-19 Pandemic and Influenza Epidemic With Adaptation for Informal Language in Arabic Twitter Data: Qualitative Study. JMIR Med. Inform. 2021, 9, e27670. [Google Scholar] [CrossRef]
- Barve, Y.; Saini, J.R.; Kotecha, K.; Gaikwad, H. Detecting and Fact-Checking Misinformation Using “Veracity Scanning Model. ” Int. J. Adv. Comput. Sci. Appl. 2022, 13, 201–209. [Google Scholar] [CrossRef]
- Barve, Y.; Saini, J.R. Healthcare Misinformation Detection and Fact-Checking: A Novel Approach. Int. J. Adv. Comput. Sci. Appl. 2021, 12, 295–303. [Google Scholar] [CrossRef]
- Ahvanooey, M.T.; Zhu, M.X.; Mazurczyk, W.; Choo, K.-K.R.; Conti, M.; Zhang, J. Misinformation Detection on Social Media: Challenges and the Road Ahead. IT Prof. 2022, 24, 34–40. [Google Scholar] [CrossRef]
- Freiling, I.; Waldherr, A. Why Trusting Whom? Motivated Reasoning and Trust in the Process of Information Evaluation. In Trust and Communication; Blöbaum, B., Ed.; Springer International Publishing: Cham, Switzerland, 2021; pp. 83–97. ISBN 978-3-030-72944-8. [Google Scholar]
- González-Fernández, C.; Fernández-Isabel, A.; Martín De Diego, I.; Fernández, R.R.; Viseu Pinheiro, J.F.J. Experts Perception-Based System to Detect Misinformation in Health Websites. Pattern Recognit. Lett. 2021, 152, 333–339. [Google Scholar] [CrossRef]
- Barve, Y.; Saini, J.R.; Pal, K.; Kotecha, K. A Novel Evolving Sentimental Bag-of-Words Approach for Feature Extraction to Detect Misinformation. Int. J. Adv. Comput. Sci. Appl. 2022, 13, 266–275. [Google Scholar] [CrossRef]
- Jalal, N.; Ghafoor, K.Z. Machine Learning Algorithms for Detecting and Analyzing Social Bots Using a Novel Dataset. ARO- Sci. J. KOYA Univ. 2022, 10, 11–21. [Google Scholar] [CrossRef]
- Alsmadi, I.; Rice, N.M.; O’Brien, M.J. Fake or Not? Automated Detection of COVID-19 Misinformation and Disinformation in Social Networks and Digital Media. Comput. Math. Organ. Theory 2022, 1–19. [Google Scholar] [CrossRef] [PubMed]
- Yu, W.; Chen, N.; Chen, J. Characterizing Chinese Online Public Opinions towards the COVID-19 Recovery Policy. Electron. Libr. 2022, 40, 140–159. [Google Scholar] [CrossRef]
- Wei, H.; Kang, X.; Wang, W.; Ying, L. QuickStop: A Markov Optimal Stopping Approach for Quickest Misinformation Detection. Proc. ACM Meas. Anal. Comput. Syst. 2019, 3, 41. [Google Scholar] [CrossRef]
- Fernández-Pichel, M.; Losada, D.E.; Pichel, J.C. A Multistage Retrieval System for Health-Related Misinformation Detection. Eng. Appl. Artif. Intell. 2022, 115, 105211. [Google Scholar] [CrossRef]
- Obeidat, R.; Gharaibeh, M.; Abdullah, M.; Alharahsheh, Y. Multi-Label Multi-Class COVID-19 Arabic Twitter Dataset with Fine-Grained Misinformation and Situational Information Annotations. PeerJ Comput. Sci. 2022, 8, e1151. [Google Scholar] [CrossRef] [PubMed]
- Indu, V.; Thampi, S.M. Cognitive AI for Mitigation of Misinformation in Online Social Networks. IT Prof. 2022, 24, 37–45. [Google Scholar] [CrossRef]
- Mahbub, S.; Pardede, E.; Kayes, A.S.M. COVID-19 Rumor Detection Using Psycho-Linguistic Features. IEEE Access 2022, 10, 117530–117543. [Google Scholar] [CrossRef]
- Alsmadi, I.; Ahmad, K.; Nazzal, M.; Alam, F.; Al-Fuqaha, A.; Khreishah, A.; Algosaibi, A. Adversarial NLP for Social Network Applications: Attacks, Defenses, and Research Directions. IEEE Trans. Comput. Soc. Syst. 2023, 10, 3089–3108. [Google Scholar] [CrossRef]
- Zeng, X.; Zubiaga, A. Aggregating Pairwise Semantic Differences for Few-Shot Claim Verification. PeerJ Comput. Sci. 2022, 8, e1137. [Google Scholar] [CrossRef]
- Ananthi, G.; Sridevi, S. Stacking Dilated Convolutional AutoEncoder Beamforming for THz Wave Vehicular Ad-Hoc Networks. Wirel. Pers. Commun. 2022, 126, 2985–3000. [Google Scholar] [CrossRef]
- Michailidis, P.D. Visualizing Social Media Research in the Age of COVID-19. Information 2022, 13, 372. [Google Scholar] [CrossRef]
- Puteh, N.; Ali bin Saip, M.; Zabidin Husin, M.; Hussain, A. Sentiment Analysis with Deep Learning: A Bibliometric Review. Turk. J. Comput. Math. Educ. TURCOMAT 2021, 12, 1509–1519. [Google Scholar]
- Sarirete, A. A Bibliometric Analysis of COVID-19 Vaccines and Sentiment Analysis. Procedia Comput. Sci. 2021, 194, 280–287. [Google Scholar] [CrossRef] [PubMed]
- Sandu, A.; Cotfas, L.-A.; Delcea, C.; Craciun, L.; Molanescu, A.-G. Sentiment Analysis in the Age of COVID-19: A Bibliometric Perspective. Inf. J. Rev. 2023, 14, 659. [Google Scholar] [CrossRef]
- Sanchez-Nunez, P.; Cobo, M.J.; Heras-Pedrosa, C.D.L.; Pelaez, J.I.; Herrera-Viedma, E. Opinion Mining, Sentiment Analysis and Emotion Understanding in Advertising: A Bibliometric Analysis. IEEE Access 2020, 8, 134563–134576. [Google Scholar] [CrossRef]
- Yu, J.; Muñoz-Justicia, J. A Bibliometric Overview of Twitter-Related Studies Indexed in Web of Science. Future Internet 2020, 12, 91. [Google Scholar] [CrossRef]
- Casas-Valadez, M.A.; Faz-Mendoza, A.; Medina-Rodriguez, C.E.; Castorena-Robles, A.; Gamboa-Rosales, N.K.; Lopez-Robles, J.R. Decision Models in Marketing: The Role of Sentiment Analysis from Bibliometric Analysis. In Proceedings of the International Conference on Decision Aid Sciences and Application (DASA), Sakheer, Bahrain, 8 November 2020; pp. 561–565. [Google Scholar]
- Kamath, A.; Shenoy, S.; Kumar, S. An Overview of Investor Sentiment: Identifying Themes, Trends, and Future Direction through Bibliometric Analysis. Invest. Manag. Financ. Innov. 2022, 19, 229–242. [Google Scholar] [CrossRef]
- Qiang, Y.; Tao, X.; Gou, X.; Lang, Z.; Liu, H. Towards a Bibliometric Mapping of Network Public Opinion Studies. Information 2022, 13, 17. [Google Scholar] [CrossRef]
- Kale, A.S. Sentiment Analysis in Library and Information Science: A Bibliometric Study. Available online: https://0-www-proquest-com.brum.beds.ac.uk/openview/4413eac1c9486d2492b58929b57cadf3/1?pq-origsite=gscholar&cbl=5170426 (accessed on 3 December 2023).
- Nyakurukwa, K.; Seetharam, Y. The Evolution of Studies on Social Media Sentiment in the Stock Market: Insights from Bibliometric Analysis. Sci. Afr. 2023, 20, e01596. [Google Scholar] [CrossRef]
- Yaqub, A.; Thalib, H.; Brahimi, T.; Sarirete, A. A Bibliometric of Sentiment Analysis in Tourism Industry during COVID-19 Pandemic. In Proceedings of the International Conference on Industrial Engineering and Operations Management, IEOM Society International, Istanbul, Turkey, 7–10 March 2022; pp. 2383–2393. [Google Scholar]
Figure 1.
Annual scientific production evolution.

Figure 2.
Annual average article citations per year evolution.

Figure 3.
Top 8 most relevant journals.

Figure 4.
Bradford’s law on source clustering.

Figure 5.
Journals’ impact based on H-index.

Figure 6.
Journals’ growth (cumulative) based on the number of papers.

Figure 7.
Top 11 authors based on number of documents.

Figure 8.
Top 20 authors’ production over time.

Figure 9.
Top 13 most relevant affiliations.

Figure 10.
Top 8 most relevant corresponding author’s country.

Figure 11.
Scientific production based on country.

Figure 12.
Top 20 countries with the most citations.

Figure 13.
Country collaboration map.

Figure 14.
Top 50 authors collaboration network.

Figure 15.
Top 50 words based on keywords plus (A) and top 50 words based on authors’ keywords (B).

Figure 16.
Co-occurrence network for the terms in the author’s keywords.

Figure 17.
Thematic map based on author’s keywords.

Figure 18.
Thematic map for the 2016–2018 slice period.

Figure 19.
Thematic map for the 2019–2022 slice period.

Figure 20.
Three-field plot: countries (left), authors (middle), journals (right).

Figure 21.
Three-field plot: affiliations (left), authors (middle), keywords (right).


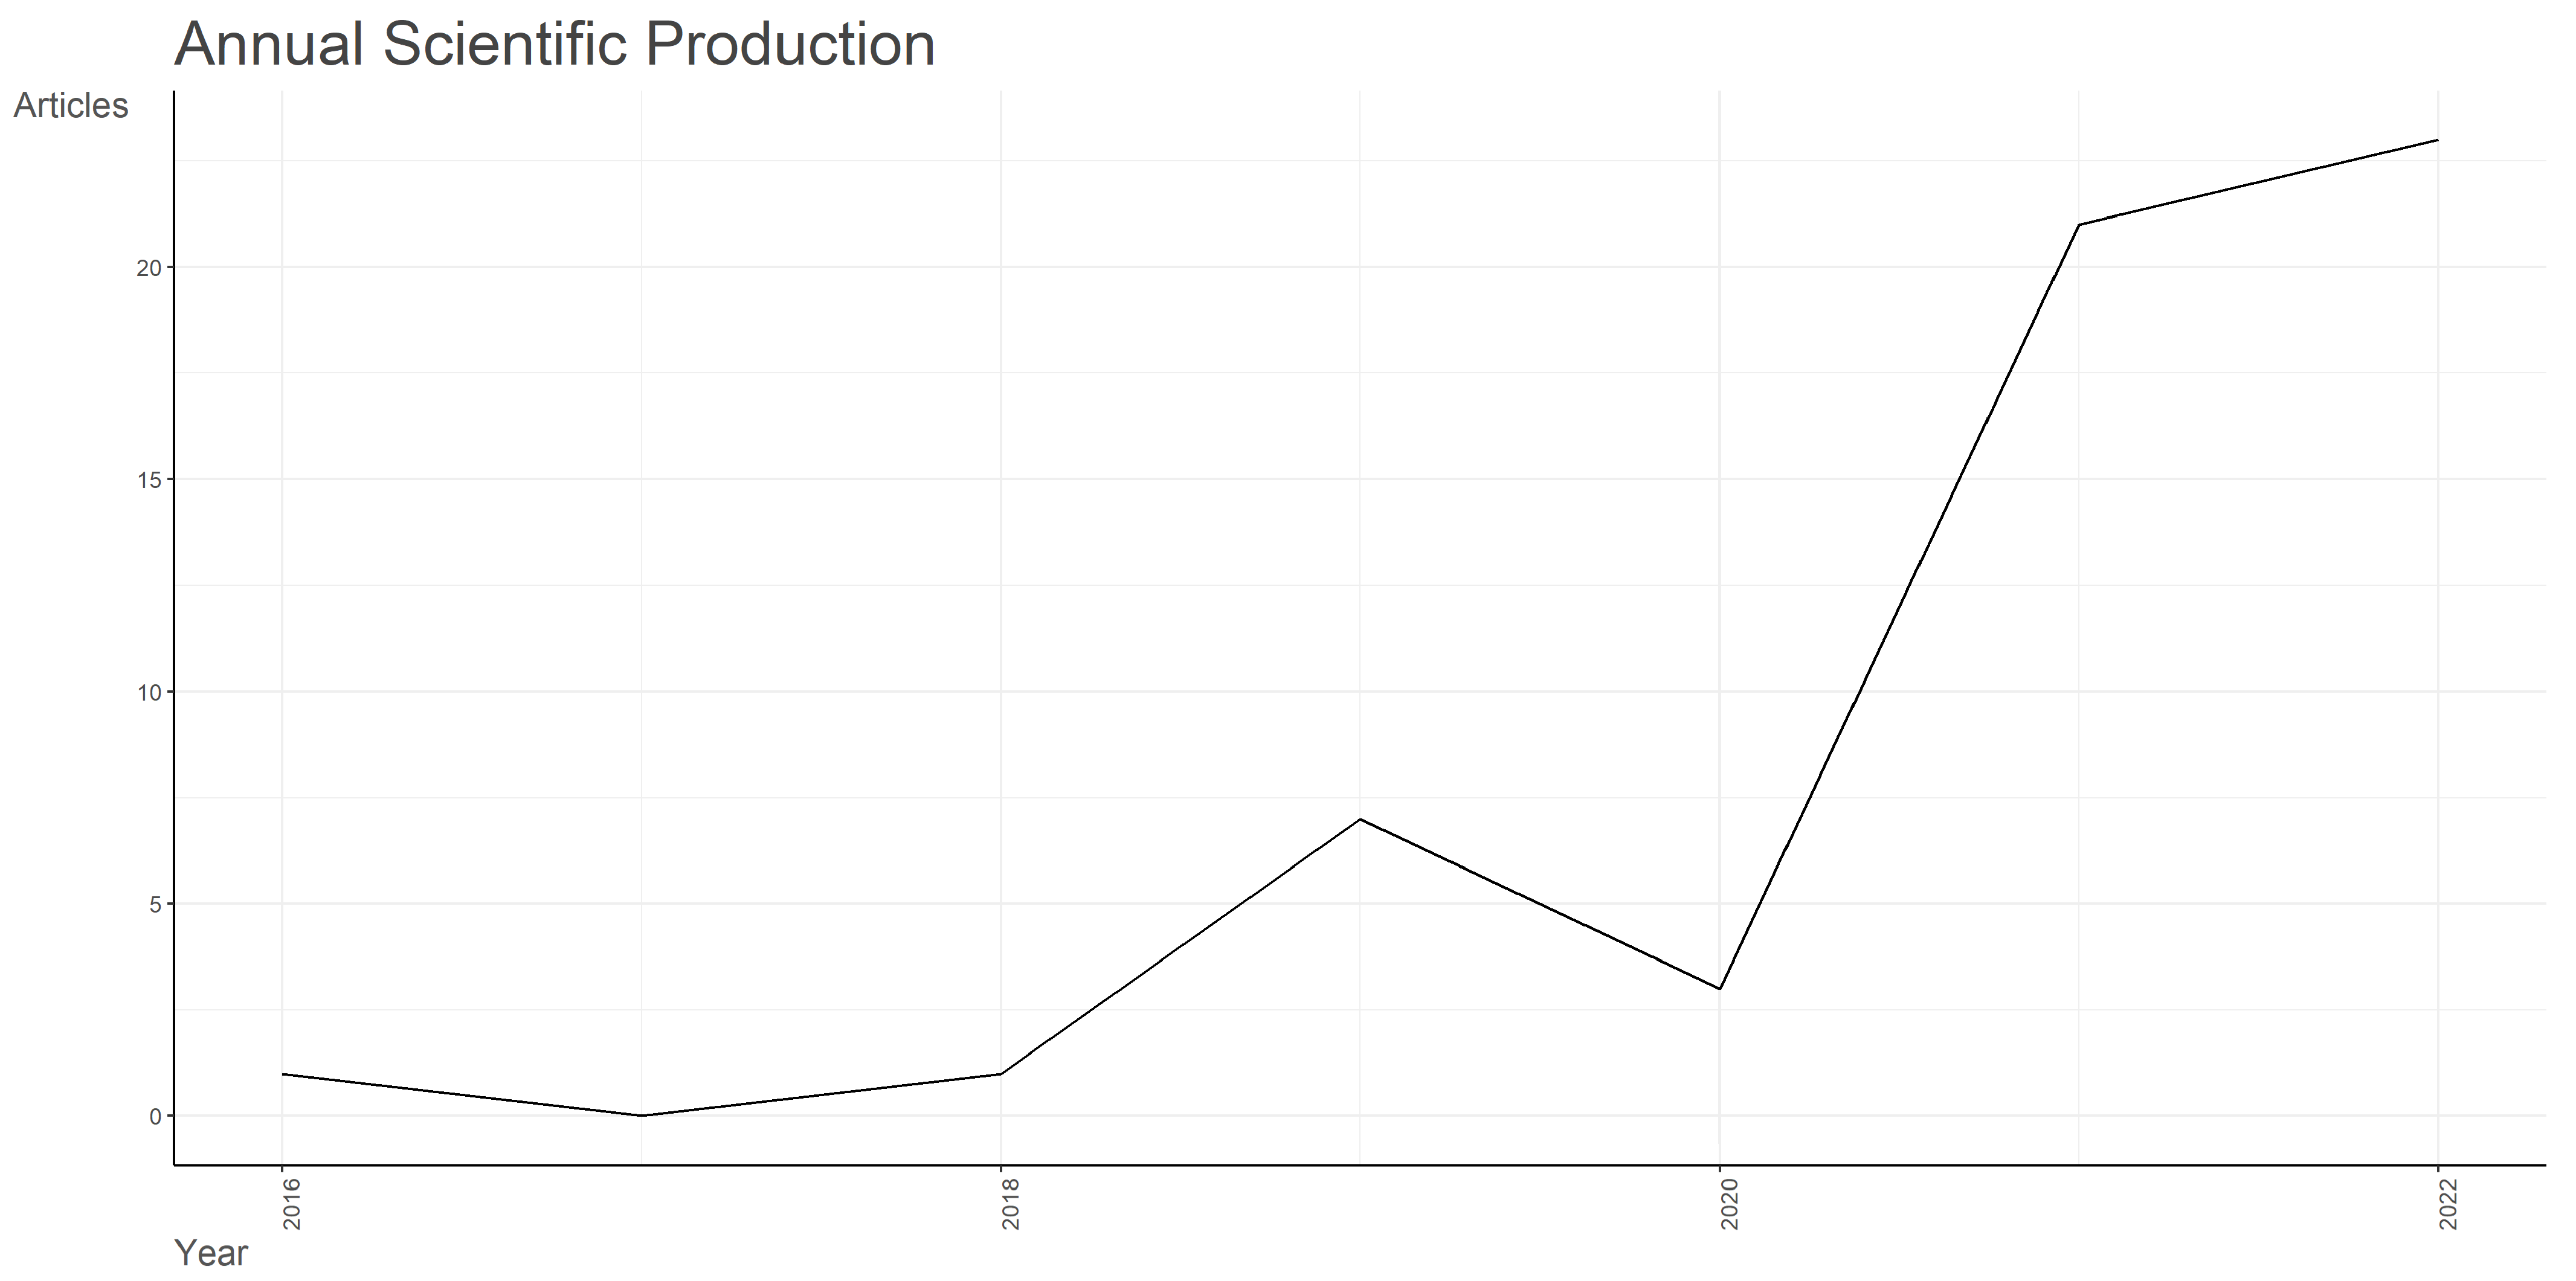
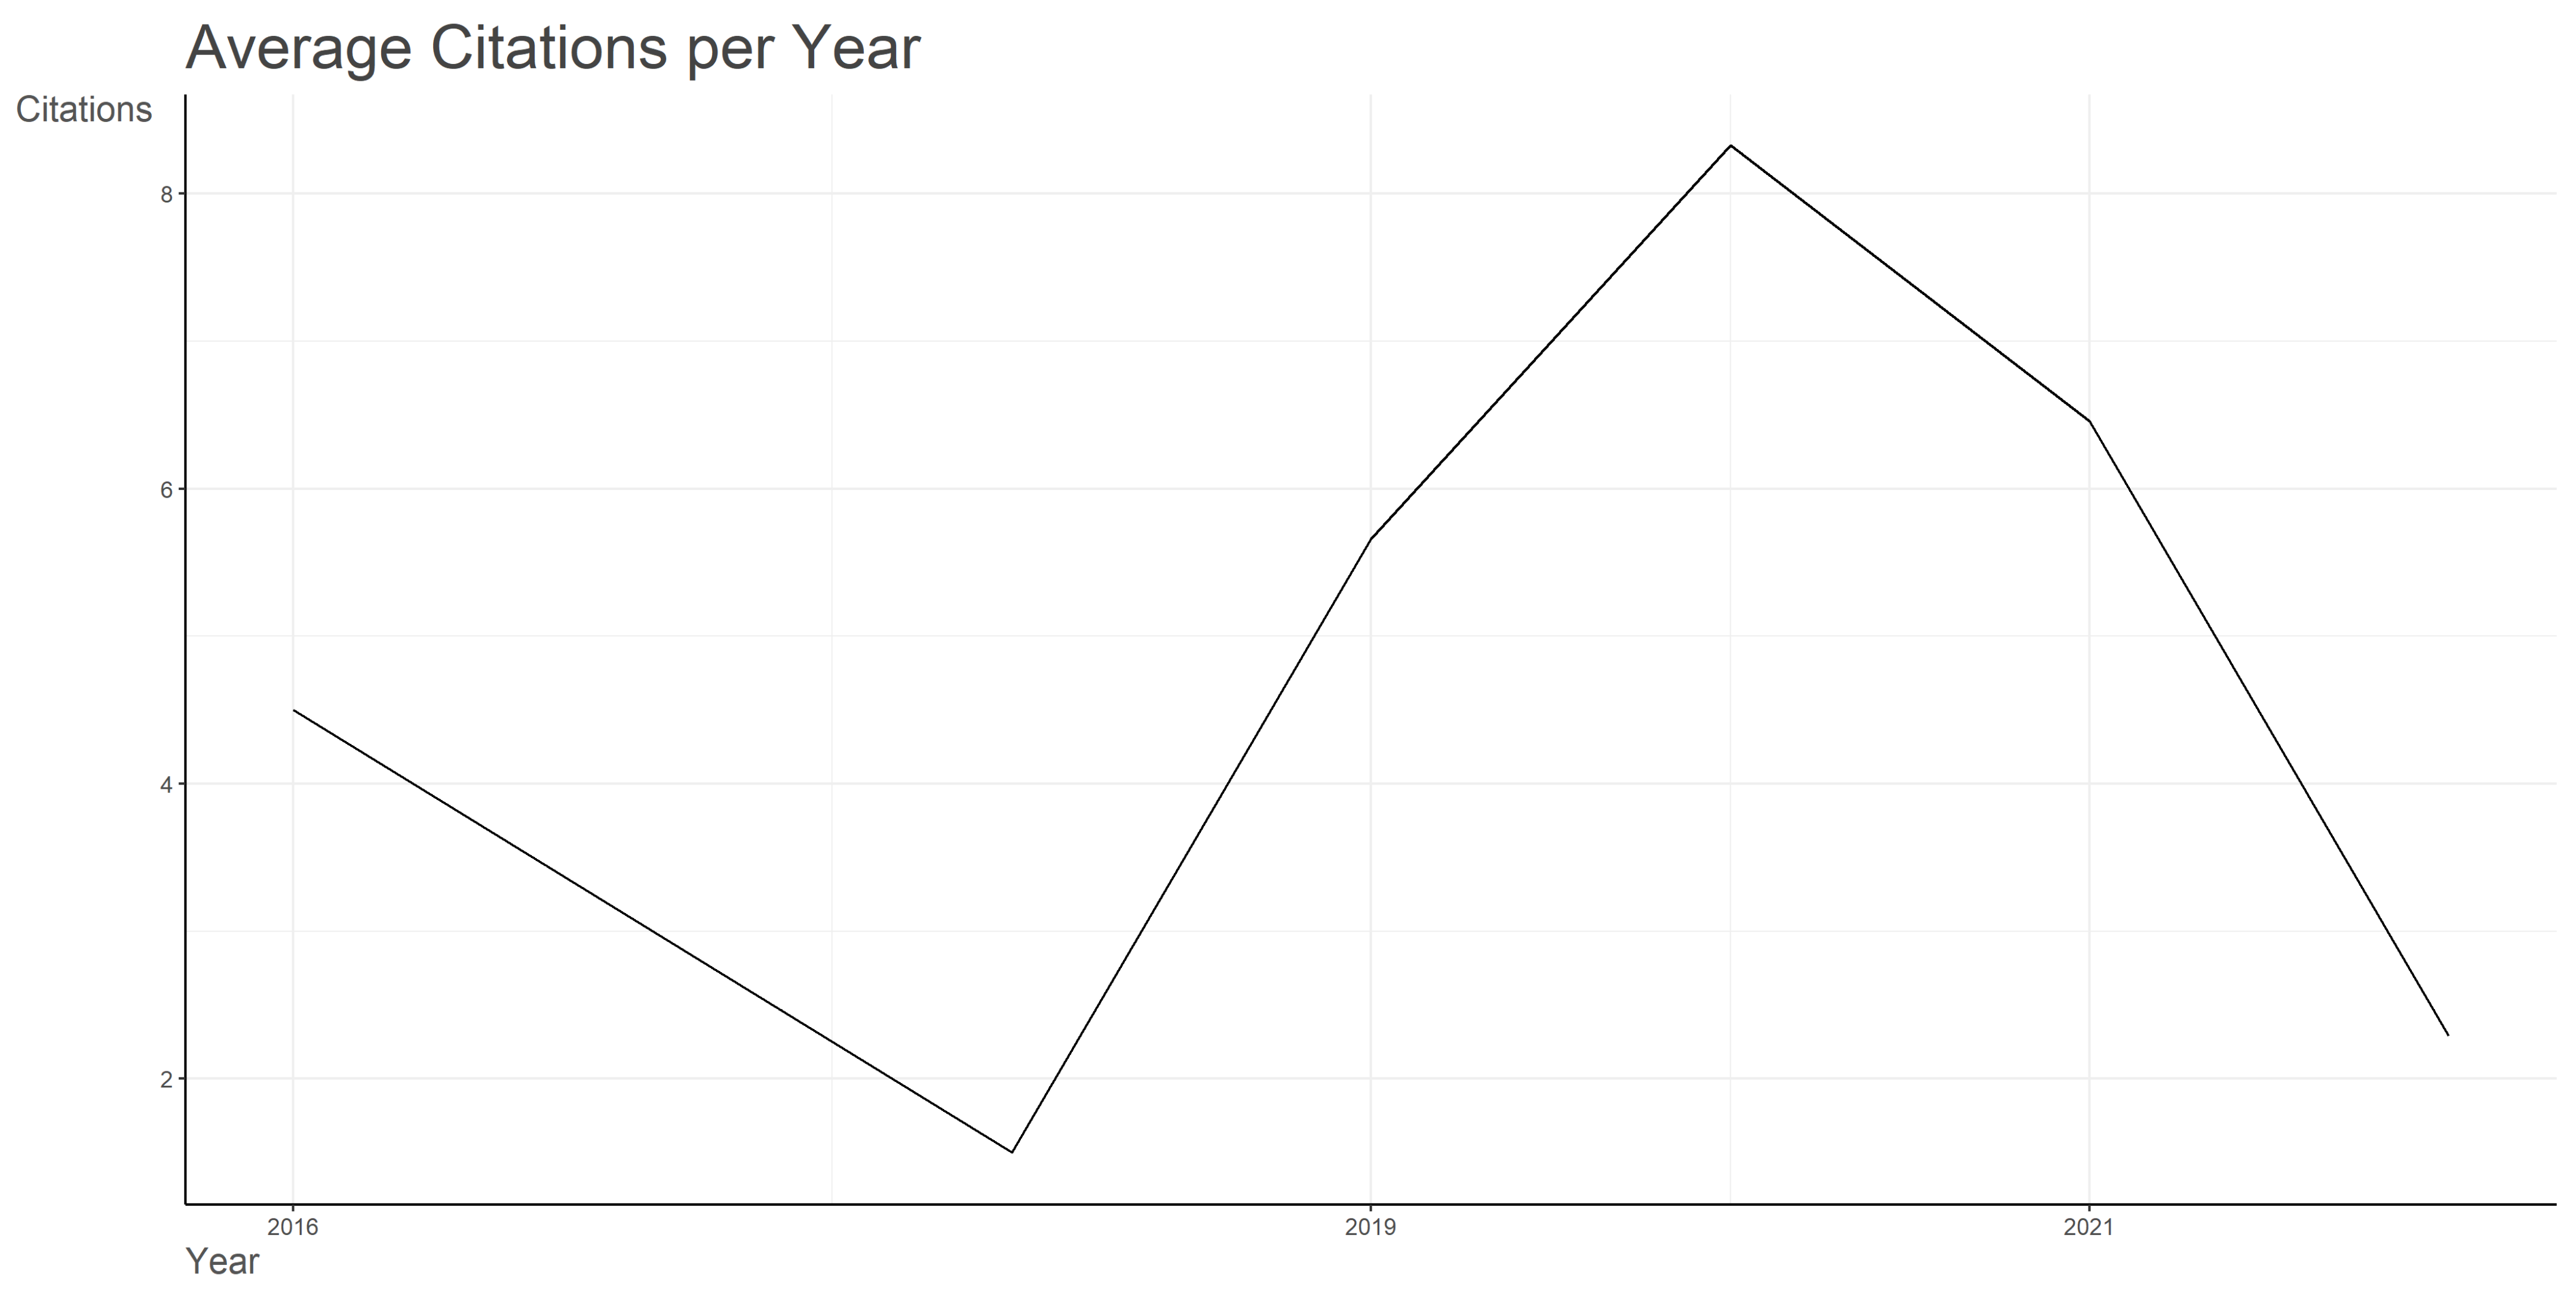
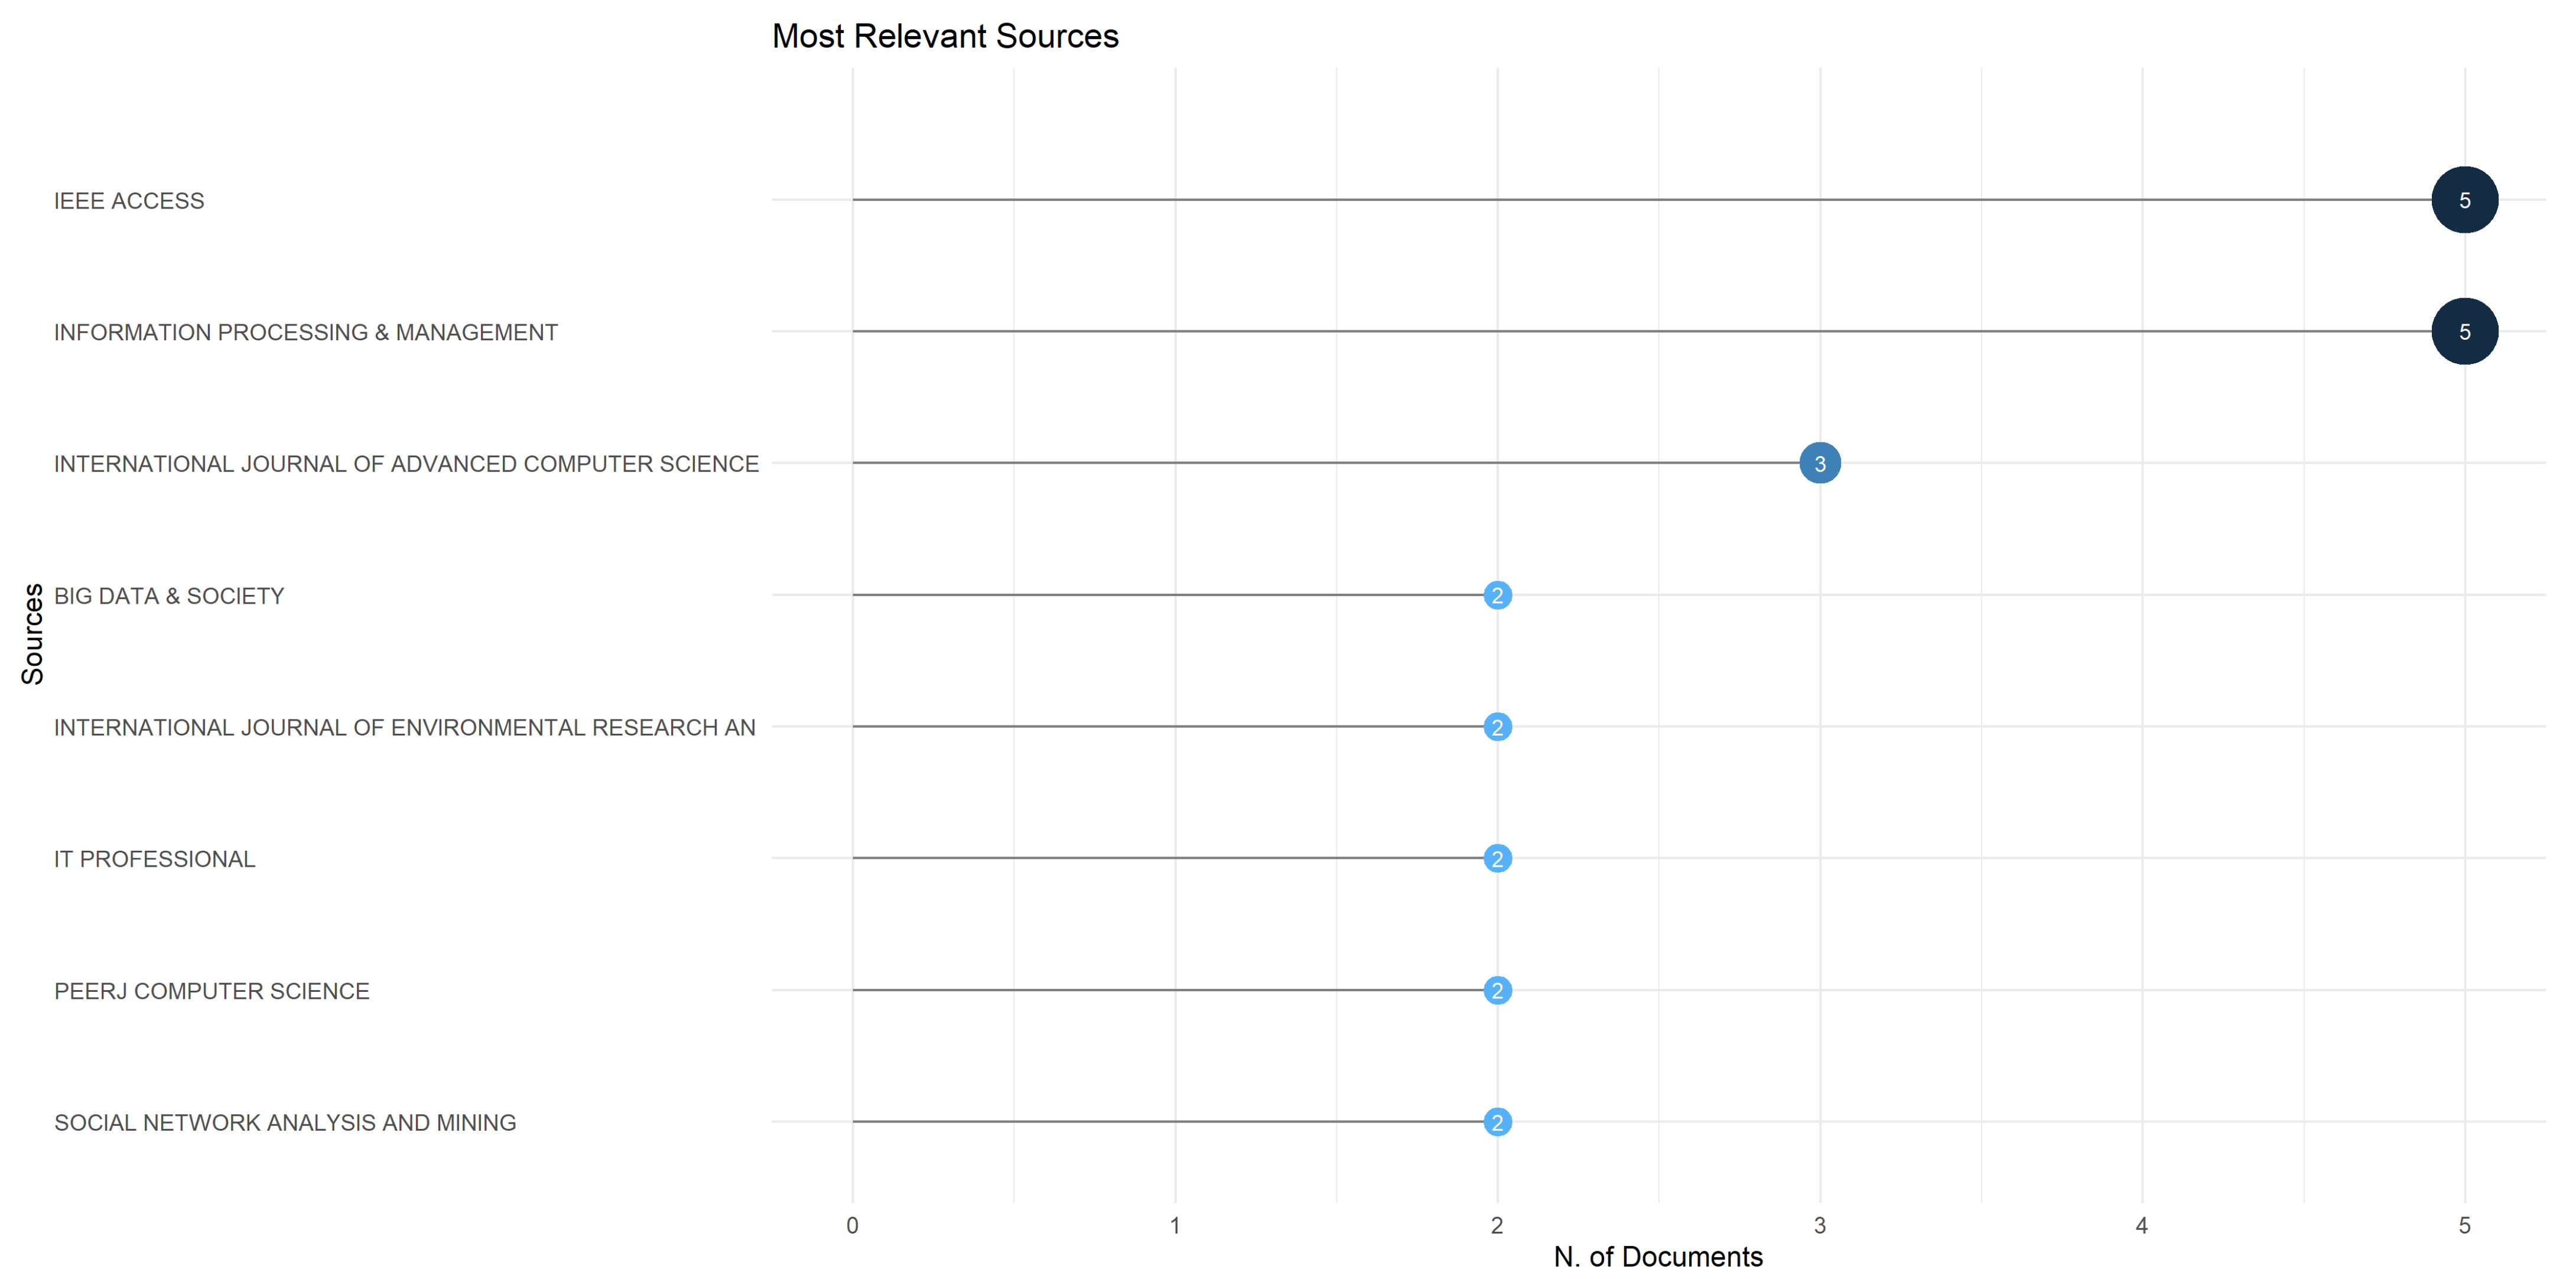
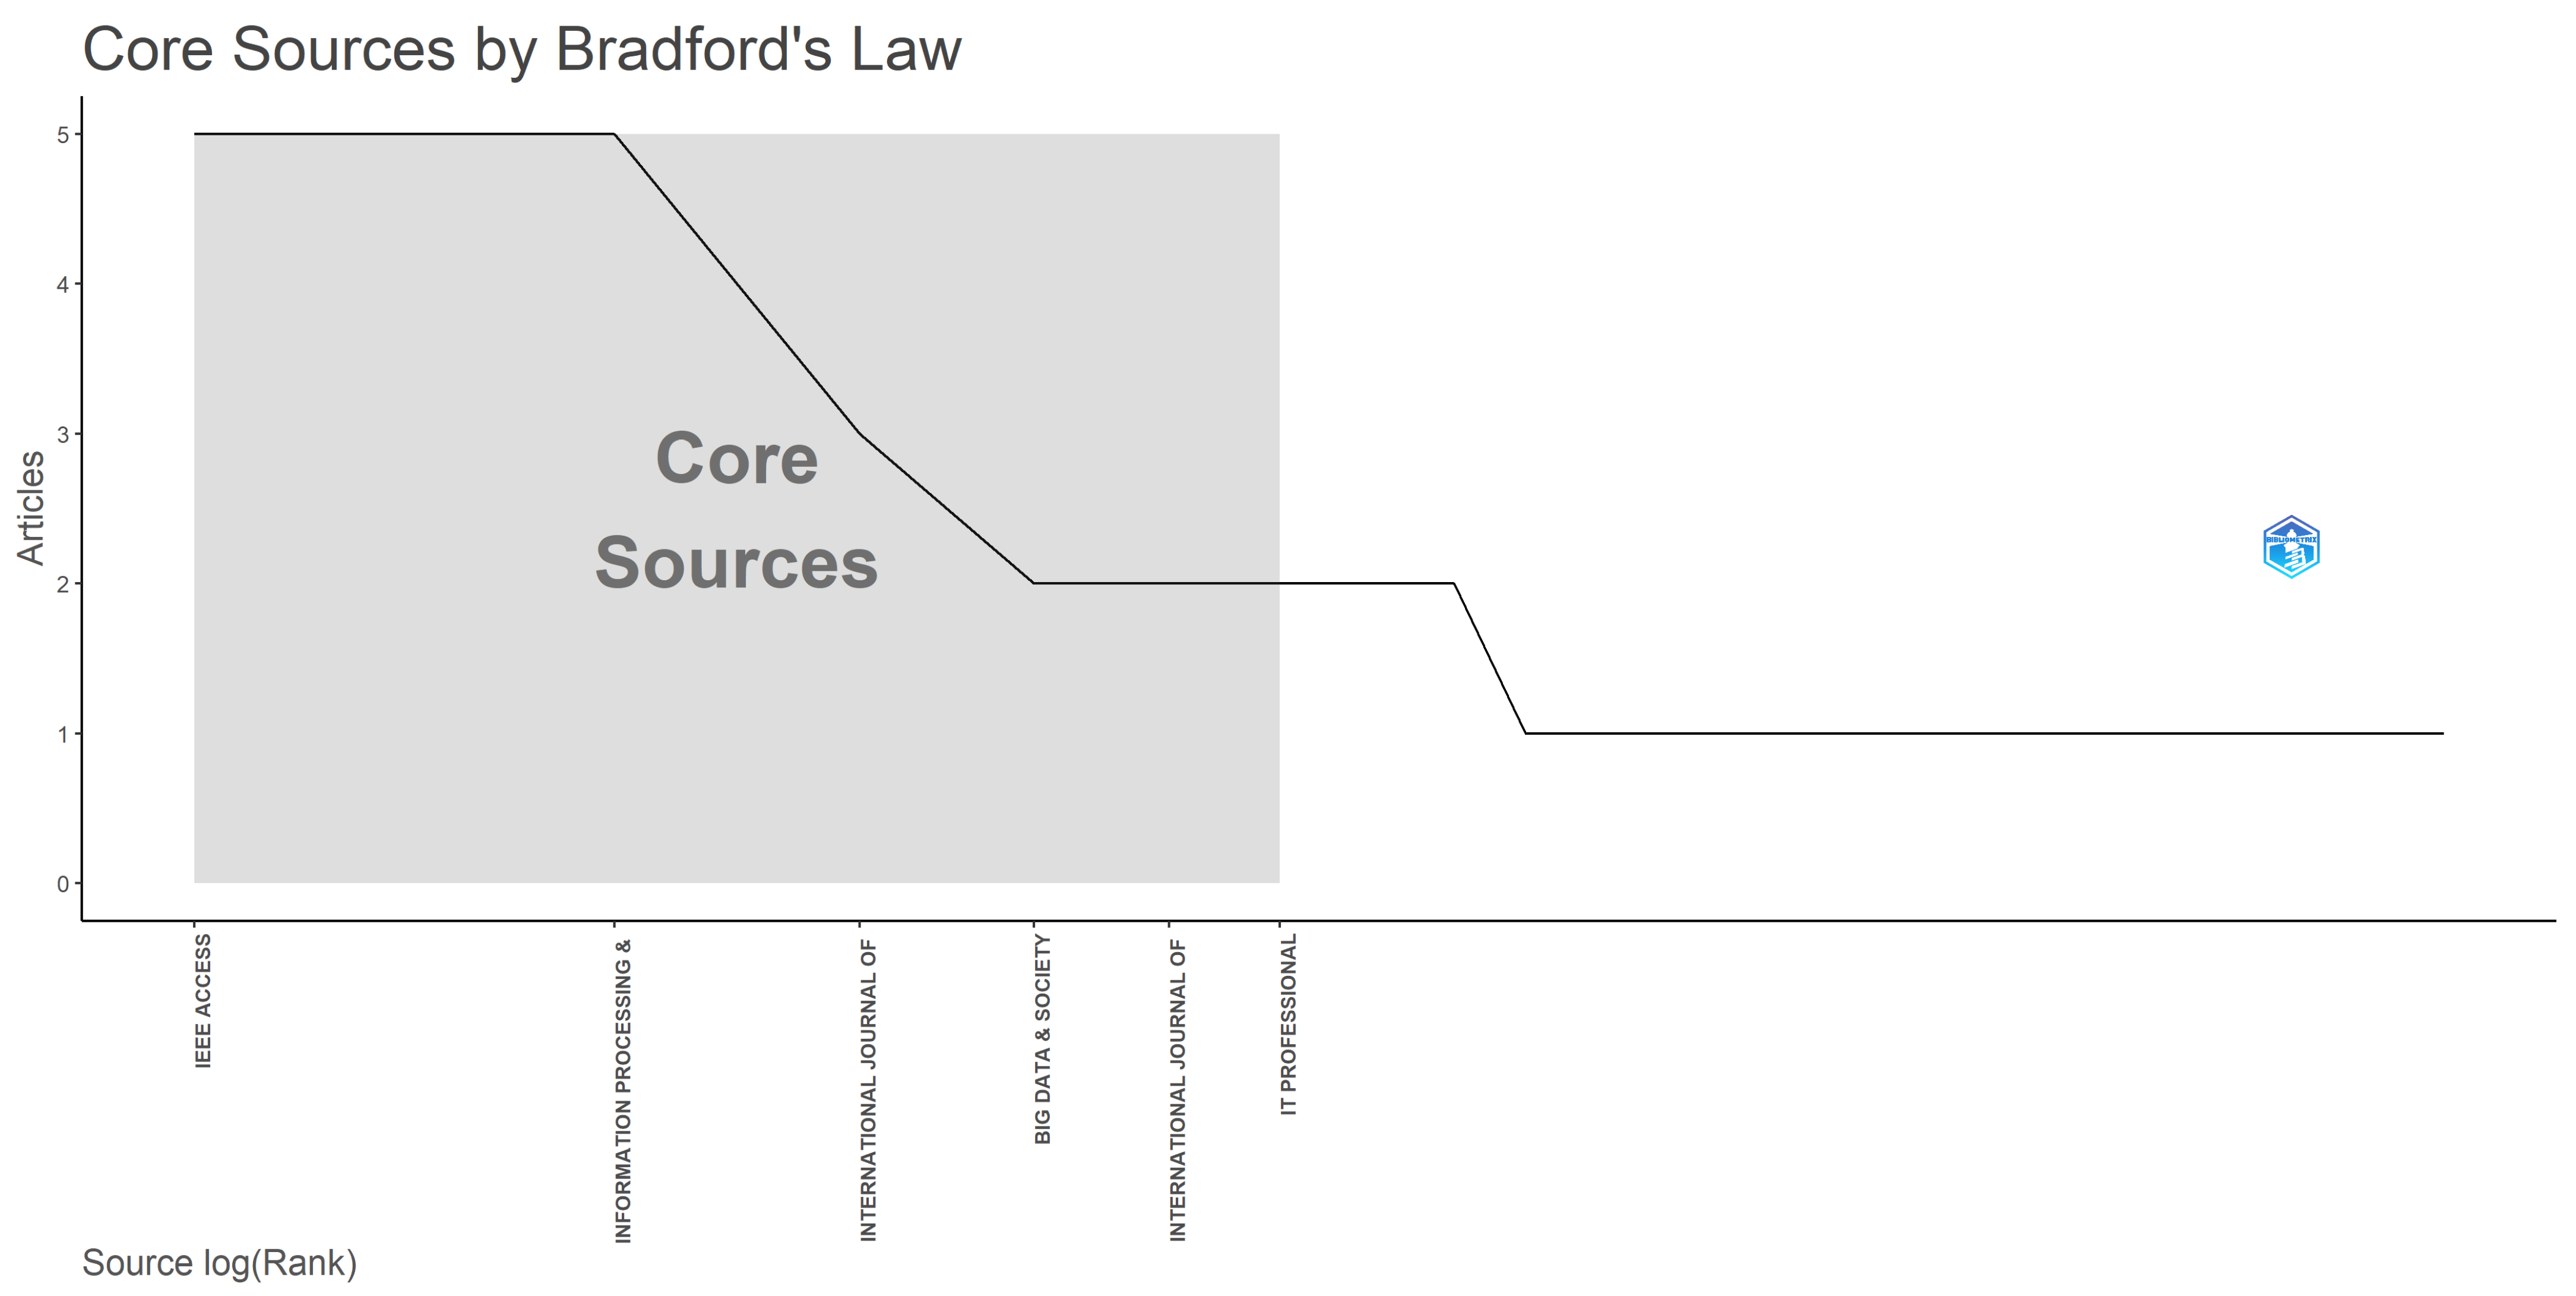
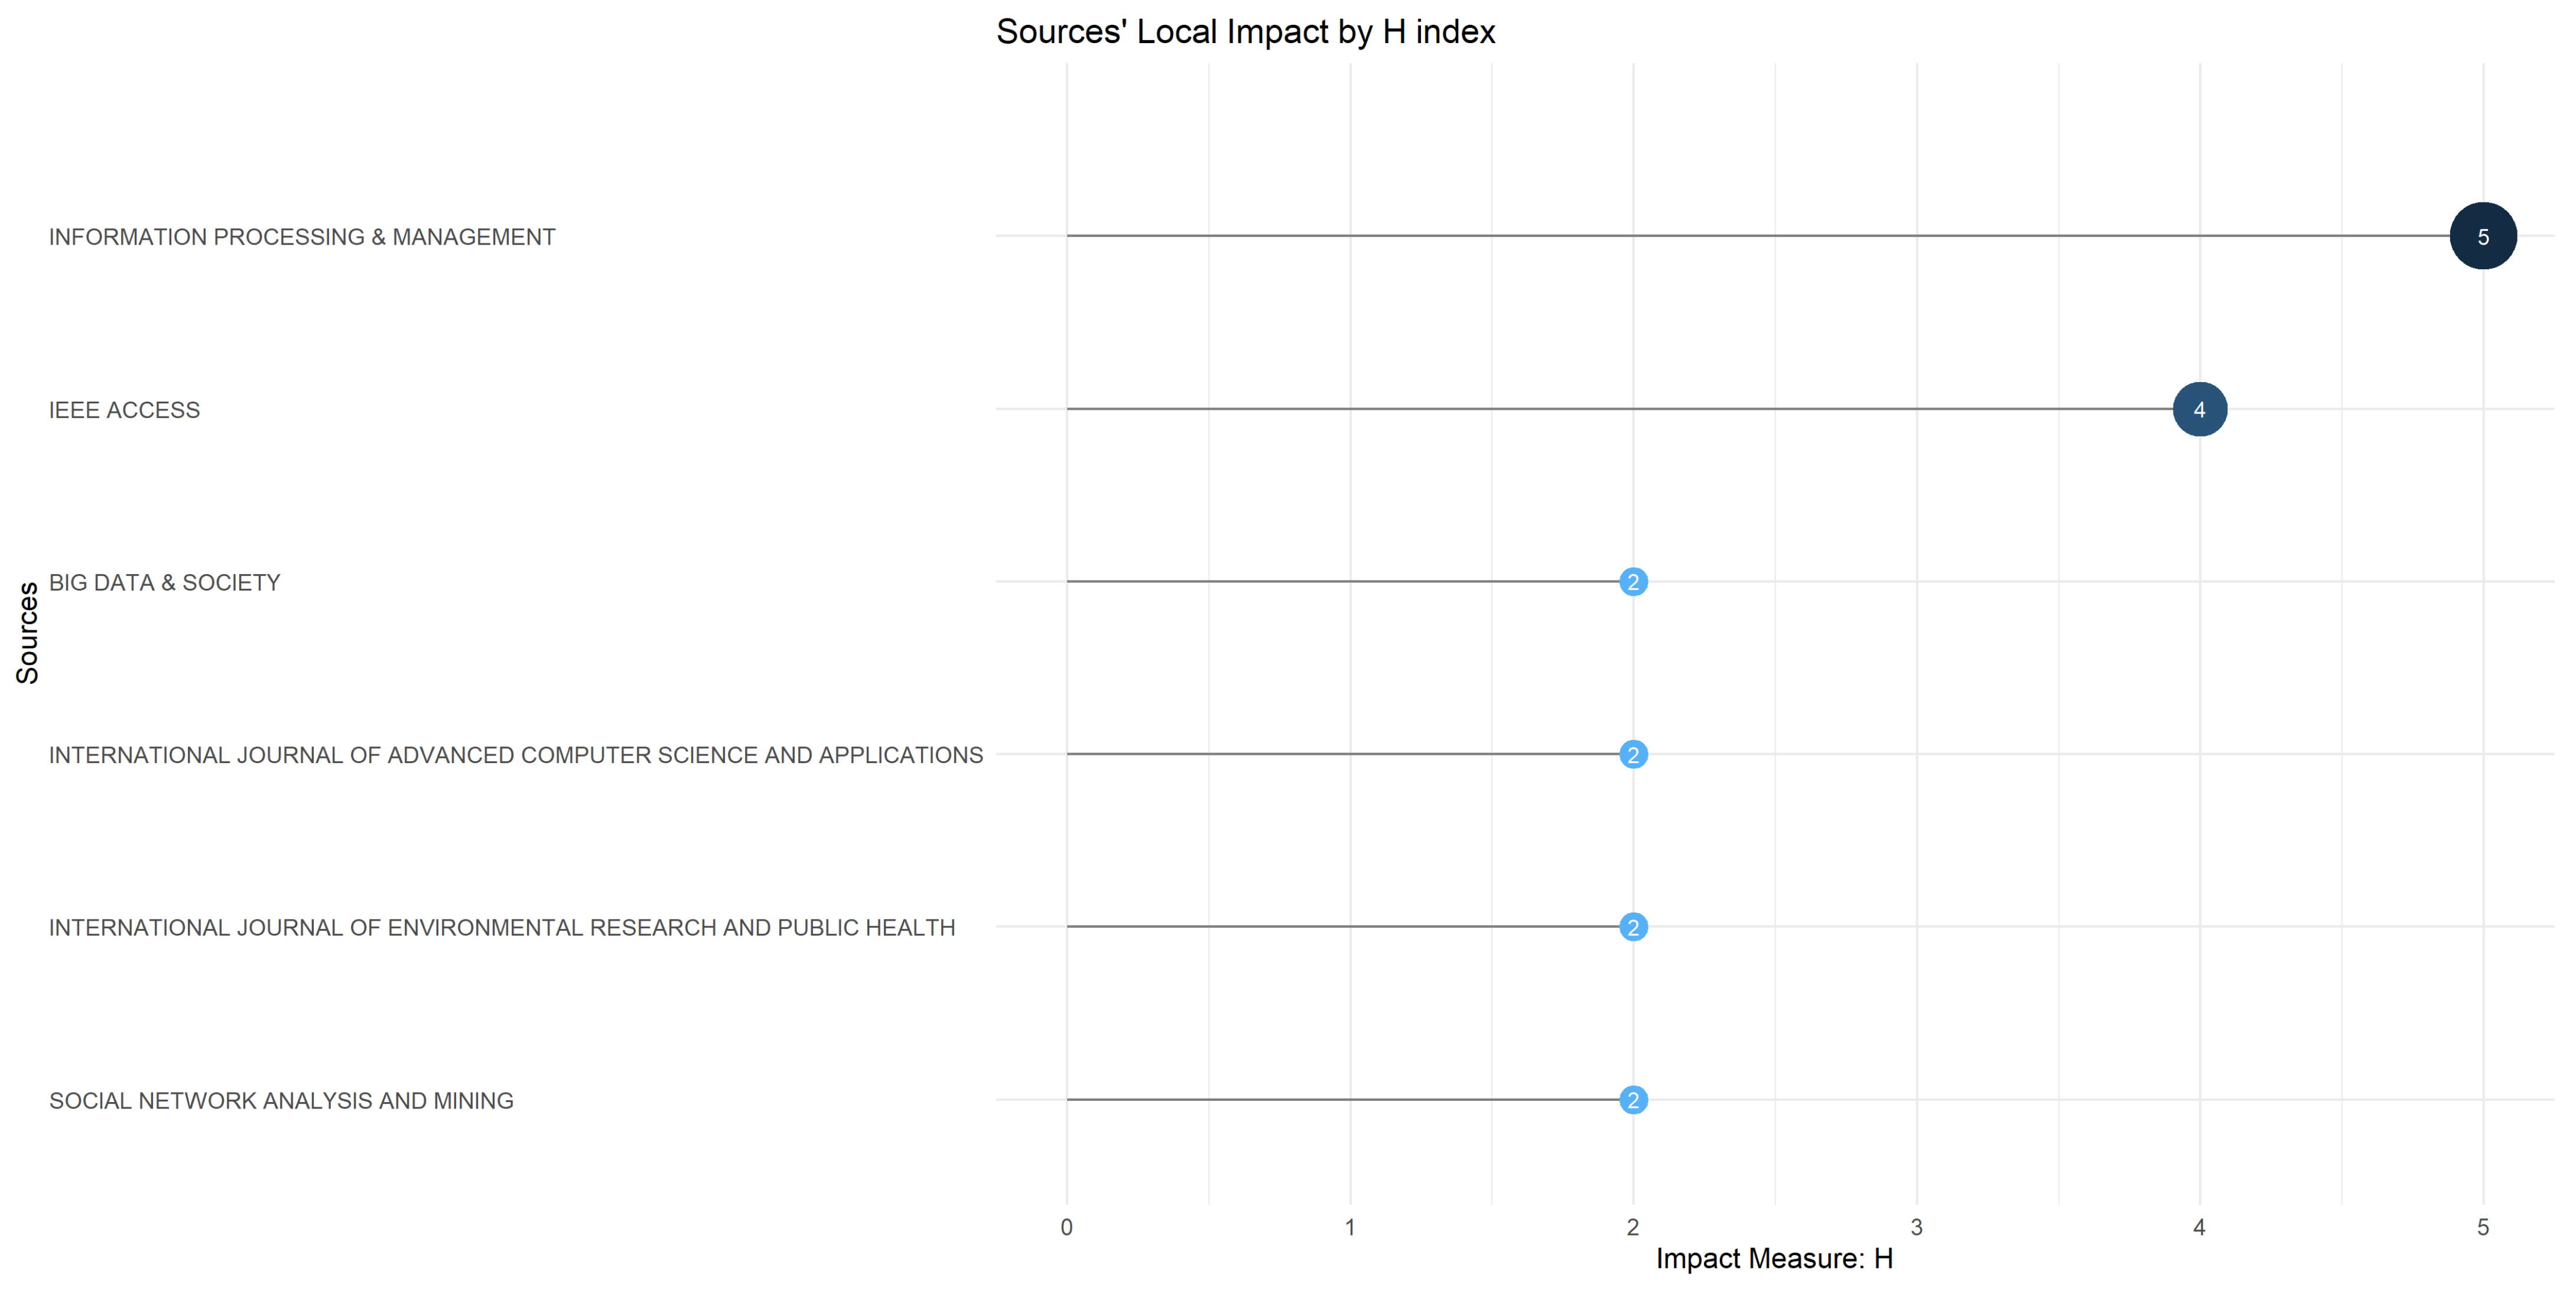
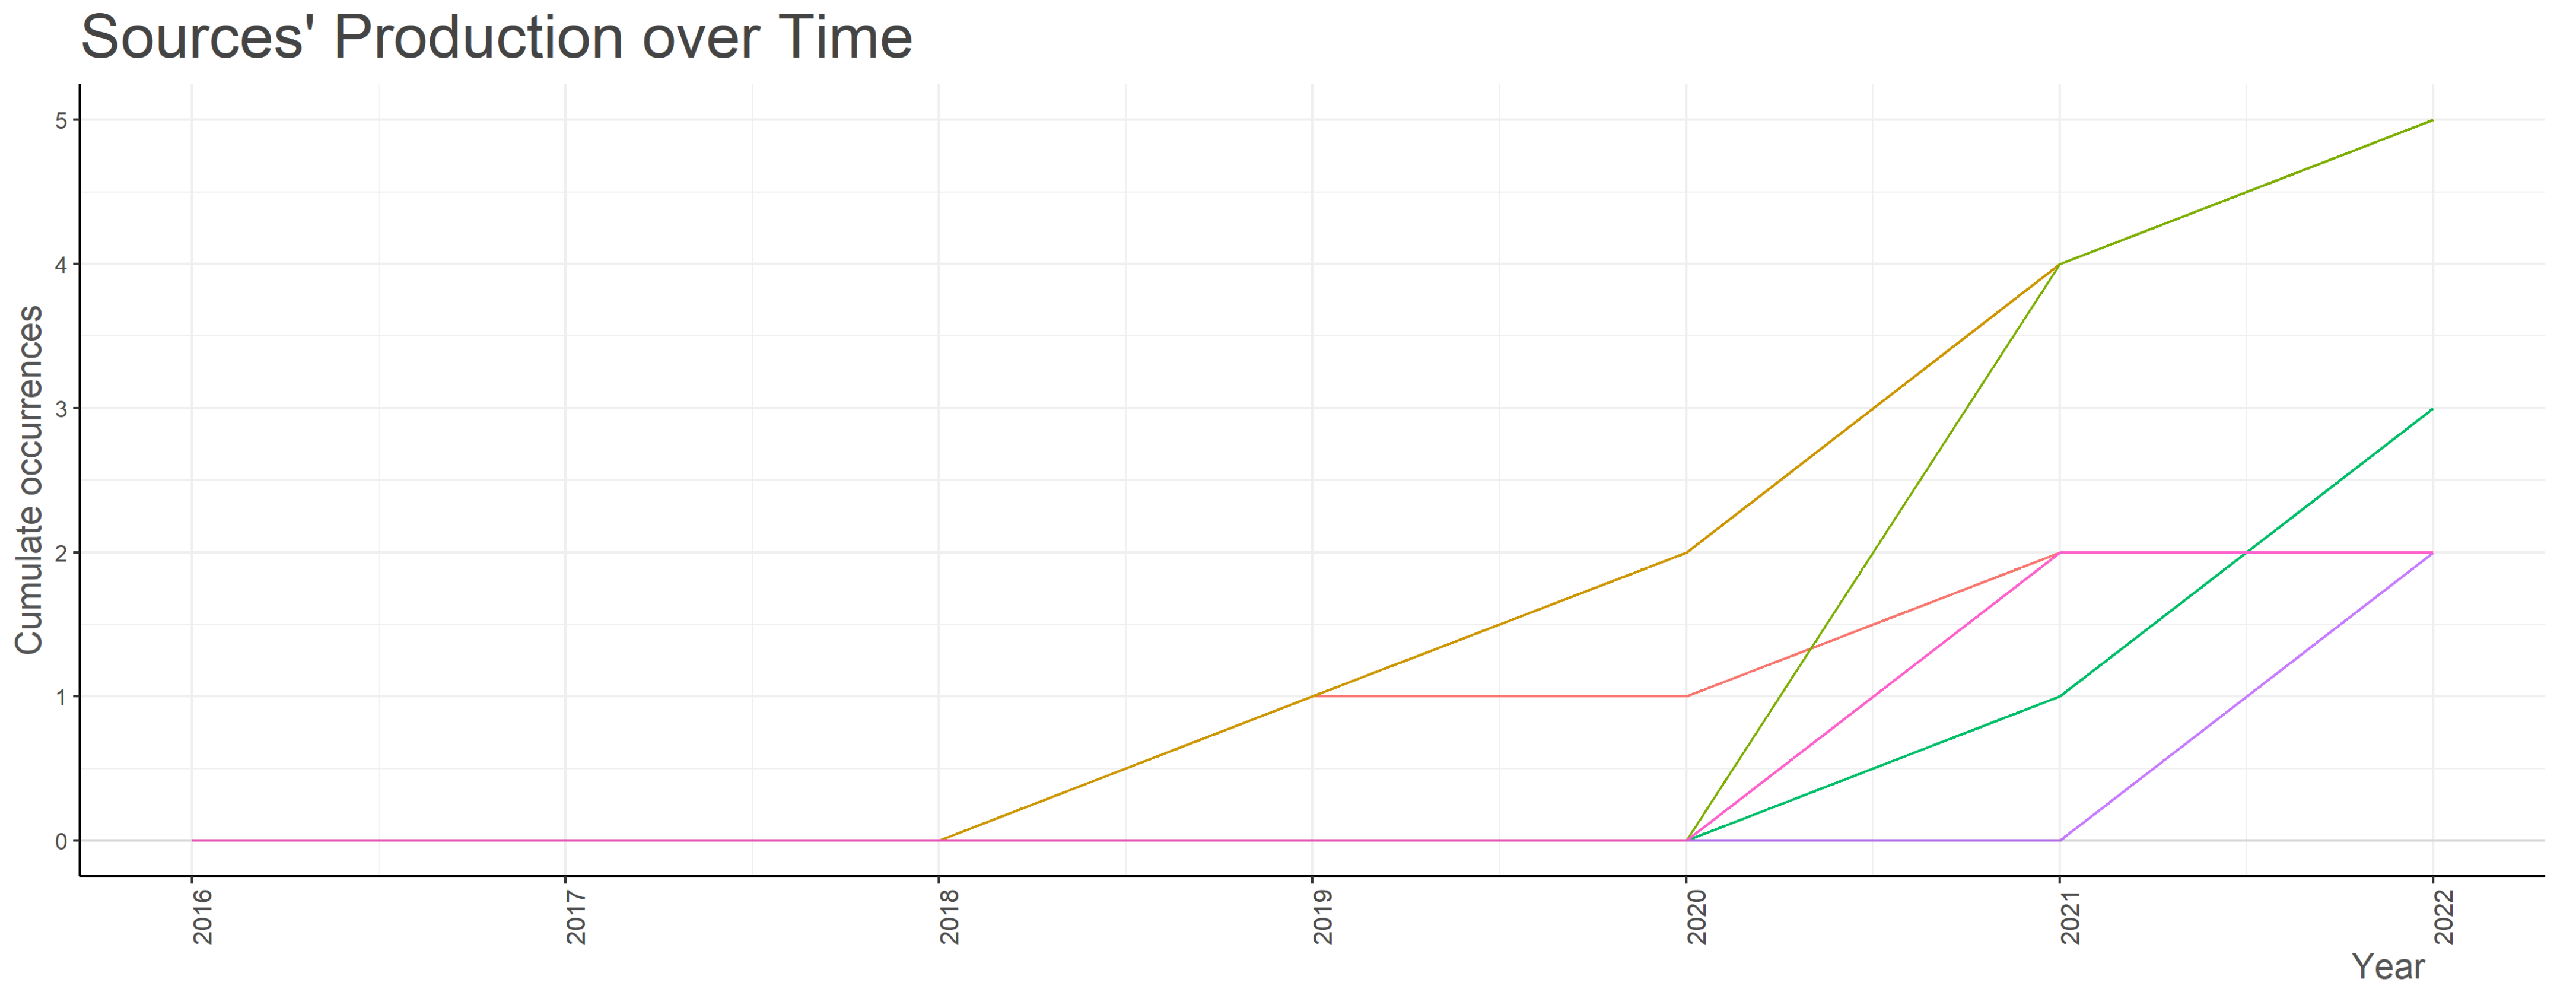
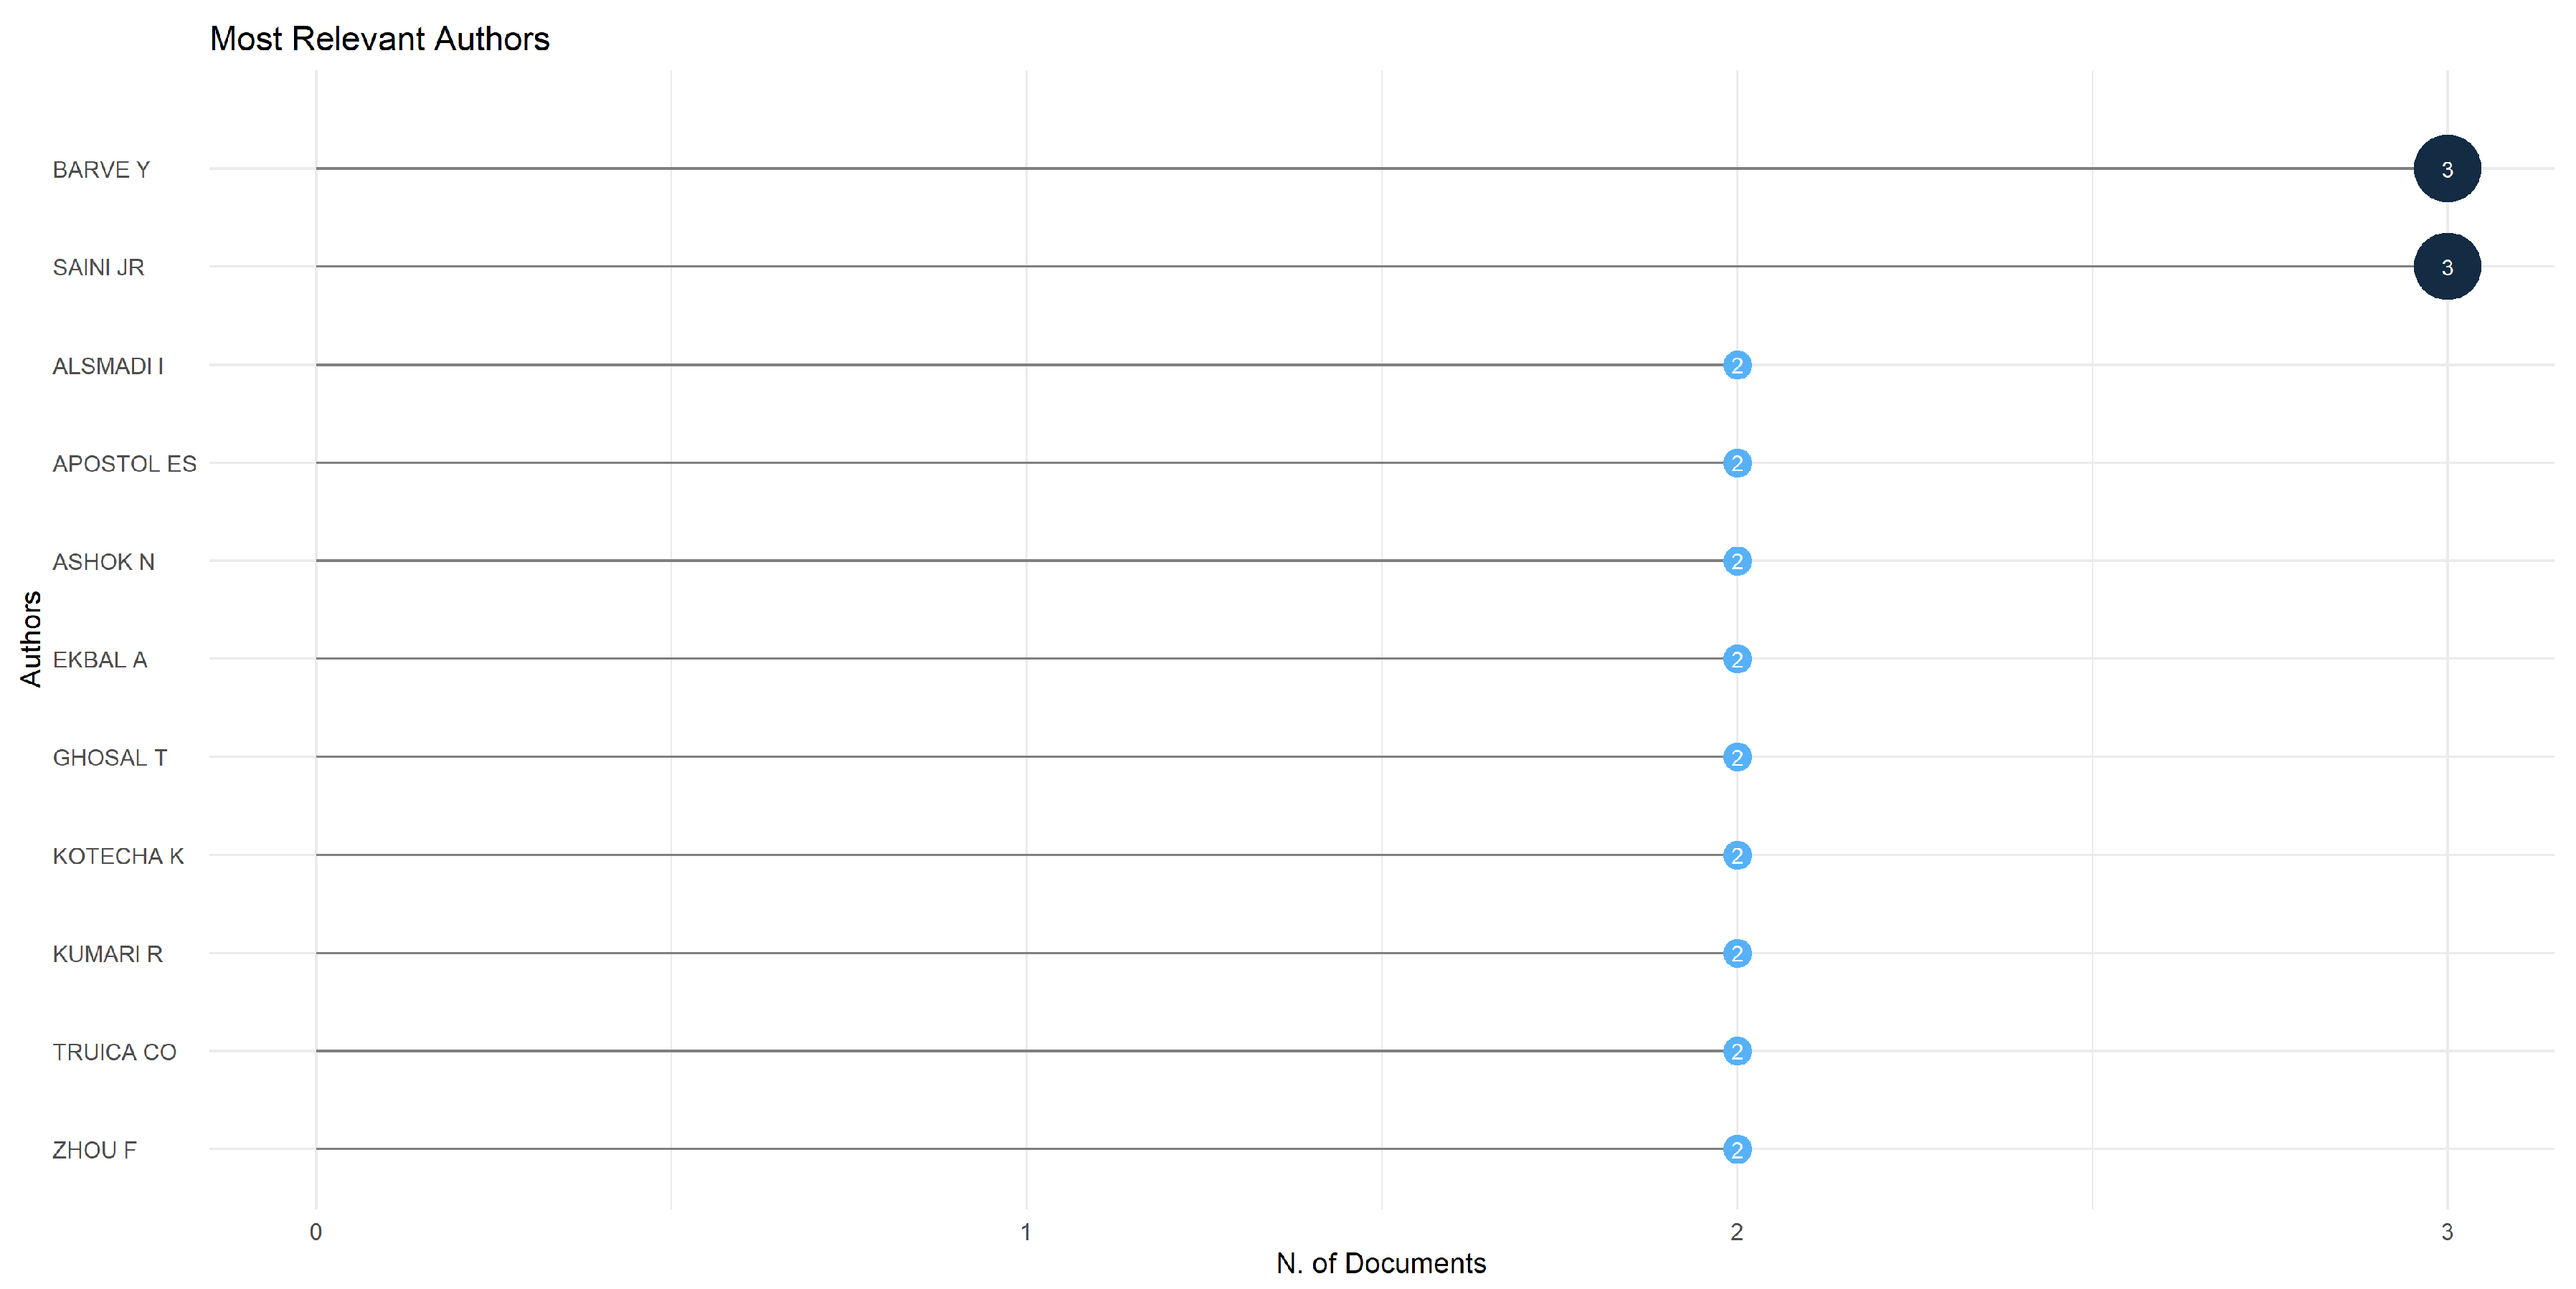
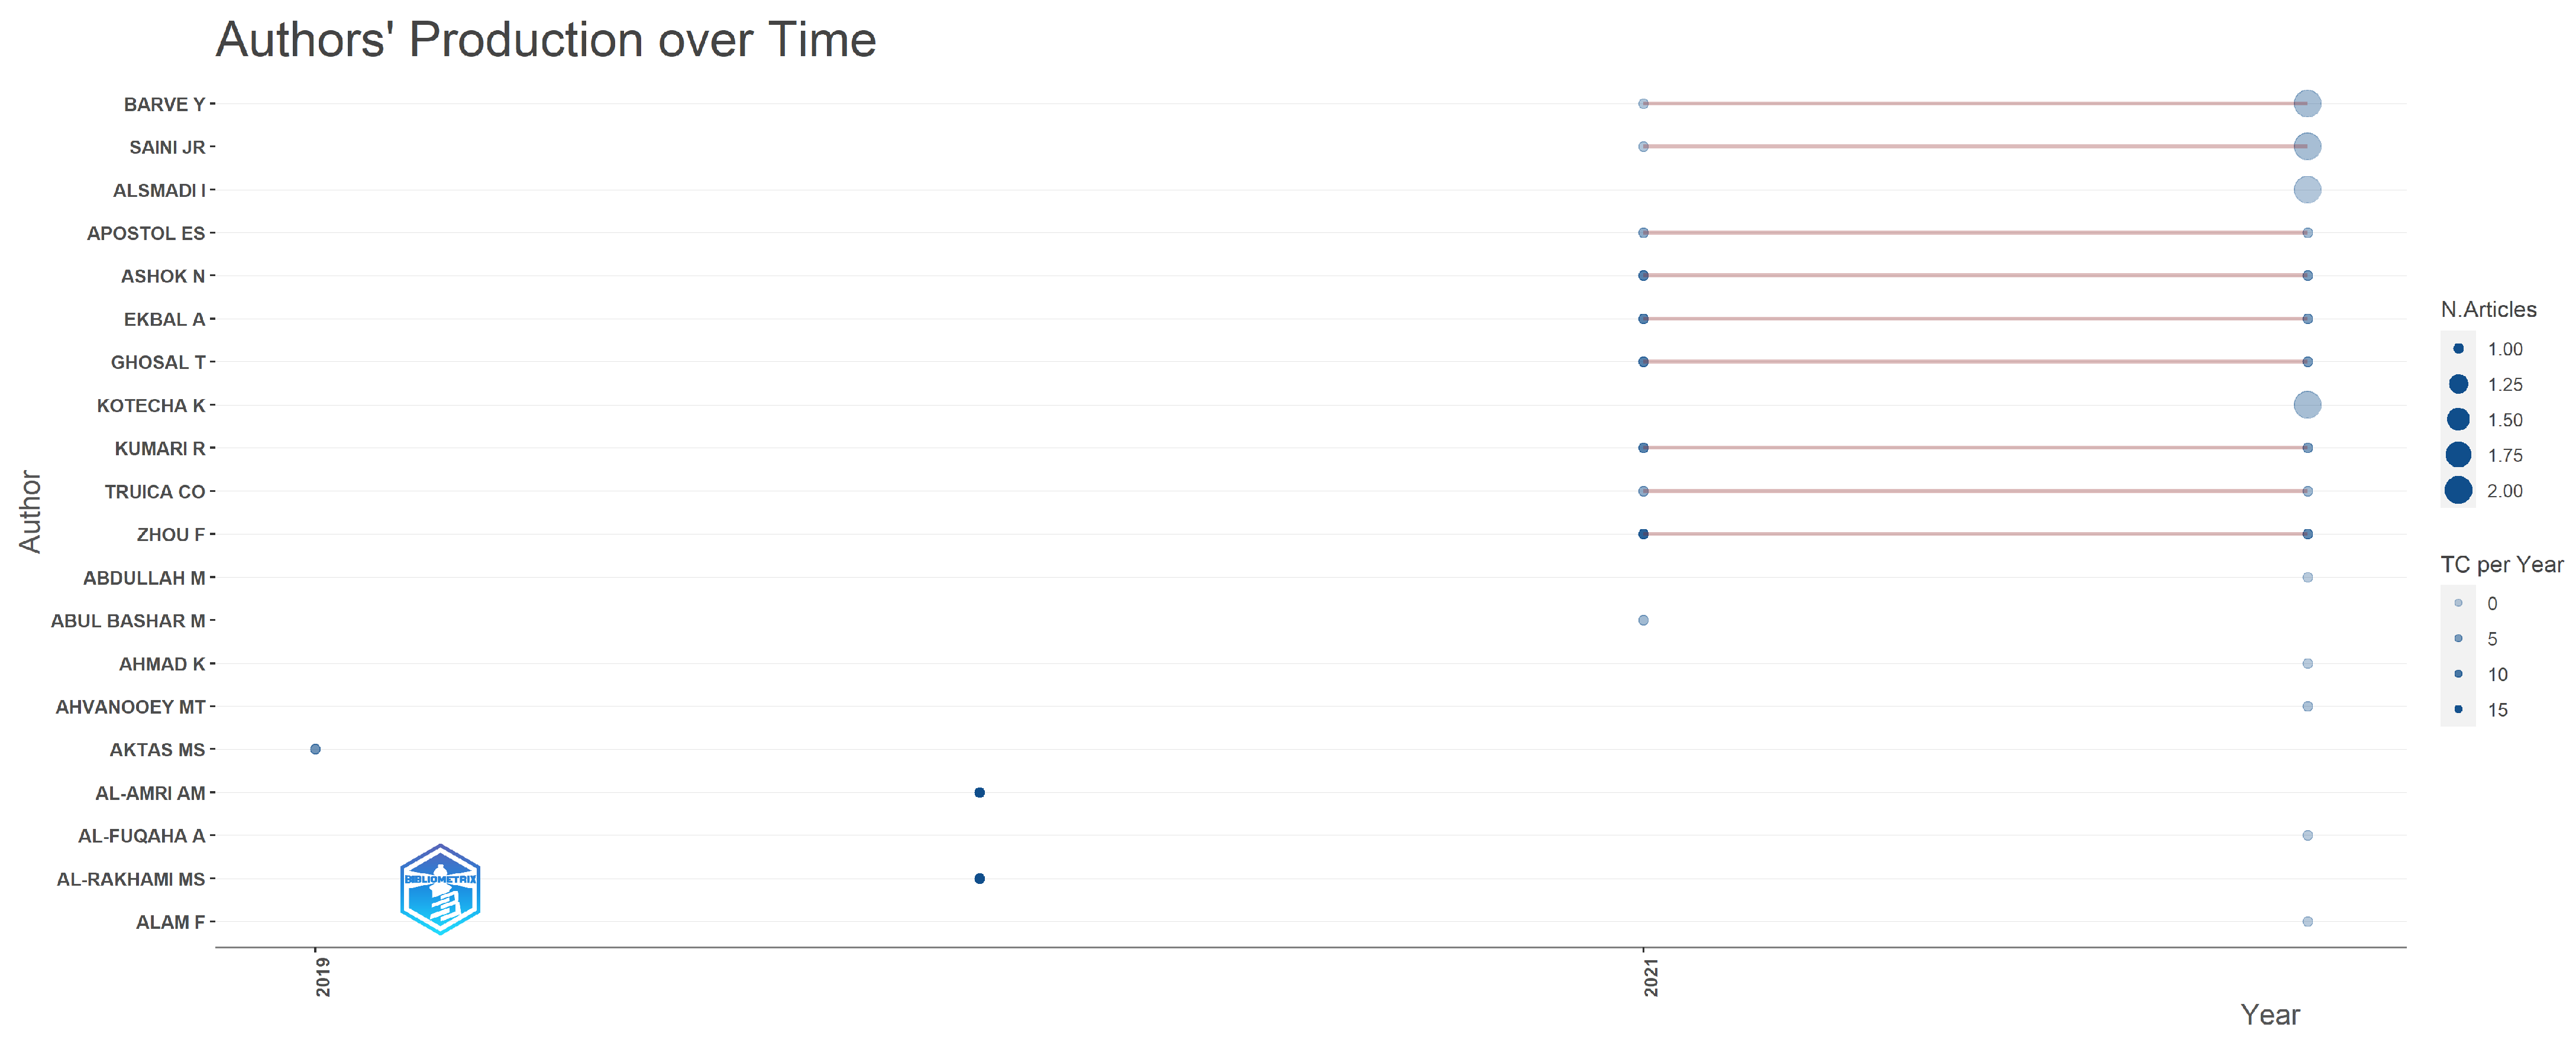
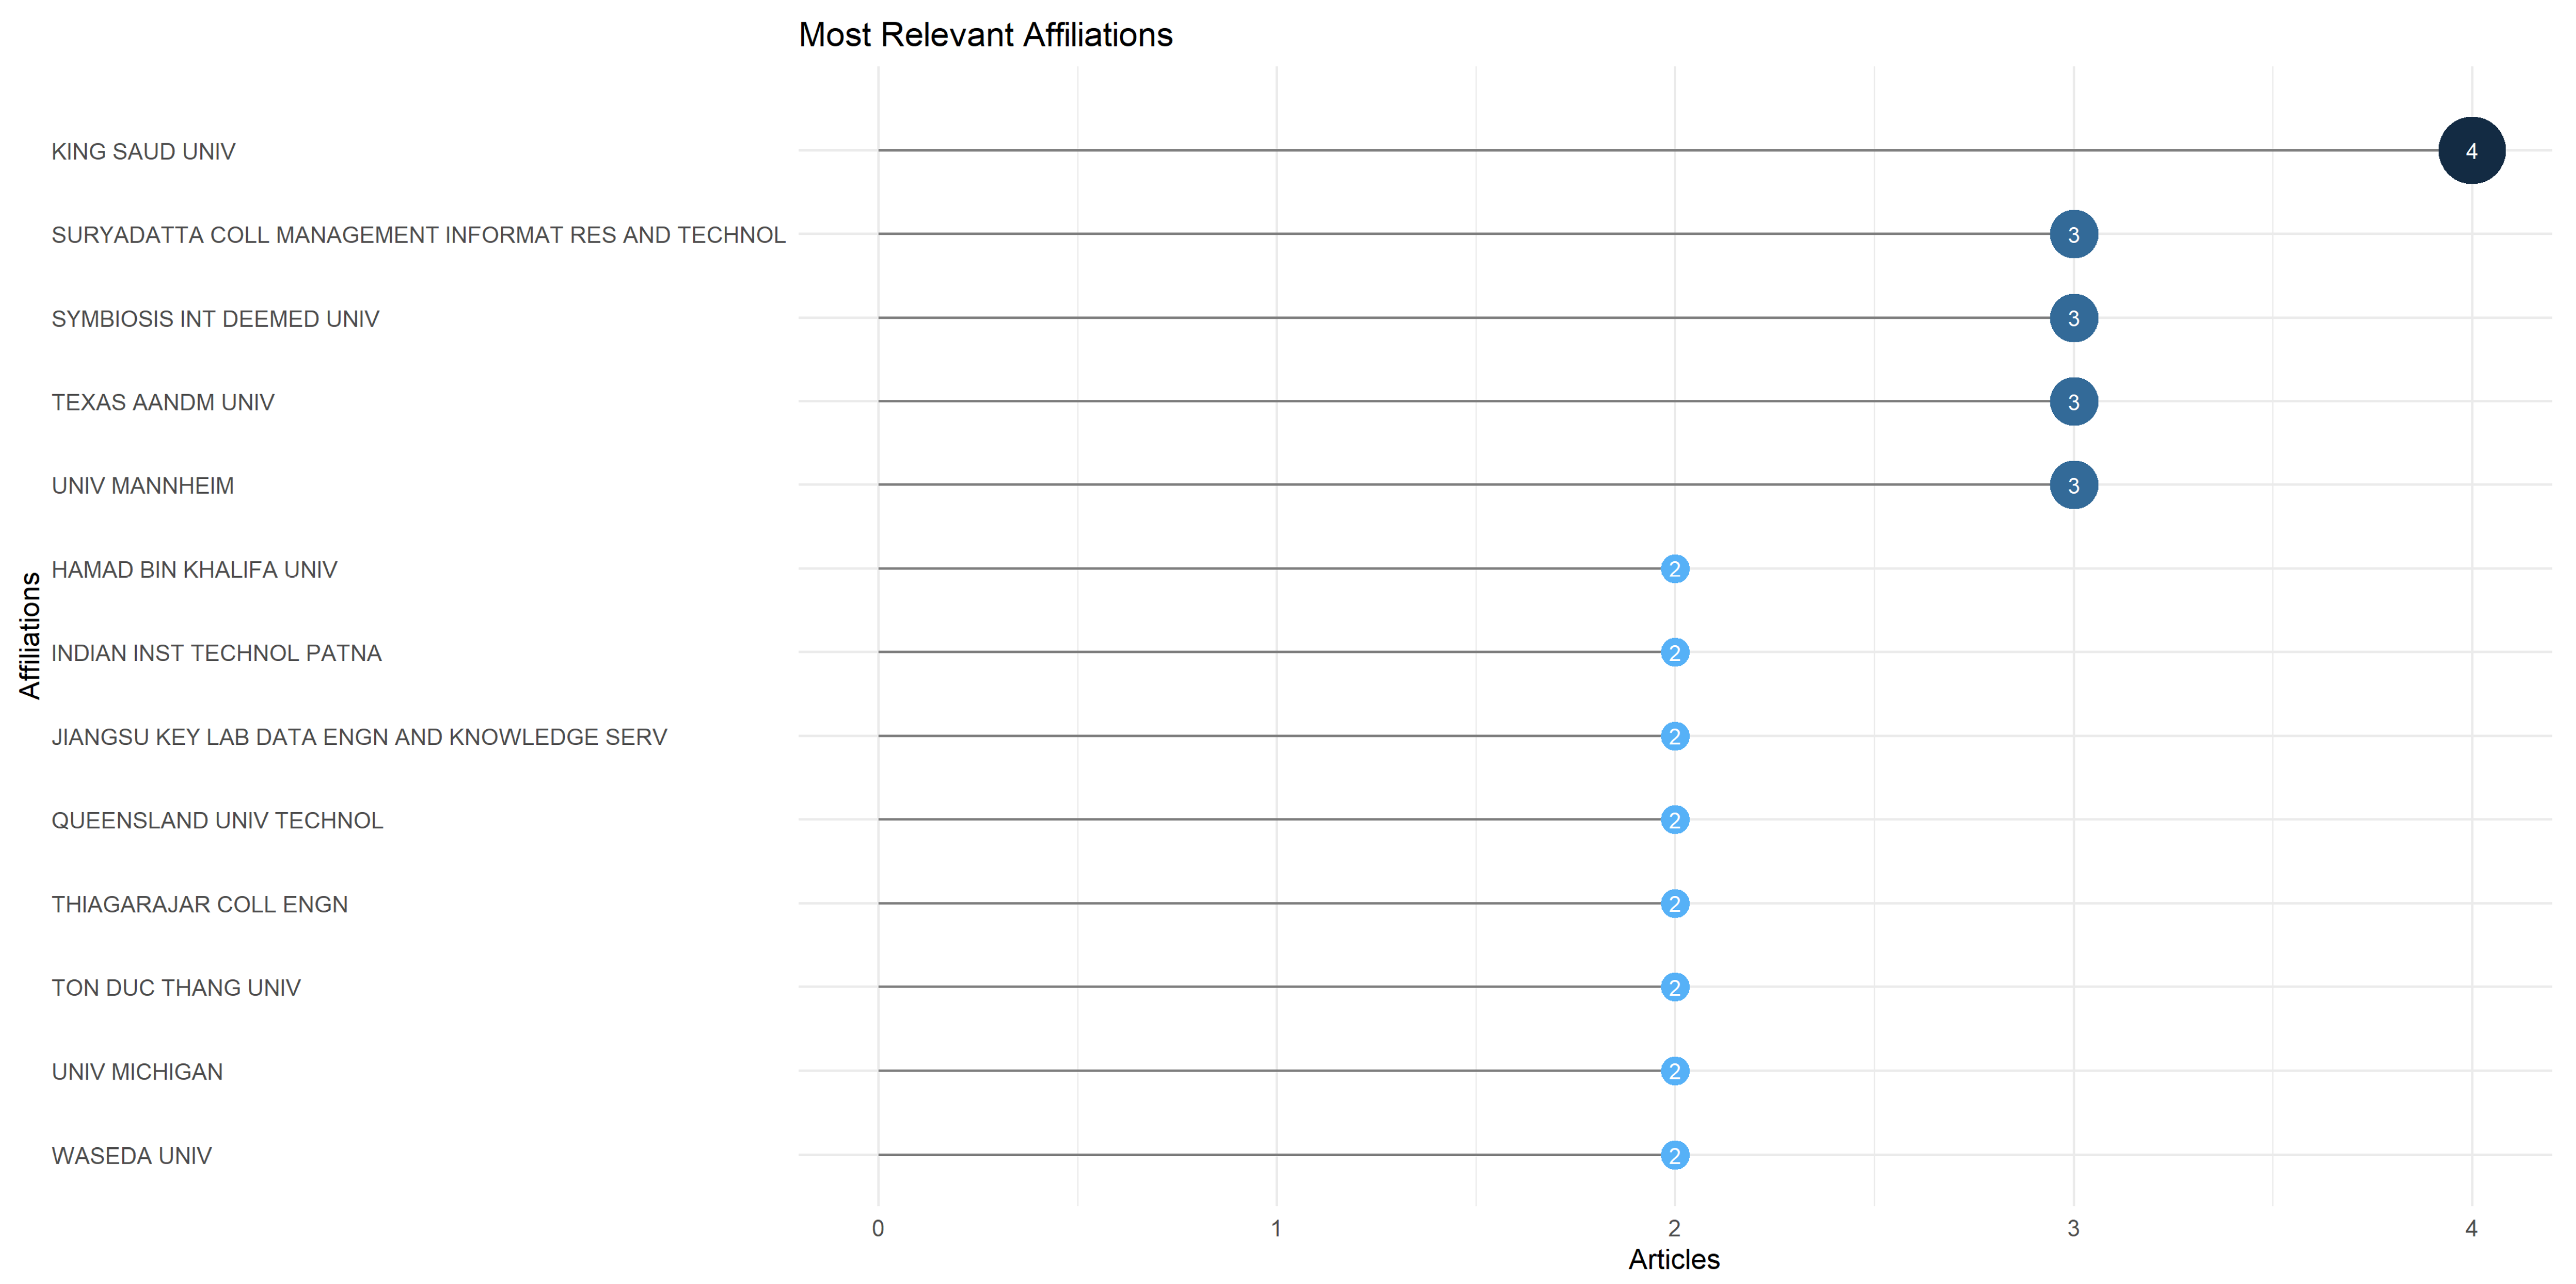
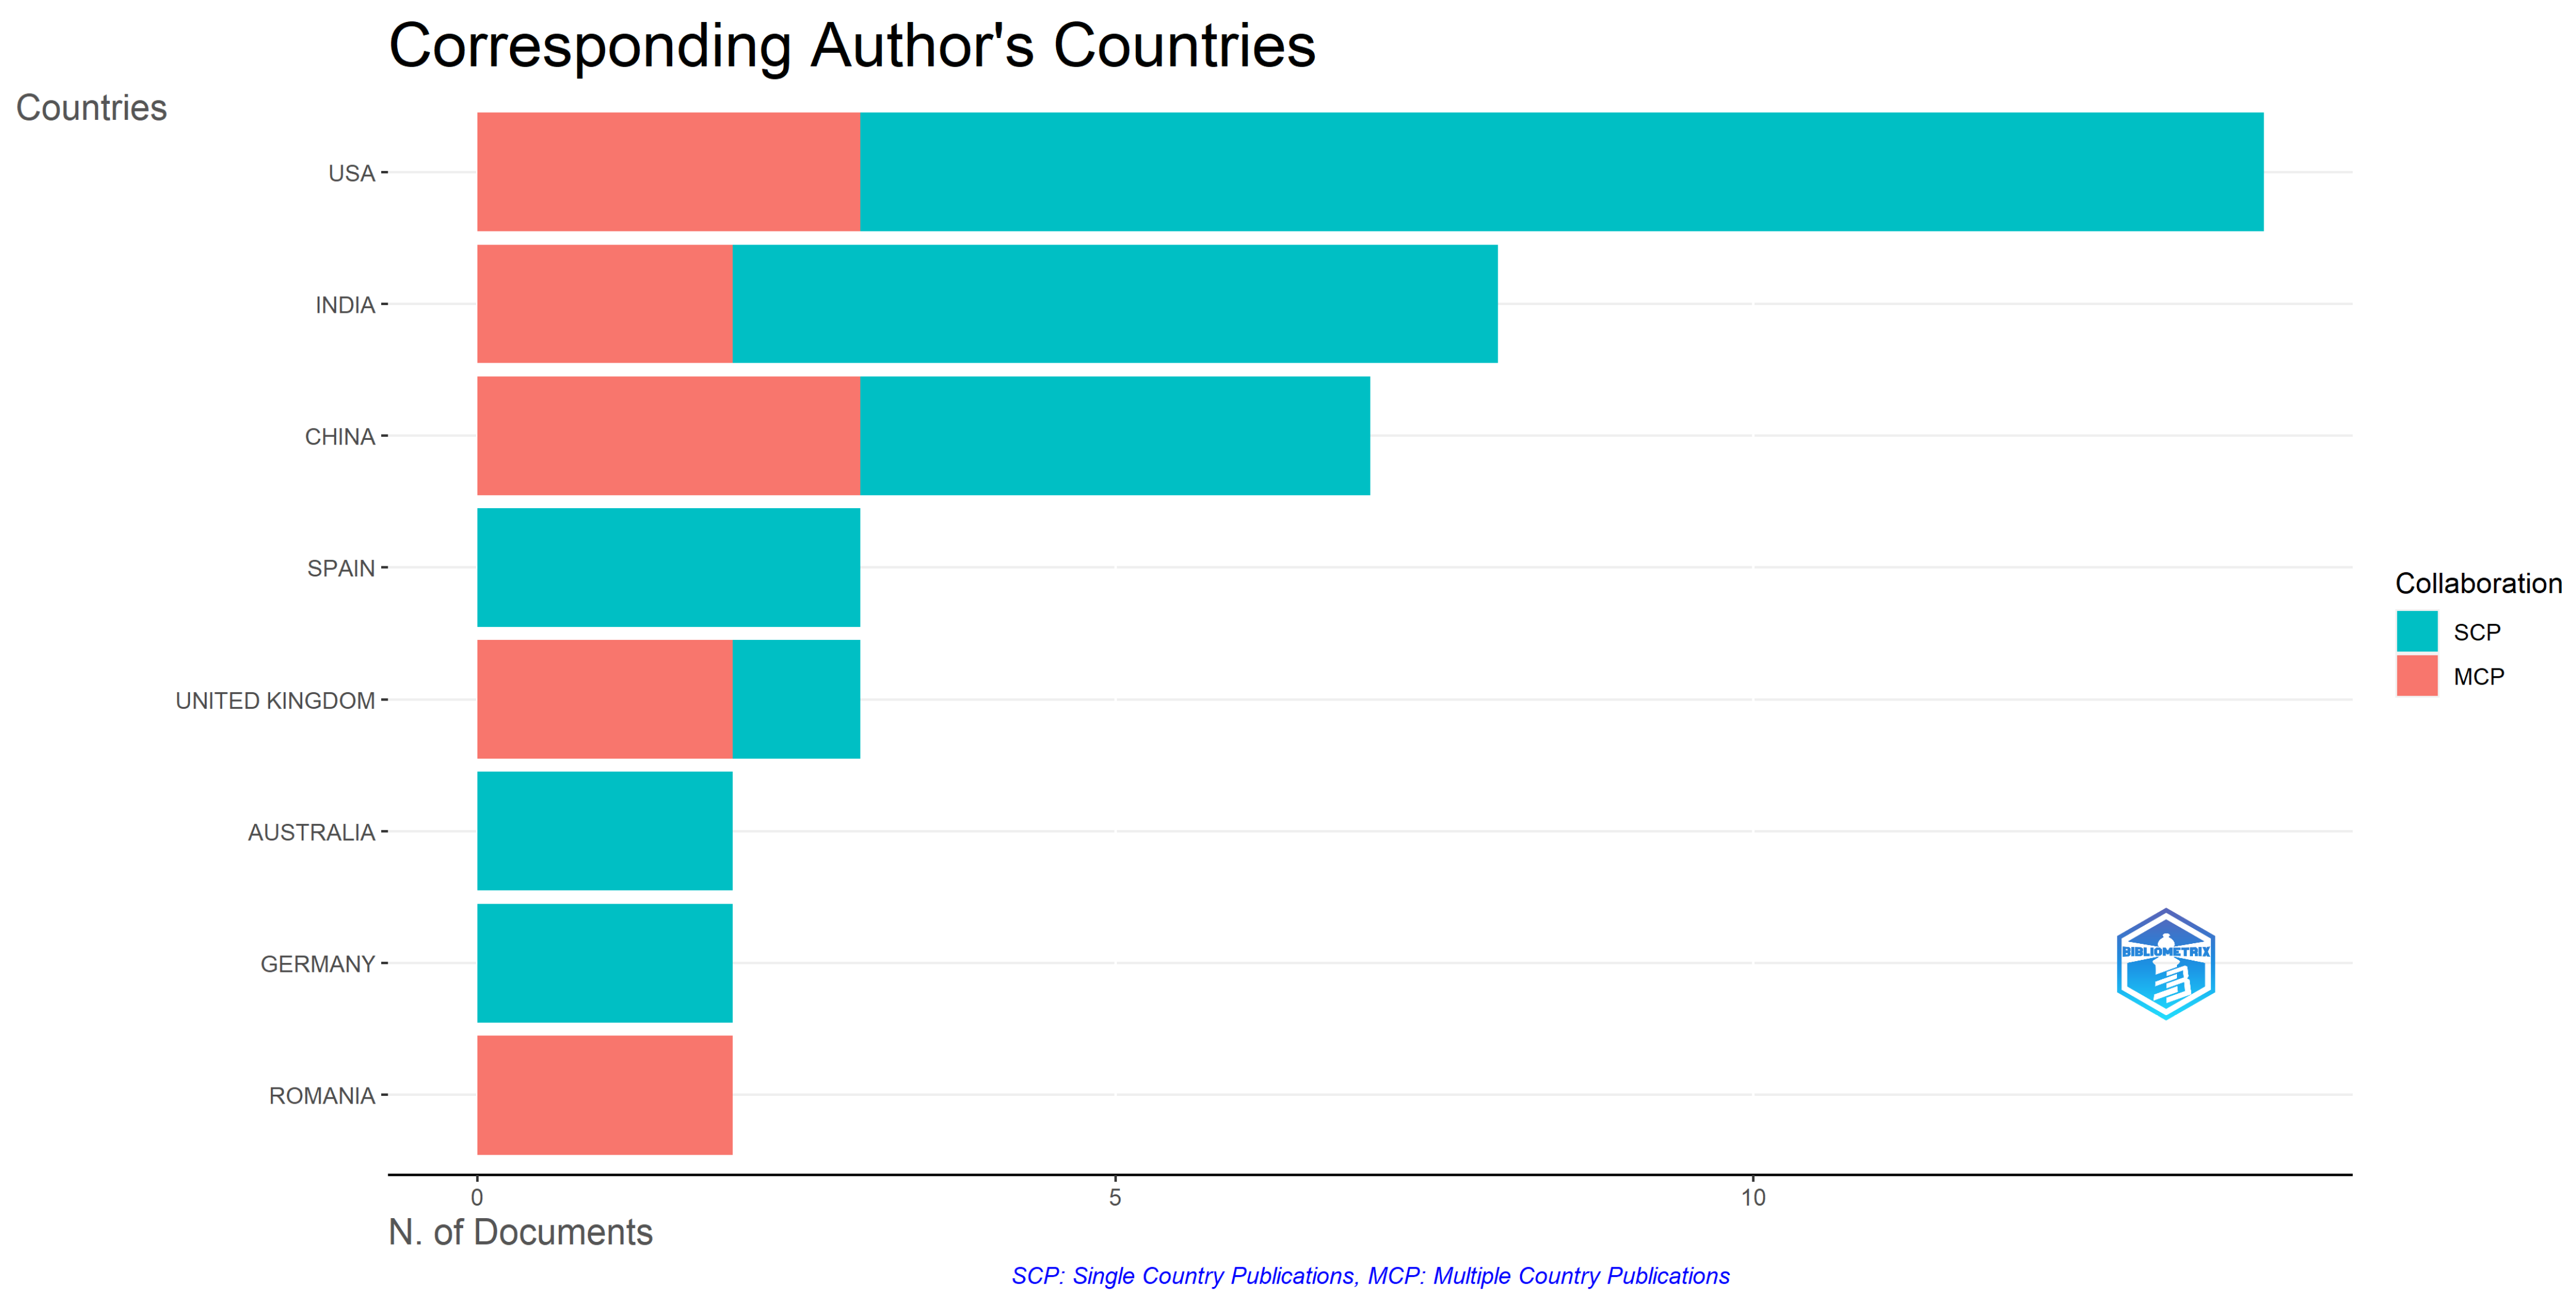
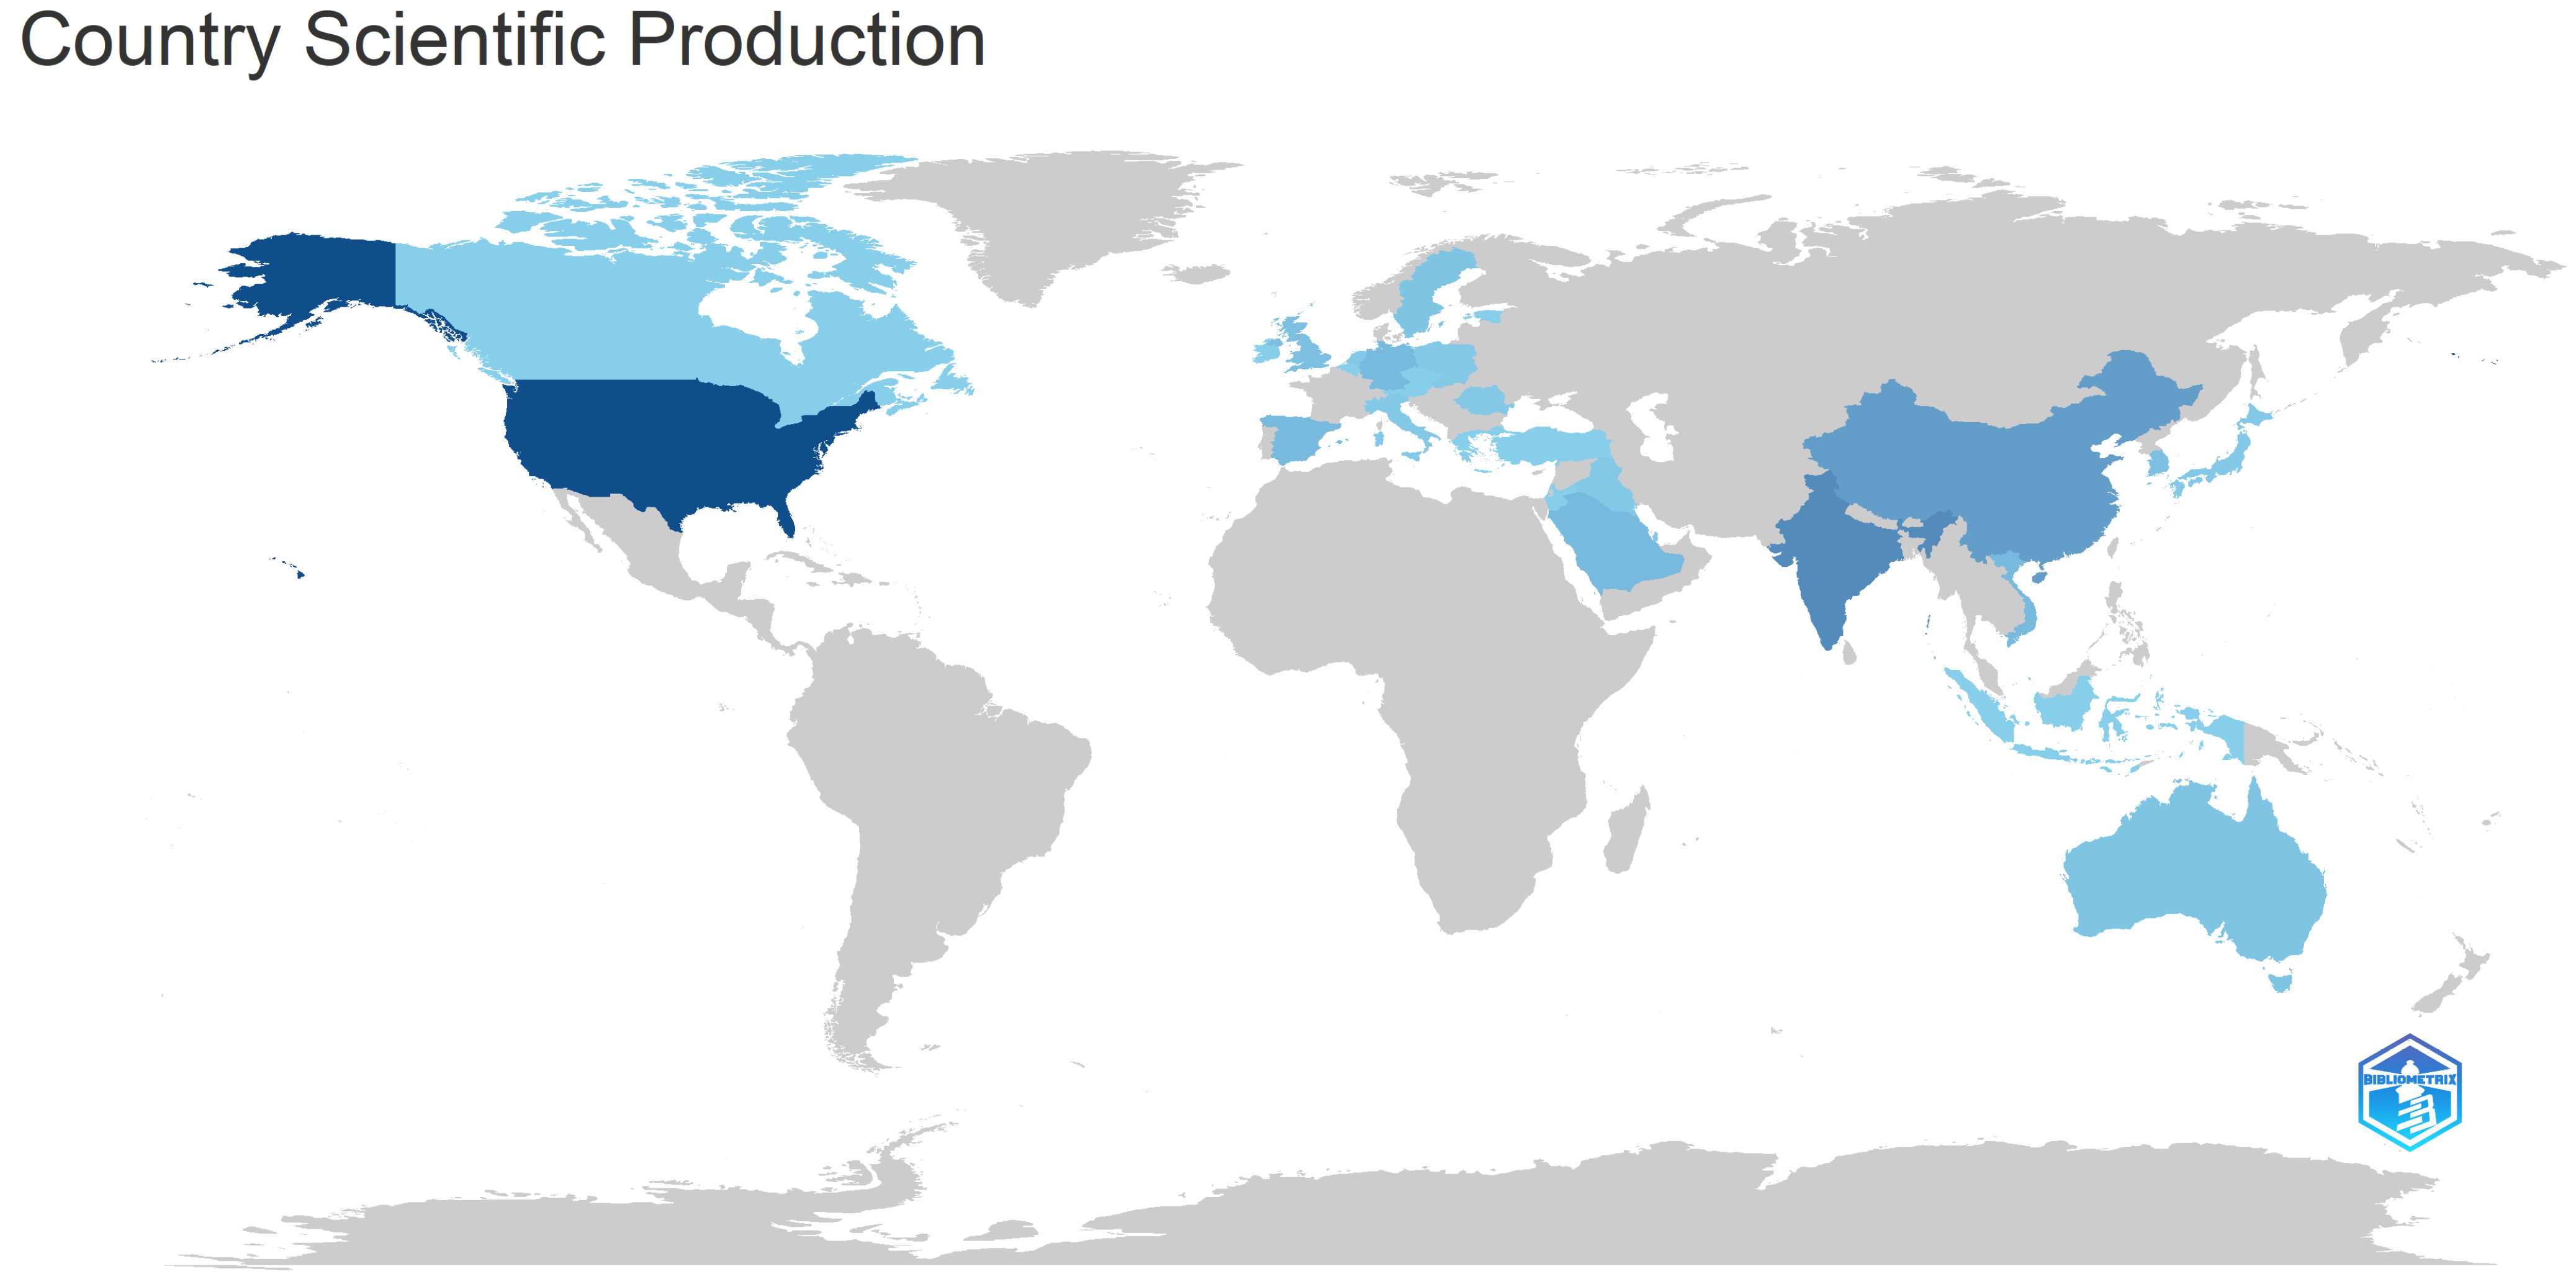
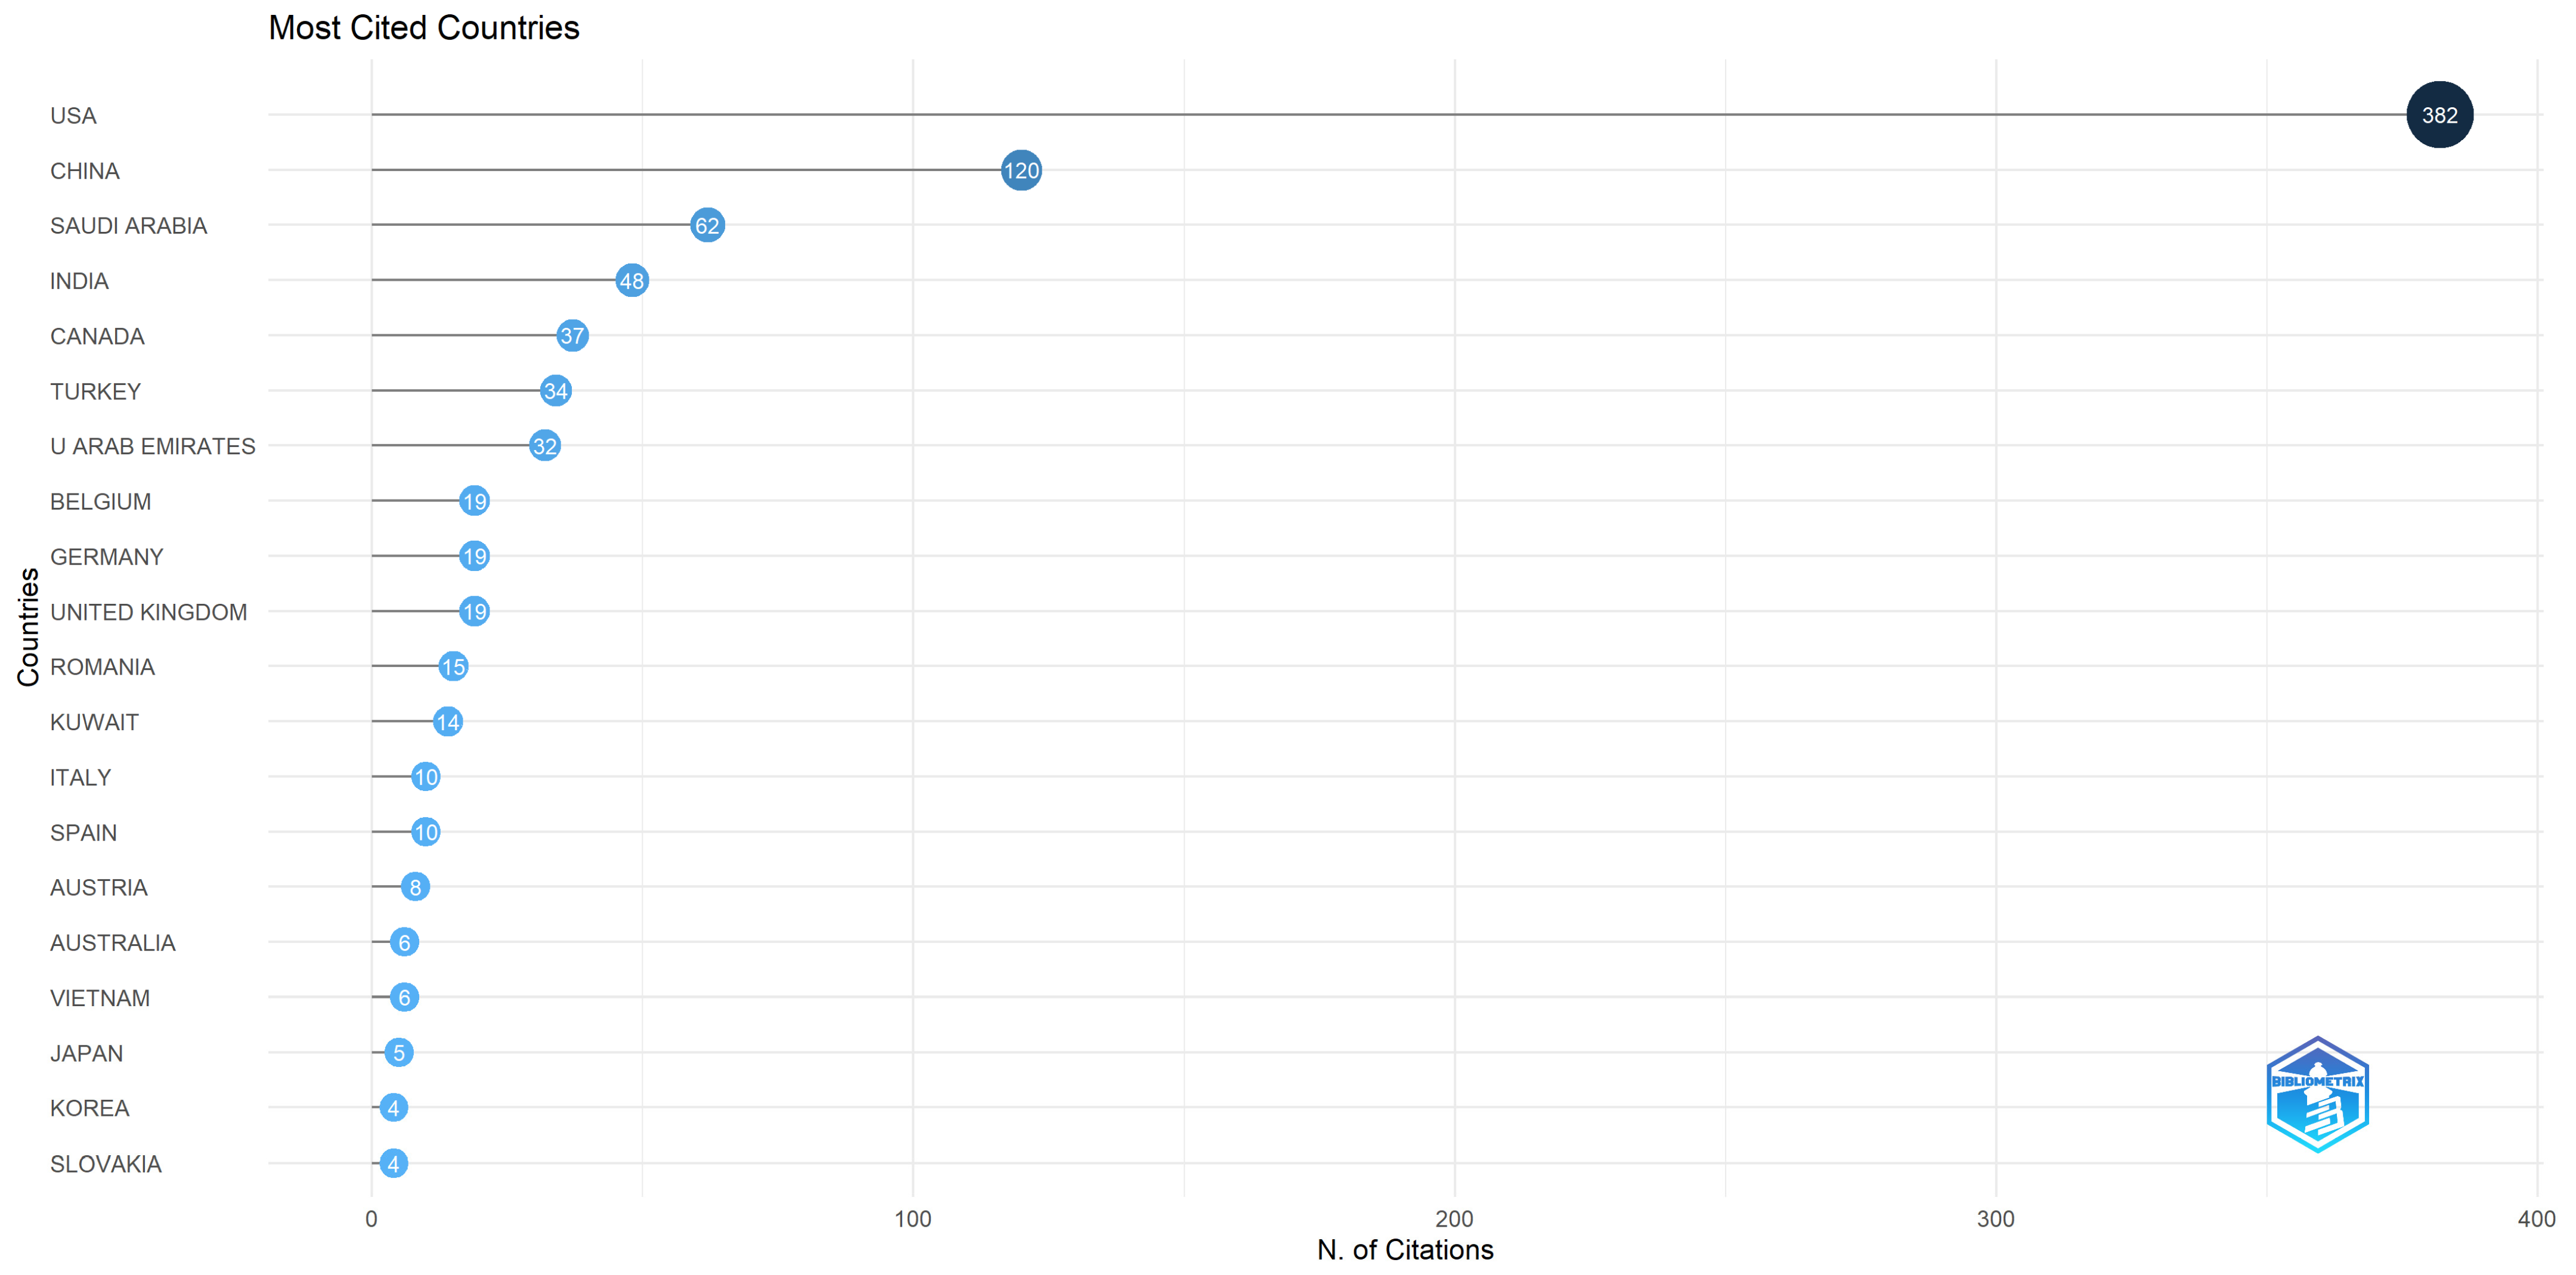
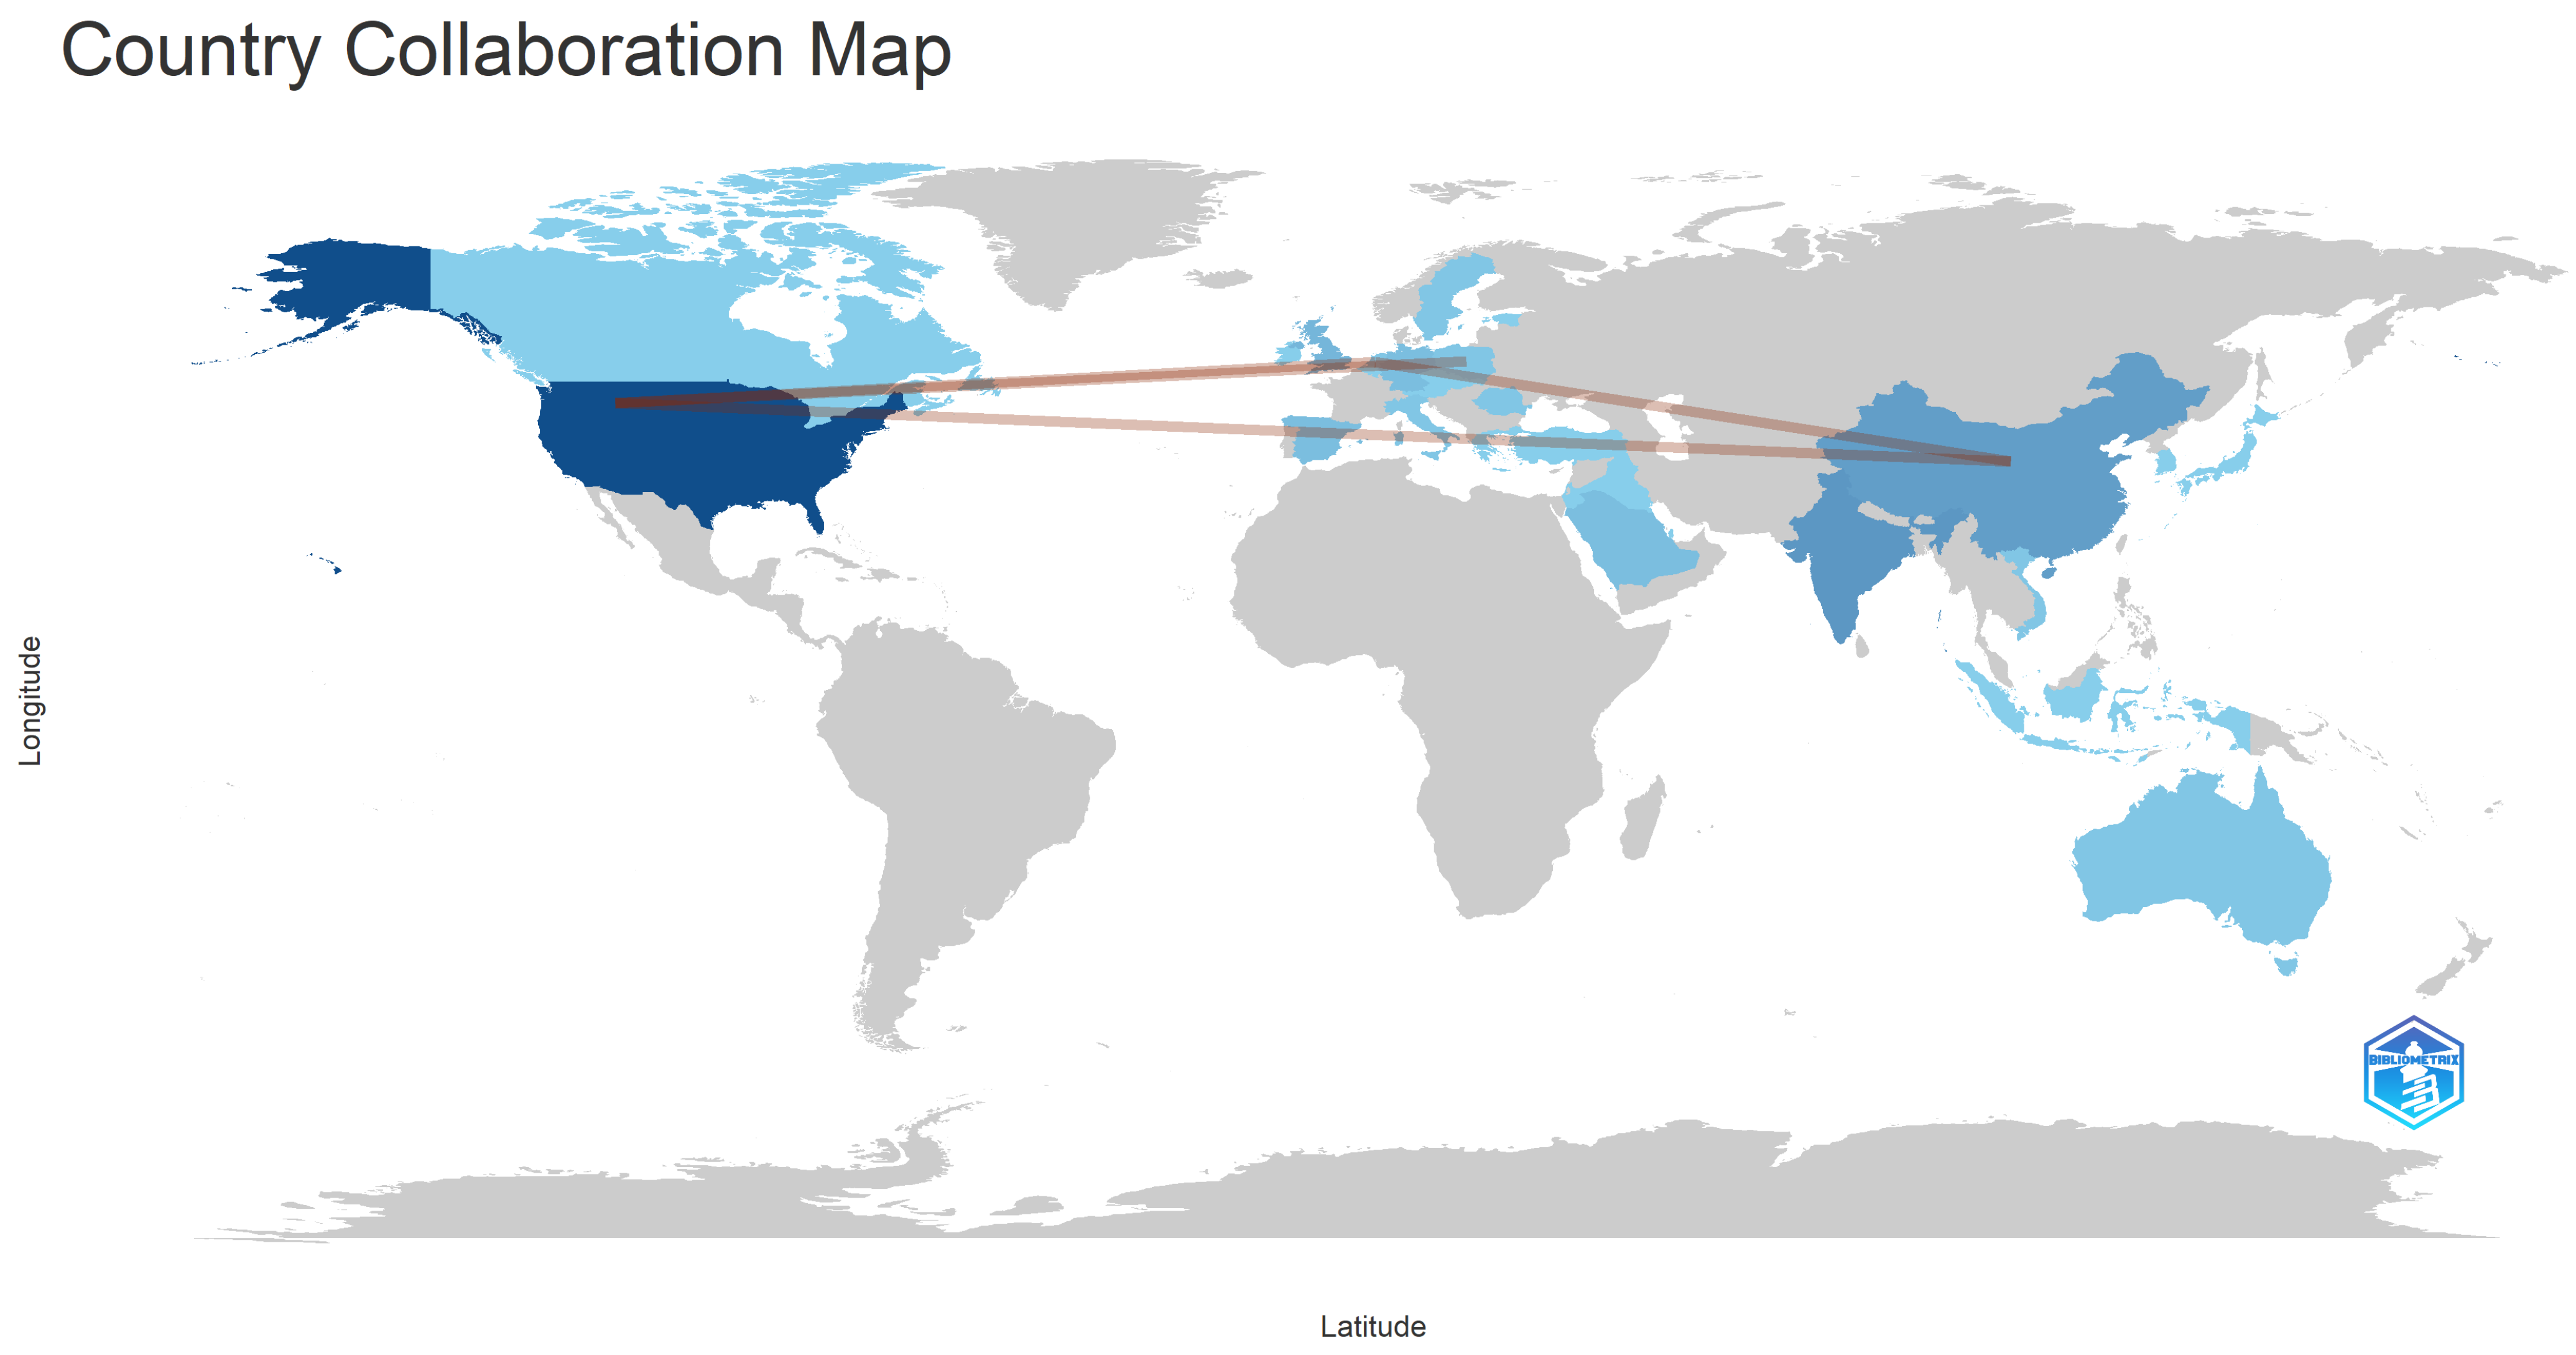
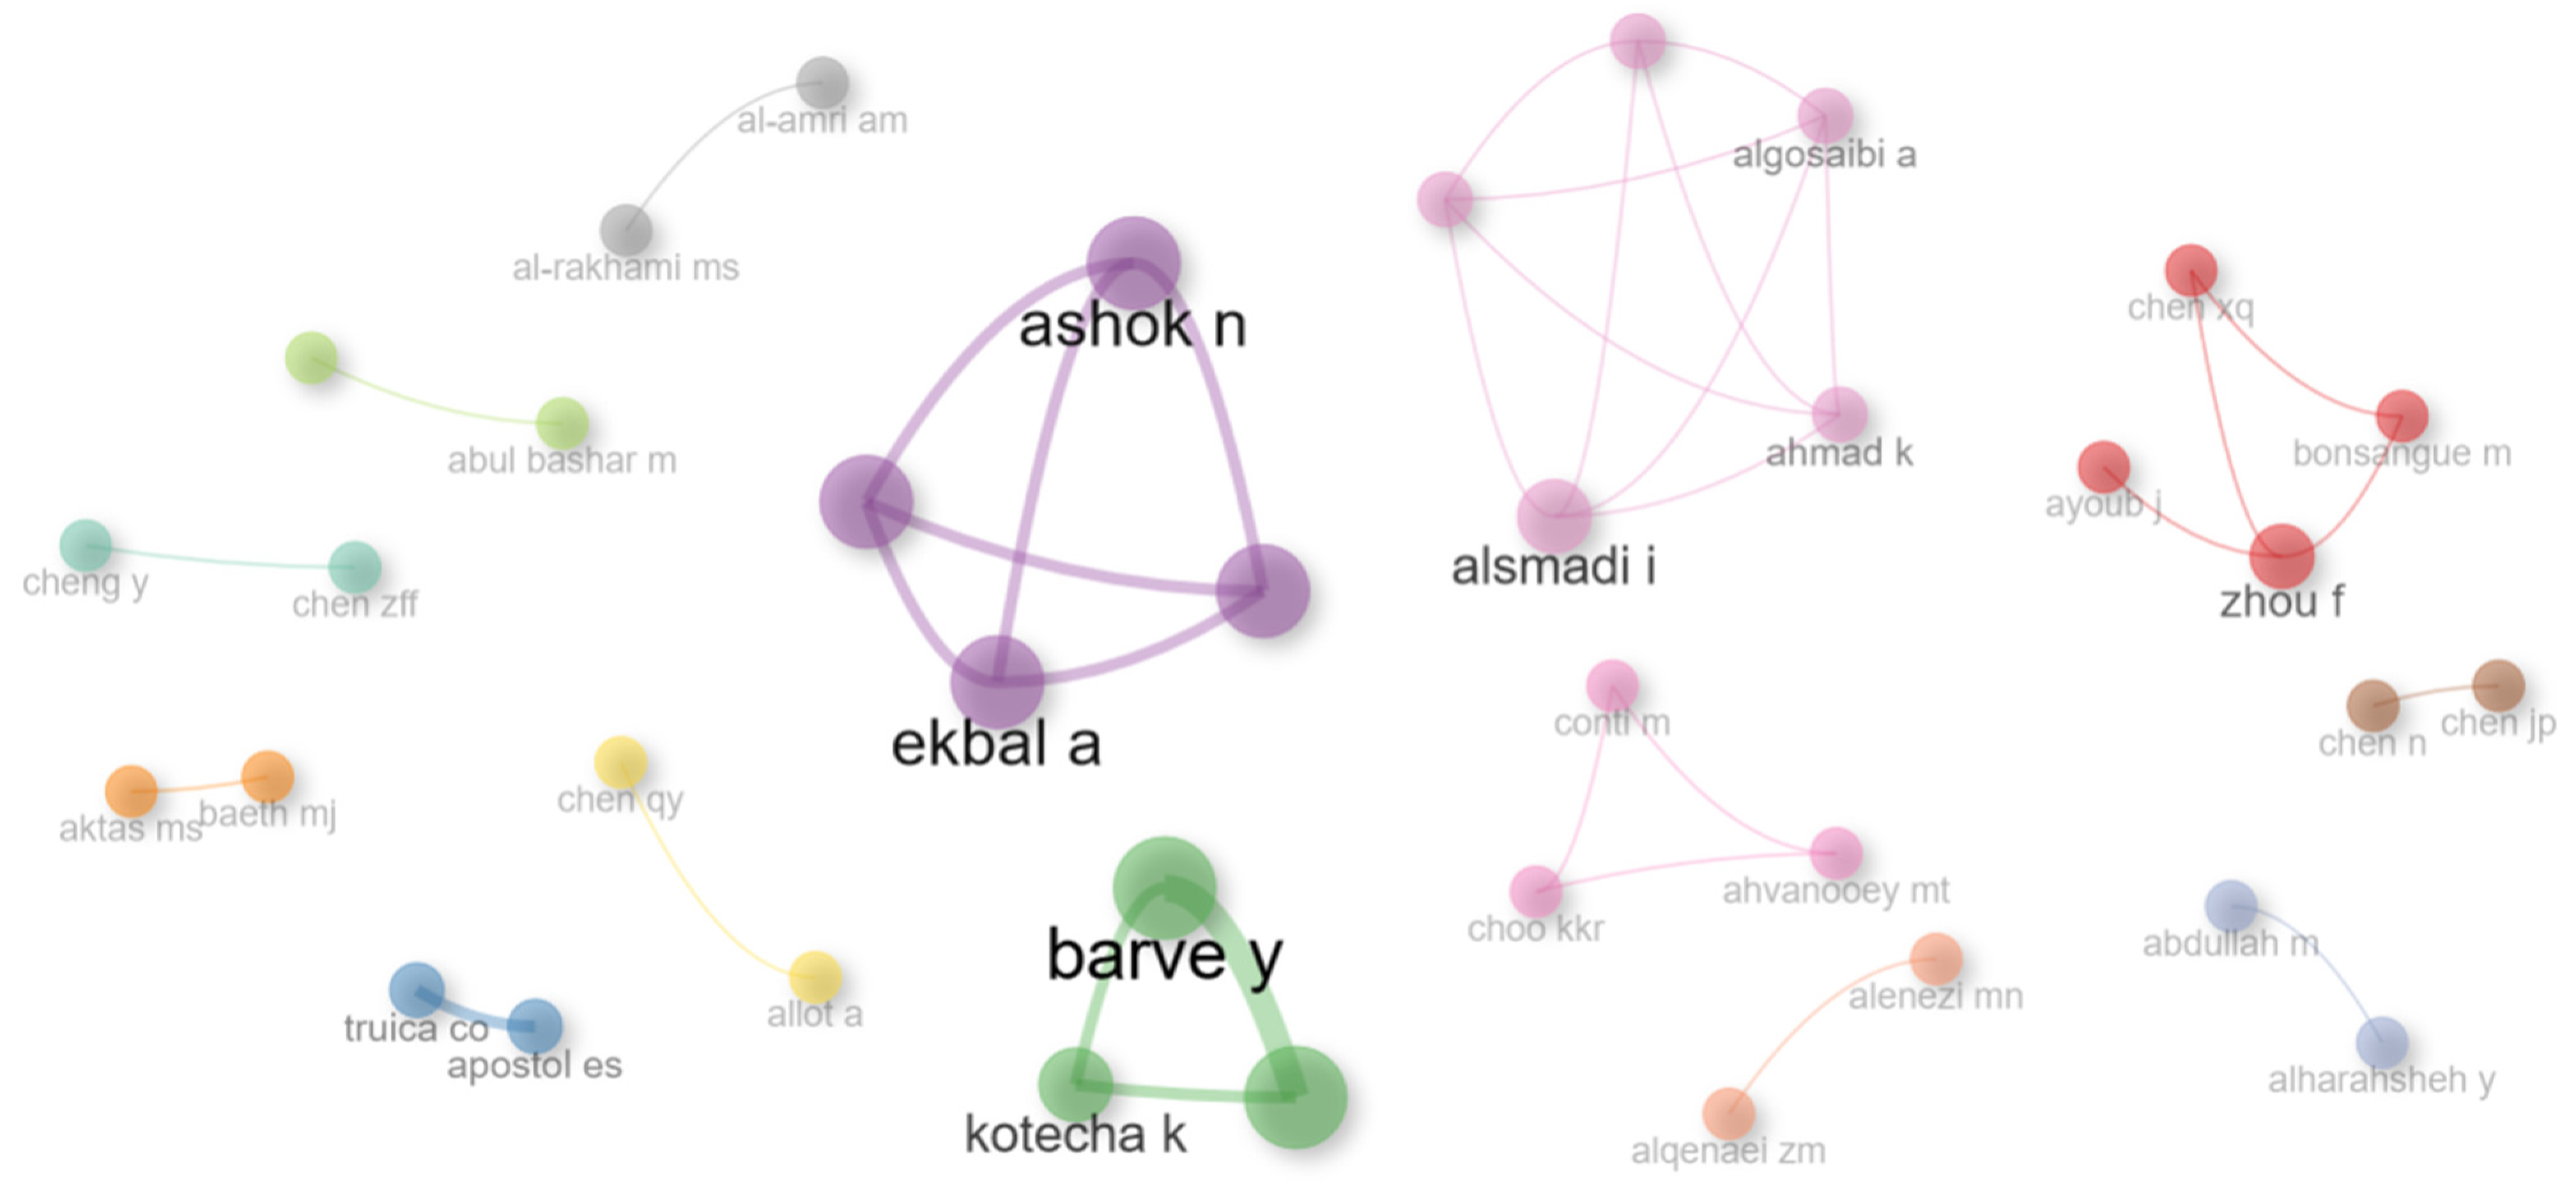
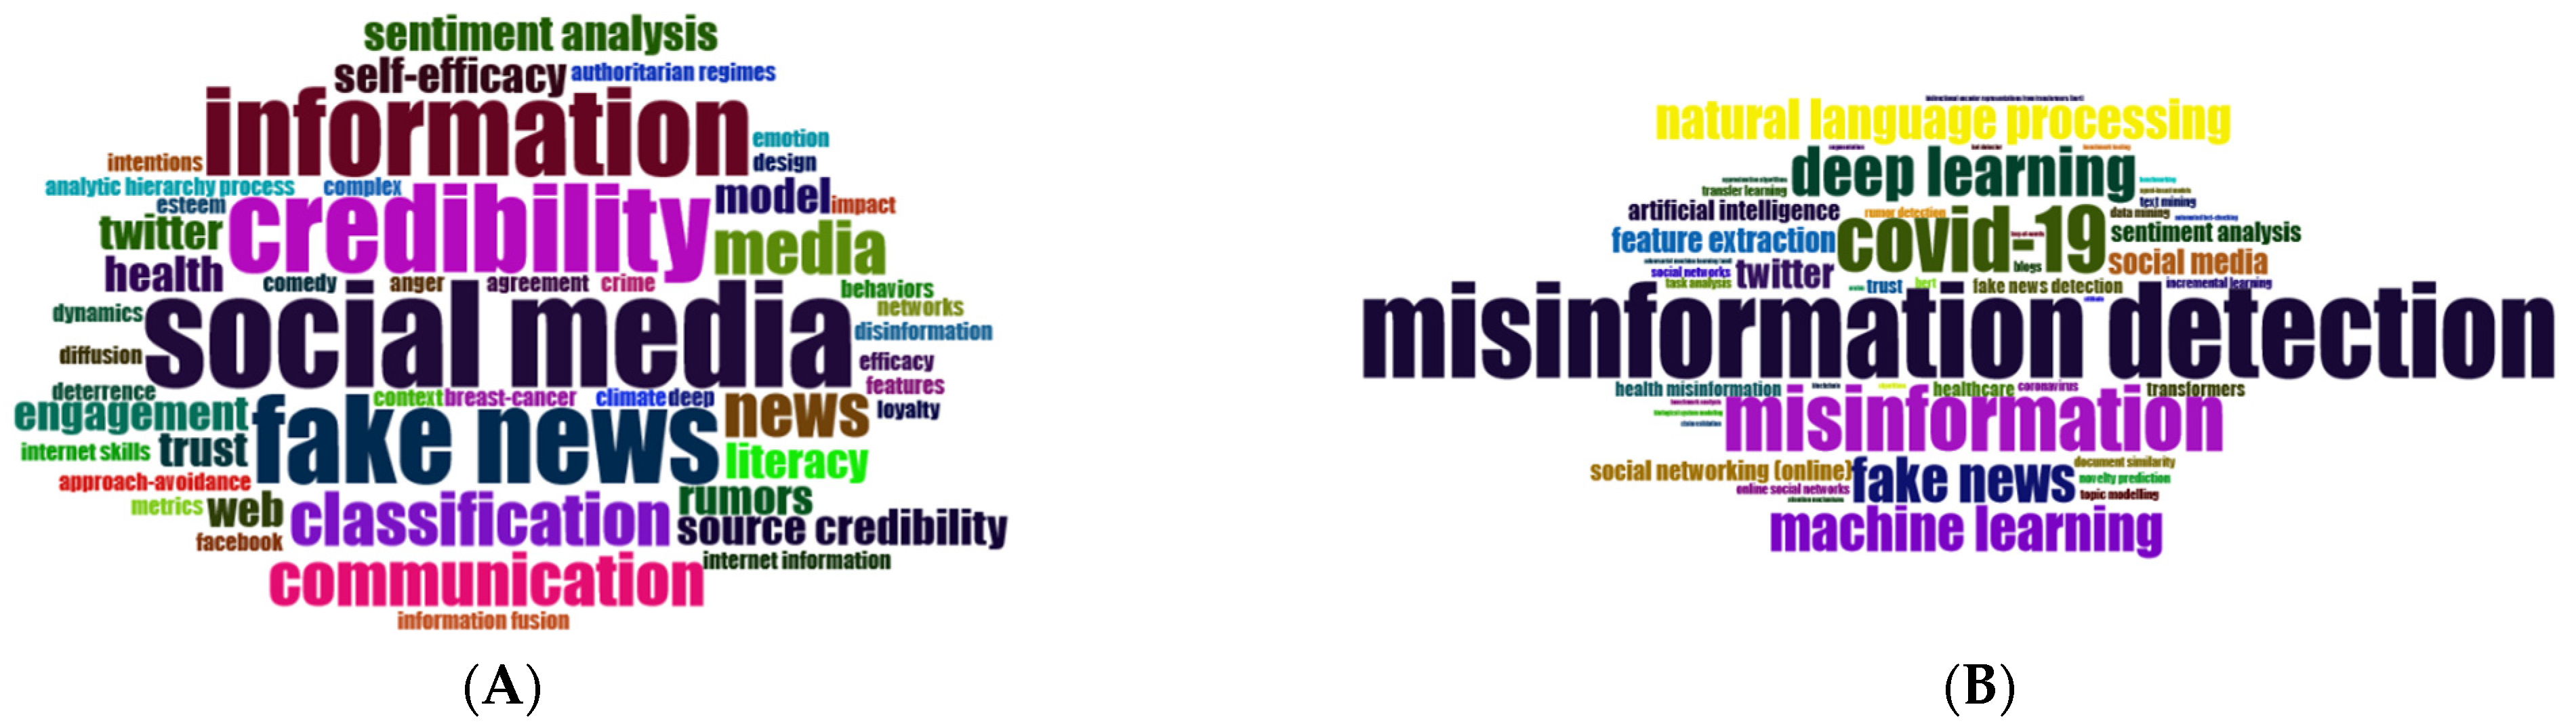
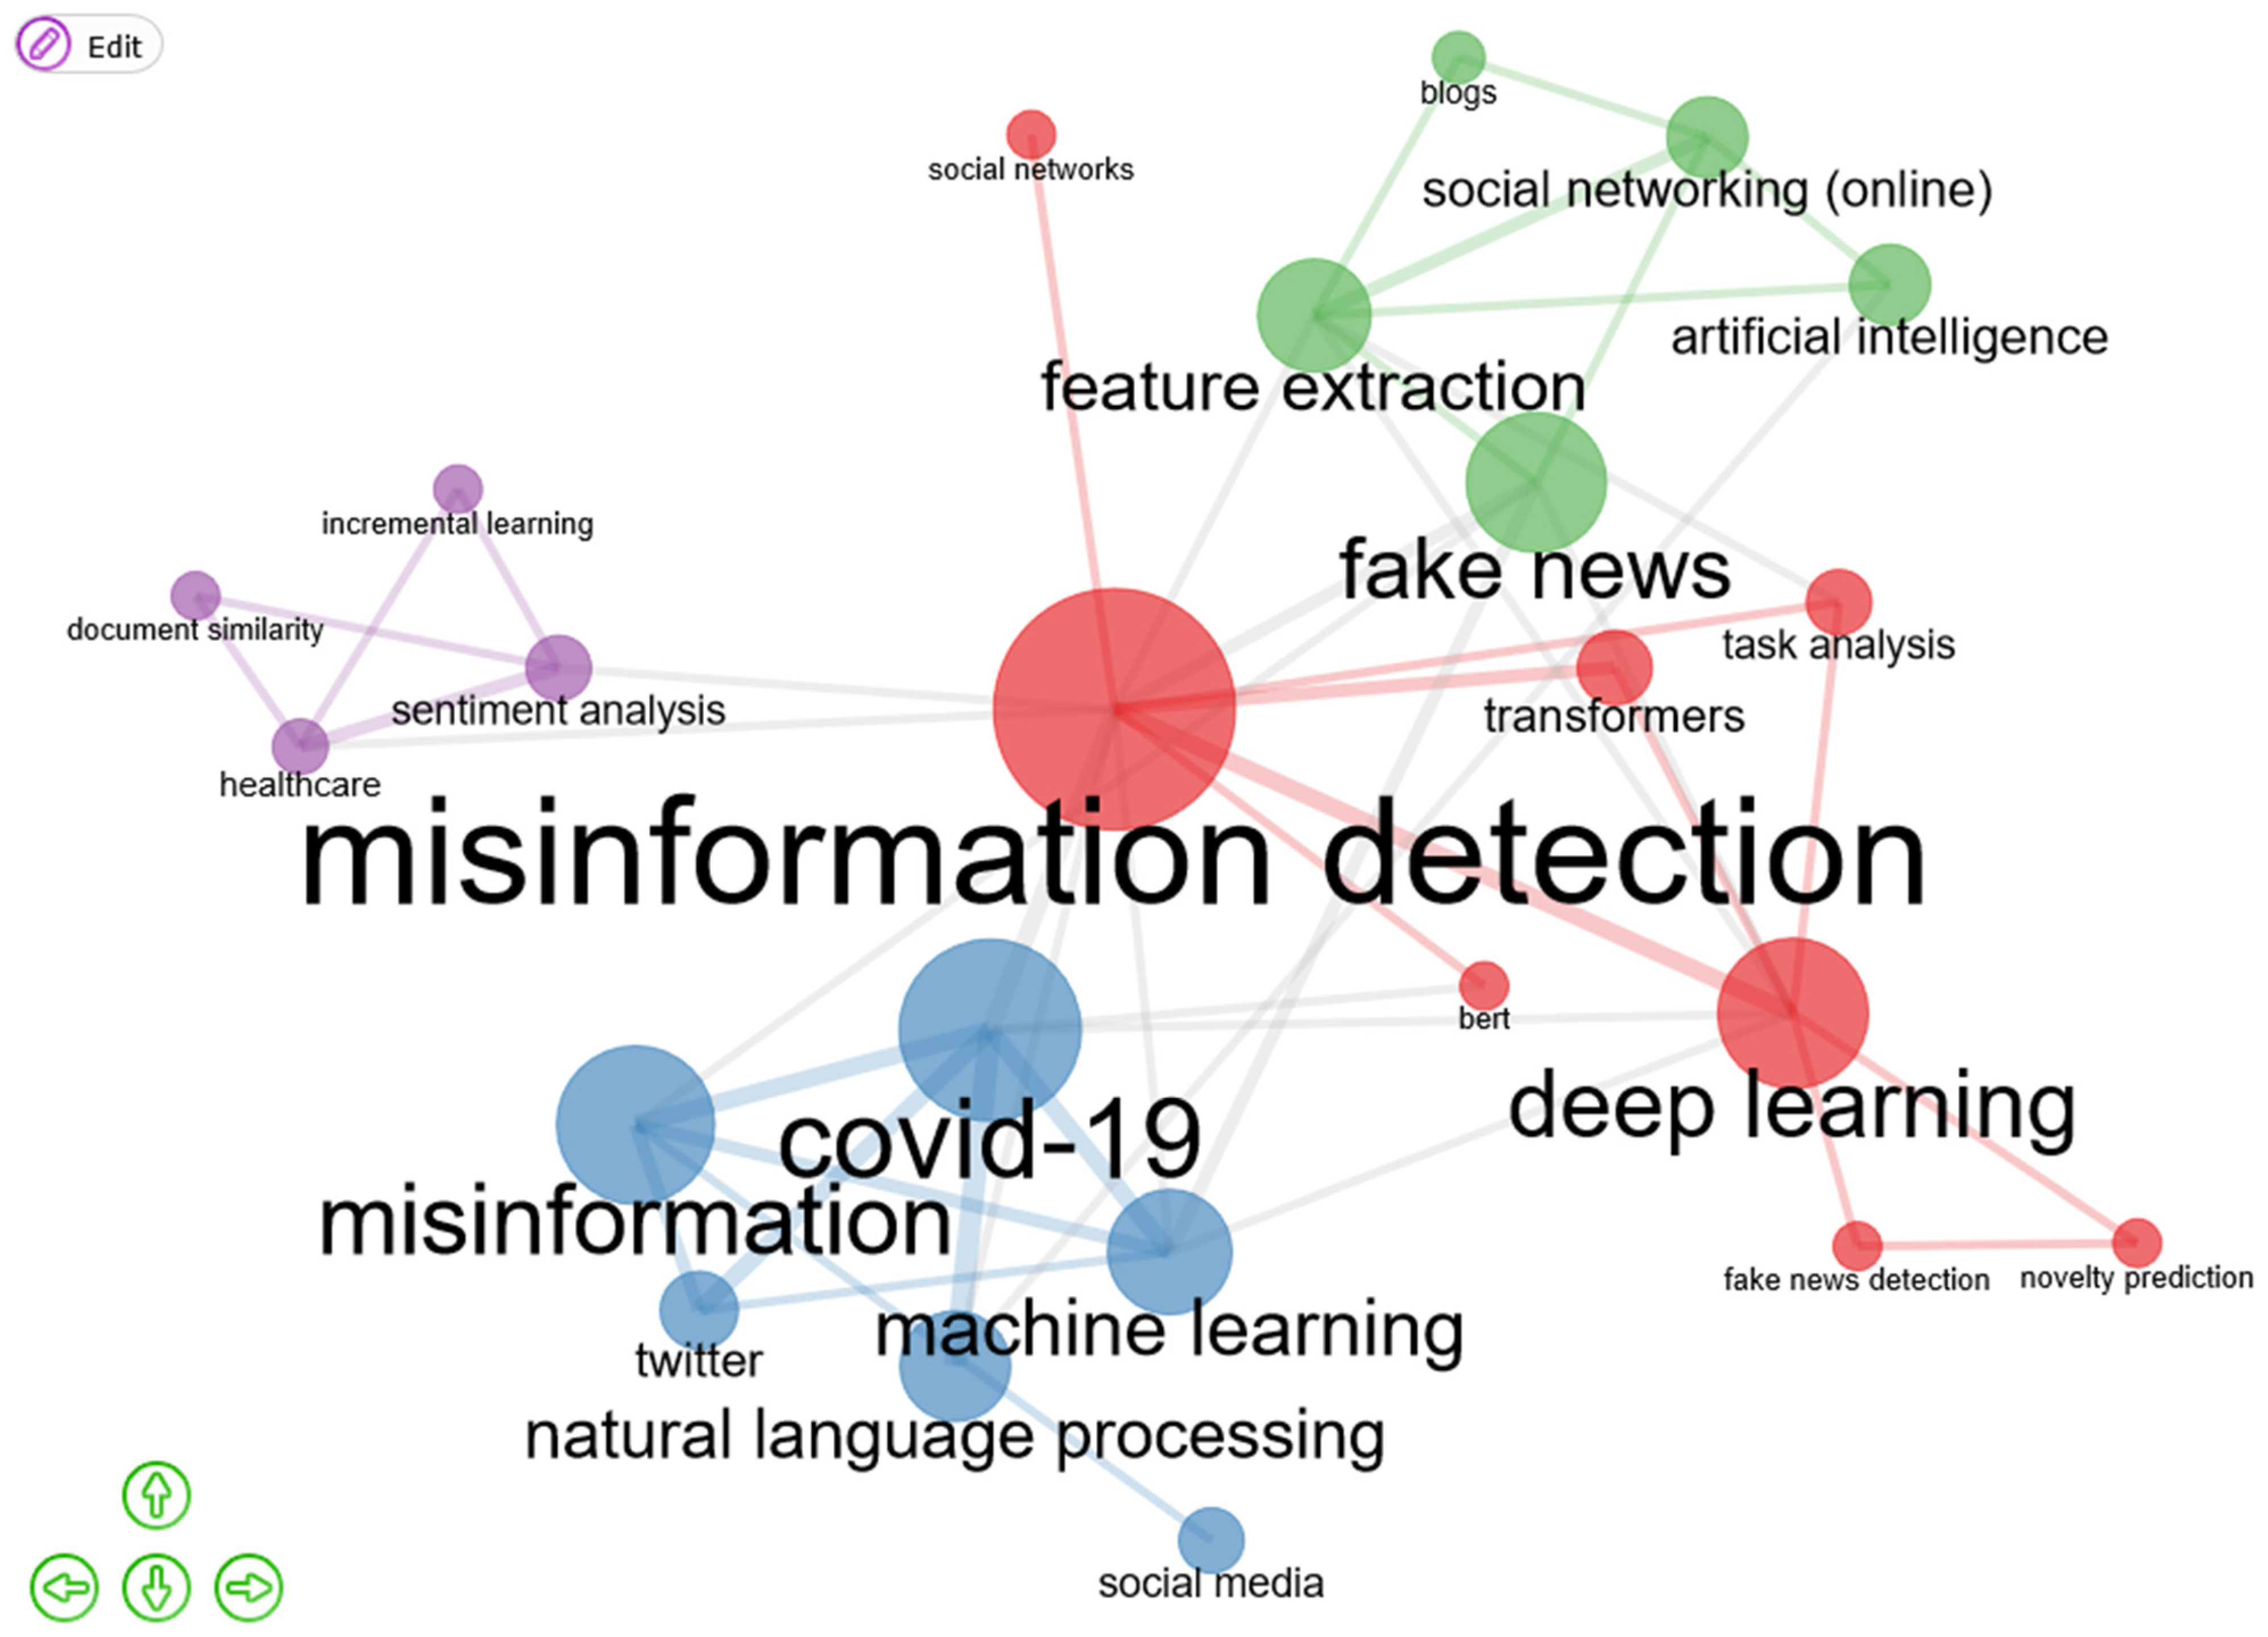
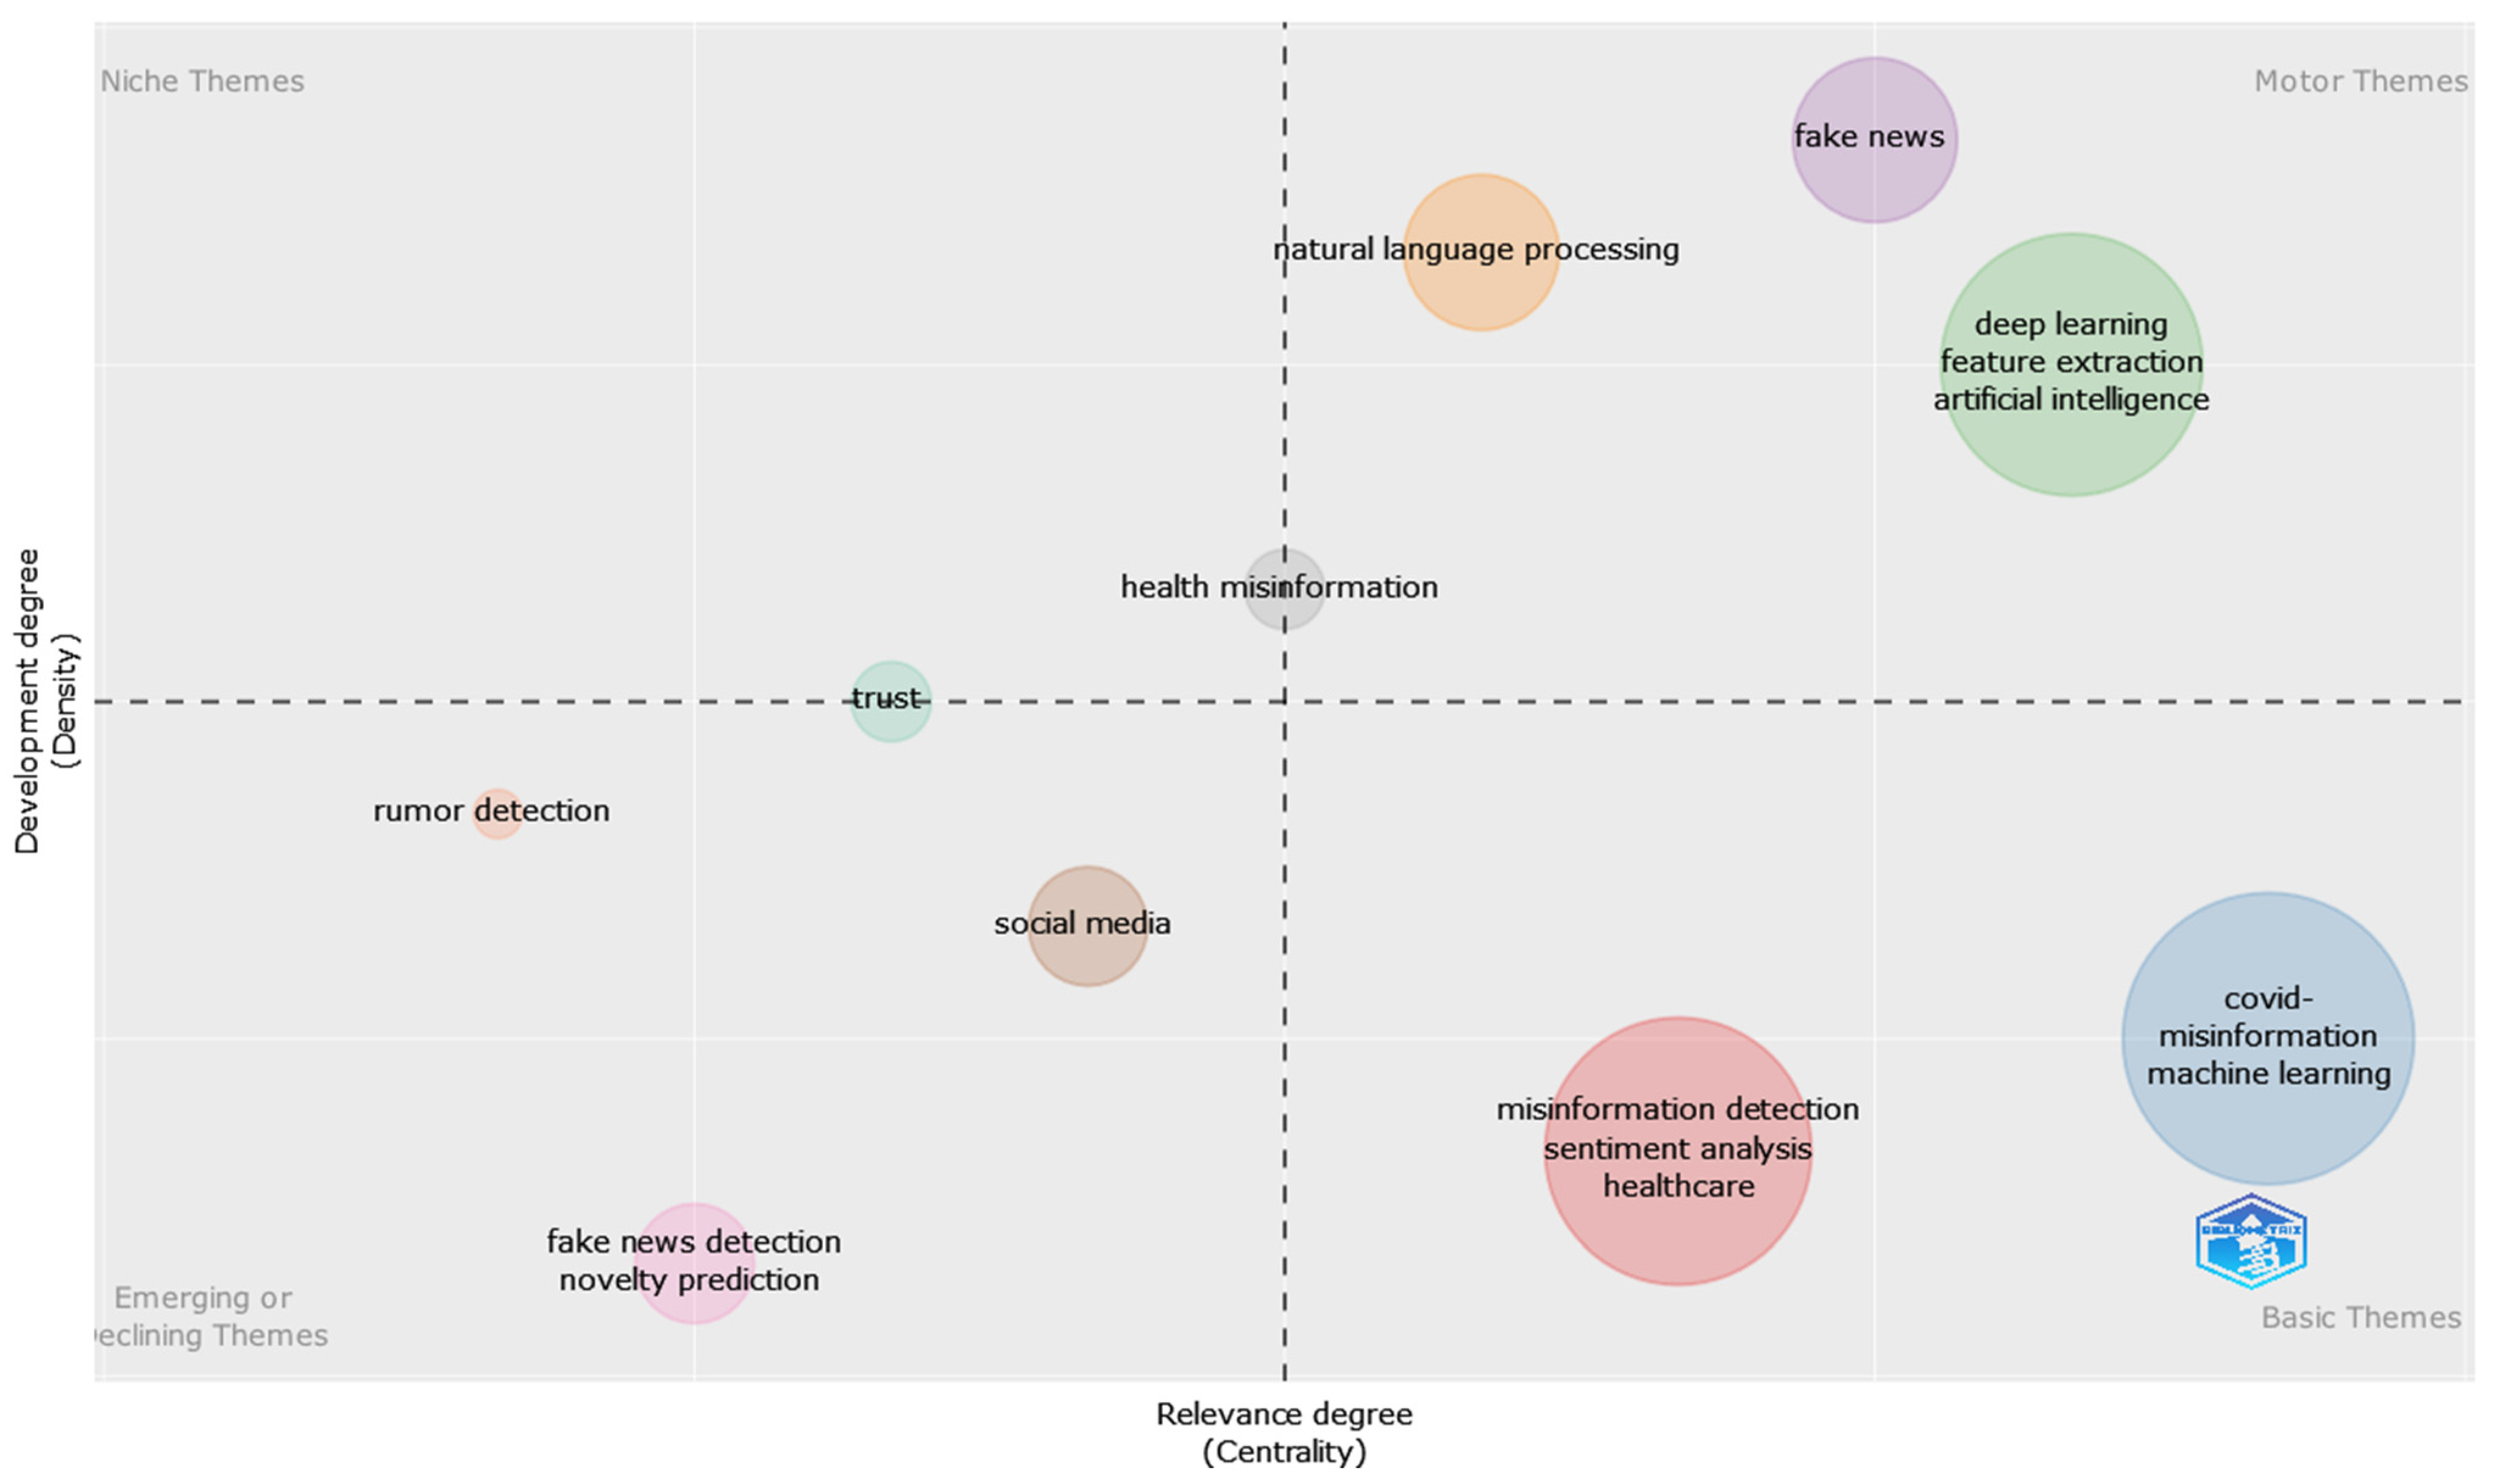
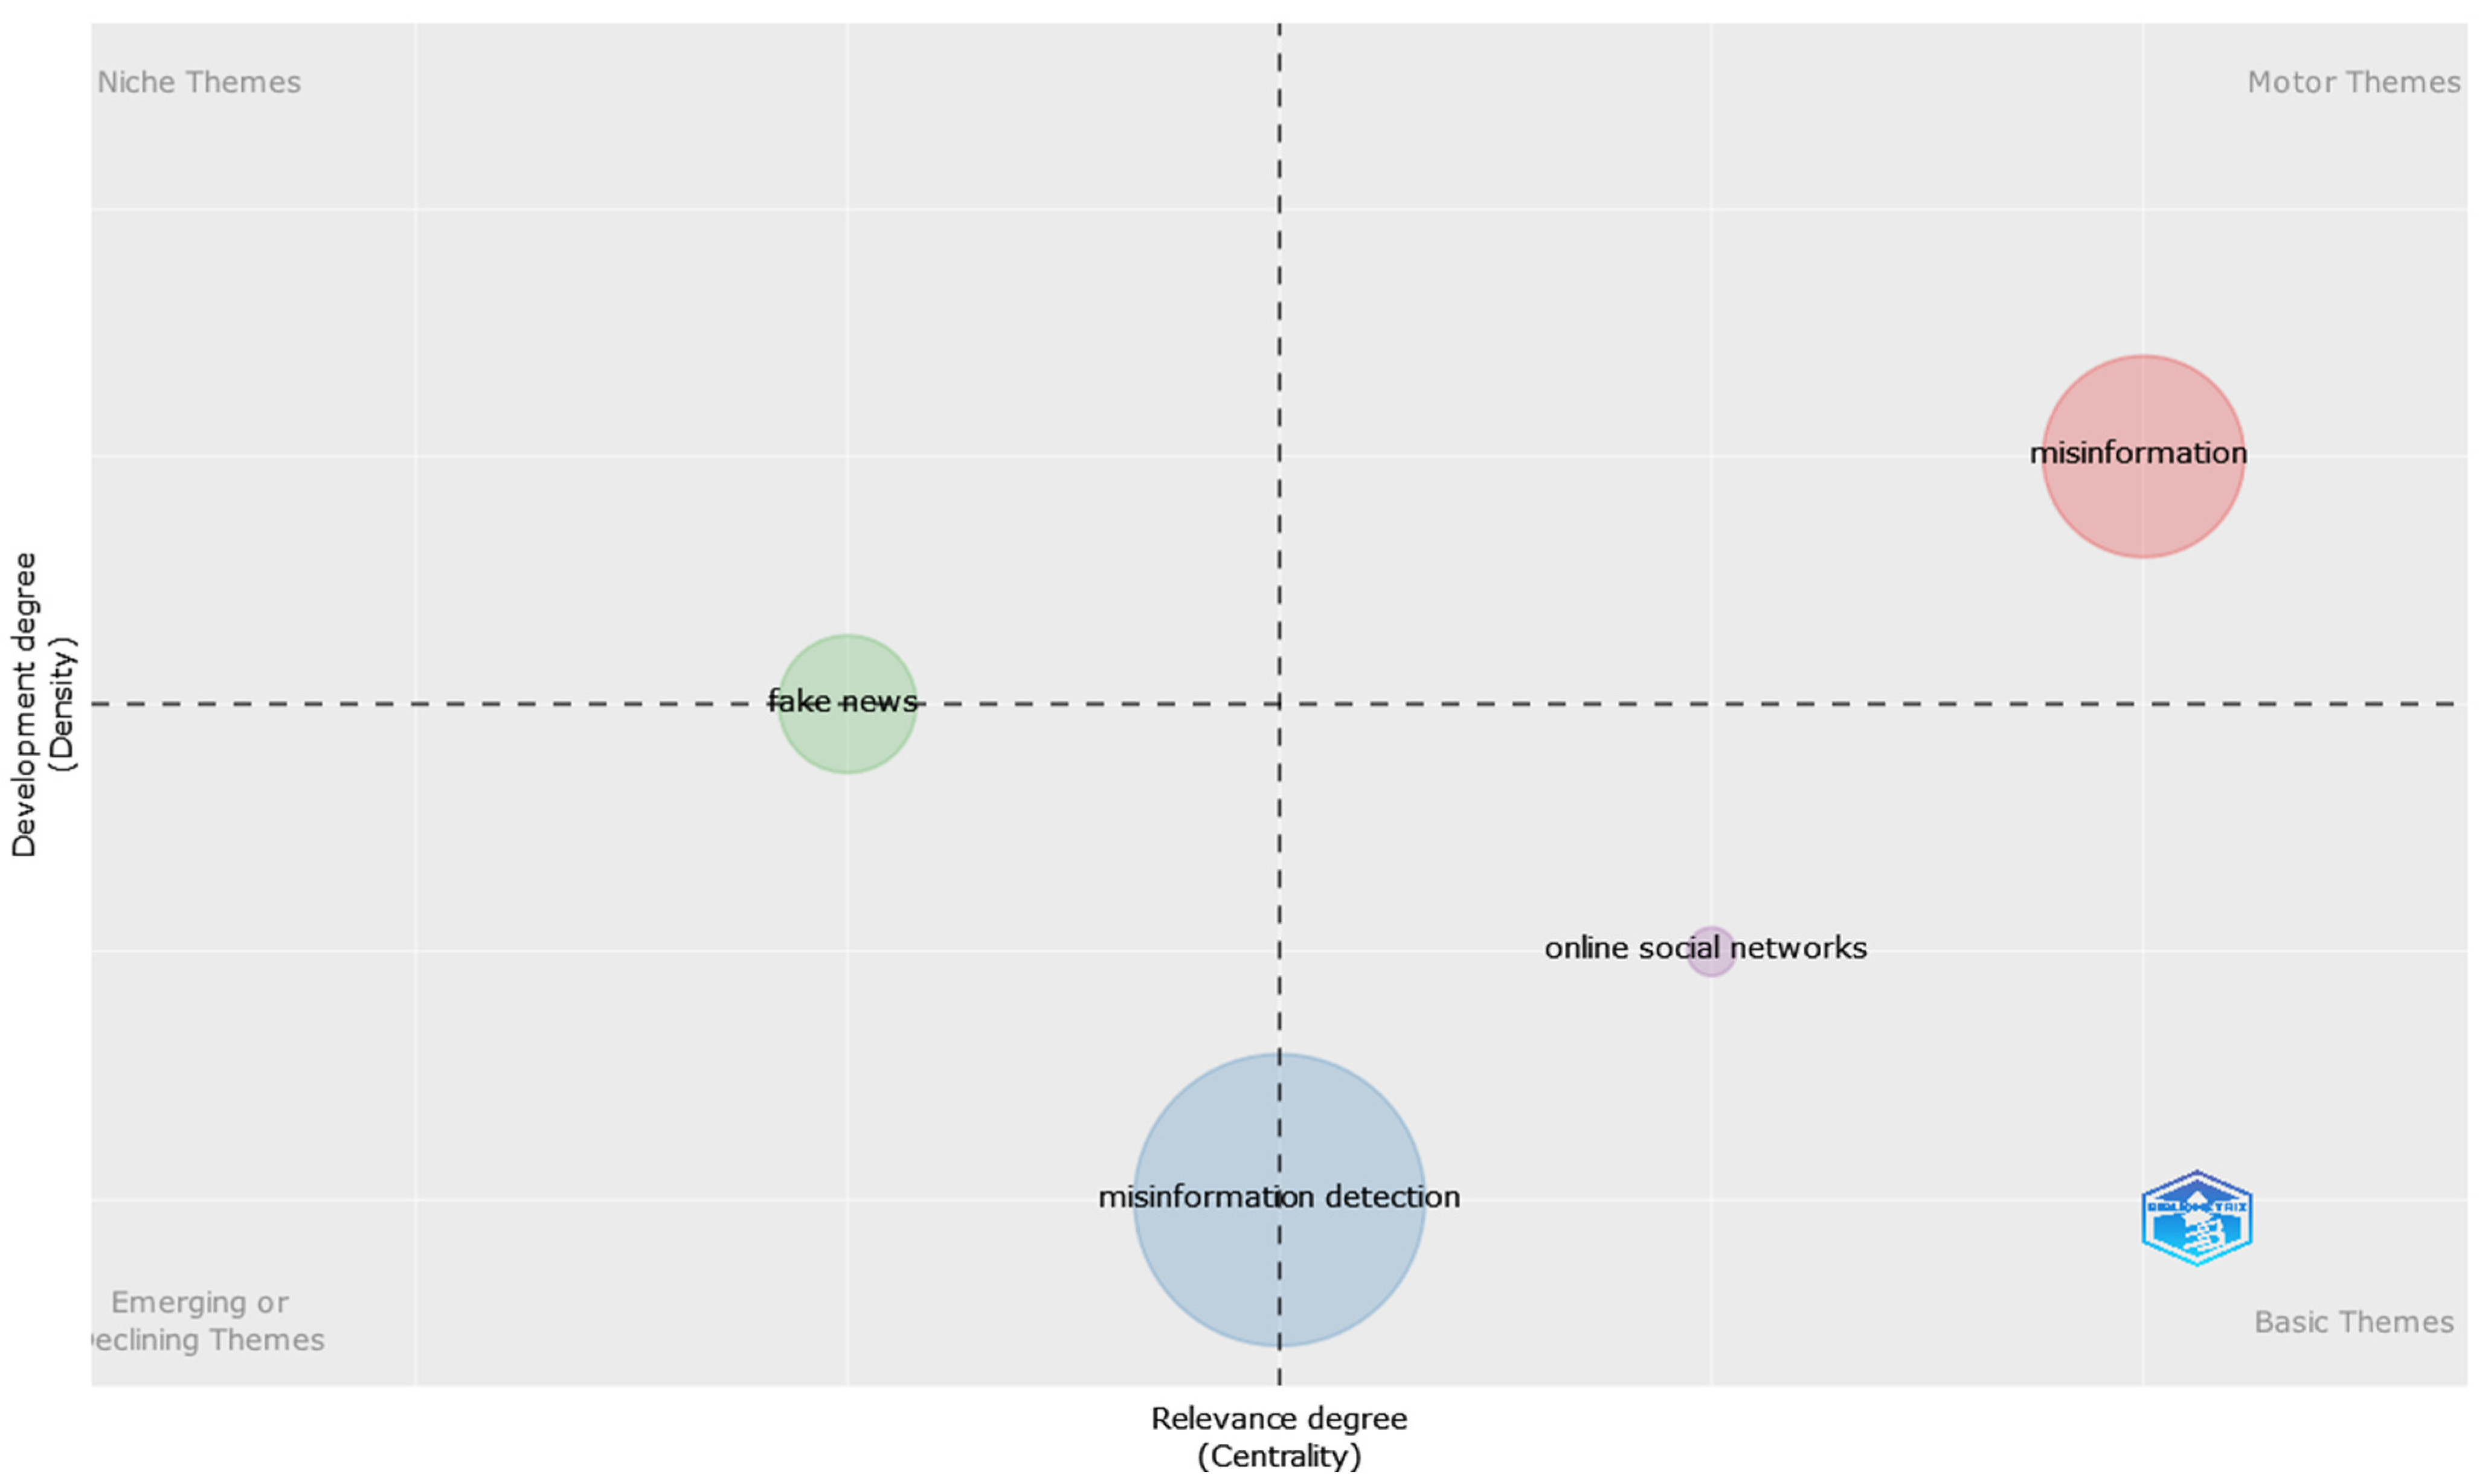
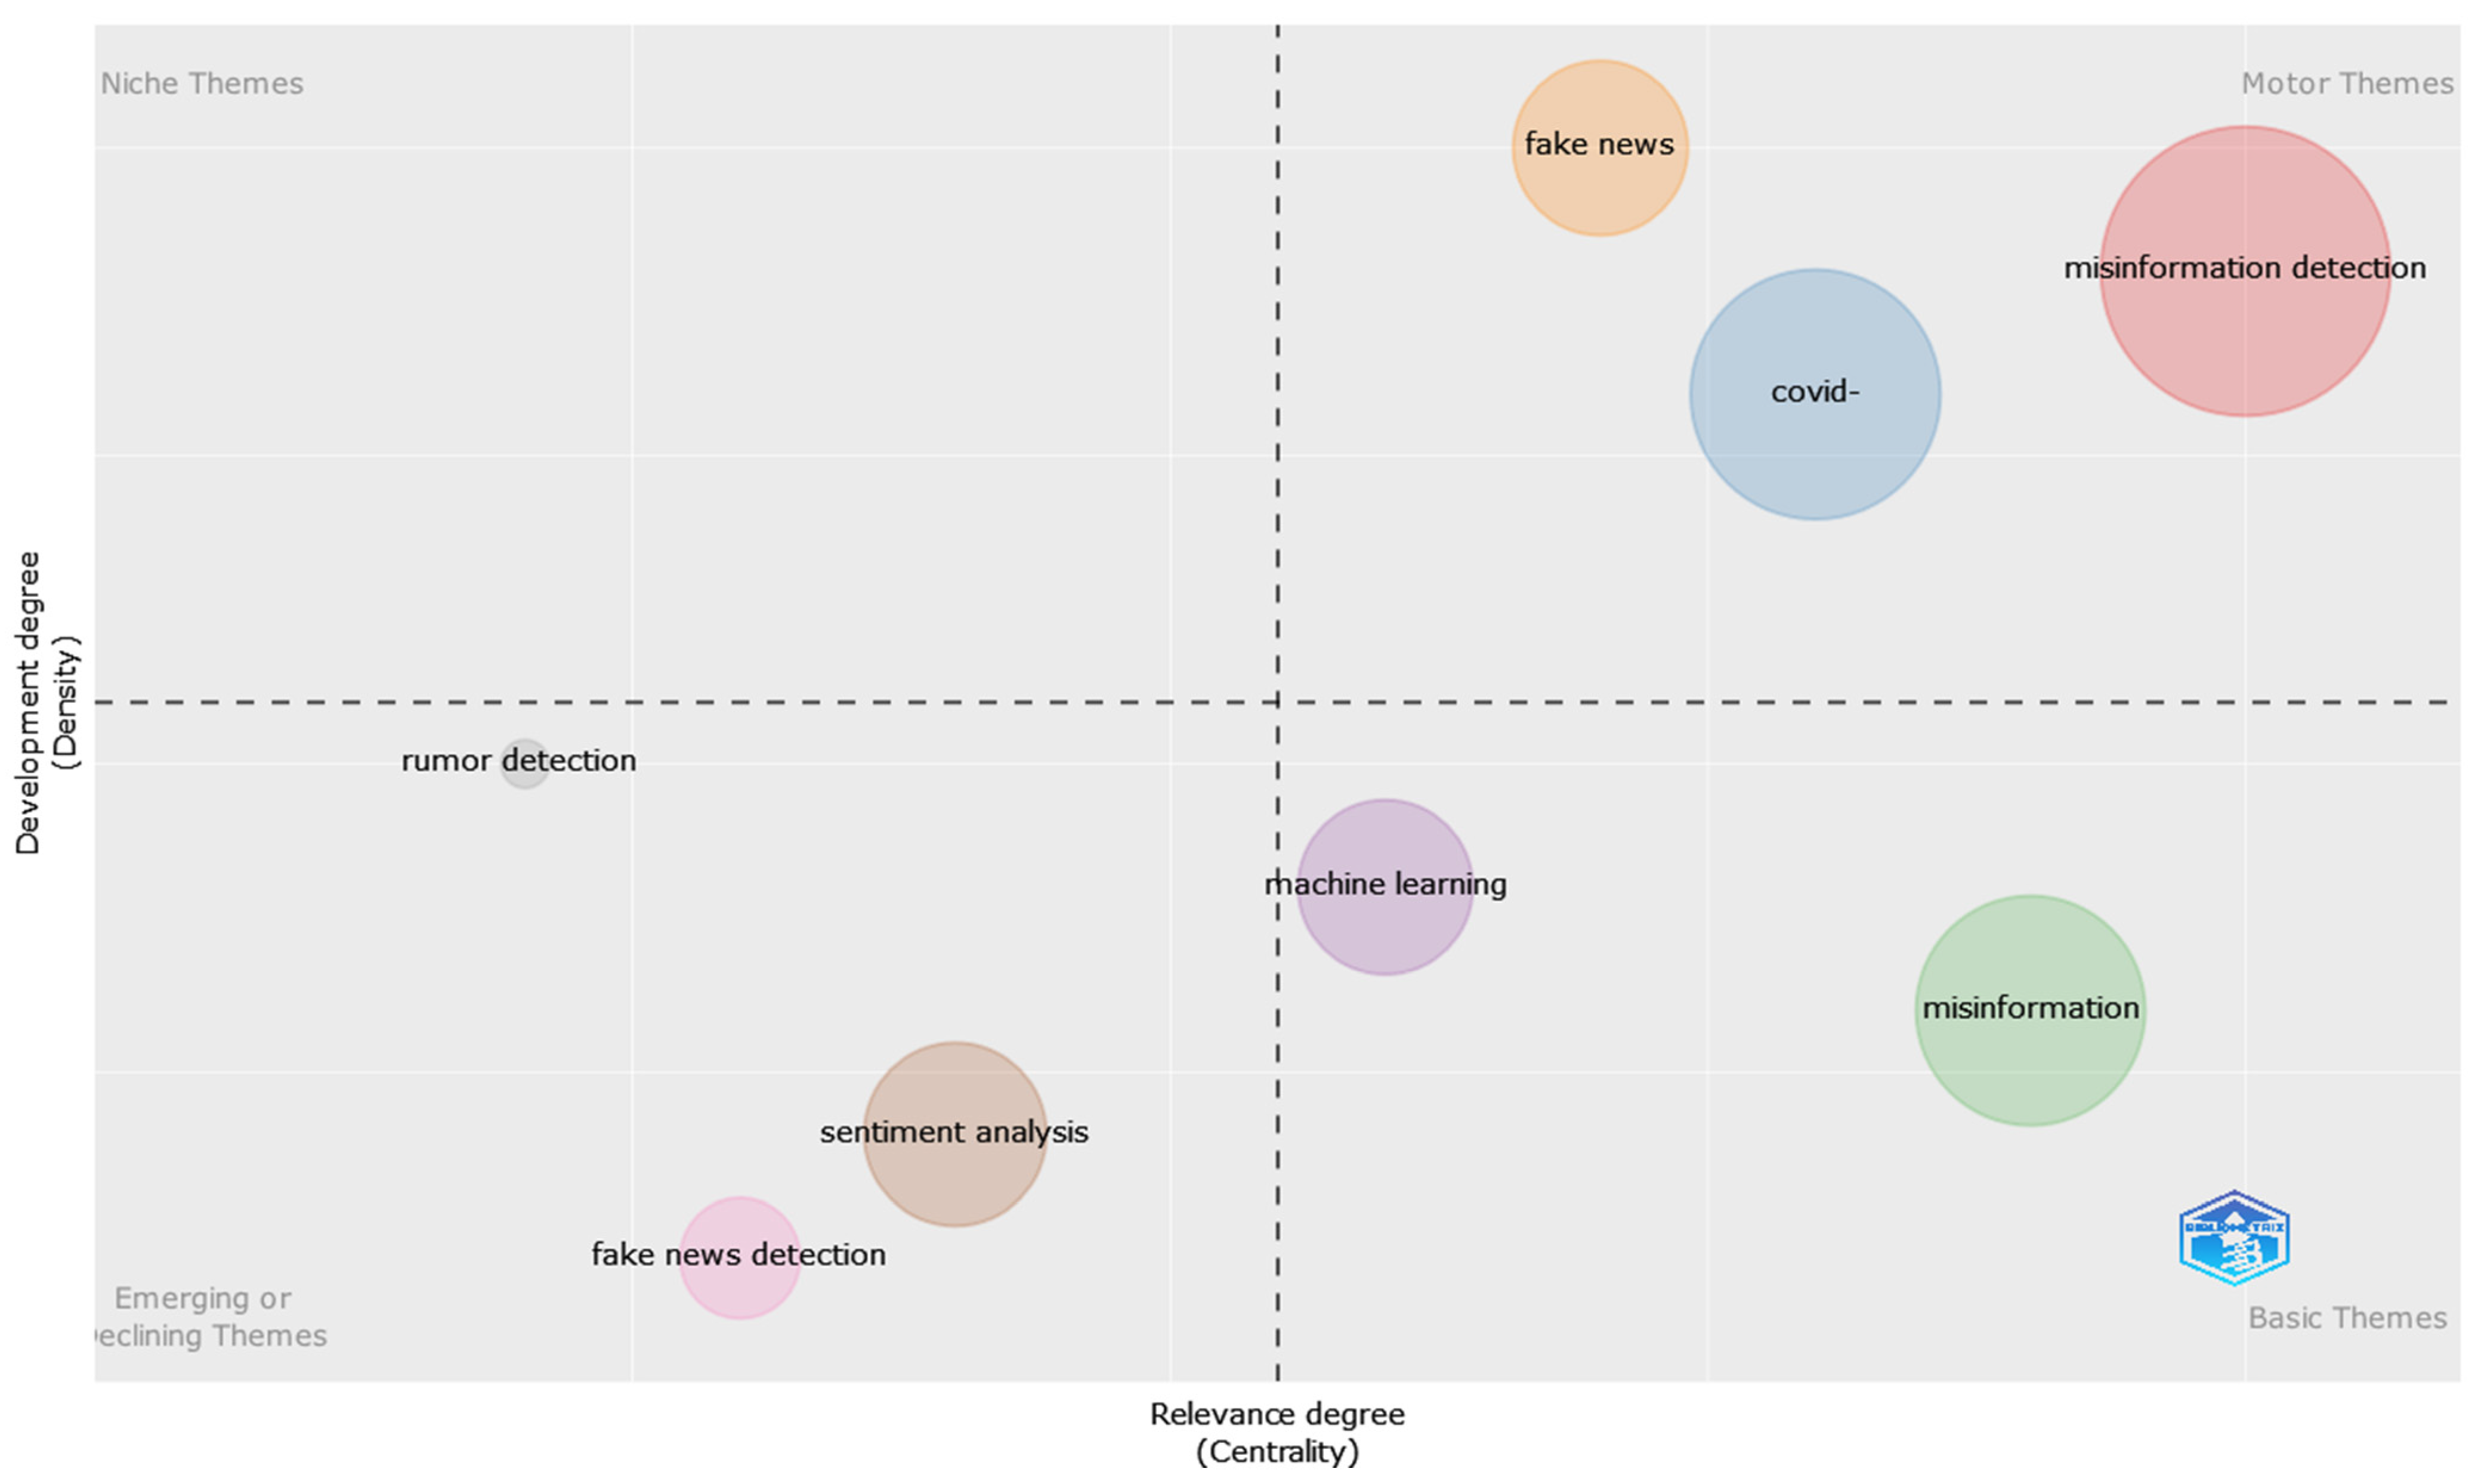
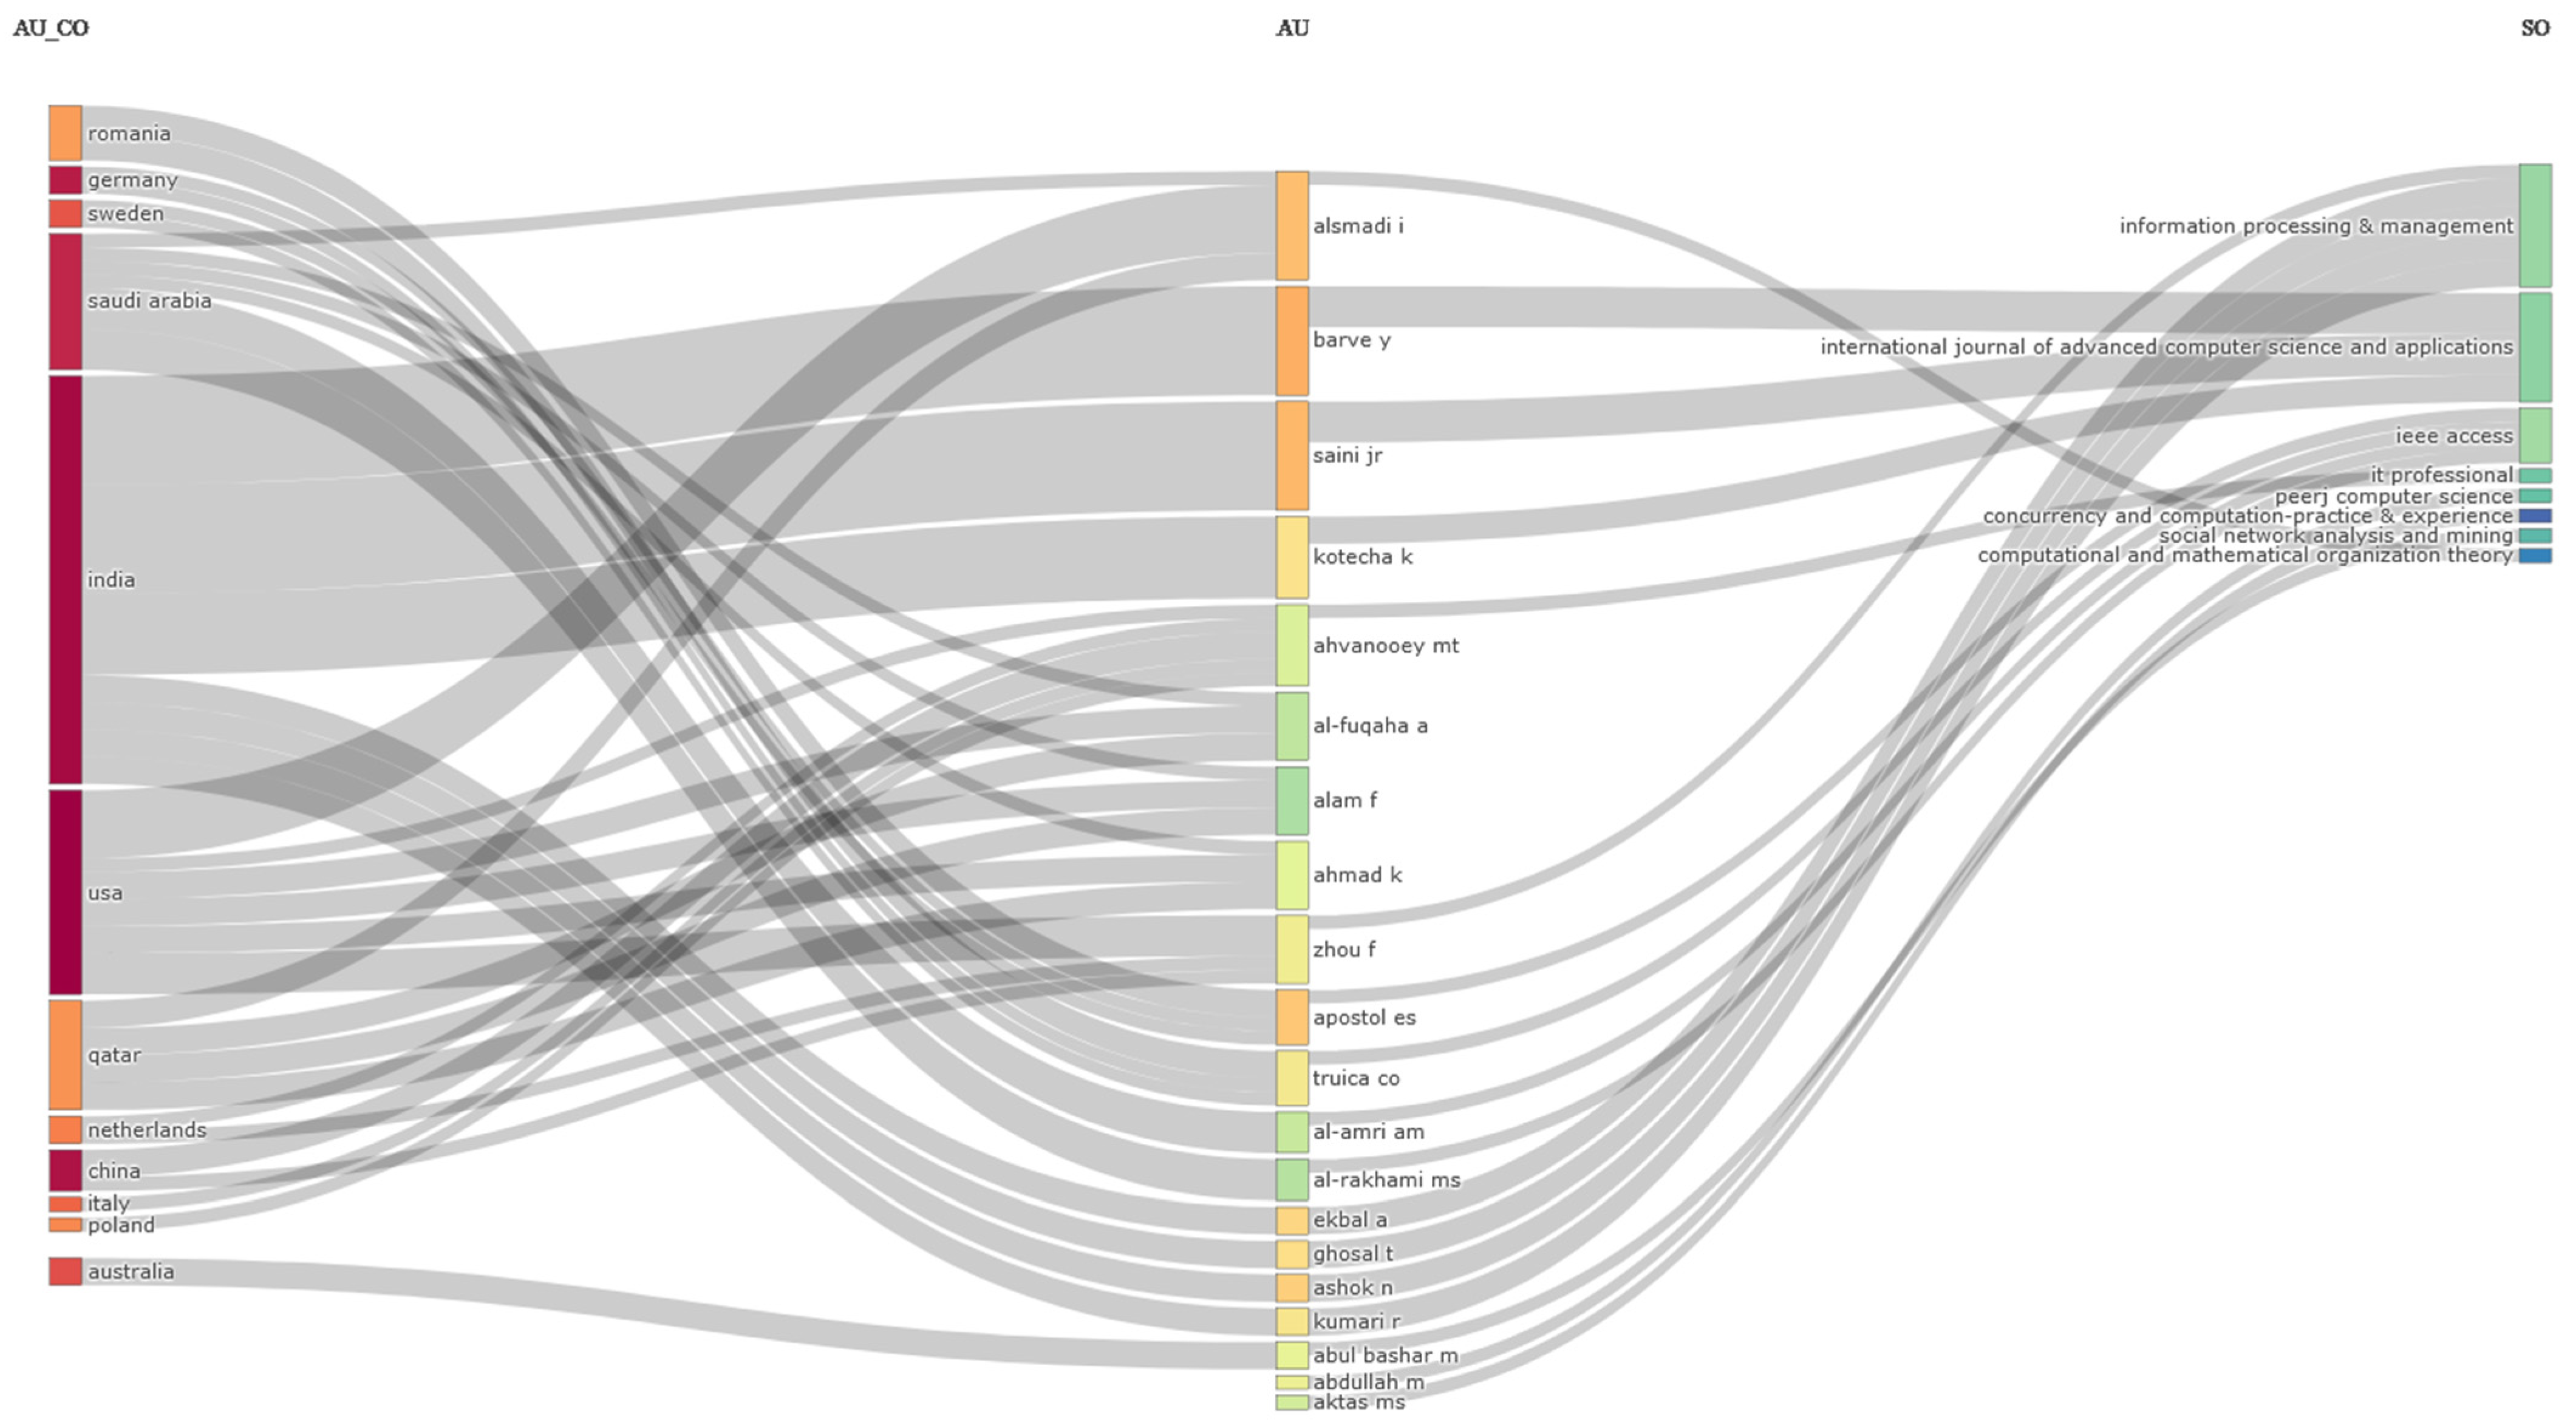
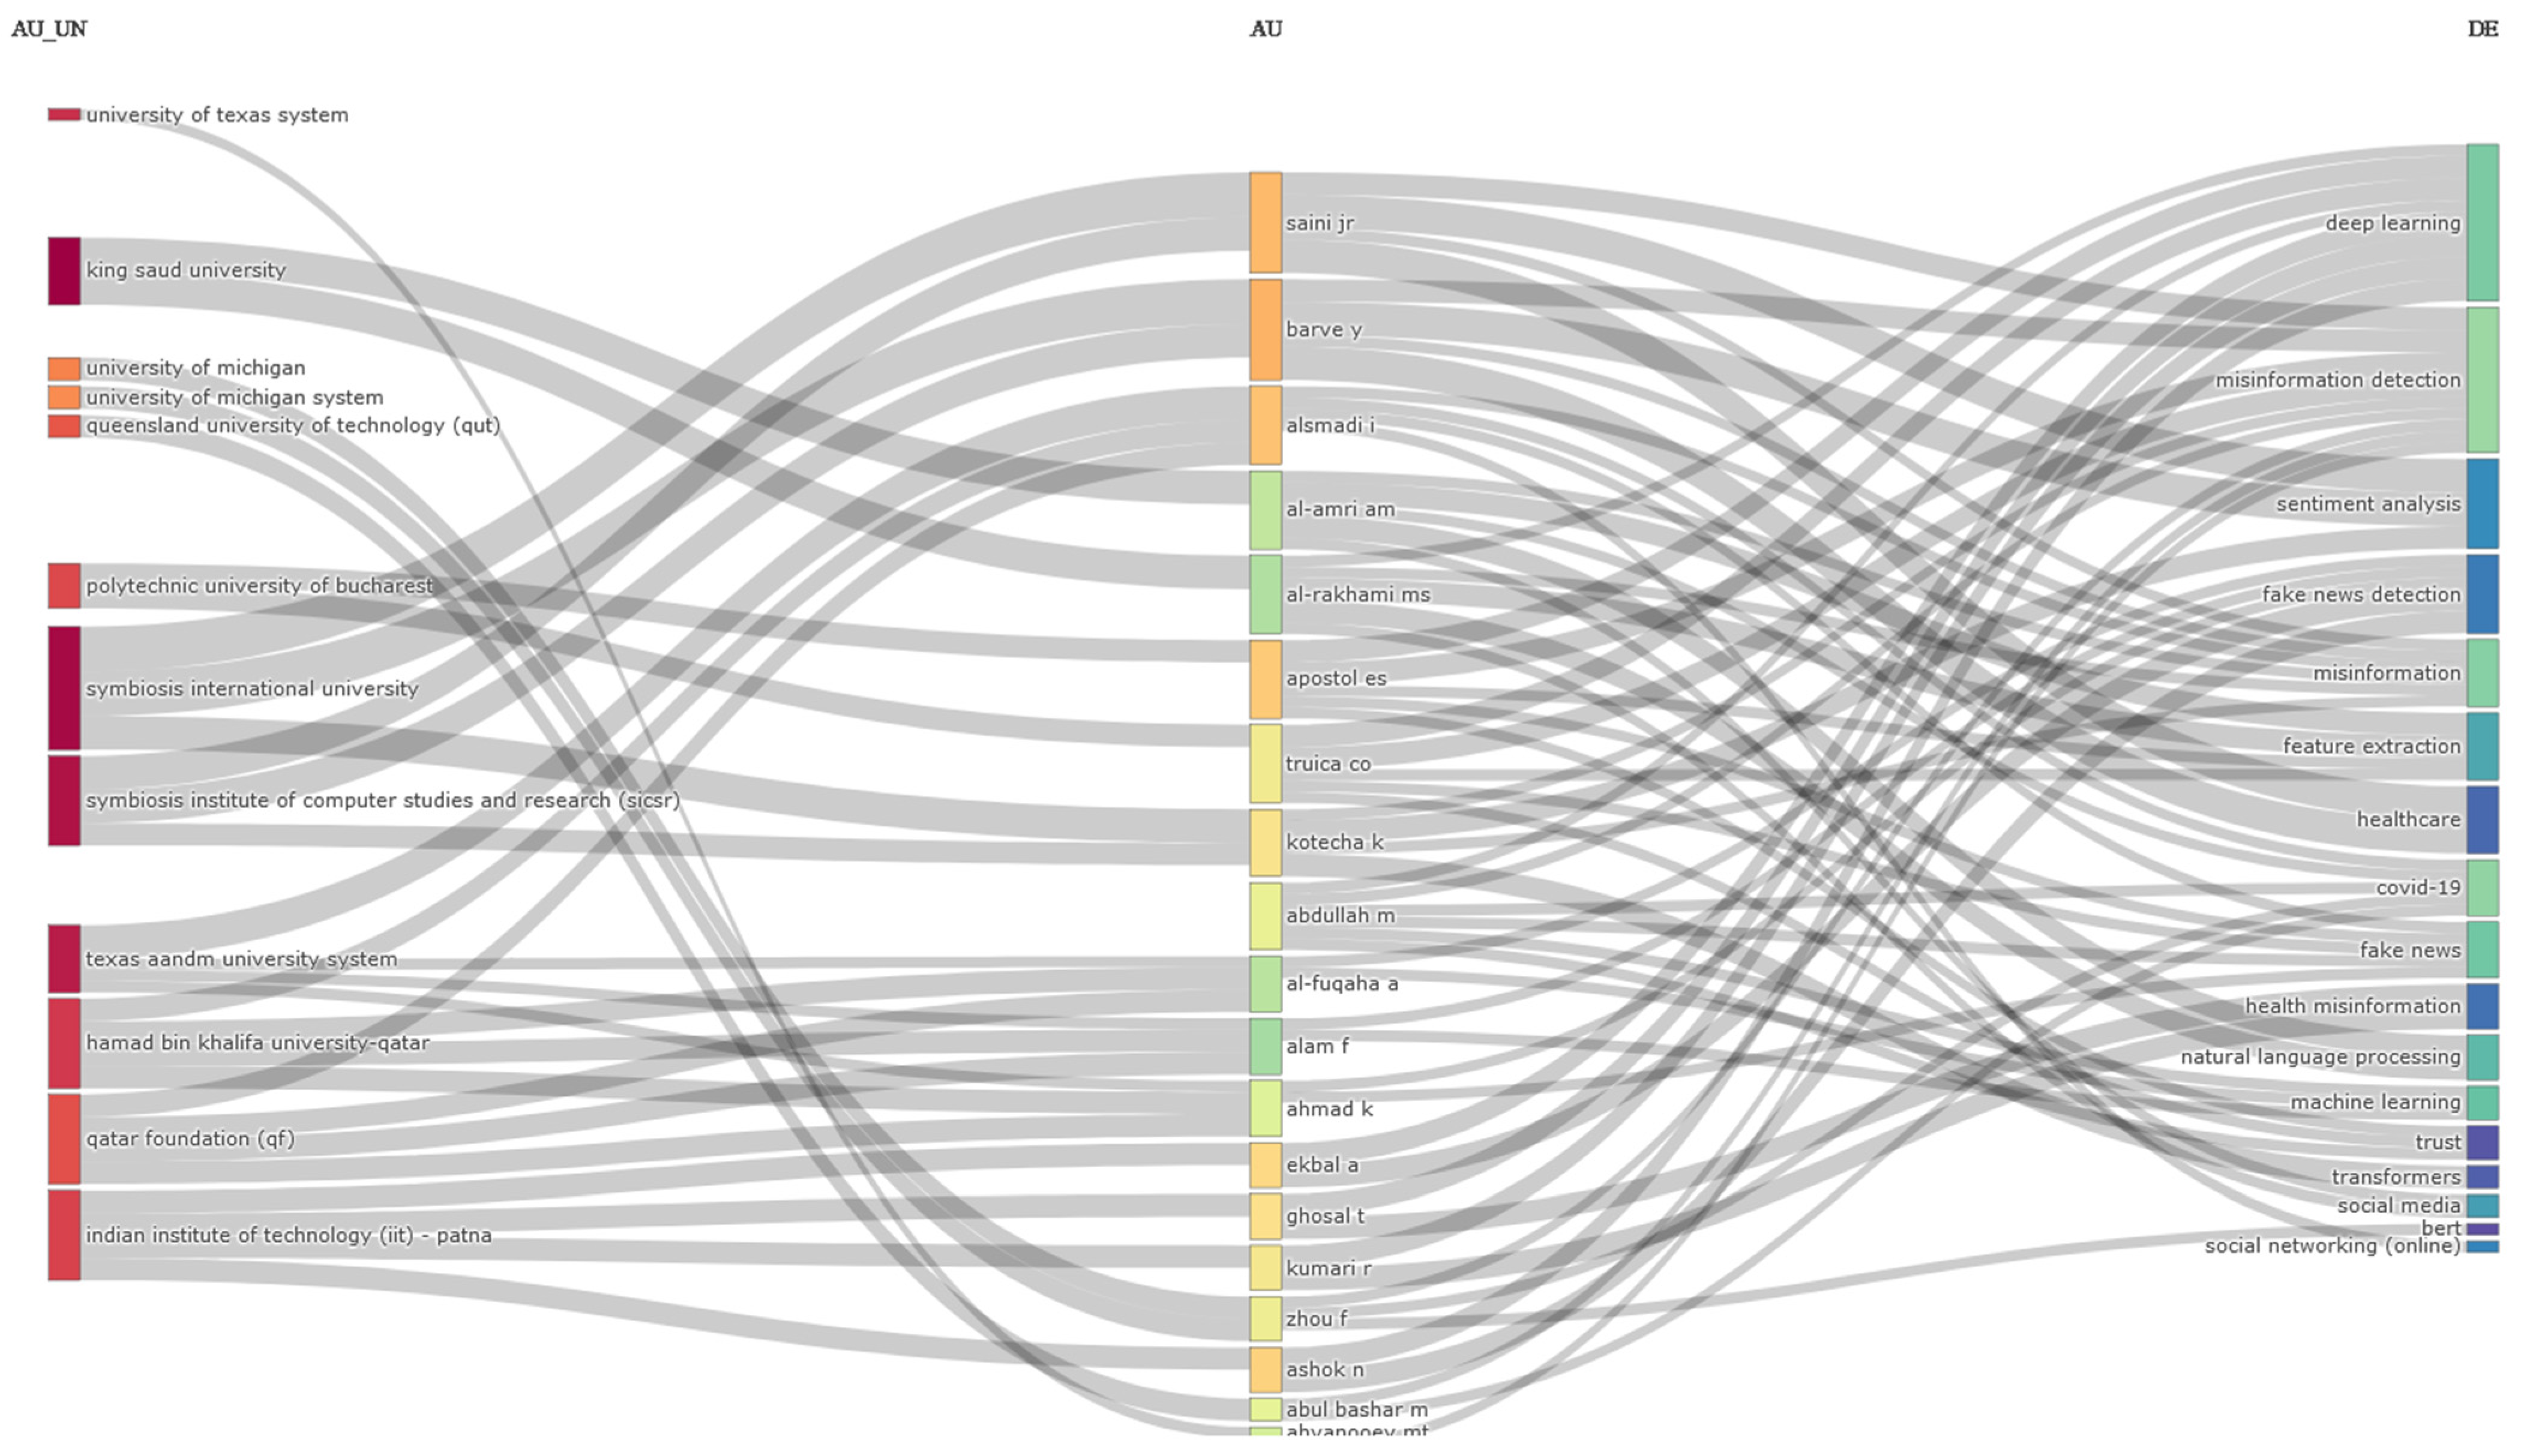
Table 1.
Data selection steps.
| Exploration Steps | Filters | Description | Query Used in WoS | Query ID | Number of Papers Extracted |
|---|---|---|---|---|---|
| 1 | Title/ Abstract/ Keywords | Title contains misinformation detection | (TI = (misinformation_detection)) OR TI = (detect_misinformation) | #1 | 56 |
| Abstract contains misinformation detection | (AB = (misinformation_detection)) OR AB = (detect_misinformation) | #2 | 151 | ||
| Keywords contains misinformation detection | (AK = (misinformation_detection)) OR AK = (detect_misinformation) | #3 | 58 | ||
| Title/Abstract/Keywords contain misinformation detection | #1 OR #2 OR #3 | #4 | 185 | ||
| 2 | Language | Limit to papers written in English | (#4) AND LA = (English) | #5 | 185 |
| 3 | Document Type | Limit to papers marked as “Article” by WoS | (#5) AND DT = (Article) | #6 | 79 |
| 4 | Year | Exclude the year 2023 | (#6) NOT PY = (2023) | #7 | 56 |
Table 2.
Bibliometric analysis steps.
| Bibliometric Analysis Steps | Name | Description | Indicators Considered |
|---|---|---|---|
| 1 | Dataset Overview | Main information about data | Timespan; Number of sources; Number of documents; Average years from publication; Average citations per document; Average citations per year per document; Number of references. |
| Documents content analysis | Number of keywords plus; Number of author’s keywords. | ||
| General information on authors | Number of authors; Author appearances; authors of single-authored documents; Authors of multi-authored documents. | ||
| General information on authors’ collaboration | Number of single-authored documents; Number of documents per author; Number of authors per document; Number of co-authors per documents; Collaboration index. | ||
| 2 | Sources Analysis | Analysis of the journals in terms of published items and their impact | Most relevant sources; Bradford’s law on source clustering; Journals’ impact based on H-index; Journals’ growth (cumulative) based on the number of papers. |
| 3 | Authors Analysis | Analysis of the authors in terms of published items, characteristics of the authors, and impact of the research | Top authors based on number of documents; Top-authors’ production over time; Most relevant affiliations; Most relevant corresponding author’s country; Scientific production based on country; Countries with the most citations; Country collaboration map; Top 50 authors’ collaboration network. |
| 4 | Papers Analysis | Analysis of the papers and the words extracted from the papers | Total citations (TC); Total citations per year (TCY); Normalized TC (NTC); Most frequent words in Keywords plus; Most frequent words in authors’ keywords; Most frequent bigrams in abstracts and titles; Most frequent trigrams in abstracts and titles. |
| 5 | Mixed Analysis | Point out the complex connections between countries, authors, journals, affiliations, and keywords | Three-field plots. |
Table 3.
Main information about the data.
| Indicator | Value |
|---|---|
| Timespan | 2016:2022 |
| Number of sources | 41 |
| Number of documents | 56 |
| Average years from publication | 2.04 |
| Average citations per documents | 15.27 |
| Average citations per year per document | 4.621 |
| Number of references | 2821 |
Table 4.
Document contents.
| Indicator | Value |
|---|---|
| Number of keywords plus | 78 |
| Number of author’s keywords | 199 |
Table 5.
Authors.
| Indicator | Value |
|---|---|
| Number of authors | 178 |
| Author appearances | 191 |
| Authors of single-authored documents | 2 |
| Authors of multi-authored documents | 176 |
Table 6.
Authors collaboration.
| Indicator | Value |
|---|---|
| Number of single-authored documents | 2 |
| Number of documents per author | 0.315 |
| Number of authors per document | 3.18 |
| Number of co-authors per document | 3.41 |
| Collaboration index | 3.26 |
Table 7.
Top 10 most global cited documents.
| No. | Paper (First Author, Year, Journal, Reference) | Number of Authors | Region | Total Citations (TC) | Total Citations per Year (TCY) | Normalized TC (NTC) |
|---|---|---|---|---|---|---|
| 1 | Shorten C, 2021, Journal of Big Data, [57] | 3 | USA | 125 | 41.67 | 6.45 |
| 2 | Khan ML, 2019, Behaviour & Information Technology, [58] | 2 | USA, Indonesia | 92 | 18.40 | 3.25 |
| 3 | Al-Rakhami MS, 2020, IEEE Access, [59] | 2 | Saudi Arabia | 62 | 15.50 | 1.86 |
| 4 | Zhao YH, 2021, Information Processing & Management, [60] | 3 | China | 56 | 18.67 | 2.89 |
| 5 | Ayoub J, 2021, Information Processing & Management, [61] | 3 | USA | 39 | 13.00 | 2.01 |
| 6 | Asr FT, 2019, Big Data & Society: Sage Journals, [62] | 2 | Canada | 37 | 7.40 | 1.31 |
| 7 | Zhang HL, 2016, ACM Transactions on Information Systems, [63] | 5 | Florida, Vietnam | 36 | 4.50 | 1.00 |
| 8 | Baeth MJ, 2019, Concurrency and Computation: Practice and Experience, [64] | 2 | Turkey | 34 | 6.80 | 1.20 |
| 9 | Hayawi K, 2022, Public Health, [65] | 5 | United Arab Emirates | 32 | 16.00 | 7.01 |
| 10 | Kumari R, 2021, Information Processing & Management, [66] | 4 | India, Czech Republic | 27 | 9.00 | 1.39 |
Table 8.
Brief summary of the content of the top 10 most globally cited documents.
| No. | Reference | Title | Methods Used | Data | Purpose |
|---|---|---|---|---|---|
| 1 | Shorten et al. [57] | Deep Learning applications for COVID-19 | Deep learning techniques—supervised, semi-supervised, self-supervised learning, federated learning, data augmentation. Deep neural networks. Meta-learning, transfer learning. | COVID-19 data—medical images, text data, clinical data | Outlines the uses, advantages, and restrictions of applying deep learning to combat COVID-19 challenges. |
| 2 | Khan and Idris [58] | Recognise misinformation and verify before sharing: a reasoned action and information literacy perspective | Data Collection. Statistical Analysis—multiple linear regression analysis | 396 people in Indonesia answered survey questions to provide data for this study. | Identify the elements impacting people’s sharing habits on social media and their self-efficacy in identifying misinformation. |
| 3 | Al-Rakhami and Al-Amri [59] | Lies Kill, Facts Save: Detecting COVID-19 Misinformation in Twitter | Data Collection. Data Annotation and Reliability. Feature Extraction. Ensemble-Learning-Based Model Selecting the Appropriate Meta-Model (C4.5, SVM, RF, Naive Bayes, Bayes net, and kNN) Selection of Weak-Learners. Selecting the Top Features. | 121,950 credible tweets and 287,534 non-credible tweets related to COVID-19 from Twitter’s streaming API, collected between 15 January 2020, and 15 April 2020. | Understand the impact of misinformation. Use machine learning techniques for determining the accuracy of the tweets. Develop a framework for detecting and combating COVID-19-related misinformation on Twitter. |
| 4 | Zhao et al. [60] | Detecting health misinformation in online health communities: Incorporating behavioral features into machine learning based approaches | Machine Learning. Feature Selection. Classification Models (Random Forest) | 151,719 records collected from the autism forum, between 2 January 2017, and 19 May. | Detect health misinformation in online health communities using machine learning and feature analysis. |
| 5 | Ayoub et al. [61] | Combat COVID-19 infodemic using explainable natural language processing models | Data Collection. Back-Translation Augmentation. Model Building—employed NLP models, including BERT, DistilBERT. SHAP Explanation. Model Evaluation. | 984 claims about COVID-19 | Addressing the difficulties associated with managing disinformation about COVID-19, creating a trustworthy prediction model to confirm the accuracy of COVID-19 claims, and increasing awareness of the significance of misinformation detection. |
| 6 | Asr et al. [62] | Big Data and quality data for fake news and misinformation detection | Scraping and collecting datasets. Automatic and manual procedures. Topic modeling techniques—Latent Dirichlet Allocation (LDA). | The Buzzfeed dataset—1380 news articles related to the 2016 US election. The Snopes dataset—around 4000 rows, each containing a claim, its veracity label, and the text of a news article related to the claim. The Emergent dataset—1612 articles. The datasets cover different topics (politics, sports, environment, health). | Tackle the issue of inaccurate information and fake news, propose text classification as a method for automatic identification, emphasize the importance of large, labeled datasets, and promote cooperation within the scientific community in the fight against misleading data. |
| 7 | Zhang et al. [63] | Misinformation in Online Social Networks: Detect Them All with a Limited Budget | Monitor Placement. Greedy Strategy. Τ-MP Problem. Sampling Techniques. | The dataset is comprised of information from various online social networks: Twitter, Epinion, and Slashdot. | Develop and evaluate strategies for placing monitors effectively in online social networks in order to quickly detect and prevent the dissemination of misleading data. |
| 8 | Baeth and Aktas [64] | Detecting misinformation in social networks using provenance data | Analysis of social workflows. Distance from positivity metric. Analytic Hierarchy Process (AHP). Fuzzy AHP. Synthetic social provenance dataset. Machine learning for misinformation detection. | Twitter data collected from Twitter’s stream and search APIs. | Use Twitter data to examine social processes, evaluate social network user reliability, and investigate the quality of the information, regarding disinformation detection. |
| 9 | Hayawi et al. [65] | ANTi-Vax: a novel Twitter dataset for COVID-19 vaccine misinformation detection | Feature Extraction. Classification models: XGBoost, LSTM, and BERT transformer model. | 15,465,687 English tweets related to COVID-19 vaccines collected between 1 December 2020, and 31 July 2021. | Examine and comprehend the dynamics of misleading information regarding COVID-19 and vaccines on social media, especially Twitter. |
| 10 | Kumari et al. [66] | Misinformation detection using multitask learning with mutual learning for novelty detection and emotion recognition | Multitask learning framework. Deep learning techniques. Neural networks. Pretrained embeddings (Glove- and BERT-based embeddings). Cross-entropy loss. | News articles and text data collected from various sources. | Improve the capacity to identify false information on social media by using information about novelty and emotion in news. |
Table 9.
Brief overview of the papers included in the dataset.
| No. | Reference | Misinformation Category | Channel | Approach | |||||||||||||||||
|---|---|---|---|---|---|---|---|---|---|---|---|---|---|---|---|---|---|---|---|---|---|
| Health | Politics | Personal, Environment | Science | Sports, Market, Police, Legislation, Technology | Other/Unspecified/No Accent on the Category | Social Media | News | Unspecified | Machine Learning | Survey | Other (Proof of Concept; Text Analysis; Writing Style Analysis; Ontology; Greedy Approximation Algorithms; Graph Link Prediction; Blockchain; Eye-Tracking, etc.) | ||||||||||
| Vaccines (COVID-19 and in General) | COVID-19 Pandemic | Health Aspects in General | Reddit, ByteDance | Epinion, Slashdot | Health Communities/Healthcare Web URL | Social Media in General/Other | |||||||||||||||
| 1 | Shorten et al. [57] | ✔ | ✔ | ||||||||||||||||||
| 2 | Khan and Idris [58] | ✔ | ✔ | ✔ | |||||||||||||||||
| 3 | Al-Rakhami and Al-Amri [59] | ✔ | ✔ | ✔ | |||||||||||||||||
| 4 | Zhao et al. [60] | ✔ | ✔ | ✔ | |||||||||||||||||
| 5 | Ayoub et al. [61] | ✔ | ✔ | ✔ | |||||||||||||||||
| 6 | Asr et al. [62] | ✔ | ✔ | ✔ | ✔ | ✔ | ✔ | ✔ | |||||||||||||
| 7 | Zhang et al. [63] | ✔ | ✔ | ✔ | ✔ | ✔ | |||||||||||||||
| 8 | Baeth and Aktas [64] | ✔ | ✔ | ✔ | ✔ | ✔ | |||||||||||||||
| 9 | Hayawi et al. [65] | ✔ | ✔ | ✔ | |||||||||||||||||
| 10 | Kumari et al. [66] | ✔ | ✔ | ✔ | ✔ | ✔ | ✔ | ✔ | |||||||||||||
| 11 | Zhou et al. [67] | ✔ | ✔ | ✔ | |||||||||||||||||
| 12 | Schuster et al. [68] | ✔ | ✔ | ✔ | |||||||||||||||||
| 13 | Thornhill et al. [69] | ✔ | ✔ | ✔ | |||||||||||||||||
| 14 | Glabel and Paula [70] | ✔ | ✔ | ✔ | |||||||||||||||||
| 15 | Yeo and McKasy [71] | ✔ | ✔ | ✔ | ✔ | ✔ | ✔ | ||||||||||||||
| 16 | Chen et al. [72] | ✔ | ✔ | ✔ | ✔ | ||||||||||||||||
| 17 | Chen et al. [73] | ✔ | ✔ | ✔ | |||||||||||||||||
| 18 | Kasper et al. [1] | ✔ | ✔ | ✔ | |||||||||||||||||
| 19 | Liu et al. [74] | ✔ | ✔ | ✔ | ✔ | ✔ | |||||||||||||||
| 20 | Alenezi et al. [75] | ✔ | ✔ | ✔ | |||||||||||||||||
| 21 | Cheng and Chen [76] | ✔ | ✔ | ✔ | |||||||||||||||||
| 22 | Ilie et al. [77] | ✔ | ✔ | ✔ | |||||||||||||||||
| 23 | Kumari et al. [78] | ✔ | ✔ | ✔ | ✔ | ||||||||||||||||
| 24 | Sotto and Viviani [79] | ✔ | ✔ | ✔ | ✔ | ||||||||||||||||
| 25 | Amith and Tao [80] | ✔ | ✔ | ✔ | |||||||||||||||||
| 26 | Martin-Gutierrez et al. [81] | ✔ | ✔ | ✔ | |||||||||||||||||
| 27 | Komendantova et al. [82] | ✔ | ✔ | ||||||||||||||||||
| 28 | Pham et al. [83] | ✔ | ✔ | ✔ | |||||||||||||||||
| 29 | Balasubramaniam et al. [84] | ✔ | ✔ | ✔ | |||||||||||||||||
| 30 | Weinzierl and Harabagiu [85] | ✔ | ✔ | ✔ | |||||||||||||||||
| 31 | Karnyoto et al. [86] | ✔ | ✔ | ✔ | |||||||||||||||||
| 32 | Mishima and Yamana [87] | ✔ | ✔ | ✔ | |||||||||||||||||
| 33 | Arquam et al. [88] | ✔ | ✔ | ✔ | ✔ | ||||||||||||||||
| 34 | Truica and Apostol [89] | ✔ | ✔ | ✔ | |||||||||||||||||
| 35 | Kim et al. [90] | ✔ | ✔ | ✔ | |||||||||||||||||
| 36 | Simko et al. [91] | ✔ | ✔ | ✔ | |||||||||||||||||
| 37 | Hashemi [92] | ✔ | ✔ | ✔ | ✔ | ||||||||||||||||
| 38 | Safarnejad et al. [93] | ✔ | ✔ | ✔ | |||||||||||||||||
| 39 | Alsudias and Rayson [94] | ✔ | ✔ | ✔ | ✔ | ||||||||||||||||
| 40 | Barve et al. [95] | ✔ | ✔ | ✔ | |||||||||||||||||
| 41 | Barve and Saini [96] | ✔ | ✔ | ✔ | |||||||||||||||||
| 42 | Ahvanooey et al. [97] | ✔ | ✔ | ✔ | |||||||||||||||||
| 43 | Freiling and Waldherr [98] | ✔ | ✔ | ✔ | |||||||||||||||||
| 44 | Gonzalez-Fernandez et al. [99] | ✔ | ✔ | ✔ | |||||||||||||||||
| 45 | Barve et al. [100] | ✔ | ✔ | ✔ | |||||||||||||||||
| 46 | Jalal and Ghafoor [101] | ✔ | ✔ | ✔ | |||||||||||||||||
| 47 | Alsmadi et al. [102] | ✔ | ✔ | ✔ | ✔ | ||||||||||||||||
| 48 | Yu et al. [103] | ✔ | ✔ | ✔ | |||||||||||||||||
| 49 | Wei et al. [104] | ✔ | ✔ | ✔ | |||||||||||||||||
| 50 | Fernandez-Pichel et al. [105] | ✔ | ✔ | ✔ | |||||||||||||||||
| 51 | Obeidat et al. [106] | ✔ | ✔ | ✔ | |||||||||||||||||
| 52 | V and Thampi [107] | ✔ | ✔ | ✔ | |||||||||||||||||
| 53 | Mahbub et al. [108] | ✔ | ✔ | ✔ | |||||||||||||||||
| 54 | Alsmadi et al. [109] | ✔ | ✔ | ✔ | |||||||||||||||||
| 55 | Xia and Zubiaga [110] | ✔ | ✔ | ✔ | |||||||||||||||||
| 56 | Ananthi and Sridevi [111] | ✔ | ✔ | ✔ | |||||||||||||||||
Table 10.
Top 10 most frequent words in keywords plus.
| Words | Occurrences |
|---|---|
| social media | 6 |
| credibility | 5 |
| fake news | 5 |
| information | 5 |
| classification | 3 |
| communication | 3 |
| media | 3 |
| news | 3 |
| engagement | 2 |
| health | 2 |
Table 11.
Top 10 most frequent words in authors’ keywords.
| Words | Occurrences |
|---|---|
| misinformation detection | 19 |
| COVID-19 | 13 |
| misinformation | 13 |
| deep learning | 10 |
| fake news | 9 |
| machine learning | 9 |
| natural language processing | 8 |
| 6 | |
| feature extraction | 5 |
| social media | 5 |
Table 12.
Top 10 most frequent bigrams in abstracts and titles.
| Bigrams in Abstracts | Occurrences | Bigrams in Titles | Occurrences |
| misinformation detection | 43 | misinformation detection | 11 |
| social media | 41 | social media | 8 |
| fake news | 32 | social networks | 7 |
| detect misinformation | 24 | fake news | 5 |
| deep learning | 19 | online social | 5 |
| machine learning | 16 | covid-misinformation | 4 |
| social networks | 15 | machine learning | 4 |
| detecting misinformation | 13 | deep learning | 3 |
| language processing | 12 | health misinformation | 3 |
| natural language | 12 | vaccine misinformation | 3 |
Table 13.
Top 10 most frequent trigrams in abstracts and titles.
| Trigrams in Abstracts | Occurrences | Trigrams in Titles | Occurrences |
|---|---|---|---|
| natural language processing | 12 | online social networks | 5 |
| fake news detection | 8 | covid-vaccine misinformation | 2 |
| social media platforms | 7 | detecting covid-misinformation | 2 |
| online social networks | 6 | fake news detection | 2 |
| bidirectional encoder representations | 5 | natural language processing | 2 |
| support vector machine | 5 | ae rta transformers | 1 |
| misrob ae rta | 4 | aggregating pairwise semantic | 1 |
| coupled matrix tensor | 3 | analyzing social bots | 1 |
| dilated convolutional autoencoder | 3 | applications attacks defenses | 1 |
| language processing nlp | 3 | Arabic Twitter data | 1 |
Disclaimer/Publisher’s Note: The statements, opinions and data contained in all publications are solely those of the individual author(s) and contributor(s) and not of MDPI and/or the editor(s). MDPI and/or the editor(s) disclaim responsibility for any injury to people or property resulting from any ideas, methods, instructions or products referred to in the content. |
© 2024 by the authors. Licensee MDPI, Basel, Switzerland. This article is an open access article distributed under the terms and conditions of the Creative Commons Attribution (CC BY) license (https://creativecommons.org/licenses/by/4.0/).
Share and Cite
MDPI and ACS Style
Sandu, A.; Ioanăș, I.; Delcea, C.; Geantă, L.-M.; Cotfas, L.-A. Mapping the Landscape of Misinformation Detection: A Bibliometric Approach. Information 2024, 15, 60. https://0-doi-org.brum.beds.ac.uk/10.3390/info15010060
AMA Style
Sandu A, Ioanăș I, Delcea C, Geantă L-M, Cotfas L-A. Mapping the Landscape of Misinformation Detection: A Bibliometric Approach. Information. 2024; 15(1):60. https://0-doi-org.brum.beds.ac.uk/10.3390/info15010060
Chicago/Turabian StyleSandu, Andra, Ioana Ioanăș, Camelia Delcea, Laura-Mădălina Geantă, and Liviu-Adrian Cotfas. 2024. "Mapping the Landscape of Misinformation Detection: A Bibliometric Approach" Information 15, no. 1: 60. https://0-doi-org.brum.beds.ac.uk/10.3390/info15010060
Note that from the first issue of 2016, this journal uses article numbers instead of page numbers. See further details here.