

An In Vitro Study regarding the Wear of Composite Materials Following the Use of Dental Bleaching Protocols
 , ,
, ,
Abstract
:1. Introduction
2. Materials and Methods
2.1. Composite Discs
2.2. Bleaching Guidelines
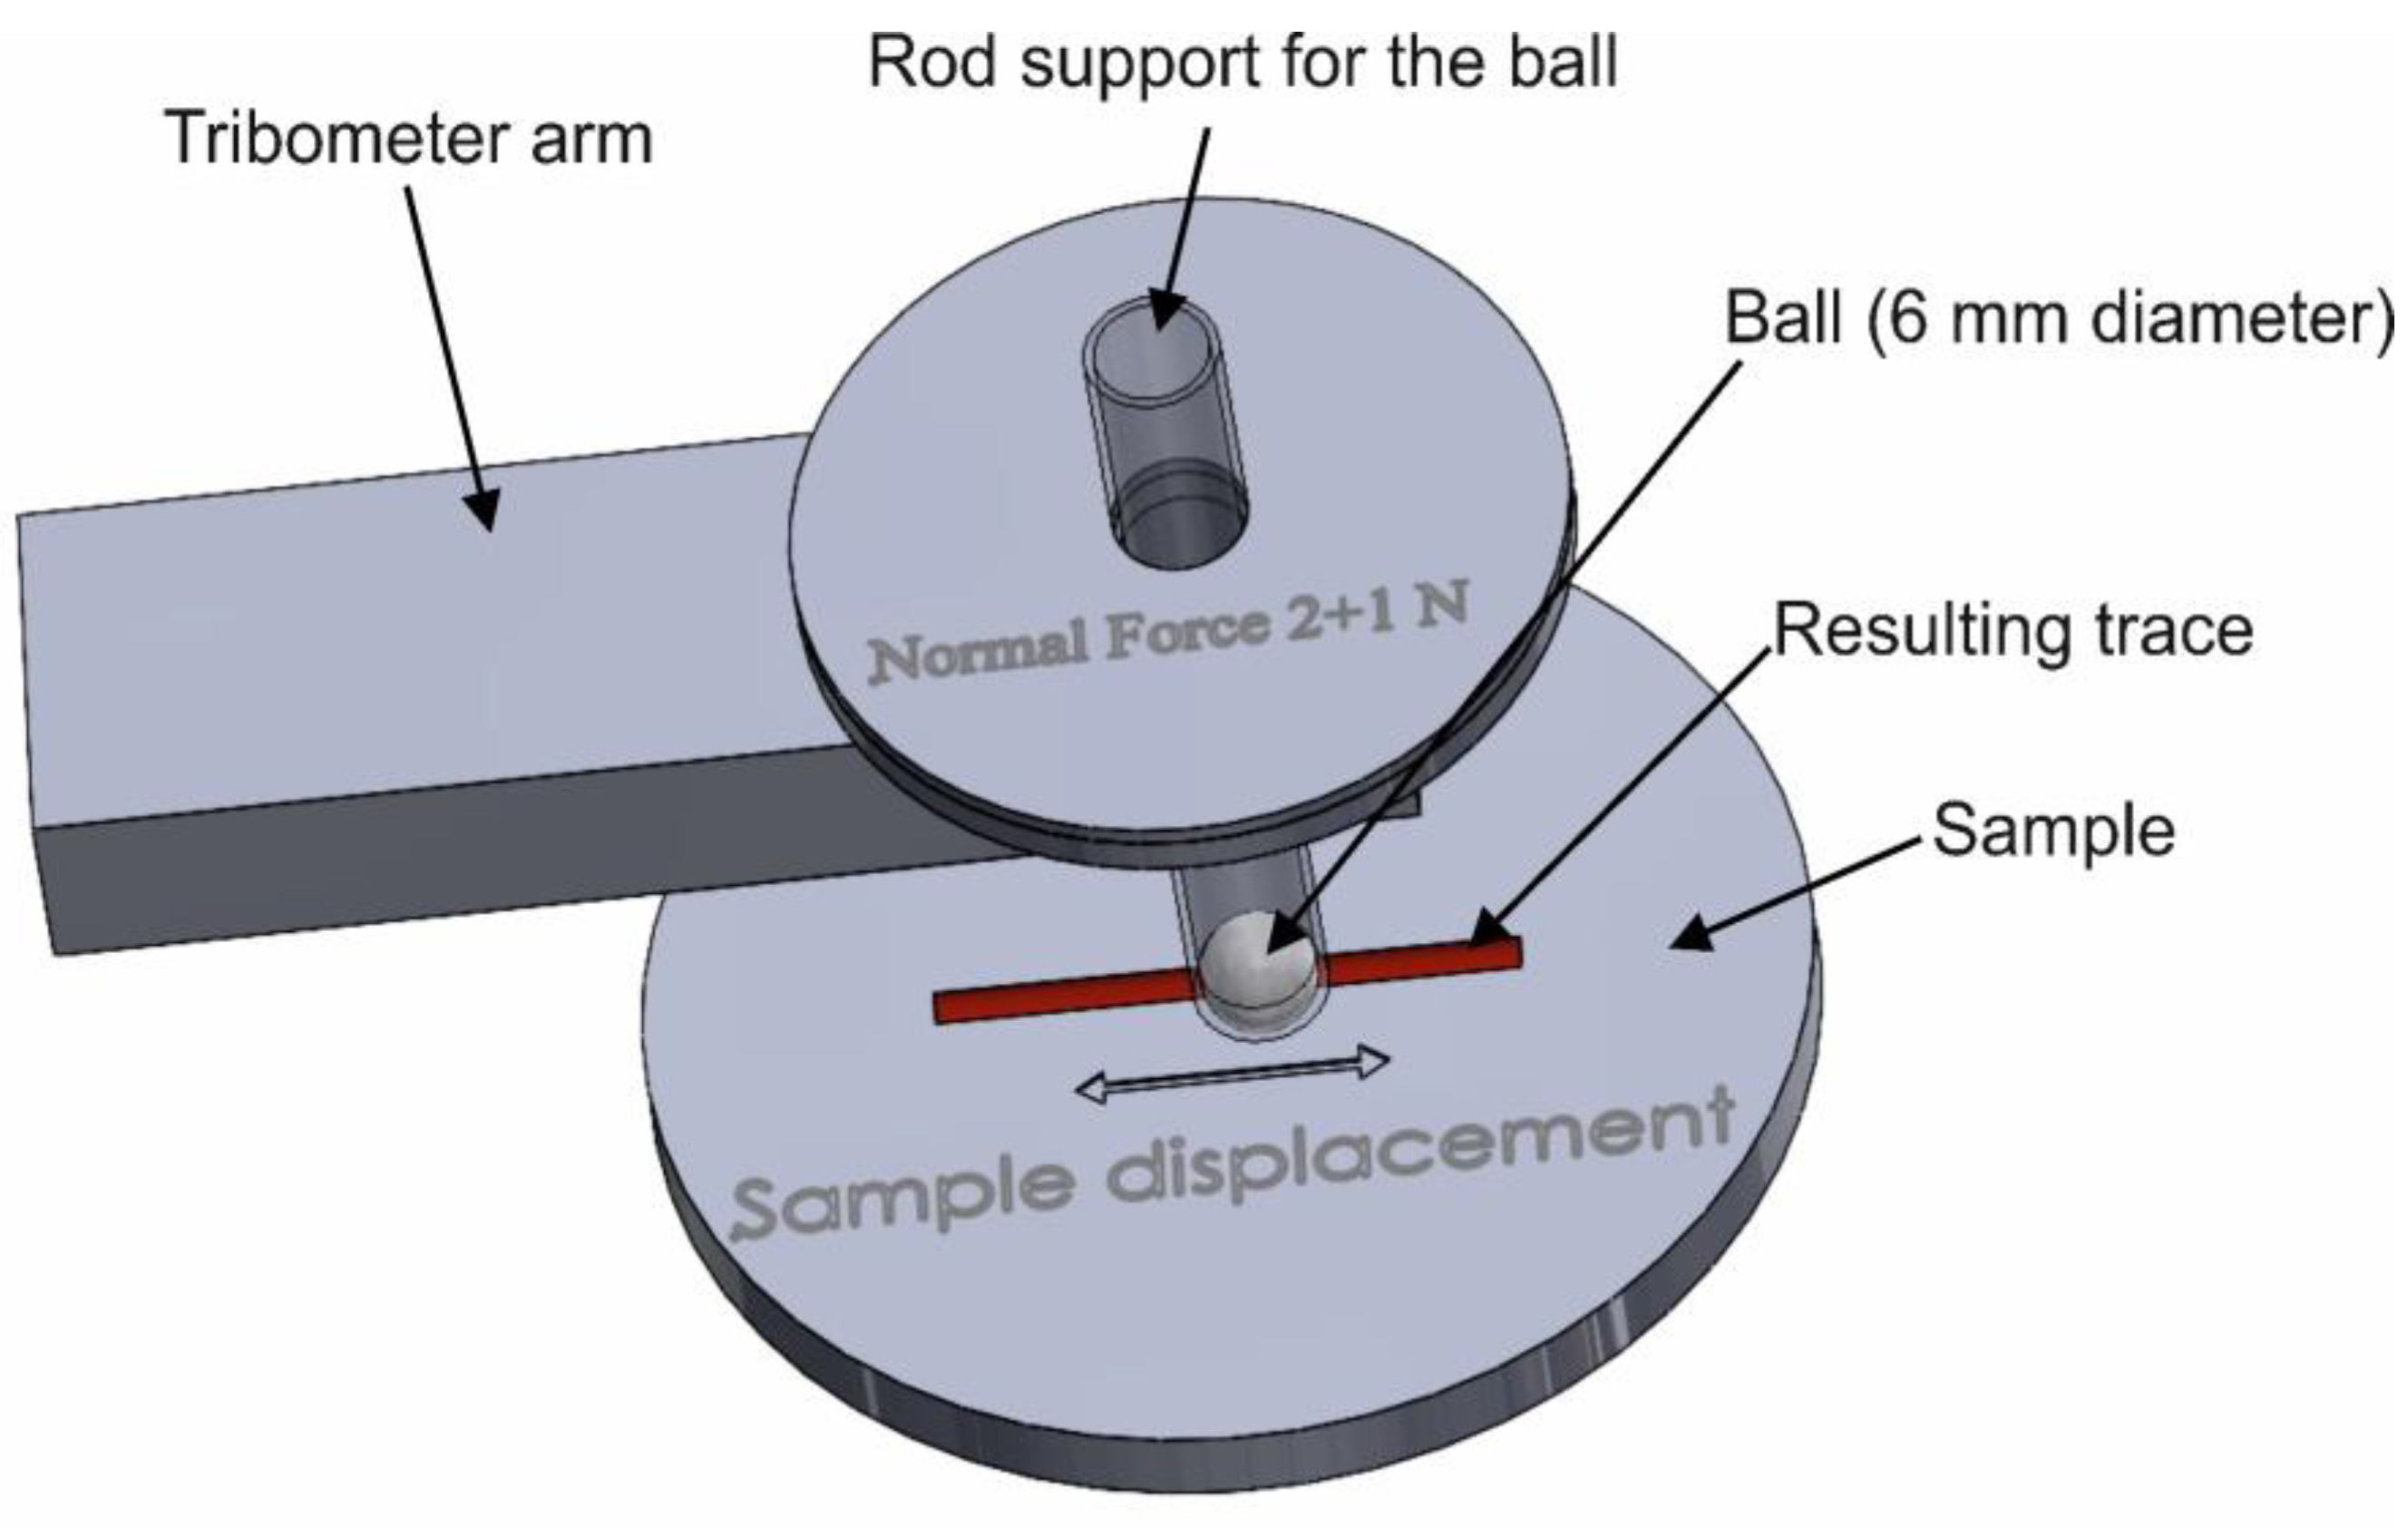
2.3. Wear Measurement
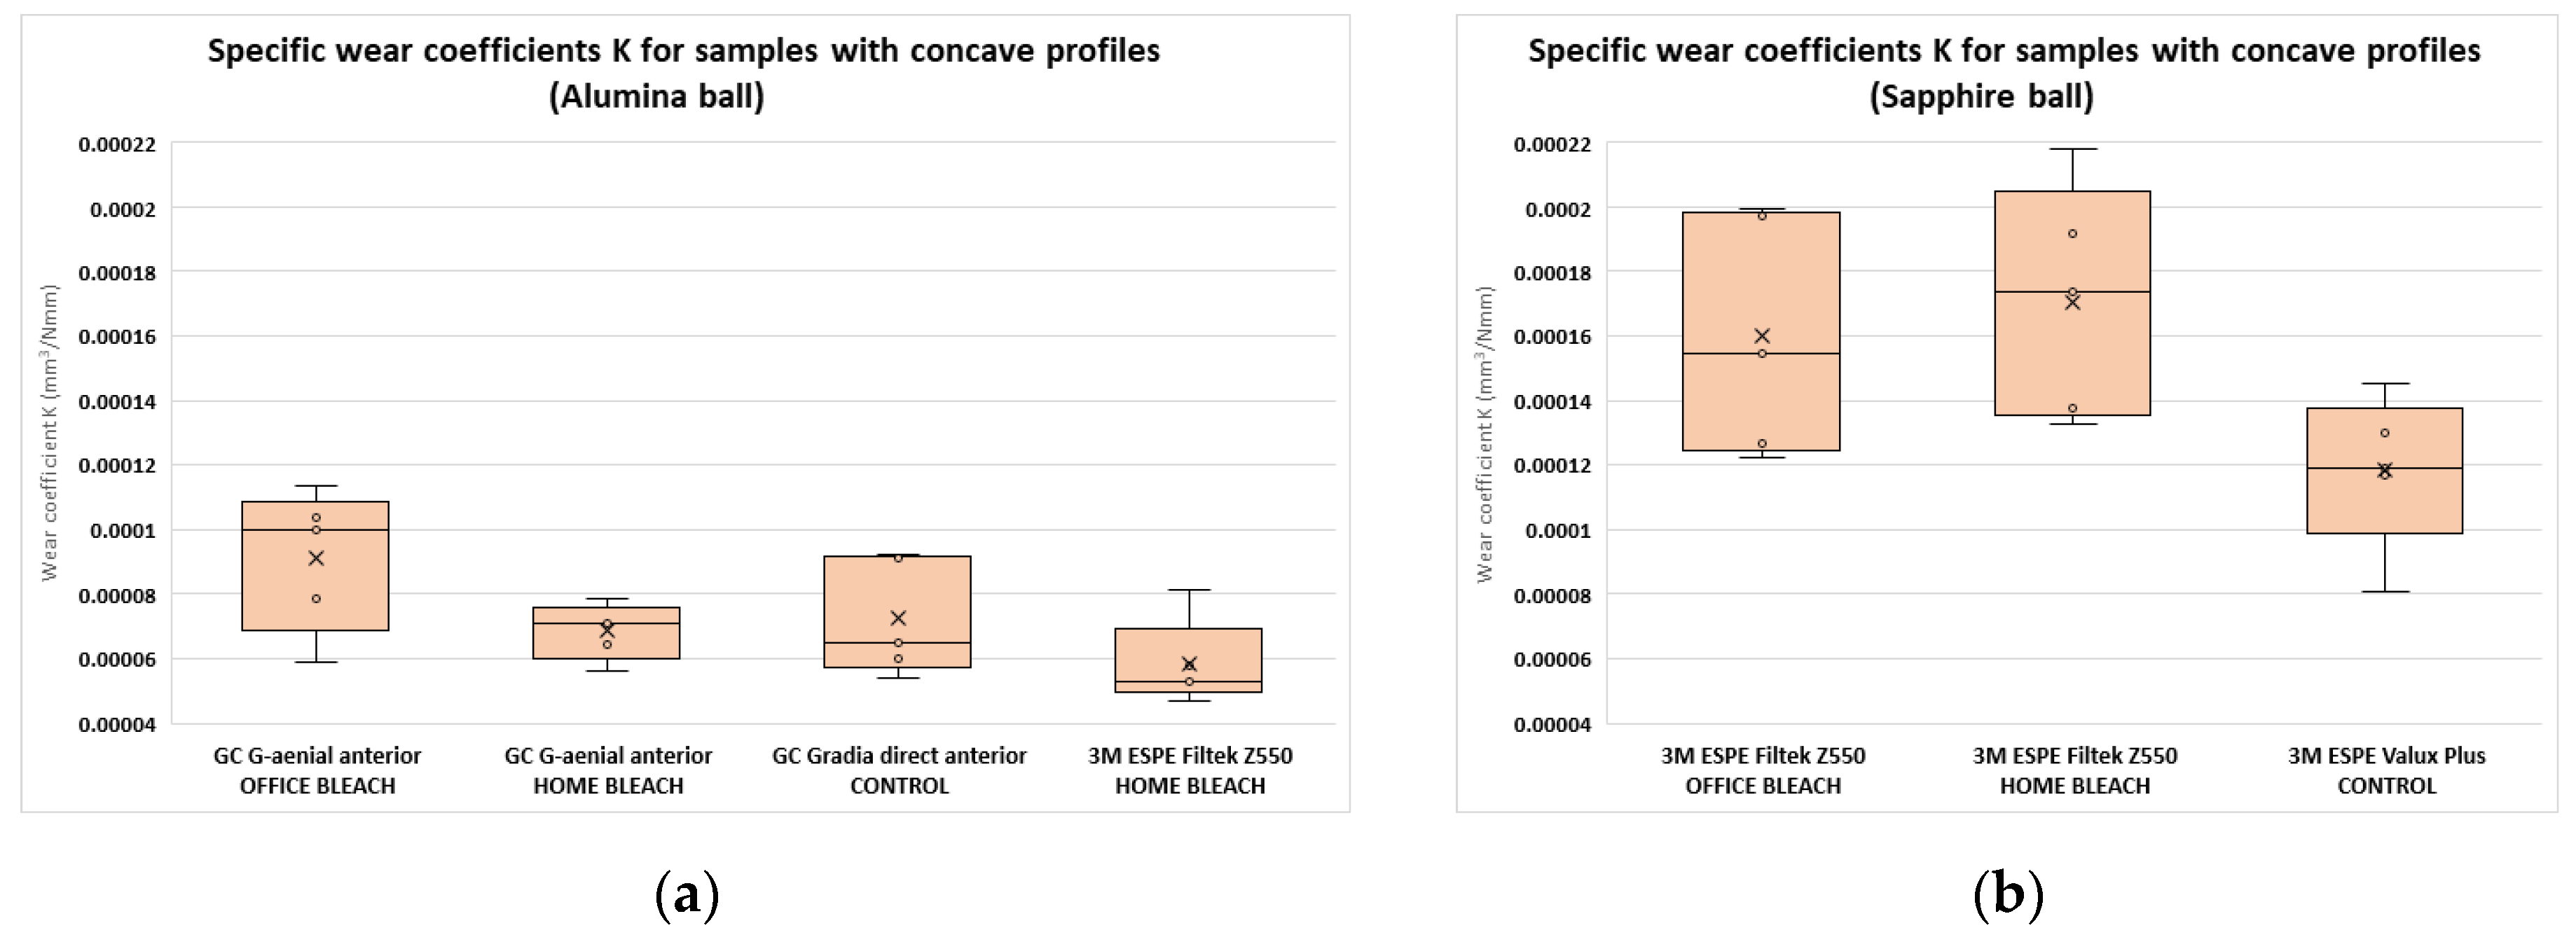
Specific Wear Coefficients Analysis
2.4. Scanning Electron Microscopy Analysis
2.5. Statistical Analysis
3. Results
3.1. Alumina Ball Analysis
3.1.1. Composite Measurements for Alumina Ball
3.1.2. Bleaching Protocol Measurements for Alumina Ball
3.2. Sapphire Ball Analysis
3.2.1. Composite Measurements for Sapphire Ball
3.2.2. Bleaching Protocols Measurements for Sapphire Ball
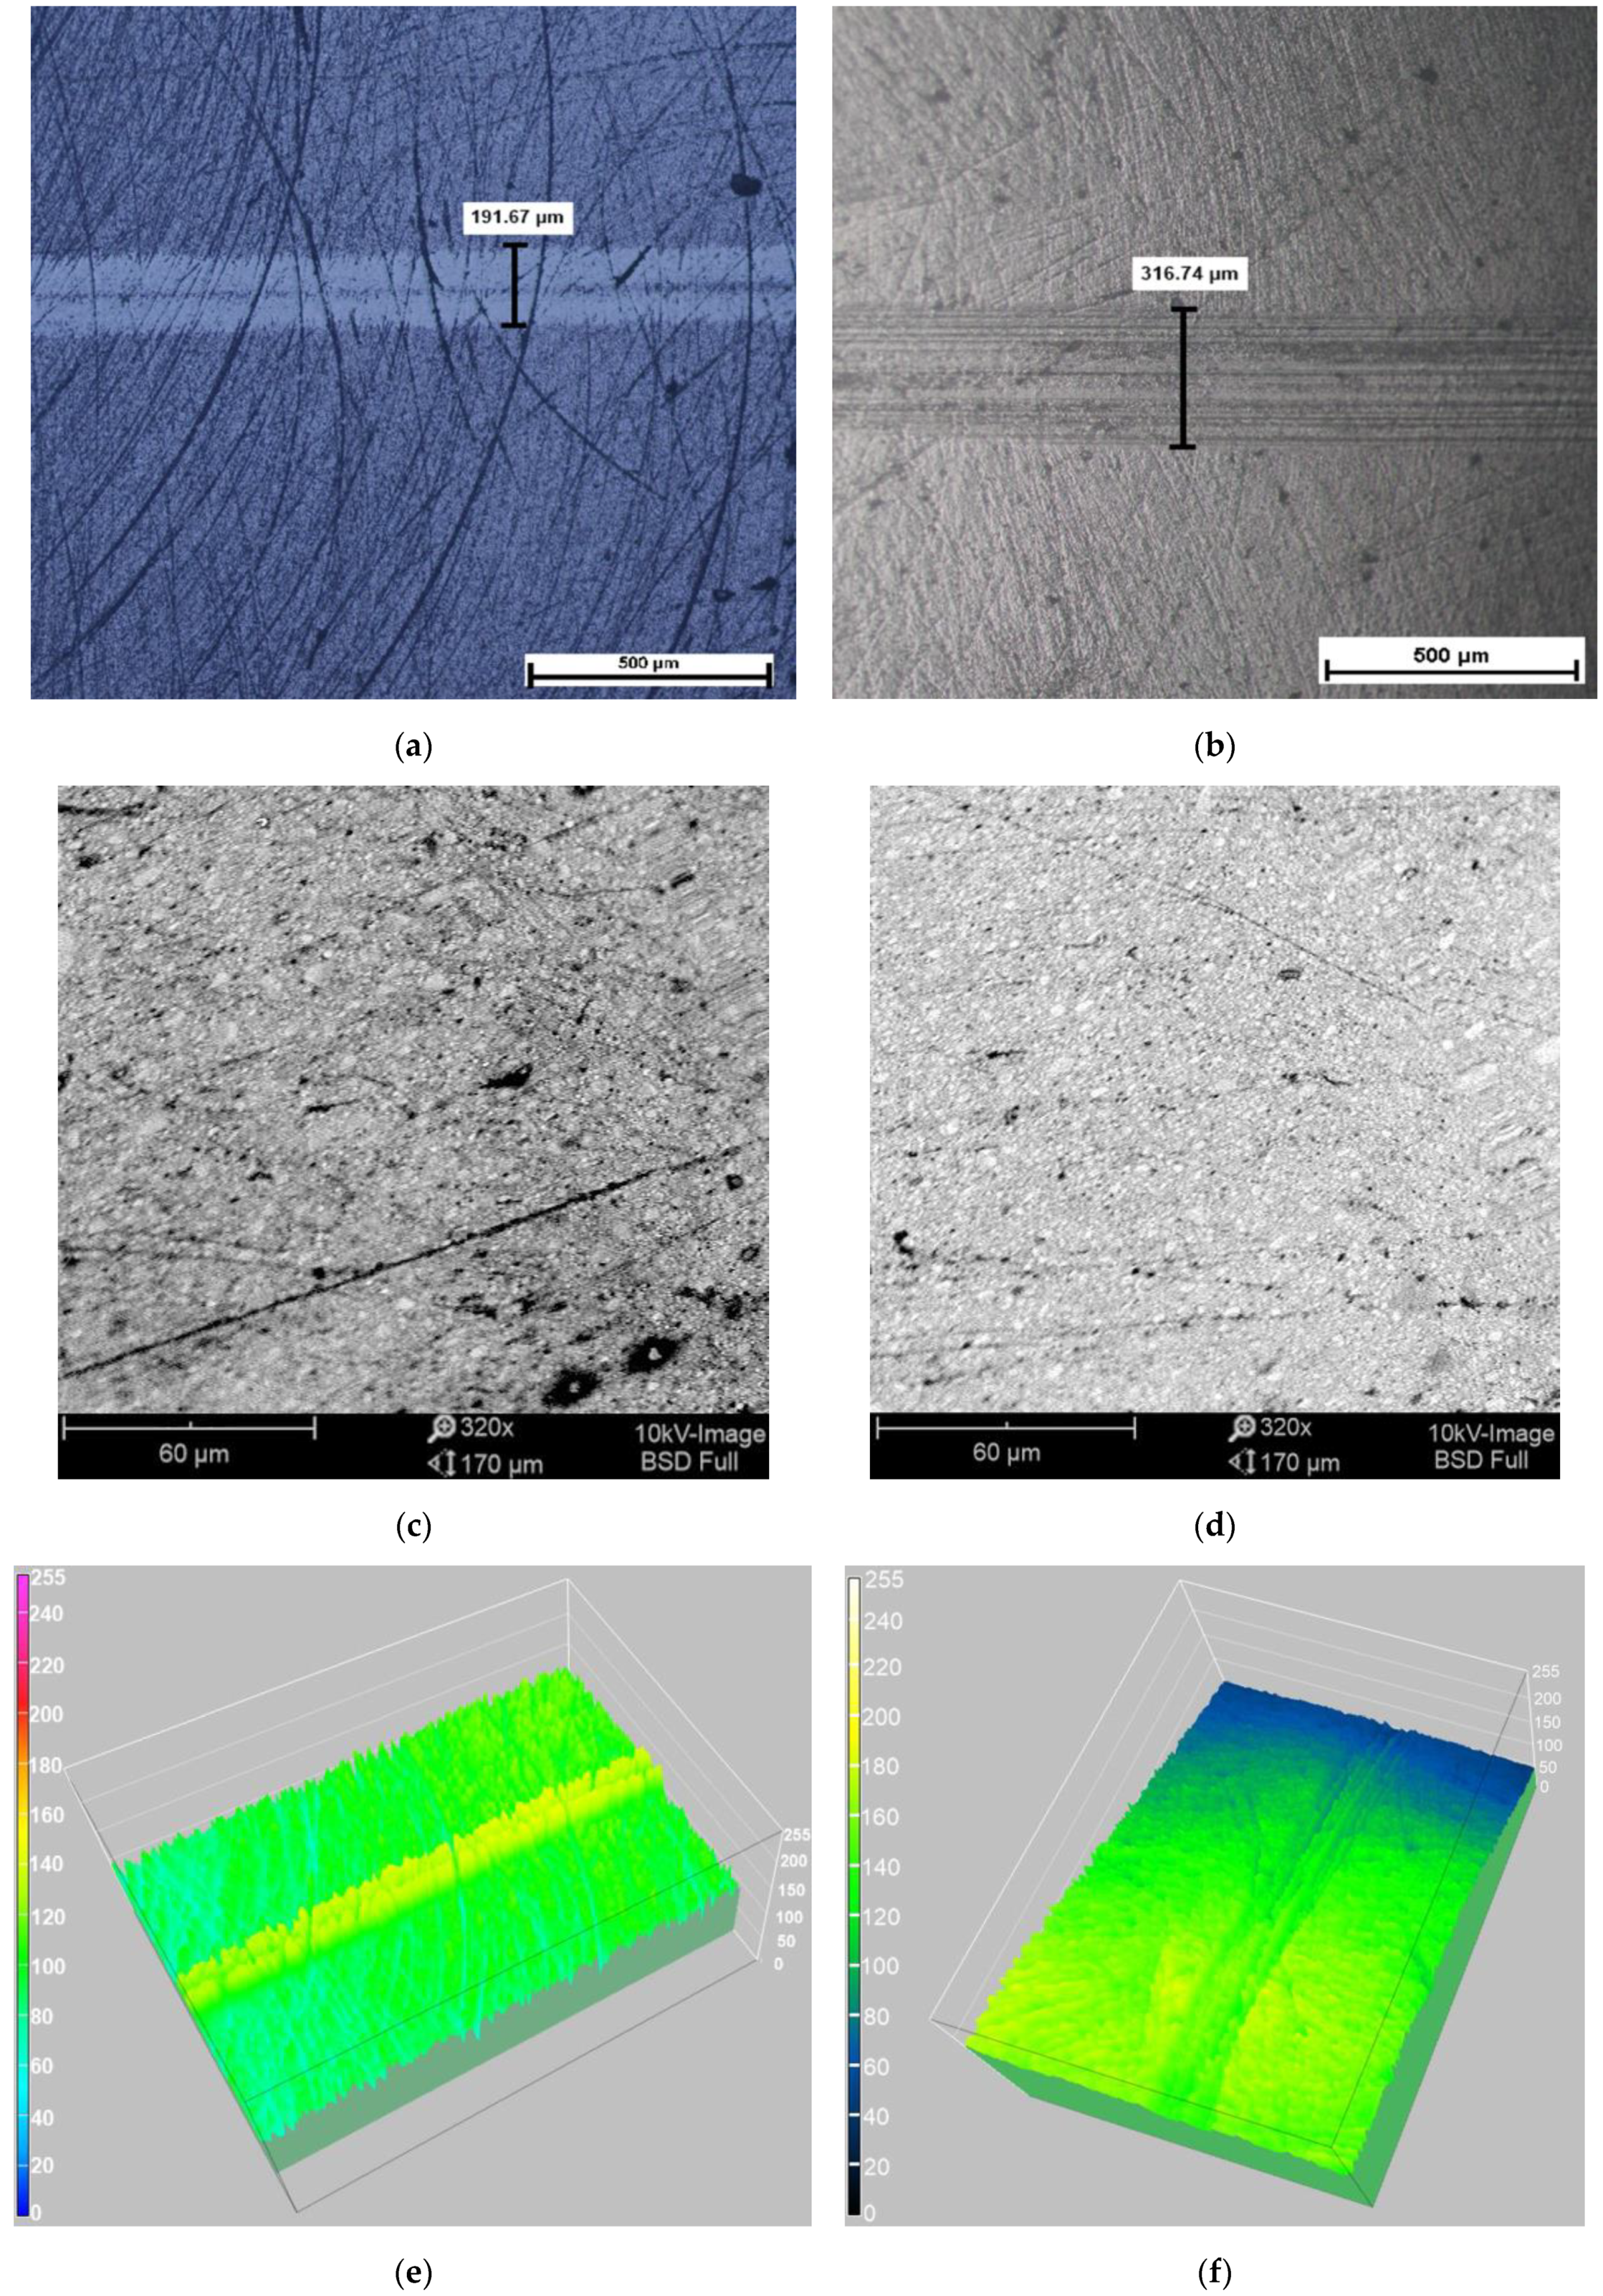
3.3. SEM and Optical Microscopy Results
4. Discussion
5. Conclusions
Author Contributions
Funding
Institutional Review Board Statement
Informed Consent Statement
Data Availability Statement
Conflicts of Interest
References
- Șaramet, V.; Meleșcanu-Imre, M.; Țâncu, A.M.C.; Albu, C.C.; Ripszky-Totan, A.; Pantea, M. Molecular Interactions between Saliva and Dental Composites Resins: A Way Forward. Materials 2021, 14, 2537. [Google Scholar] [CrossRef]
- Pratap, B.; Gupta, R.K.; Bhardwaj, B.; Nag, M. Resin based restorative dental materials: Characteristics and future perspectives. Jpn. Dent. Sci. Rev. 2019, 55, 126–138. [Google Scholar] [CrossRef]
- Hasanain, F.A.; Nassar, H.M.; Ajaj, R.A. Effect of Light Curing Distance on Microhardness Profiles of Bulk-Fill Resin Composites. Polymers 2022, 14, 528. [Google Scholar] [CrossRef]
- Ferracane, J.L.; Pfeifer, C.S.; Hilton, T.J. Microstructural Features of Current Resin Composite Materials. Curr. Oral Health Rep. 2014, 1, 205–212. [Google Scholar] [CrossRef]
- van Dijken, J.W.; Pallesen, U. Posterior bulk-filled resin composite restorations: A 5-year randomized controlled clinical study. J. Dent. 2016, 51, 29–35. [Google Scholar] [CrossRef]
- Zhou, X.; Huang, X.; Li, M.; Peng, X.; Wang, S.; Zhou, X.; Cheng, L. Development and status of resin composite as dental restorative materials. J. Appl. Polym. Sci. 2019, 136, 48180. [Google Scholar] [CrossRef]
- Jafarpour, D.; Ferooz, R.; Ferooz, M.; Bagheri, R. Physical and mechanical properties of bulk-fill, conventional, and flowable resin composites stored dry and wet. Int. J. Dent. 2022, 10, 7946239. [Google Scholar] [CrossRef] [PubMed]
- Balagopal, S.; Geethapriya, N.; Anisha, S.; Hemasathya, B.A.; Vandana, J. Comparative evaluation of the degree of conversion of four different composites polymerized using ultrafast photopolymerization technique: An in vitro study. J. Conserv. Dent. 2021, 24, 77–82. [Google Scholar] [CrossRef] [PubMed]
- Peris, A.R.; Mitsui, F.H.; Amaral, C.M.; Ambrosano, G.M.; Pimenta, L.A. The effect of composite type on microhardness when using quartz-tungsten-halogen (Qth) or Led lights. Oper. Dent. 2005, 30, 649–654. [Google Scholar]
- Abouelmagd, D.M.; Basheer, R.R. Microhardness Evaluation of Microfilled Versus Nanofilled Resin Composite After Exposure to Acidic Drinks. J. Int. Soc. Prev. Community Dent. 2022, 12, 353–359. [Google Scholar] [PubMed]
- Scribante, A.; Massironi, S.; Pieraccini, G.; Vallittu, P.; Lassila, L.; Sfondrini, M.F.; Gandini, P. Effects of nanofillers on mechanical properties of fiber-reinforced composites polymerized with light-curing and additional postcuring. J. Appl. Biomater. Funct. Mater. 2015, 13, e296–e299. [Google Scholar] [CrossRef] [PubMed]
- Cunha, D.A.; Rodrigues, N.S.; Souza, L.C.; Lomonaco, D.; Rodrigues, F.P.; Degrazia, F.W.; Collares, F.M.; Sauro, S.; Saboia, V.P.A. Physicochemical and microbiological assessment of an experimental composite doped with triclosan-loaded halloysite nanotubes. Materials 2018, 11, 1080. [Google Scholar] [CrossRef] [PubMed]
- Scribante, A.; Bollardi, M.; Chiesa, M.; Poggio, C.; Colombo, M. Flexural properties and elastic modulus of different esthetic restorative materials: Evaluation after exposure to acidic drink. BioMed Res. Int. 2019, 2019, 5109481. [Google Scholar] [CrossRef] [PubMed]
- Ehrmann, E.; Medioni, E.; Brulat-Bouchard, N. Finishing and polishing effects of multiblade burs on the surface texture of 5 resin composites: Microhardness and roughness testing. Restor. Dent. Endod. 2019, 44, e1. [Google Scholar] [CrossRef]
- Babina, K.; Polyakova, M.; Sokhova, I.; Doroshina, V.; Arakelyan, M.; Novozhilova, N. The Effect of Finishing and Polishing Sequences on The Surface Roughness of Three Different Nanocomposites and Composite/Enamel and Composite/Cementum Interfaces. Nanomaterials 2020, 10, 1339. [Google Scholar] [CrossRef]
- Luong, M.N.; Otsuki, M.; Shimada, Y.; Ei, T.Z.; Sumi, Y.; Tagami, J. Effect of lights with various wavelengths on bleaching by 30% hydrogen peroxide. Lasers Med. Sci. 2019, 34, 901–906. [Google Scholar] [CrossRef] [PubMed]
- Oliveira, P.H.C.; Oliveira, L.H.C.; Oliveira, M.R.C.; Moriyama, C.; de Paula, E.; de Vito Moraes, A.G.; De Melo Deanna, A.; Zanin, F.A.A.; Gomes, A.O.; Brugnera Junior, A.; et al. In Vitro Evaluation of the Effectiveness of Dental Bleaching with Carbamide Peroxide and Violet Light. Photobiomodul. Photomed. Laser Surg. 2021, 39, 535–543. [Google Scholar]
- Albanai, S.R.; Gillam, D.G.; Taylor, P.D. An overview on the Effects of 10% and 15% Carbamide Peroxide and its Relationship to Dentine Sensitivity. Eur. J. Prosthodont. Restor. Dent. 2015, 23, 50–55. [Google Scholar]
- Maran, B.M.; Matos, T.P.; de Castro, A.D.S.; Vochikovski, L.; Amadori, A.L.; Loguercio, A.D.; Reis, A.; Berger, S.B. In-office bleaching with low/medium vs. high concentrate hydrogen peroxide: A systematic review and meta-analysis. J. Dent. 2020, 103, 103499. [Google Scholar] [CrossRef]
- Khashashneh, M.; Ratnayake, J.; Choi, J.J.E.; Mei, L.; Lyons, K.; Brunton, P. The Effect of 10% Carbamide Peroxide Dental Bleaching on the Physical Properties of Invisalign Aligners: An In Vitro Study. Materials 2023, 16, 4125. [Google Scholar] [CrossRef]
- Korać, S.; Ajanović, M.; Tahmiščija, I.; Džanković, A.; Konjhodžić, A.; Gavranović-Glamoč, A.; Hasić-Branković, L. The Effect of Bleaching on the Basic Colour and Discoloration Susceptibility of Dental Composites. Acta Med. Acad. 2021, 50, 397–405. [Google Scholar] [CrossRef] [PubMed]
- Turker, S.B.; Biskin, T. Effect of three bleaching agents on the surface properties of three different esthetic restorative materials. J. Prosthet. Dent. 2003, 89, 466–473. [Google Scholar] [CrossRef] [PubMed]
- Malkondu, O.; Yurdaguven, H.; Say, E.; Kazazoglu, E.; Soyman, M. Effect of Bleaching on Microhardness of Esthetic Restorative Materials. Oper. Dent. 2011, 36, 177–186. [Google Scholar] [CrossRef] [PubMed]
- Hannig, C.; Duong, S.; Becker, K.; Brunner, E.; Kahler, E.; Attin, T. Effect of bleaching on subsurface microhardness of composite and a polyacid modified composite. Dent. Mater. 2007, 23, 198–203. [Google Scholar] [CrossRef] [PubMed]
- Turssi, C.P.; De Moraes Purquerio, B.; Serra, M.C. Wear of dental resin composites: Insights into underlying processes and assessment methods—A review. J. Biomed. Mater. Res. B Appl. Biomater. 2003, 65, 280–285. [Google Scholar] [CrossRef] [PubMed]
- Hasani Tabatabaei, M.; Sheikhzadeh, S.; Ghasemi Monfared Rad, H.; Beygi, A.; Bagheri, H. Effect of In-Office Carbamide Peroxide-Based Tooth Bleaching System on Wear Resistance of Silorane-Based and Methacrylate-Based Dental Composites. J. Dent. 2015, 12, 557–562. [Google Scholar]
- Jandt, K.D.; Sigusch, B.W. Future perspectives of resin-based dental materials. Dent. Mater. 2009, 25, 1001–1006. [Google Scholar] [CrossRef]
- Ghiorghe, C.A.; Stoleriu, S.; Pancu, G.; Topoliceanu, C.; Sandu, A.V.; Andrian, S. Changes of the Mineral Structure in the Enamel Adjacent to Three Types of Restorative Materials after Immersion in Hydrochloric Acid. Rev. Chim. 2014, 65, 1021–1025. [Google Scholar]
- Suzuki, T.; Kyoizumi, H.; Finger, W.J.; Kanehira, M.; Endo, T.; Utterodt, A.; Hisamitsu, H.; Komatsu, M. Resistance of nanofill and nanohybrid resin composites to toothbrush abrasion with calcium carbonate slurry. Dent. Mater. J. 2009, 28, 708–716. [Google Scholar] [CrossRef]
- Ilie, N.; Hickel, R. Investigations on mechanical behaviour of dental composites. Clin. Oral Investig. 2009, 13, 427–438. [Google Scholar] [CrossRef]
- Ilie, N.; Hilton, T.J.; Heintze, S.D.; Hickel, R.; Watts, D.C.; Silikas, N.; Stansbury, J.W.; Cadenaro, M.; Ferracane, J.L. Academy of Dental Materials guidance-Resin composites: Part I-Mechanical properties. Dent. Mater. 2017, 33, 880–894. [Google Scholar] [CrossRef] [PubMed]
- Osiewicz, M.A.; Werner, A.; Pytko-Polonczyk, J.; Roeters, F.J.; Kleverlaan, C.J. Contact- and contact-free wear between various resin composites. Dent. Mater. 2015, 31, 134–140. [Google Scholar] [CrossRef] [PubMed]
- Finlay, N.; Hahnel, S.; Dowling, A.H.; Fleming, G.J.P. The in vitro wear behavior of experimental resin-based composites derived from a commercial formulation. Dent. Mater. 2013, 29, 365–374. [Google Scholar] [CrossRef]
- Eden, E.; Cogulu, D.; Attin, T. The effect of finishing and polishing systems on surface roughness, microhardness and microleakage of a nanohybrid composite. J. Int. Dent. Med. Res. 2012, 5, 155–160. [Google Scholar]
- Alzraikat, H.; Burrow, M.F.; Maghaireh, G.A.; Taha, N.A. Nanofilled Resin Composite Properties and Clinical Performance: A Review. Oper. Dent. 2018, 43, E173–E190. [Google Scholar] [CrossRef]
- Engelhardt, F.; Hahnel, S.; Preis, V.; Rosentritt, M. Comparison of flowable bulk-fill and flowable resin-based composites: An in vitro analysis. Clin. Oral Investig. 2016, 20, 2123–2130. [Google Scholar] [CrossRef] [PubMed]
- Osiewicz, M.A.; Werner, A.; Roeters, F.J.M.; Kleverlaan, C.J. Wear of direct resin composites and teeth: Considerations for oral rehabilitation. Eur. J. Oral Sci. 2019, 127, 156–161. [Google Scholar] [CrossRef]
- Ludovichetti, F.S.; Trindade, F.Z.; Werner, A.; Kleverlaan, C.J.; Fonseca, R.G. Wear resistance and abrasiveness of CAD-CAM monolithic materials. J. Prosthet. Dent. 2018, 120, 318.e1–318.e8. [Google Scholar] [CrossRef] [PubMed]
- Osiewicz, M.A.; Werner, A.; Roeters, F.J.M.; Kleverlaan, C.J. Wear of bulk-fill resin composites. Dent. Mater. 2022, 38, 549–553. [Google Scholar] [CrossRef]
- Gwon, B.; Bae, E.B.; Lee, J.J.; Cho, W.T.; Bae, H.Y.; Choi, J.W.; Huh, J.B. Wear characteristics of dental ceramic CAD/CAM materials opposing various dental composite resins. Materials 2019, 12, 1839. [Google Scholar] [CrossRef]
- Tsujimoto, A.; Barkmeier, W.W.; Fischer, N.G.; Nojiri, K.; Nagura, Y.; Takamizawa, T.; Latta, M.A.; Miazaki, M. Wear of resin composites: Current insights into underlying mechanisms, evaluation methods and influential factors. Jpn. Dent. Sci. Rev. 2018, 54, 76–87. [Google Scholar] [CrossRef] [PubMed]
- Ilie, N.; Rencz, A.; Hickel, R. Investigations towards nano-hybrid resin-based composites. Clin. Oral Investig. 2013, 17, 185–193. [Google Scholar] [CrossRef] [PubMed]
- Dionysopoulos, D.; Gerasimidou, O. Wear of contemporary dental composite resin restorations: A literature review. Restor. Dent. Endod. 2021, 46, e18. [Google Scholar] [CrossRef]
- Oliveira, G.U.; Mondelli, R.F.; Charantola Rodrigues, M.; Franco, E.B.; Ishikiriama, S.K.; Wang, L. Impact of filler size and distribution on roughness and wear of composite resin after simulated toothbrushing. J. Appl. Oral Sci. 2012, 20, 510–516. [Google Scholar] [CrossRef]
- Popov, V.L. Is tribology approaching its golden age? Grand challenges in engineering education and tribological research. Front. Mech. Eng. 2018, 4, 16. [Google Scholar] [CrossRef]
- Torres, C.; Augusto, M.G.; Mathias-Santamaria, I.F.; Di Nicoló, R.; Borges, A.B. Pure ormocer vs methacrylate composites on posterior teeth: A double-blinded randomized clinical trial. Oper. Dent. 2020, 45, 359–367. [Google Scholar] [CrossRef] [PubMed]
- Asadian, F.; Hoseini, A.P.; Ahmadian, L.; Rafeie, N.; Rezaei, S.; Moradi, Z. In vitro attrition wear resistance of four types of paste-like bulk-fill composite resins. BMC Oral Health 2022, 22, 360. [Google Scholar] [CrossRef]
- Addy, M.; Shellis, R.P. Interaction between attrition, abrasion and erosion in tooth wear. Monogr. Oral Sci. 2006, 20, 17–31. [Google Scholar]
- Ujiie, M.; Tsujimoto, A.; Barkmeier, W.W.; Jurado, C.A.; Villalobos-Tinoco, J.; Takamizawa, T.; Latta, M.A.; Miyazaki, M. Comparison of occlusal wear between bulk-fill and conventional flowable resin composites. Am. J. Dent. 2020, 33, 74–78. [Google Scholar]
- Shimokawa, C.; Giannini, M.; André, C.B.; Sahadi, B.O.; Faraoni, J.J.; Palma-Dibb, R.G.; Soares, C.J.; Price, R.B. In Vitro Evaluation of Surface Properties and Wear Resistance of Conventional and Bulk-fill Resin-based Composites After Brushing with a Dentifrice. Oper. Dent. 2019, 44, 637–647. [Google Scholar] [CrossRef]
- Asadian, F.; Shahidi, Z.; Moradi, Z. Evaluation of Wear Properties of Four Bulk-Fill Composites: Attrition, Erosion, and Abrasion. BioMed Res. Int. 2021, 2021, 8649616. [Google Scholar] [CrossRef] [PubMed]
- Naser-Alavi, F.; Salari, A.; Moein, N.; Talebzadeh, A. Effect of oral irrigation device and its solution type on the surface roughness and topography of Bulk-fill composite resins. J. Clin. Exp. Dent. 2022, 14, e123–e130. [Google Scholar] [CrossRef]
- Rezaei, M.; Aliasghar, E.; Rezvani, M.B.; Chiniforush, N.; Moradi, Z. Effect of Er: YAG Laser on Microtensile Bond Strength of Bleached Dentin to Composite. J. Lasers Med. Sci. 2019, 10, 117–124. [Google Scholar] [CrossRef] [PubMed]
- Ho, T.K.; Satterthwaite, J.D.; Silikas, N. The effect of chewing simulation on surface roughness of resin composite when opposed by zirconia ceramic and lithium disilicate ceramic. Dent. Mater. 2018, 34, e15–e24. [Google Scholar] [CrossRef]
- O’Neill, C.; Kreplak, L.; Rueggeberg, F.A.; Labrie, D.; Shimokawa, C.A.K.; Price, R.B. Effect of tooth brushing on gloss retention and surface roughness of five bulk-fill resin composites. J. Esthet. Restor. Dent. 2018, 30, 59–69. [Google Scholar] [CrossRef]
- AlAli, M.; Silikas, N.; Satterthwaite, J. The Effects of Toothbrush Wear on the Surface Roughness and Gloss of Resin Composites with Various Types of Matrices. Dent. J. 2021, 9, 8. [Google Scholar] [CrossRef] [PubMed]
- Ardu, S.; Braut, V.; Uhac, I.; Benbachir, N.; Feilzer, A.J.; Krejci, I. Influence of mechanical and chemical degradation on surface gloss of resin composite materials. Am. J. Dent. 2009, 22, 264–268. [Google Scholar]
- Schubert, A.; Wassmann, T.; Holtappels, M.; Kurbad, O.; Krohn, S.; Buergers, R. Predictability of Microbial Adhesion to Dental Materials by Roughness Parameters. Coatings 2019, 9, 456. [Google Scholar] [CrossRef]
- Rajan, V.V.; Ganapathy, D.; Sheeba, P.S.; Kanniappan, N. Effects of tooth brushing on wear, surface roughness, and color stability of composite resins—A review. J. Pharm. Res. 2018, 12, 95–102. [Google Scholar]
- Pieniak, D.; Walczak, A.; Walczak, M.; Przystupa, K.; Niewczas, A.M. Hardness and Wear Resistance of Dental Biomedical Nanomaterials in a Humid Environment with Non-Stationary Temperatures. Materials 2020, 13, 1255. [Google Scholar] [CrossRef]
- Kontonasaki, E.; Rigos, A.E.; Ilia, C.; Istantsos, T. Monolithic Zirconia: An Update to Current Knowledge. Optical Properties, Wear, and Clinical Performance. Dent. J. 2019, 7, 90. [Google Scholar] [CrossRef]
- Matsumura, K.; Sato, Y.; Kitagawa, N.; Shichita, T.; Kawata, D.; Ishikawa, M. Influence of denture surface roughness and host factors on dental calculi formation on dentures: A cross-sectional study. BMC Oral Health 2018, 18, 78. [Google Scholar] [CrossRef]
- Oja, J.; Lassila, L.; Vallittu, P.K.; Garoushi, S. Effect of Accelerated Aging on Some Mechanical Properties and Wear of Different Commercial Dental Resin Composites. Materials 2021, 14, 2769. [Google Scholar] [CrossRef]
- Fang, M.; Zhang, N.; Huang, M.; Lu, B.; Lamnawar, K.; Liu, C.; Shen, C. Effects of Hydrothermal Aging of Carbon Fiber Reinforced Polycarbonate Composites on Mechanical Performance and Sand Erosion Resistance. Polymers 2020, 12, 2453. [Google Scholar] [CrossRef]
- Kruzic, J.J.; Arsecularatne, J.A.; Tanaka, C.B.; Hoffman, M.J.; Cesar, P.F. Recent advances in understanding the fatigue and wear behavior of dental composites and ceramics. J. Mech. Behav. Biomed. Mater. 2018, 8, 504–533. [Google Scholar] [CrossRef]
- Egilmez, F.; Ergun, G.; Cekic-Nagas, I.; Vallittu, P.K.; Lassila, L.V.J. Does artificial aging affect mechanical properties of CAD/CAM composite materials. J. Prosthodont. Res. 2018, 62, 65–74. [Google Scholar] [CrossRef]
- Heintze, S.D.; Reichl, F.X.; Hickel, R. Wear of dental materials: Clinical significance and laboratory wear simulation methods -A review. Dent. Mater. J. 2019, 38, 343–353. [Google Scholar] [CrossRef] [PubMed]
- Lanza, A.; Ruggiero, A.; Sbordone, L. Tribology and dentistry: A commentary. Lubricants 2019, 7, 52. [Google Scholar] [CrossRef]
- Yadav, S.; Gangwar, S. A critical evaluation of tribological interaction for restorative materials in dentistry. Int. J. Polym. Mater. 2019, 68, 1005–1019. [Google Scholar] [CrossRef]
- Borgia, E.; Baron, R.; Borgia, J.L. Quality and Survival of Direct Light-Activated Composite Resin Restorations in Posterior Teeth: A 5- to 20-Year Retrospective Longitudinal Study. J. Prosthodont. 2019, 28, e195–e203. [Google Scholar] [CrossRef]
- Arbildo-Vega, H.I.; Lapinska, B.; Panda, S.; Lamas-Lara, C.; Khan, A.S.; Lukomska-Szymanska, M. Clinical Effectiveness of Bulk-Fill and Conventional Resin Composite Restorations: Systematic Review and Meta-Analysis. Polymers 2020, 12, 1786. [Google Scholar] [CrossRef]
- Zhang, A.; Ye, N.; Aregawi, W.; Zhang, L.; Salah, M.; VanHeel, B.; Chew, H.P.; Fok, A.S.L. A Review of Mechano-Biochemical Models for Testing Composite Restorations. J. Dent. Res. 2021, 100, 1030–1038. [Google Scholar] [CrossRef]
- La Rosa, G.R.M.; Generali, L.; Bugea, C.; Ounsi, H.F.; Benyőcs, G.; Neelakantan, P.; Pedullà, E. Application of Tribology Concept in Dental Composites Field: A Scoping Review. J. Funct. Biomater. 2022, 13, 287. [Google Scholar] [CrossRef]
- Rodríguez, H.A.; Casanova, H. Effects of silica nanoparticles and silica-zirconia nanoclusters on tribological properties of dental resin composites. J. Nanotechnol. 2018, 2018, 7589051. [Google Scholar] [CrossRef]
- Vargas, S.; Estevez, M.; Hernandez, A.; Laiz, J.C.; Brostow, W.; Hagg Lobland, H.E.; Rodriguez, J.R. Hydroxyapatite based hybrid dental materials with controlled porosity and improved tribological and mechanical properties. Mater. Res. Innov. 2013, 17, 154–160. [Google Scholar] [CrossRef]
- Yadav, R.; Meena, A. Comparative investigation of tribological behavior of hybrid dental restorative composite materials. Ceram. Int. 2022, 48, 6698–6706. [Google Scholar] [CrossRef]
- Yadav, R.; Meena, A.; Patnaik, A. Tribological behavior of zinc oxide-hydroxyapatite particulates filled dental restorative composite materials. Polym. Compos. 2022, 43, 3029–3040. [Google Scholar] [CrossRef]
- Madeira, S.; Buciumeanu, M.; Nobre, D.; Carvalho, O.; Silva, F.S. Development of a novel hybrid Ti6Al4V-ZrO2 surface with high wear resistance by laser and hot pressing techniques for dental implants. J. Mech. Behav. Biomed. Mater. 2022, 136, 105508. [Google Scholar] [CrossRef]
- Bartolomeu, F.; Buciumeanu, M.; Pinto, E.; Alves, N.; Silva, F.S.; Carvalho, O.; Miranda, G. Wear behavior of Ti6Al4V biomedical alloys processed by selective laser melting, hot pressing and conventional casting. Trans. Nonferrous Met. Soc. China 2017, 27, 829–838. [Google Scholar] [CrossRef]
- Madeira, S.; Buciumeanu, M.; Carvalho, O.; Silva, F.S. Influence of sintering pressure on the microstructure and tribological properties of low temperature fast sintered hot-pressed Y-TZP. Ceram. Int. 2019, 45, 5883–5893. [Google Scholar] [CrossRef]
- d’Incau, E.; Couture, C.; Maureille, B. Human tooth wear in the past and the present: Tribological mechanisms, scoring systems, dental and skeletal compensations. Arch. Oral Biol. 2012, 57, 214–229. [Google Scholar] [CrossRef] [PubMed]
- Buciumeanu, M.; Faria, D.; Mesquita-Guimarães, J.; Silva, F.S. Tribological characterization of bioactive zirconia composite layers on zirconia structures. Ceram. Int. 2018, 44, 18663–18671. [Google Scholar] [CrossRef]
- Rodríguez-Rojas, F.; Borrero-López, O.; Sánchez-González, E.; Guiberteau, F. Effects of the test method on wear measurements in dental enamel/ceramic tribosystems. Ceram. Int. 2022, 48, 2744–2754. [Google Scholar] [CrossRef]
- Zhang, Y.; Lawn, B.R. Novel zirconia materials in dentistry. J. Dent. Res. 2018, 97, 140–147. [Google Scholar] [CrossRef]
- Borrero-Lopez, O.; Guiberteau, F.; Zhang, Y.; Lawn, B.R. Wear of ceramic-based dental materials. J. Mech. Behav. Biomed. Mater. 2019, 92, 144–151. [Google Scholar] [CrossRef]
- Sanchez-Gonzalez, E.; Pinilla-Cienfuegos, E.; Borrero-Lopez, O.; Rodríguez-Rojas, F.; Guiberteau, F. Contact damage of human dental enamel under cyclic axial loading with abrasive particles. J. Mech. Behav. Biomed. Mater. 2020, 102, 103512. [Google Scholar] [CrossRef] [PubMed]
- Kaidonis, J.A. Tooth wear: The view of the anthropologist. Clin. Oral Investig. 2008, 12, 21–26. [Google Scholar] [CrossRef]
- Levrini, L.; Di Benedetto, G.; Raspanti, M. Dental wear: A scanning electron microscope study. BioMed Res Int. 2014, 2014, 340425. [Google Scholar] [CrossRef]
- Mulic, A.; Ruud, A.; Stenhagen, I.R.; Bruzell, E.; Tulek, A. Deterioration of direct restorative materials under erosive conditions with impact of abrasion and attrition in vitro. Biomater. Investig. Dent. 2023, 10, 2202211. [Google Scholar] [CrossRef]


| Name of Composite (Producer) | Type of Composite | Composite Matrix | Fillers Content (%) Wag |
|---|---|---|---|
| G-aenial Anterior (GC Tokyo, Japan) | Microfilled | UDMA 1, dimethacrylate comonomers | Prepolymerized silica and strontium fluoride (76 wt%). |
| Gradia Direct Anterior (GC Tokyo, Japan) | UDMA 1, dimethacrylates, trimethacrylates | Silica and prepolymerized resin (73 wt%) | |
| Valux Plus (3M ESPE, Center St. Paul, MN, USA) | BIS-GMA 1, TEGDMA 1 | Zirconia/silica (66 wt%) | |
| Filtek Z550 (3M ESPE, Center St. Paul, MN, USA) | Nanohybrid | BIS-GMA 1, TEGDMA 1, UDMA 1, BIS-EMA 1, PEGDMA 1 | Silica-zirconia, non-agglomerated/non-aggregated silica particles (82 wt%) |
| Composite | GC G-Aenial Anterior | GC Gradia Direct Anterior | 3M ESPE Filtek Z550 | 3M ESPE Valux Plus | ||||
|---|---|---|---|---|---|---|---|---|
| Trace Width | ||||||||
| Group | Trace width (mean ± SD) | F(2,12)/ p * | Trace width (mean ± SD) | F(2,12)/ p * | Trace width (mean ± SD) | F(2,12)/ p * | Trace width (mean ± SD) | F(2,12)/ p * |
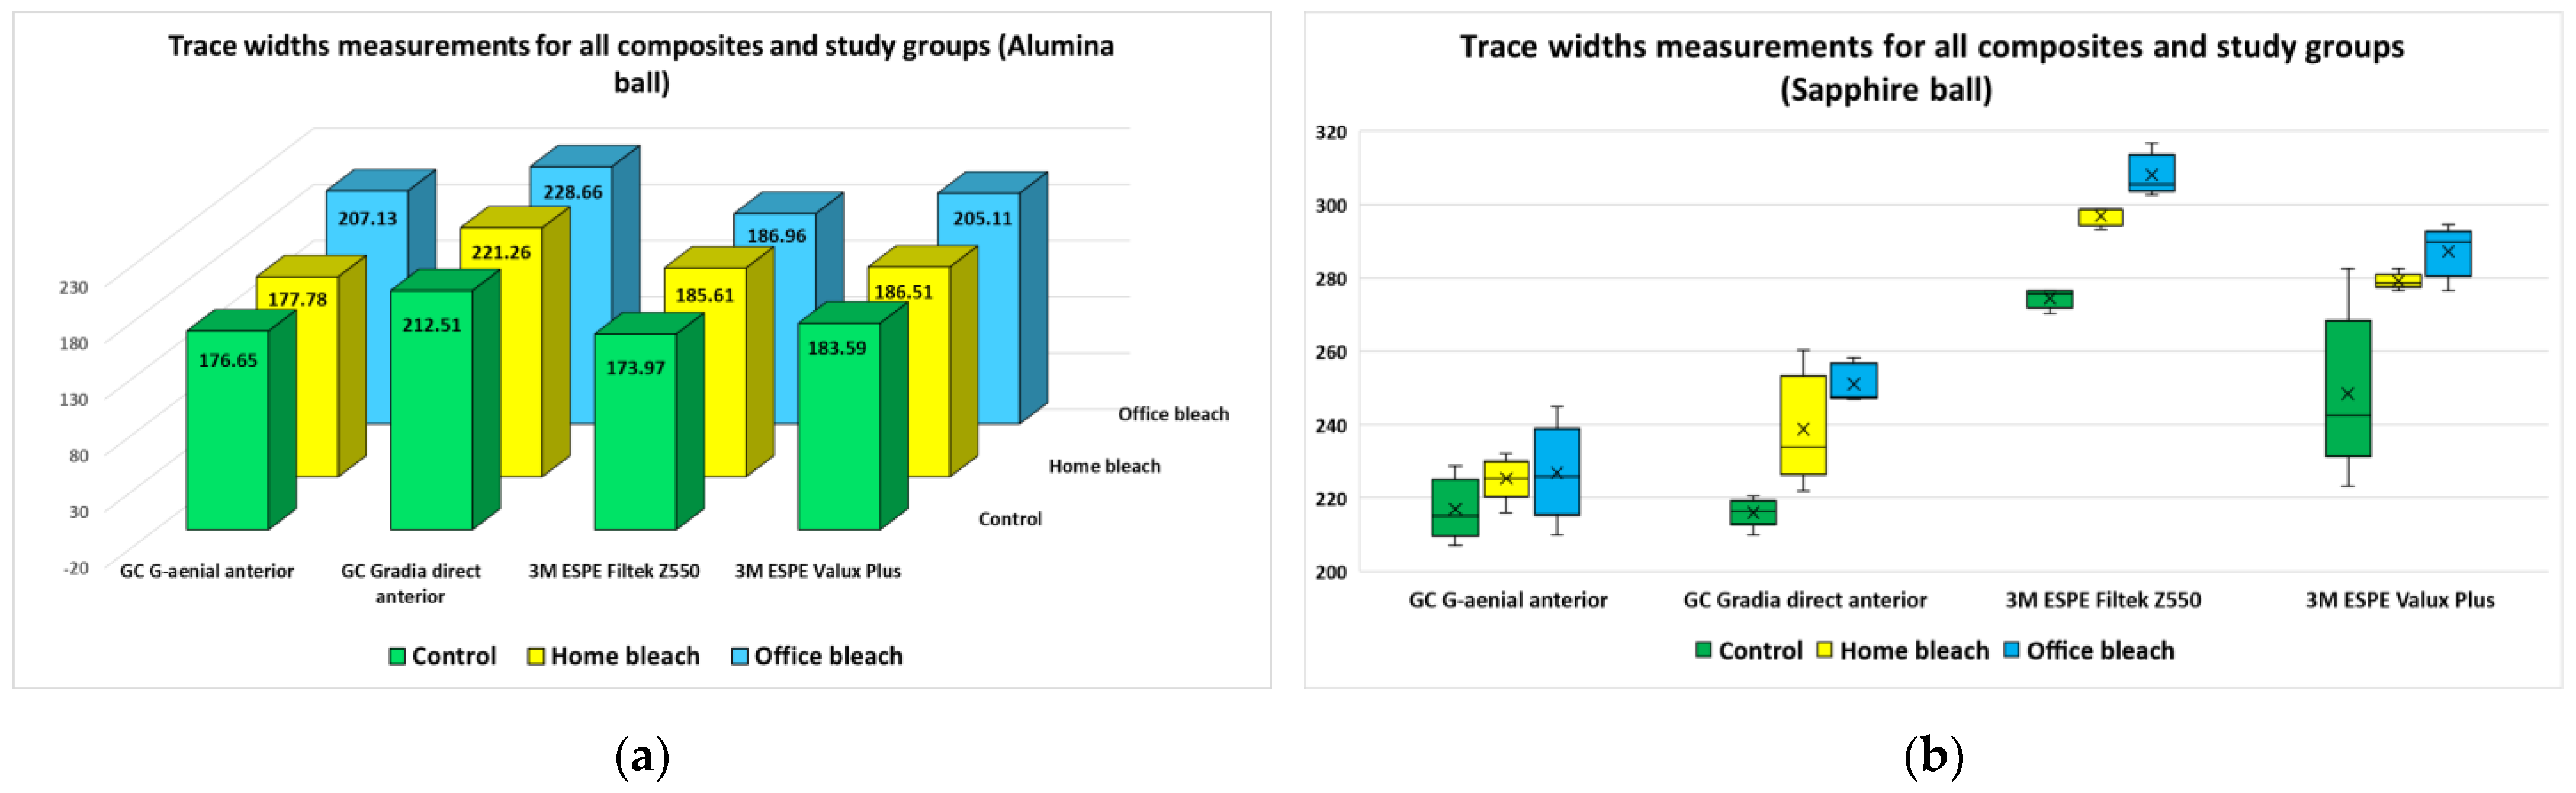
| Control | 176.65 ± 20.72 | 5.625/ 0.019 # | 212.51 ± 11.77 | 4.085/ 0.044 # | 173.97 ± 5.56 | 9.149/ 0.004 # | 183.59 ± 5.82 | 34.002/ 0.0005 # |
| Home Bleach | 177.78 ± 16.92 | 221.26 ± 8.08 | 185.61 ± 3.55 | 186.51 ± 3.18 | ||||
| Office Bleach | 207.13 ± 8.97 | 228.66 ± 6.01 | 186.96 ± 6.32 | 205.11 ± 4.01 | ||||
| Friction Coefficient | ||||||||
| Group | Friction coeff (median) | χ2(2)/ p ** | Friction coeff (median) | χ2(2)/ p ** | Friction coeff (median) | χ2(2)/ p ** | Friction coeff (median) | χ2(2)/ p ** |
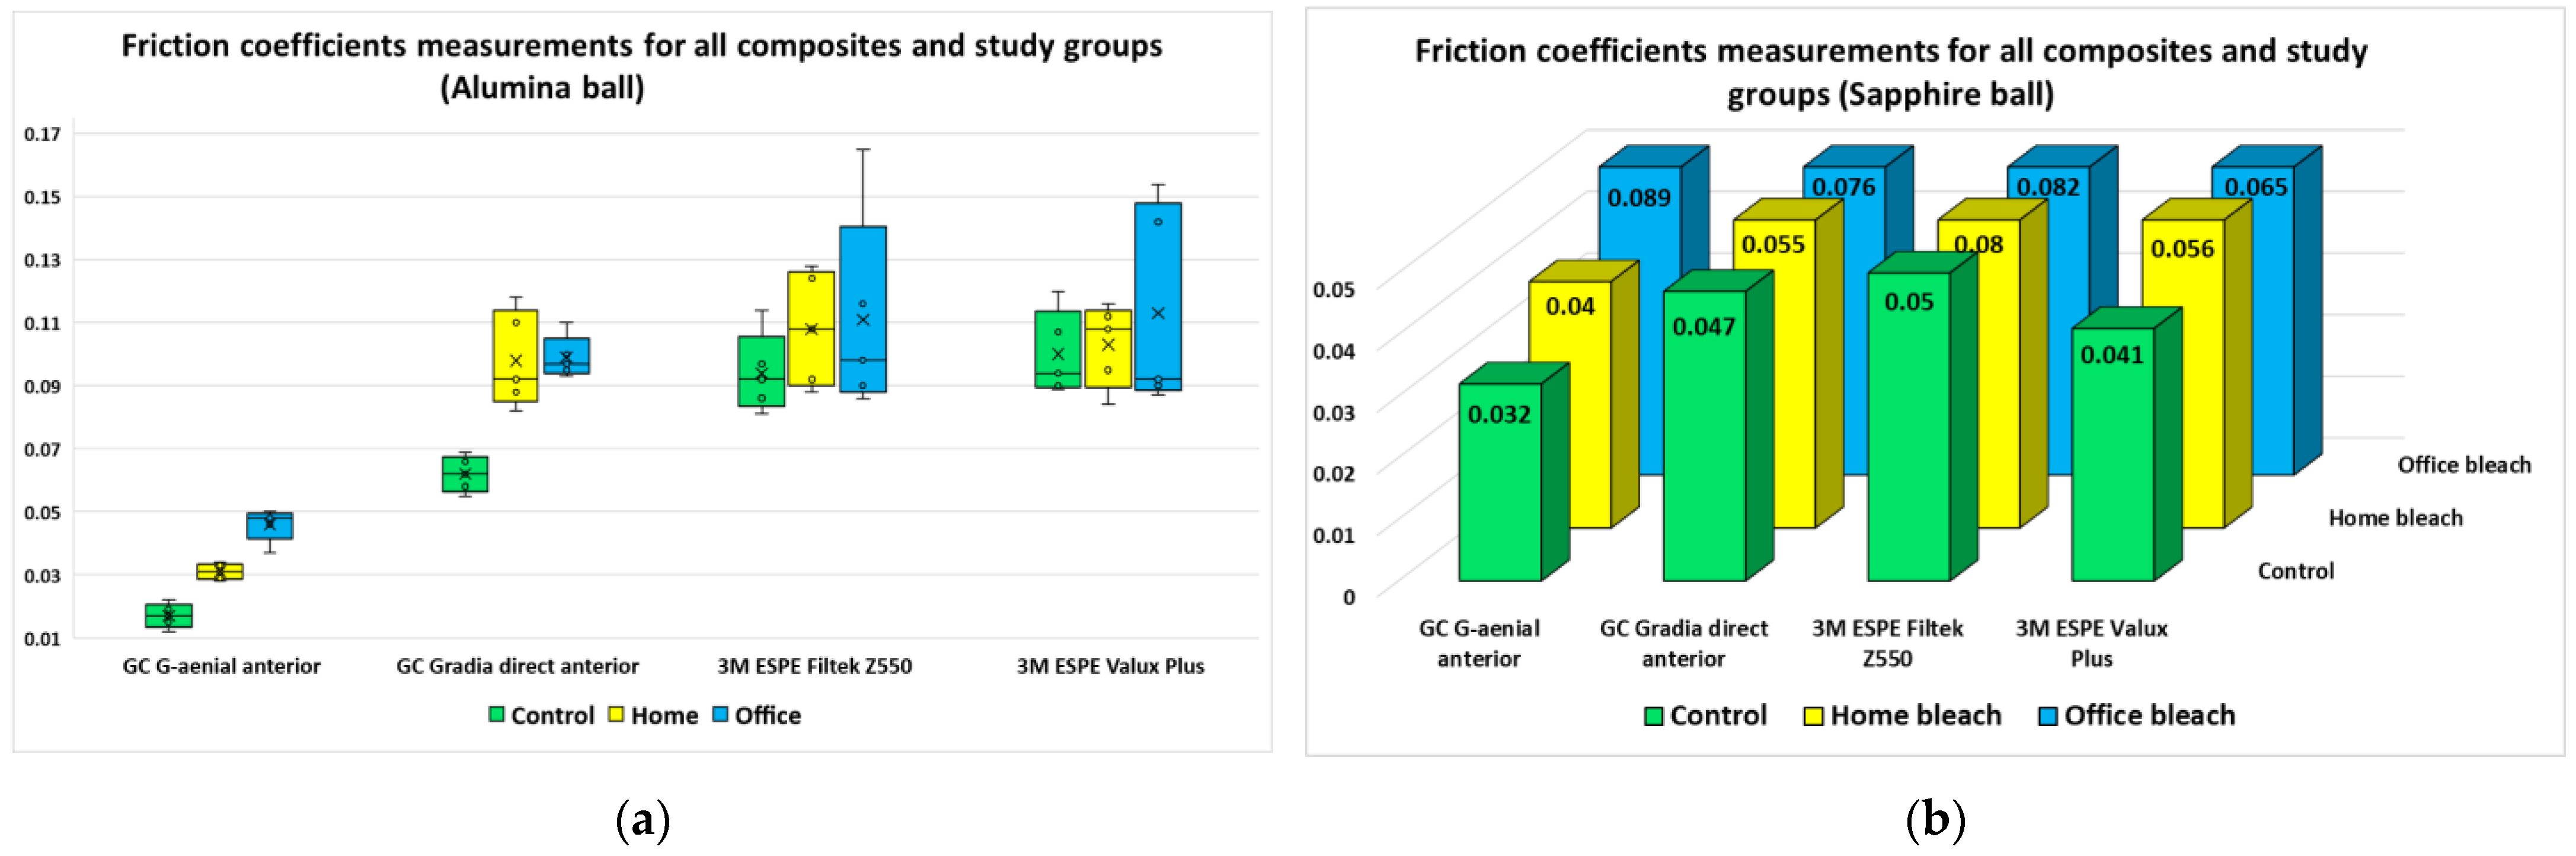
| Control | 0.017 | 12.500/ 0.002 # | 0.062 | 9.572/ 0.008 # | 0.092 | 1.902/ 0.386 | 0.094 | 0.185/ 0.911 |
| Home Bleach | 0.048 | 0.092 | 0.108 | 0.108 | ||||
| Office Bleach | 0.031 | 0.097 | 0.098 | 0.092 | ||||
| Composite | GC G-Aenial Anterior | GC Gradia Direct Anterior | 3M ESPE Filtek Z550 | 3M ESPE Valux Plus | ||||
|---|---|---|---|---|---|---|---|---|
| Trace Width | ||||||||
| Group comparisons | Variation | p * | Variation | p * | Variation | p * | Variation | p * |
| Control—Home | 30.48 | 0.030 # | - | > 0.05 | 11.640 | 0.012 # | - | > 0.05 |
| Home—Office | 29.350 | 0.036 # | - | > 0.05 | - | > 0.05 | 18.60 | < 0.0005 # |
| Control—Office | - | > 0.05 | 16.15 | 0.036 # | 12.990 | 0.006 # | 21.52 | < 0.0005 # |
| Friction Coefficient | ||||||||
| Group comparisons | Test statistic | p ** | Test statistic | p ** | Test statistic | p ** | Test statistic | p ** |
| Control—Home | - | > 0.05 | −6.90 | 0.044 # | Not applicable | Not applicable | ||
| Home—Office | - | > 0.05 | - | > 0.05 | ||||
| Control—Office | −10.0 | 0.001 # | 1.20 | 0.012 # | ||||
| Composite | Control | Home Bleach | Office Bleach | |||
|---|---|---|---|---|---|---|
| Trace Width | ||||||
| Group | Trace width (mean ± SD) | F(3,16)/ p * | Trace width (mean ± SD) | F(3,8.263) **/ p * | Trace width (mean ± SD) | F(3,16)/ p * |
| GC G-aenial anterior | 176.65 ± 20.72 | 9.889/ 0.001 # | 177.78 ± 16.92 | 25.659/ < 0.0005 # | 207.13 ± 8.97 | 33.769/ < 0.0005 # |
| GC Gradia direct anterior | 212.51 ± 11.77 | 221.26 ± 8.08 | 228.66 ± 6.00 | |||
| 3M ESPE Filtek Z550 | 173.97 ± 5.56 | 185.61 ± 3.55 | 186.96 ± 6.32 | |||
| 3M ESPE Valux Plus | 183.68 ± 5.82 | 186.51 ± 3.18 | 205.96 ± 16.32 | |||
| Friction Coefficient | ||||||
| Group | Friction coeff (median) | χ2(3)/ p *** | Friction coeff (median) | χ2(3)/ p *** | Friction coeff (median) | χ2(3)/ p *** |
| GC G-aenial anterior | 0.048 | 16.211/ 0.001 # | 0.031 | 11.263/ 0.010 # | 0.017 | 10.782/ 0.013 # |
| GC Gradia direct anterior | 0.097 | 0.092 | 0.062 | |||
| 3M ESPE Filtek Z550 | 0.098 | 0.108 | 0.092 | |||
| 3M ESPE Valux Plus | 0.092 | 0.108 | 0.094 | |||
| Composite | Control | Home Bleach | Office Bleach | |||
|---|---|---|---|---|---|---|
| Trace Width | ||||||
| Group comparisons | Variation ## | p * | Variation ## | p ** | Variation ## | p * |
| G-aenial—GC Gradia | 13.10–58.62 | 0.002 # | 14.019–72.940 | 0.009 # | 14.019–72.940 | 0.009 # |
| G-aenial—Filtek Z550 | - | > 0.05 | - | > 0.05 | - | > 0.05 |
| G-aenial—Valux Plus | - | > 0.05 | - | > 0.05 | 9.643–33.416 | < 0.0005 # |
| Gradia—Filtek Z550 | 15.778–61.309 | 0.001 # | 21.576–49.723 | 0.001 # | - | > 0.05 |
| Gradia—Valux Plus | 6.158–51.681 | 0.011 # | 20.641–48.858 | 0.001 # | - | > 0.05 |
| Filtek Z550—Valux Plus | - | > 0.05 | - | > 0.05 | 0.0930–0.0247 | < 0.0005 # |
| G-aenial—Valux Plus | - | > 0.05 | - | > 0.05 | ||
| Friction Coefficient | ||||||
| Group comparisons | Test statistic | p *** | Test statistic | p *** | Test statistic | p *** |
| G-aenial—GC Gradia | - | > 0.05 | - | > 0.05 | −10.40 | 0.033 # |
| G-aenial—Filtek Z550 | −11.80 | 0.010 # | −11.30 | 0.015 # | −10.10 | 0.042 # |
| G-aenial—Valux Plus | −13.20 | 0.003 # | −10.10 | 0.041 # | - | > 0.05 |
| Gradia—Filtek Z550 | - | > 0.05 | - | > 0.05 | - | > 0.05 |
| Gradia—Valux Plus | - | > 0.05 | - | > 0.05 | - | > 0.05 |
| Filtek Z550—Valux Plus | - | > 0.05 | - | > 0.05 | - | > 0.05 |
| G-aenial—Valux Plus | - | > 0.05 | - | > 0.05 | - | > 0.05 |
| Composite | GC G-Aenial Anterior | GC Gradia Direct Anterior | 3M ESPE Filtek Z550 | 3M ESPE Valux Plus | ||||
|---|---|---|---|---|---|---|---|---|
| Trace Width | ||||||||
| Group | Trace width (median) | χ2(2)/ p * | Trace width (median) | χ2(2)/ p * | Trace width (median) | χ2(2)/ p * | Trace width (median) | χ2(2)/ p * |
| Control | 215.21 | 2.540/ 0.281 | 216.59 | 10.519/ 0.005 # | 275.73 | 12.545/ 0.002 # | 242.62 | 7.819/ 0.020 # |
| Home Bleach | 225.45 | 234.03 | 298.58 | 278.65 | ||||
| Office Bleach | 225.97 | 247.49 | 305.50 | 289.68 | ||||
| Friction Coefficient | ||||||||
| Group | Friction coeff (mean ± SD) | F(2,12)/ p ** | Friction coeff (mean ± SD) | F(2,12)/ p ** | Friction coeff (mean ± SD) | F(2,12)/ p ** | Friction coeff (mean ± SD) | F(2,12)/ p ** |
| Control | 0.032 ± 0.0037 | 277.379/ 0.0005 # | 0.047 ± 0.0049 | 47.394/ 0.0005 # | 0.050 ± 0.0015 | 166.207/0.0005 | 0.041 ± 0.0025 | 77.368/0.0005 # |
| Home Bleach | 0.040 ± 0.0031 | 0.055 ± 0.0051 | 0.080 ± 0.0031 | 0.056 ± 0.0036 | ||||
| Office Bleach | 0.089 ± 0.0052 | 0.076 ± 0.0044 | 0.082 ± 0.0040 | 0.065 ± 0.0029 | ||||
| Composite | GC G-Aenial Anterior | GC Gradia Direct Anterior | 3M ESPE Filtek Z550 | 3M ESPE Valux Plus | ||||
|---|---|---|---|---|---|---|---|---|
| Trace Width | ||||||||
| Group comparisons | Test statistic | p * | Test statistic | p * | Test statistic | p * | Test statistic | p * |
| Control—Home | Not applicable | - | > 0.05 | - | > 0.05 | - | > 0.05 | |
| Home—Office | - | > 0.05 | - | > 0.05 | - | > 0.05 | ||
| Control—Office | −9.00 | 0.004 # | −10.00 | 0.001 # | −7.90 | 0.016 | ||
| Friction Coefficient | ||||||||
| Group comparisons | Variation | p ** | Variation | p ** | Variation | p ** | Variation | p ** |
| Control—Home | 0.008 | 0.025 # | - | > 0.05 | 0.030 | < 0.0005 # | 0.015 | 0.020 # |
| Home—Office | 0.049 | < 0.0005 # | 0.021 | < 0.0005 # | - | > 0.05 | 0.009 | 0.002 # |
| Control—Office | 0.057 | < 0.0005 # | 0.029 | < 0.0005 # | 0.032 | < 0.0005 # | 0.024 | < 0.0005 # |
| Composite | Control | Home Bleach | Office Bleach | |||
|---|---|---|---|---|---|---|
| Trace Width | ||||||
| Group | Trace width (median) | χ2(3)/ p * | Trace width (median) | χ2(3)/ p * | Trace width (median) | χ2(3)/ p * |
| GC G-aenial anterior | 215.21 | 14.462/ 0.002 # | 225.45 | 16.727/ 0.001 # | 225.97 | 17.871/ < 0.0005 # |
| GC Gradia direct anterior | 216.59 | 234.03 | 247.49 | |||
| 3M ESPE Filtek Z550 | 275.73 | 298.58 | 305.50 | |||
| 3M ESPE Valux Plus | 242.62 | 278.65 | 289.68 | |||
| Friction Coefficient | ||||||
| Group | Friction coeff (mean ± SD) | F(3,8.263)/ p *** | Friction coeff (mean ± SD) | F(3,16)/ p ** | Friction coeff (mean ± SD) | F(3,16)/ p ** |
| GC G-aenial anterior | 0.032 ± 0.0037 | 26.526/ < 0.0005 # | 0.040 ± 0.0031 | 91.194/ < 0.0005 # | 0.089 ± 0.0052 | 28.506/ < 0.0005 # |
| GC Gradia direct anterior | 0.047 ± 0.0049 | 0.055 ± 0.0051 | 0.076 ± 0.0044 | |||
| 3M ESPE Filtek Z550 | 0.050 ± 0.0015 | 0.080 ± 0.0031 | 0.082 ± 0.0040 | |||
| 3M ESPE Valux Plus | 0.041 ± 0.0025 | 0.056 ± 0.0036 | 0.065 ± 0.0029 | |||
| Composite | Control | Home Bleach | Office Bleach | |||
|---|---|---|---|---|---|---|
| Trace Width | ||||||
| Group comparisons | Test statistic | p * | Test statistic | p * | Test statistic | p * |
| G-aenial—GC Gradia | - | > 0.05 | - | > 0.05 | - | > 0.05 |
| G-aenial—Filtek Z550 | −11.40 | 0.014 # | −14.00 | 0.001 # | −15.00 | < 0.0005 # |
| G-aenial—Valux Plus | - | > 0.05 | - | > 0.05 | −10.00 | 0.045 |
| Gradia—Filtek Z550 | −11.40 | 0.014 # | −11.00 | 0.020 # | −10.00 | 0.045 |
| Gradia—Valux Plus | - | > 0.05 | - | > 0.05 | - | > 0.05 |
| Filtek Z550—Valux Plus | - | > 0.05 | - | > 0.05 | - | > 0.05 |
| G-aenial—Valux Plus | - | > 0.05 | - | > 0.05 | - | > 0.05 |
| Friction Coefficient | ||||||
| Group comparisons | Variation | p *** | Variation | p ** | Variation | p ** |
| G-aenial—GC Gradia | 0.015 | 0.024 # | 0.015 | < 0.0005 # | 0.013 | 0.001 # |
| G-aenial—Filtek Z550 | 0.018 | < 0.0005 # | 0.040 | < 0.0005 # | - | > 0.05 |
| G-aenial—Valux Plus | - | > 0.05 | - | > 0.05 | 0.024 | < 0.0005 # |
| Gradia—Filtek Z550 | - | > 0.05 | - | > 0.05 | - | > 0.05 |
| Gradia—Valux Plus | - | > 0.05 | - | > 0.05 | 0.011 | 0.004 # |
| Filtek Z550—Valux Plus | 0.009 | 0.001 # | 0.024 | < 0.0005 # | 0.017 | < 0.0005 # |
| G-aenial—Valux Plus | - | > 0.05 | - | > 0.05 | - | > 0.05 |
Disclaimer/Publisher’s Note: The statements, opinions and data contained in all publications are solely those of the individual author(s) and contributor(s) and not of MDPI and/or the editor(s). MDPI and/or the editor(s) disclaim responsibility for any injury to people or property resulting from any ideas, methods, instructions or products referred to in the content. |
© 2023 by the authors. Licensee MDPI, Basel, Switzerland. This article is an open access article distributed under the terms and conditions of the Creative Commons Attribution (CC BY) license (https://creativecommons.org/licenses/by/4.0/).
Share and Cite
Popescu, A.D.; Ţuculină, M.J.; Gheorghiță, L.M.; Osman, A.; Nicolicescu, C.; Bugălă, S.A.; Ionescu, M.; Abdul-Razzak, J.; Diaconu, O.A.; Dimitriu, B. An In Vitro Study regarding the Wear of Composite Materials Following the Use of Dental Bleaching Protocols. J. Funct. Biomater. 2023, 14, 532. https://0-doi-org.brum.beds.ac.uk/10.3390/jfb14100532
Popescu AD, Ţuculină MJ, Gheorghiță LM, Osman A, Nicolicescu C, Bugălă SA, Ionescu M, Abdul-Razzak J, Diaconu OA, Dimitriu B. An In Vitro Study regarding the Wear of Composite Materials Following the Use of Dental Bleaching Protocols. Journal of Functional Biomaterials. 2023; 14(10):532. https://0-doi-org.brum.beds.ac.uk/10.3390/jfb14100532
Chicago/Turabian StylePopescu, Alexandru Dan, Mihaela Jana Ţuculină, Lelia Mihaela Gheorghiță, Andrei Osman, Claudiu Nicolicescu, Smaranda Adelina Bugălă, Mihaela Ionescu, Jaqueline Abdul-Razzak, Oana Andreea Diaconu, and Bogdan Dimitriu. 2023. "An In Vitro Study regarding the Wear of Composite Materials Following the Use of Dental Bleaching Protocols" Journal of Functional Biomaterials 14, no. 10: 532. https://0-doi-org.brum.beds.ac.uk/10.3390/jfb14100532