1. Introduction
Multifunctional polymer nanocomposites have been the center of attention in the scientific community for the last decade due to their capabilities in providing combined thermal, acoustic mechanical, and weight reduction properties, among others [
1]. Various studies have considered the creation of cellular materials using high-performance thermoplastics for cutting-edge industries, such as aerospace, electronics, or telecommunications. Among high-performance thermoplastics, polysulfone (PSU) has been considered due to its high thermal stability and inherent fire resistance; its excellent mechanical properties—namely, high strength and toughness; and its good environmental stress-crack resistance [
2,
3]. Additionally, its high resistance to gamma and e-beam radiation due to its high aromatic content, alongside its good hydrolytic stability, makes PSU a suitable candidate for components requiring sterilization [
4].
PSU-based cellular nanocomposites prepared by CO
2 dissolution batch foaming [
5,
6,
7,
8,
9]; continuous extrusion chemical foaming; and solution phase separation—in this last case, used for preparing PSU-based membranes [
10], have been studied vastly. Various studies have been conducted on PSU cellular nanocomposites and membranes with carbon-based nanoparticles [
11,
12,
13,
14]; however, the study of such cellular nanocomposites with respect to their electrical conductivity has not yet been explored. Sánchez et al. [
15,
16] presented promising results regarding the fabrication of carbon nanotube and polysulfone thick-film screen-printed electrodes for electrochemical enzyme biosensor and immune-sensor applications.
Carbon-based nanofillers such as graphene nanoplatelets (GnP) and carbon nanotubes (CNT) have attracted a great deal of interest, as they have been shown to enable the fabrication of polymer nanocomposites with enhanced transport properties, counteracting some limitations of electrically conductive polymers for advanced sectors [
17]. Additionally, they can provide polymer nanocomposites with improved mechanical properties and multifunctionality [
18].
Recent focus on creating cellular nanocomposites containing conductive nanoparticles has led to the development of novel materials with improved specific properties—for instance, in terms of electrical and thermal conductivities. Regarding this matter, studies microcellular nanocomposites based on polyetherimide filled with carbon-based nanofillers have been recently published [
19,
20,
21,
22,
23]. In this sense, we have previously reported the thermal conductivity behavior of PSU-based cellular nanocomposites containing graphene nanoplatelets [
24].
In the present paper, the preparation of GnP–PSU microcellular nanocomposites has been carried out using two different processing techniques—namely, water vapor-induced phase separation (WVIPS) and one-step supercritical CO2 (scCO2) dissolution. The dispersion of the GnP nanoparticles promoted during the solution mixing and phase inversion step of WVIPS process, as well as during the melt-mixing and subsequent scCO2 dissolution and expansion steps in the gas dissolution process, could result in an enhanced electrical conductivity at a low GnP concentration, enabling the use of these novel nanocomposites, for instance, in electrostatic discharge (ESD) or electromagnetic interference (EMI) shielding applications.
2. Materials and Methods
2.1. Materials and Foaming
Polysulfone, in the form of pellets, with the commercial name of UDEL P-1700, a density of 1.24 g/cm3, and a glass transition temperature of 185 °C, was used in the present investigation. The graphene nanoplatelets (xGnP-Grade M15) used in this study were purchased from XG Sciences Inc. (Lansing, MI, USA), with a reported thickness of 6–8 nm; an average platelet diameter of 15 µm; a surface area of 120–150 m2/g; a density of 2.2 g/cm3; and an electrical conductivity of 107 and 102 S/m, measured parallel and perpendicular to their surface, respectively. N-methyl pyrrolidone (NMP) was obtained from Panreac Química SA (Barcelona, Spain) with a purity of 99% and boiling and flash points of 202 and 95 °C, respectively.
Both the foaming processes used in this study are explained in detail in a previously published article [
24]. The resultant microcellular nanocomposites could be categorized in three different series. The first and second series were prepared using the WVIPS method with two different concentrations of the initial PSU solution, in both cases containing between 0 and 10 wt% GnP, the first one using 15 wt% PSU in NMP, resulting in an average density of 0.47 g/cm
3, and the second one using 25 wt% PSU in NMP (average density 0.52 g/cm
3). From here on, these microcellular nanocomposites will be referred to as “15PSU x” and “25PSU x”, respectively, where x represents the amount of graphene in weight percentage. The third series of microcellular nanocomposites were prepared by a one-step scCO
2 dissolution, resulting in microcellular nanocomposites with an average density of 0.50 g/cm
3 containing 0–2 wt% of GnP. These samples were coded as “PSUCO
2 x”.
2.2. Testing Procedure
The density values of the microcellular nanocomposites were measured by the application of the ISO-845 standard method. The gas volume percentage (
Vg) values were calculated from the density of the foam and respective unfoamed material according to the following expression:
where δ and δ
s are the density of the foamed and unfoamed materials, respectively (δ/δ
s is the so-called relative density).
The analysis of the cellular structure was performed using a scanning electron microscope (SEM), particularly a JEOL JSM-5610 (Tokyo, Japan), by applying a 10 kV voltage at a working distance of 40 mm to samples that had been brittle-fractured in liquid nitrogen. The samples were later coated with a thin layer of gold by sputter deposition, using a sputter coater (BAL-TEC SCD005; Los Angeles, CA, USA) under an argon atmosphere.
X-ray diffraction (XRD) was used to evaluate the effectiveness of the GnP nanoparticle dispersion by analyzing the characteristic (002) diffraction plane of GnP and the possible crystallinity of PSU, using a PANalytical diffractometer (Almelo, The Netherlands) operating with CuK α (λ = 0.154 nm) at 40 kV and 40 mA. The scanning range was from 2 to 60° using a scan step of 0.033°.
The electrical conductivity measurements were performed on 20 mm × 20 mm × 1 mm samples directly cut from the prepared microcellular nanocomposites using a HP 4140B pA meter and dc voltage source with a two-probe set. A thin layer of colloidal silver conductive paint was used to cover the surfaces of the samples in contact with the copper electrode pads, which had an electrical resistance between 0.01 and 0.1 Ω/cm
2. A direct current voltage was applied with a range of 0–5 V, with a voltage step of 0.05 V, a hold time of 10 s, and a step delay time of 5 s. The electrical conductivity (σ in S/m) was calculated according to:
and
where
(in Ω·m) represents the electrical volume resistivity,
R is the electrical resistance of the sample in Ω,
AE.C is the area of the surface in m
2, and
d is the distance between electrodes (in m). The following expressions (Equations (4)–(6)) were used in order to normalize the measured values of electrical conductivity, regarding the gas volume fraction of the microcellular nanocomposites, which could influence the effective contact surface area between the sample and the electrodes. The average cell size and the cell density of the microcellular nanocomposites were used in order to obtain the corrected value of electrical conductivity (σ*), taking into account variations in the effective surface area as follows:
where
Anc (no-cell area) is defined as the
AE.C with the cell section area excluded, and the area of the cell hemisphere (
Ach) was calculated using:
The values of
n,
A, and
were obtained from the analyzed SEM micrographs [
24] and represent the number of cells, the corresponding area of the micrograph at ×300 magnification in m
2, and the average cell size, respectively.
3. Results
3.1. X-ray Diffraction Analysis
The density and the intensity values of the XRD peak at 2θ = 26.5°, corresponding to the (002) crystallographic plane of graphene nanoplatelets, for all the microcellular nanocomposites, are presented in
Table 1.
The PSU-based microcellular nanocomposites, prepared using both scCO2 dissolution and WVIPS, presented density values between 0.435 and 0.568 g/cm3, with evidence of variations related to the PSU and solvent proportions in microcellular nanocomposites prepared via WVIPS and PSU and GnP concentrations (in all series). The microcellular nanocomposites prepared using the WVIPS method showed a decreasing trend, in terms of density, by reducing the amount of polymer in the solution from 25 to 15 wt%. Additionally, the increase in GnP concentration resulted in a significant rise in density for all the samples. In the series prepared by scCO2 dissolution, the density value increased 25% by increasing the GnPs’ weight percentage from 0.1 to 2.0. A similar trend was observed in samples prepared by WVIPS, with the density increasing more than 13% and 42% in 15PSU and 25PSU, respectively.
The cellular structure of microcellular nanocomposites containing 2 wt% GnP is presented in
Figure 1. The samples of the 15PSU series presented a closed-cell structure with an average cell size of around 54 µm, with the exception of the sample containing 10 wt% GnP, which showed an open interconnected foam structure. A similar open or interconnected structure also appeared in 25PSU samples containing 5 and 10 wt% GnP. Other PSU–GnP microcellular nanocomposites in this series presented an average cell size around 28 µm. All of the samples prepared by scCO
2 dissolution presented a closed-cell structure, with an average cell size of 15 µm.
As can be seen in
Figure 2, the intensity of the characteristic (002) diffraction plane of GnP found at 2θ = 26.5° suggests a possible effect of various foaming and mixing methods on the dispersion level of GnP throughout the cellular structure. The results show that solvent mixing favors the dispersion level of graphene nanoplatelets, which could be related to the lower viscosity of the mixing medium when compared to the melt-mixing process. Similarly, the changes in the peak intensity of microcellular nanocomposites prepared by WVIPS indicate that variations in the foaming process, particularly by decreasing the viscosity of the solution (25% PSU vs. 15% PSU in NMP), could result in a better dispersion of graphene stacks, especially noticeable at a higher nanofiller concentration (5 and 10 wt% GnP).
3.2. Electrical Conductivity
The electrical conductivity of the PSU–GnP microcellular nanocomposites showed a general rise with the increasing GnP content, as expected, owing to the inherently high electrical conductivity of GnP, particularly presenting higher increases in foams prepared by WVIPS. The values of density,
Vg, GnP weight and volume percentages, electrical conductivity, and corresponding corrected values are presented in
Table 2.
As can be seen in
Figure 3, the increasing trend in electrical conductivity slows down as the concentration of GnP increases, demonstrating a possible limitation in terms of GnP dispersion at higher concentrations.
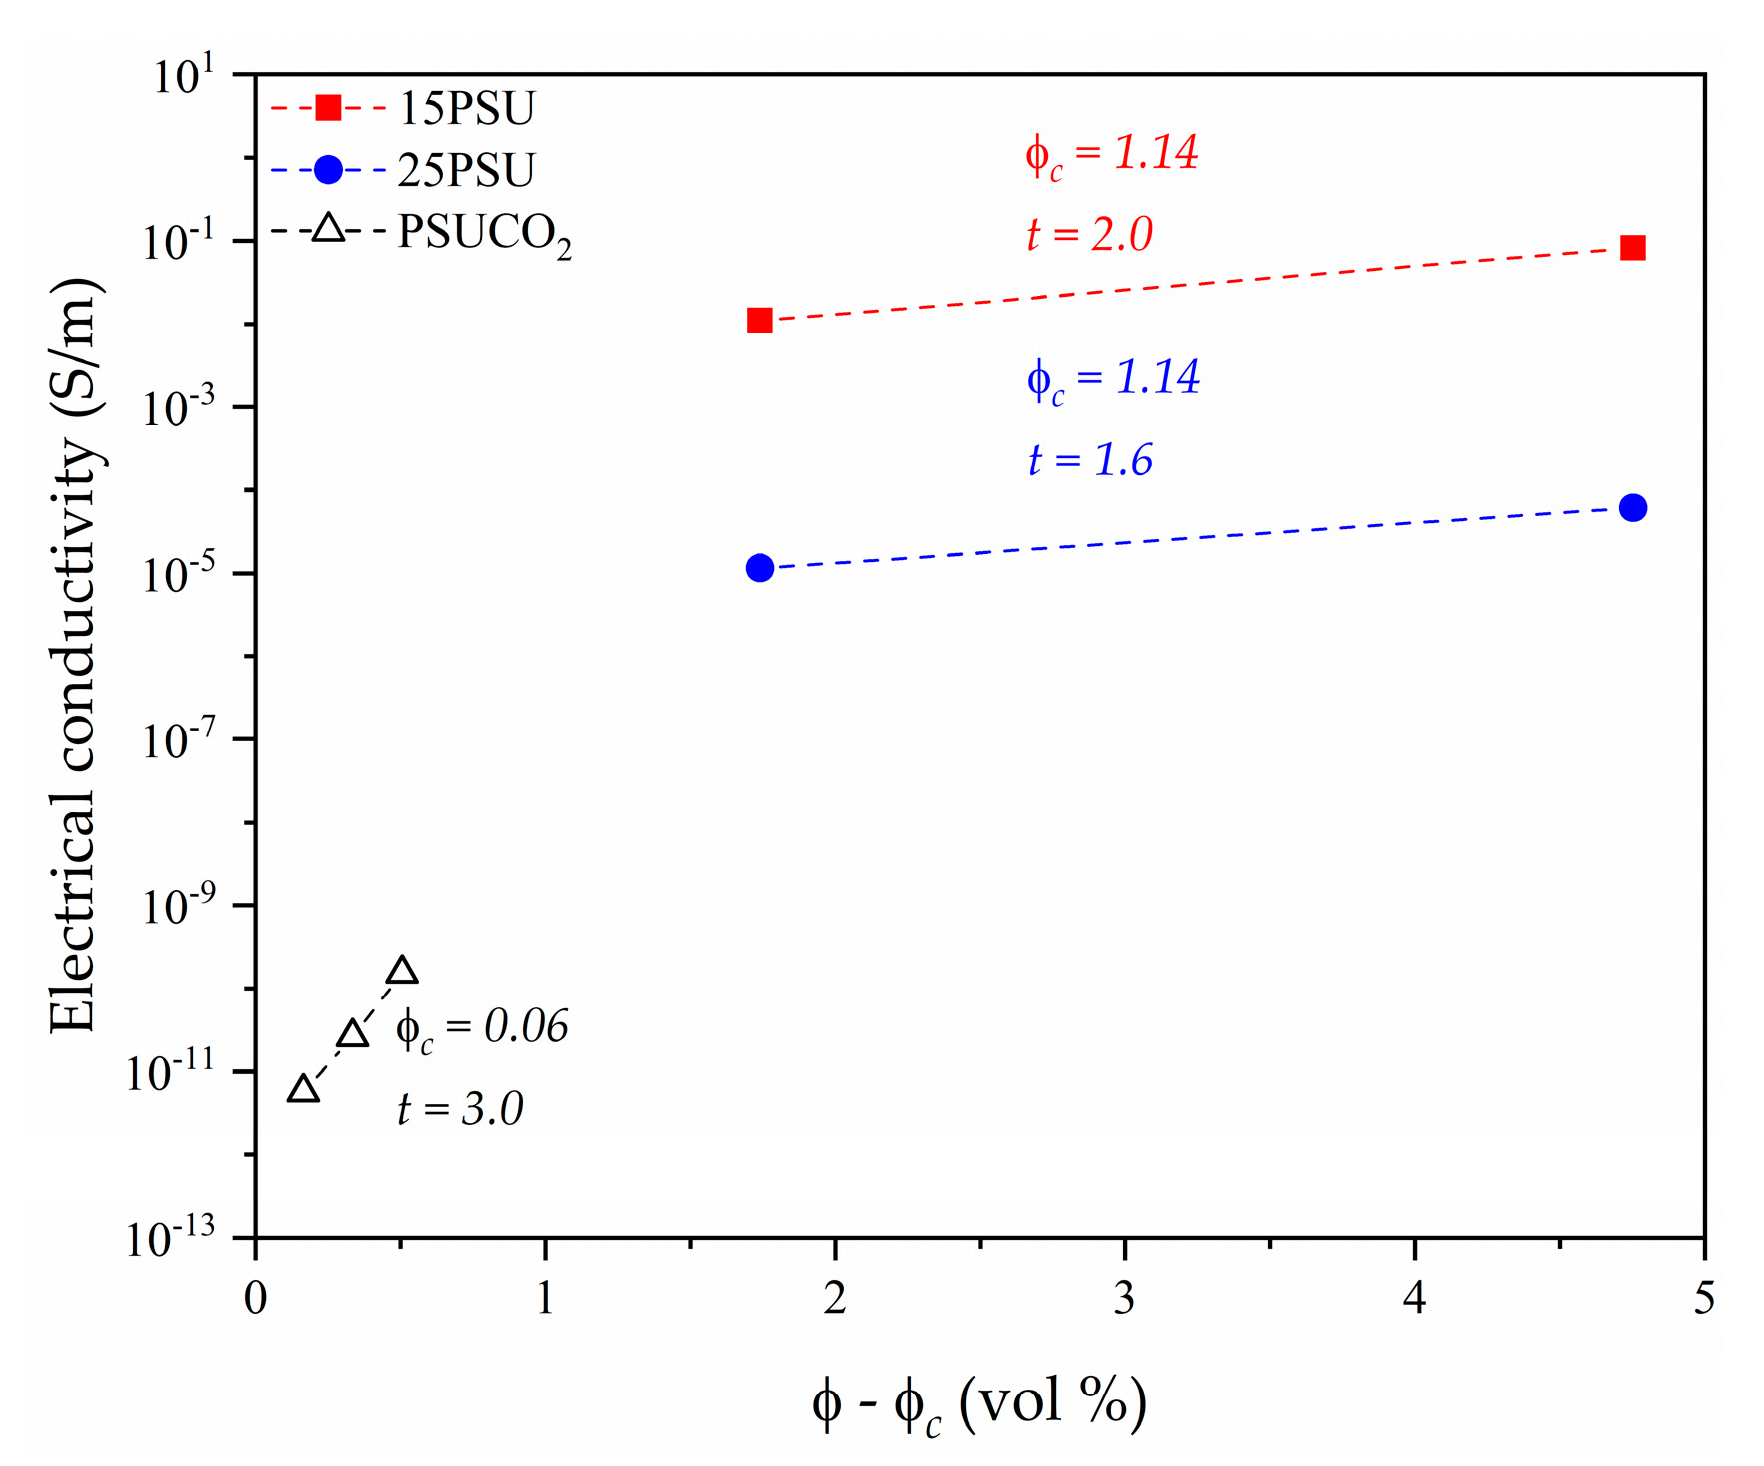
As can be seen in
Figure 3, the electrical conductivity increased for all the microcellular nanocomposites with the addition of GnP, reaching values as high as 8.2 × 10
−2 S/m with 2.7 vol% (10 wt%) graphene nanoplatelets in 15PSU. The percolation model is commonly used to depict the electrical conductivity of nanocomposites as a function of the amount of conductive particles above a certain critical point, based on the physical contact between them, using:
where
is the volume fraction of the conductive particles,
the percolation threshold, and
t is the percolation exponent [
19,
25,
26,
27,
28]. However, this model is sensitive to the concentration range of GnP and does not consider that nanocomposites could already present a level of electrical conduction at GnP concentrations below the critical value, as can be seen in
Figure 4. Therefore, a tunnel conduction mechanism was suggested as the dominant model in the GnP concentration range used in this study, since it has been previously demonstrated to be a better fitting model for cellular materials containing conductive fillers [
20,
21,
23,
29] before the formation of a continuous conductive particle network.
Considering a tunnel conduction mechanism, the electrical conductivity could be predicted using:
where
A and
d represent the tunnel parameter and distance, respectively [
30]. The results suggest that the tunneling distance remains a slightly closer fit to that of a three-dimensional random particle distribution as opposed to a two-dimensional network, with minimal differences.
Figure 5 demonstrates the best fitting of the corrected electrical conductivity as a function of ϕ
−1/5 (with the exponent representing the geometry factor).
Interestingly, the foaming process seemed to have a positive influence on the electrical properties of the prepared microcellular nanocomposites, as can be seen in
Figure 6, with the microcellular nanocomposites having a lower density (higher gas volume fraction) and showing higher values of electrical conductivity (similar to the results published in our previous study [
23]).
The microcellular nanocomposites obtained in this study display electrical conductivities that enable their use in applications such as ESD or EMI shielding. Samples prepared by scCO
2 dissolution foaming could be used in ESD applications, since the required electrical resistivity range for their implementation is between 10
12 and 10
5 Ω [
31]. Since the EMI shielding capability of materials is closely related to their electrical conductivity [
32,
33], as materials require an electrical resistance value below 10
5 Ω [
31], the samples prepared by the WVIPS method (15PSU and 25PSU) could be suitable candidates for this application, with values as high as 10
−2 S/m and volume percentages of graphene as low as 0.94%.
4. Further Discussion
Regarding the electrical conductivity of the prepared microcellular nanocomposites, the influence of the conductive filler distribution and dispersion on the eventual conductivity of nanocomposites is widely known [
34,
35,
36,
37]. In previous works on polyetherimide (PEI) [
19,
21,
23], we have shown that dispersion processes, such as the application of ultrasonication and melt-mixing, could improve the electrical conductivity of these nanocomposites. Additionally, the mentioned results indicated that further electrical conductivity improvements could be achieved through foaming by decreasing the interparticle distance between conductive nanoparticles distributed throughout the cell walls. The electrical conductivity values suggest a good dispersion of the nanoparticles after melt-mixing at low concentrations of GnP; however, for higher nanofiller contents, the combination of ultrasonication and solution mixing showed a higher efficiency in providing a desirable dispersion level.
In the case of the microcellular nanocomposites prepared by scCO2 dissolution foaming, a clear change in trend appeared after 1 wt% GnP, while in the case of the microcellular nanocomposites prepared by WVIPS it was observed at 5 wt% GnP, showing that the WVIPS was more effective in providing a better GnP dispersion, which could be related to the lower viscosity of the medium in this method (NMP-based dissolution), when compared to that of melt-compounding required for preparing PSUCO2 samples.
A similar study involving nanocomposites of thermoplastic polyurethane and graphene oxide [
34] presented a comparison between various dispersion methods—namely, solvent mixing and melt-compounding. The results suggested that an improved dispersion was achieved in solvent mixing when compared to melt-compounding. This could be due to the higher viscosity of the matrix in the latter method.
Regarding the fitting tunnel conduction mechanism, similar results were observed for the fitting curve with ϕ
−1/3, which could be a sign of network formation in both three-dimensional nanoparticles with the assistance of a two-dimensional network formed by exfoliated nanoparticles, as suggested by the values calculated by Krenchel [
38] and Fisher et al. [
39]. The values of R
2 corresponding to fitting curves for both exponent fittings are presented in
Table 3. The values of R
2 corresponding to the ϕ
−1/5 were around 0.95 for the microcellular nanocomposites prepared by WVIPS and 0.85 for the microcellular nanocomposites prepared by scCO
2 dissolution foaming, whereas these values were 0.94 and 0.84 for the respective samples when the fitting curves were expressed as a function of ϕ
−1/3.
The increase in the values of electrical conductivity, by increasing the gas volume percentage, can be explained by the reduction in GnP interparticle distance as a result of a reduction in the characteristic dimension of the continuous phase in the cellular structure through a more desirable re-orientation of graphene nanoparticles. Similar results have been reported by O. Maxian et al. [
40], where their modeling of a percolation system, consisting of nanocomposites with carbon-based nanofillers, showed a decrease in terms of percolation threshold with increasing the porosity of nanocomposites. Gedler et al. [
41] also presented the results of electrical conductivity enhancement with increasing the expansion ratio, with an optimum limit to reach maximum efficiency in augmenting the electrical conductivity.
5. Conclusions
In terms of GnP dispersion, the solution mixing step to produce microcellular nanocomposites by the WVIPS method was more effective when compared to the melt-mixing step used for the samples prepared by scCO2 dissolution. For the two series prepared using solution mixing (WVIPS), 15PSU and 25PSU, in the series with the lowest amount of polymer (15PSU), there was a better dispersion of graphene nanoplatelets, as indicated by X-ray diffraction. These changes could be directly related to the viscosity of the medium during mixing, as during melt-mixing the system possesses the highest viscosity, leading to a less effective dispersion of GnP, whereas solution mixing with the lowest amount of polymer (15PSU) had the lowest viscosity, resulting in the improved dispersion of the nanoparticles.
In terms of electrical conductivity, all the studied series of microcellular nanocomposites showed significant improvements with the amount of GnP, with the exception of the PSUCO2 samples, which showed limitations at GnP concentrations above 1 wt%. This could be related to a less effective dispersion of the nanoparticles at these concentrations. Among the microcellular nanocomposites prepared via WVIPS, the 15PSU samples showed significantly higher values of electrical conductivity, placing them among one of the highest reported values for this range of GnP content. The difference of three orders of magnitude for samples containing 10 wt% GnP between the 15PSU and 25PSU samples could be explained by the reduction in the interparticle distance, which could have resulted in assisting the formation of a conductive network. The tunnel conduction mechanism expressed the best fitting model for the values obtained in this study, representing a three-dimensional distribution of GnP. This indicates that high values of electrical conductivity could be obtained even with GnP stacks that were not fully exfoliated during mixing and foaming.
Author Contributions
Formal analysis: H.A., M.A., and J.I.V.; investigation: H.A., M.A., and J.I.V.; methodology: H.A. and M.A.; writing—original draft: H.A., M.A., and J.I.V.; writing—review and editing: H.A., M.A., and J.I.V. All authors have read and agreed to the published version of the manuscript.
Funding
Research funded by the Spanish Ministry of Science, Innovation, and Universities, Government of Spain (project MAT2017-89787-P).
Conflicts of Interest
The authors declare no conflict of interest.
References
- Volker Altstädt, A.F. Chapter 8-Mechanical properties of multifunctional foam core materials. In Multifunctionality of Polymer Composites; Friedrich, K., Breuer, U., Eds.; William Andrew Publishing: Oxford, UK, 2015; pp. 262–301. [Google Scholar] [CrossRef]
- Gohil, S.V.; Suhail, S.; Rose, J.; Vella, T.; Nair, L.S. Polymers and composites for orthopedic applications. In Materials Bone Disorders; Elsevier: Amsterdam, The Netherlands, 2017; pp. 349–403. [Google Scholar] [CrossRef]
- McKeen, L.W. 12-High Temperature/High Performance Polymers. In Film Properties of Plastics and Elastomers; William Andrew Publishing: Boston, MA, USA, 2012; pp. 315–337. [Google Scholar] [CrossRef]
- Sastri, V.R. Chapter 8-High-Temperature Engineering Thermoplastics: Polysulfones, Polyimides, Polysulfides, Polyketones, Liquid Crystalline Polymers, and Fluoropolymers. In Plastics in Medical Devices; William Andrew Publishing: Boston, MA, USA, 2010; pp. 175–215. [Google Scholar] [CrossRef]
- Krause, B.; Diekmann, K.; van der Vegt, N.F.A.; Wessling, M. Open Nanoporous Morphologies from Polymeric Blends by Carbon Dioxide Foaming. Macromolecules 2002, 35, 1738–1745. [Google Scholar] [CrossRef]
- Li, Z.; Jia, Y.; Bai, S. Polysulfone foam with high expansion ratio prepared by supercritical carbon dioxide assisted molding foaming method. RSC Adv. 2018, 8, 2880–2886. [Google Scholar] [CrossRef] [Green Version]
- Guo, H.; Nicolae, A.; Kumar, V. Solid-state microcellular and nanocellular polysulfone foams. J. Polym. Sci. Part B Polym. Phys. 2015, 53, 975–985. [Google Scholar] [CrossRef]
- Sun, H.; Mark, J.E. Preparation, characterization, and mechanical properties of some microcellular polysulfone foams. J. Appl. Polym. Sci. 2002, 86, 1692–1701. [Google Scholar] [CrossRef]
- Krause, B.; Boerrigter, M.E.; van der Vegt, N.F.A.; Strathmann, H.; Wessling, M. Novel open-cellular polysulfone morphologies produced with trace concentrations of solvents as pore opener. J. Memb. Sci. 2001, 187, 181–192. [Google Scholar] [CrossRef]
- Wu, H.; Tang, B.; Wu, P. Development of novel SiO2–GO nanohybrid/polysulfone membrane with enhanced performance. J. Memb. Sci. 2014, 451, 94–102. [Google Scholar] [CrossRef]
- Rezaee, R.; Nasseri, S.; Mahvi, A.H.; Nabizadeh, R.; Mousavi, S.A.; Rashidi, A.; Jafari, A.; Nazmara, S. Fabrication and characterization of a polysulfone-graphene oxide nanocomposite membrane for arsenate rejection from water. J. Environ. Health Sci. Eng. 2015, 13, 61. [Google Scholar] [CrossRef] [Green Version]
- Ionita, M.; Vasile, E.; Crica, L.E.; Voicu, Ș.I.; Pandele, A.-M.; Dinescu, S.; Predoiu, L.; Galateanu, B.; Hermenean, A.; Costache, M. Synthesis, characterization and in vitro studies of polysulfone/graphene oxide composite membranes. Compos. Part B Eng. 2015, 72, 108–115. [Google Scholar] [CrossRef]
- Hwang, T.; Oh, J.-S.; Yim, W.; Nam, J.-D.; Bae, C.; Kim, H.-I.; Kim, K.J. Ultrafiltration using graphene oxide surface-embedded polysulfone membranes. Sep. Purif. Technol. 2016, 166, 41–47. [Google Scholar] [CrossRef] [Green Version]
- Nechifor, G.; Voicu, S.I.; Nechifor, A.C.; Garea, S. Nanostructured hybrid membrane polysulfone-carbon nanotubes for hemodialysis. Desalination 2009, 241, 342–348. [Google Scholar] [CrossRef]
- Sánchez, S.; Pumera, M.; Cabruja, E.; Fabregas, E. Carbon nanotube/polysulfone composite screen-printed electrochemical enzyme biosensors. Analyst 2007, 132, 142–147. [Google Scholar] [CrossRef] [PubMed]
- Sánchez, S.; Pumera, M.; Fàbregas, E. Carbon nanotube/polysulfone screen-printed electrochemical immunosensor. Biosens. Bioelectron. 2007, 23, 332–340. [Google Scholar] [CrossRef] [PubMed]
- Abbasi, H.; Antunes, M.; Velasco, J.I. Recent advances in carbon-based polymer nanocomposites for electromagnetic interference shielding. Prog. Mater. Sci. 2019, 103. [Google Scholar] [CrossRef]
- Antunes, M.; Realinho, V.; Velasco, J.I. Foaming behaviour, structure, and properties of polypropylene nanocomposites foams. J. Nanomater. 2010, 2010, 4. [Google Scholar] [CrossRef]
- Abbasi, H.; Antunes, M.; Velasco, J.I. Effects of Carbon Nanotubes/Graphene Nanoplatelets Hybrid Systems on the Structure and Properties of Polyetherimide-Based Foams. Polymers 2018, 10, 348. [Google Scholar] [CrossRef] [Green Version]
- Abbasi, H.; Antunes, M.; Velasco, J.I. Graphene nanoplatelets-reinforced polyetherimide foams prepared by water vapor-induced phase separation. EXPRESS Polym. Lett. 2015, 9, 412–423. [Google Scholar] [CrossRef]
- Abbasi, H.; Antunes, M.; Velasco, J.I. Polyetherimide foams filled with low content of graphene nanoplatelets prepared by scCO2 dissolution. Polymers 2019, 11, 328. [Google Scholar] [CrossRef] [Green Version]
- Abbasi, H.; Antunes, M.; Velasco, J.I. Influence of polyamide–imide concentration on the cellular structure and thermo-mechanical properties of polyetherimide/polyamide–imide blend foams. Eur. Polym. J. 2015, 69, 273–283. [Google Scholar] [CrossRef]
- Abbasi, H.; Antunes, M.; Velasco, J.I. Enhancing the electrical conductivity of polyetherimide-based foams by simultaneously increasing the porosity and graphene nanoplatelets dispersion. Polym. Compos. 2018, 40, E1416–E1425. [Google Scholar] [CrossRef]
- Abbasi, H.; Antunes, M.; Velasco, J.I. Effects of graphene nanoplatelets and cellular structure on the thermal conductivity of polysulfone nanocomposite foams. Polymers 2020, 12, 25. [Google Scholar] [CrossRef] [Green Version]
- Hou, S.; Su, S.; Kasner, M.L.; Shah, P.; Patel, K.; Madarang, C.J. Formation of highly stable dispersions of silane-functionalized reduced graphene oxide. Chem. Phys. Lett. 2010, 501, 68–74. [Google Scholar] [CrossRef]
- Lin, Y.; Jin, J.; Song, M. Preparation and characterisation of covalent polymer functionalized graphene oxide. J. Mater. Chem. 2011, 21, 3455–3461. [Google Scholar] [CrossRef]
- Fang, M.; Wang, K.; Lu, H.; Yang, Y.; Nutt, S. Covalent polymer functionalization of graphene nanosheets and mechanical properties of composites. J. Mater. Chem. 2009, 19, 7098–7105. [Google Scholar] [CrossRef]
- Stankovich, S.; Dikin, D.A.; Dommett, G.H.B.; Kohlhaas, K.M.; Zimney, E.J.; Stach, E.A.; Piner, R.D.; Nguyen, S.T.; Ruoff, R.S. Graphene-based composite materials. Nature 2006, 442, 282–286. [Google Scholar] [CrossRef] [PubMed]
- Antunes, M.; Mudarra, M.; Velasco, J.I. Broad-band electrical conductivity of carbon nanofibre-reinforced polypropylene foams. Carbon N. Y. 2011, 49, 708–717. [Google Scholar] [CrossRef]
- Ryvkina, N.; Tchmutin, I.; Vilčáková, J.; Pelíšková, M.; Sáha, P. The deformation behavior of conductivity in composites where charge carrier transport is by tunneling: Theoretical modeling and experimental results. Synth. Met. 2005, 148, 141–146. [Google Scholar] [CrossRef]
- Verdejo, R.; Bernal, M.M.; Romasanta, L.J.; Lopez-Manchado, M.A. Graphene filled polymer nanocomposites. J. Mater. Chem. 2011, 21, 3301–3310. [Google Scholar] [CrossRef] [Green Version]
- Liu, Z.; Bai, G.; Huang, Y.; Ma, Y.; Du, F.; Li, F.; Guo, T.; Chen, Y. Reflection and absorption contributions to the electromagnetic interference shielding of single-walled carbon nanotube/polyurethane composites. Carbon N. Y. 2007, 45, 821–827. [Google Scholar] [CrossRef]
- Yang, Y.; Gupta, M.C.; Dudley, K.L.; Lawrence, R.W. Novel Carbon Nanotube−Polystyrene Foam Composites for Electromagnetic Interference Shielding. Nano Lett. 2005, 5, 2131–2134. [Google Scholar] [CrossRef]
- Kim, H.; Miura, Y.; MacOsko, C.W. Graphene/polyurethane nanocomposites for improved gas barrier and electrical conductivity. Chem. Mater. 2010, 22, 3441–3450. [Google Scholar] [CrossRef]
- Zhang, H.-B.; Zheng, W.; Yan, Q.; Yang, Y.; Wang, J.-W.; Lu, Z.-H.; Ji, G.-Y.; Yu, Z.-Z. Electrically conductive polyethylene terephthalate/graphene nanocomposites prepared by melt compounding. Polymer (Guildf.) 2010, 51, 1191–1196. [Google Scholar] [CrossRef]
- Moghaddam, A.R.; Ranjbar, Z.; Sundararaj, U.; Jannesari, A.; Kamkar, M. A novel electrically conductive water borne epoxy nanocomposite coating based on graphene: Facile method and high efficient graphene dispersion. Prog. Org. Coat. 2019, 136, 105223. [Google Scholar] [CrossRef]
- Yousefi, N.; Gudarzi, M.M.; Zheng, Q.; Aboutalebi, S.H.; Sharif, F.; Kim, J.-K. Self-alignment and high electrical conductivity of ultralarge graphene oxide–polyurethane nanocomposites. J. Mater. Chem. 2012, 22, 12709–12717. [Google Scholar] [CrossRef]
- Krenchel, H. Fibre Reinforcement: Theoretical and Practical Investigations of the Elasticity and Strength of Fibre-Reinforced Materials; Akademisk Forlag: Oslo, Norway, 1964. [Google Scholar]
- Fisher, F.T.; Bradshaw, R.D.; Brinson, L.C. Fiber waviness in nanotube-reinforced polymer composites—I: Modulus predictions using effective nanotube properties. Compos. Sci. Technol. 2003, 63, 1689–1703. [Google Scholar] [CrossRef]
- Maxian, O.; Pedrazzoli, D.; Manas-Zloczower, I. Conductive polymer foams with carbon nanofillers—Modeling percolation behavior. Express Polym. Lett. 2017, 11, 406–418. [Google Scholar] [CrossRef]
- Gedler, G.; Antunes, M.; Velasco, J.I. Enhanced electrical conductivity in graphene-filled polycarbonate nanocomposites by microcellular foaming with sc-CO2. J. Adhes. Sci. Technol. 2016, 30, 1017–1029. [Google Scholar] [CrossRef] [Green Version]
| Publisher’s Note: MDPI stays neutral with regard to jurisdictional claims in published maps and institutional affiliations. |
© 2020 by the authors. Licensee MDPI, Basel, Switzerland. This article is an open access article distributed under the terms and conditions of the Creative Commons Attribution (CC BY) license (http://creativecommons.org/licenses/by/4.0/).


