Spectral-Time Multiplexing in FRET Complexes of AgInS2/ZnS Quantum Dot and Organic Dyes

 ,
,
Abstract
:
1. Introduction
2. Materials and Methods
2.1. Materials
2.1.1. Synthesis of AgInS2/ZnS QDs
2.1.2. Solubilization of AgInS2/ZnS QDs
2.1.3. Formation of QD/Cy Donor/Acceptor Complex
2.2. Equipment
3. Results
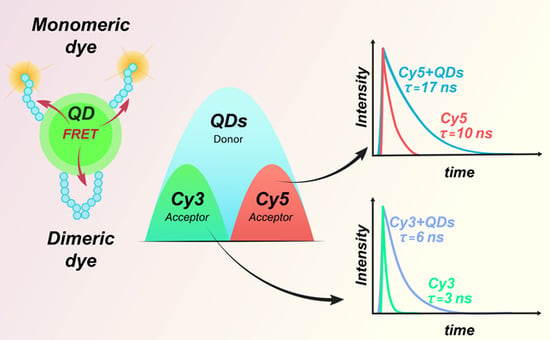
Time-Resolved FRET
4. Conclusions
Author Contributions
Funding
Conflicts of Interest
References
- Donzella, V.; Crea, F. Optical biosensors to analyze novel biomarkers in oncology. J. Biophotonics 2011, 4, 442–452. [Google Scholar] [CrossRef] [PubMed]
- Beske, O.; Guo, J.; Li, J.; Bassoni, D.; Bland, K.; Marciniak, H.; Zarowitz, M.; Temov, V.; Ravkin, I.; Goldbard, S. A Novel Encoded Particle Technology that Enables Simultaneous Interrogation of Multiple Cell Types. J. Biomol. Screen. 2004, 9, 173–185. [Google Scholar] [CrossRef] [PubMed] [Green Version]
- Fulton, R.; McDade, R.; Smith, P.; Kienker, L.; Kettman, J. Advanced multiplex analysis with the FlowMetrix system. Clin. Chem. 1997, 43, 1749–1756. [Google Scholar] [CrossRef] [PubMed] [Green Version]
- Nolan, J.; Mandy, F. Multiplexed and Microparticle-based Analyses: Quantitative Tools for the Large-Scale Analysis of Biological Systems. Cytometry. A 2006, 69, 318–325. [Google Scholar] [CrossRef] [Green Version]
- Shikha, S.; Salafi, T.; Cheng, J.; Zhang, Y. Versatile design and synthesis of nano-barcodes. Chem. Soc. Rev. 2017, 46, 7054–7093. [Google Scholar] [CrossRef] [PubMed] [Green Version]
- Viter, R.; Iatsunskyi, I. Metal Oxide Nanostructures in Sensing. In Nanomaterials Design for Sensing Applications, 1st ed.; Zenkina, O., Ed.; Elsevier: Amsterdam, The Netherlands, 2019; pp. 41–91. [Google Scholar]
- Sukhanova, A.; Nabiev, I. Fluorescent nanocrystal-encoded microbeads for multiplexed cancer imaging and diagnosis. Crit. Rev. Oncol. Hematol. 2008, 68, 39–59. [Google Scholar] [CrossRef]
- Xiang, Y.; Zhang, H.; Jiang, B.; Yaqin, C.; Yuan, R. Quantum Dot Layer-by-Layer Assemblies as Signal Amplification Labels for Ultrasensitive Electronic Detection of Uropathogens. Anal. Chem. 2011, 83, 4302–4306. [Google Scholar] [CrossRef]
- Sukhorukov, G.; Donath, E.; Davis, S.; Lichtenfeld, H.; Caruso, F.; Popov, V.; Moehwald, H. Stepwise polyelectrolyte assembly on particle surfaces: A novel approach to colloid design. Polym. Adv. Technol. 1998, 9, 759–767. [Google Scholar] [CrossRef]
- Mihindukulasuriya, S.; Morcone, T.; Mcgown, L. Characterization of acridone dyes for use in four-decay detection in DNA sequencing. Electrophoresis 2003, 24, 20–25. [Google Scholar] [CrossRef]
- Smalley, M.B.; McGown, L.B. Limits of Detection and Resolution for On-the-Fly Fluorescence Lifetime Detection in HPLC. Anal. Chem. 1995, 67, 1371–1376. [Google Scholar] [CrossRef]
- Abbasi, A.Z.; Amin, F.; Niebling, T.; Friede, S.; Ochs, M.; Carregal-Romero, S.; Montenegro, J.-M.; Rivera Gil, P.; Heimbrodt, W.; Parak, W.J. How Colloidal Nanoparticles Could Facilitate Multiplexed Measurements of Different Analytes with Analyte-Sensitive Organic Fluorophores. ACS Nano 2011, 5, 21–25. [Google Scholar] [CrossRef]
- Grabolle, M.; Nann, T.; Shu, X.; Ziegler, J.; Resch-Genger, U. Fluorescence Lifetime Multiplexing with Nanocrystals and Organic Labels. Anal. Chem. 2009, 81, 7807–7813. [Google Scholar] [CrossRef] [PubMed]
- Kaiser, U.; Sabir, N.; Carrillo-Carrión, C.; Del Pino, P.; Bossi, M.; Heimbrodt, W.; Parak, W. Förster resonance energy transfer mediated enhancement of the fluorescence lifetime of organic fluorophores to the millisecond range by coupling to Mn-doped CdS/ZnS quantum dots. Nanotechnology 2015, 27, 55101. [Google Scholar] [CrossRef] [PubMed] [Green Version]
- Lu, Y.; Zhao, J.; Zhang, R.; Liu, Y.; Liu, D.; Goldys, E.; Yang, X.; Xi, P.; Sunna, A.; Lu, J.; et al. Tunable lifetime multiplexing using luminescent nanocrystals. Nat. Photon. 2013, 8, 32–36. [Google Scholar] [CrossRef] [Green Version]
- Kage, D.; Hoffmann, K.; Nifontova, G.; Krivenkov, V.; Sukhanova, A.; Nabiev, I.; Resch-Genger, U. Tempo-spectral multiplexing in flow cytometry with lifetime detection using QD-encoded polymer beads. Sci. Rep. 2020, 10, 653. [Google Scholar] [CrossRef] [Green Version]
- Tamang, S.; Lincheneau, C.; Hermans, Y.; Jeong, S.; Reiss, P. Chemistry of InP Nanocrystal Syntheses. Chem. Mater. 2016, 28, 2491–2506. [Google Scholar] [CrossRef]
- Regulacio, M.; Win, K.Y.; Lo, S.L.; Zhang, S.Y.; Zhang, X.H.; Wang, S.; Han, M.Y.; Zheng, Y.G. Aqueous synthesis of highly luminescent AgInS2-ZnS quantum dots and their biological applications. Nanoscale 2013, 5, 2322–2327. [Google Scholar] [CrossRef]
- Stroyuk, O.; Raevskaya, A.; Spranger, F.; Selyshchev, O.; Dzhagan, V.; Schulze, S.; Zahn, D.R.T.; Eychmüller, A. Origin and Dynamics of Highly Efficient Broadband Photoluminescence of Aqueous Glutathione-Capped Size-Selected Ag–In–S Quantum Dots. J. Phys. Chem. C 2018, 122, 13648–13658. [Google Scholar] [CrossRef]
- Yang, F.; Wang, Y.-H.; Gao, J.; Sui, N.; Liu, Q.; Wang, Y.; Liu, L.; Zou, L.; Kang, Z.; Zhang, H. Studying of the photoluminescence characteristics of AgInS2 quantum dots. J. Nanopart. Res. 2015, 17, 159. [Google Scholar] [CrossRef]
- Hamanaka, Y.; Ozawa, K.; Kuzuya, T. Enhancement of Donor–Acceptor Pair Emissions in Colloidal AgInS2 Quantum Dots with High Concentrations of Defects. J. Phys. Chem. C 2014, 118, 14562–14568. [Google Scholar] [CrossRef]
- Manjiao, D.; Shen, S.; Wang, X.; Zhang, Y.; Xu, H.; Zhang, T.; Wang, Q. Controlled synthesis of AgInS2 nanocrystals and their application in organic–inorganic hybrid photodetectors. CrystEngComm 2013, 15, 4524–4533. [Google Scholar] [CrossRef]
- Martynenko, I.V.; Kusić, D.; Weigert, F.; Stafford, S.; Donnelly, F.C.; Evstigneev, R.; Gromova, Y.; Baranov, A.V.; Rühle, B.; Kunte, H.-J.; et al. Magneto-Fluorescent Microbeads for Bacteria Detection Constructed from Superparamagnetic Fe3O4 Nanoparticles and AIS/ZnS Quantum Dots. Anal. Chem. 2019, 91, 12661–12669. [Google Scholar] [CrossRef] [PubMed]
- Kurshanov, D.; Gromova, Y.; Cherevkov, S.; Ushakova, E.; Kormilina, T.; Dubavik, A.; Fedorov, A.; Baranov, A. Non-Toxic Ternary Quantum Dots AgInS2 and AgInS2/ZnS: Synthesis and Optical Properties. Opt. Spectrosc. 2018, 125, 1041–1046. [Google Scholar] [CrossRef]
- Gromova, Y.; Sokolova, A.; Kurshanov, D.; Korsakov, I.; Osipova, V.; Cherevkov, S.; Dubavik, A.; Maslov, V.; Perova, T.; Gun’ko, Y.; et al. Investigation of AgInS2/ZnS Quantum Dots by Magnetic Circular Dichroism Spectroscopy. Materials 2019, 12, 3616. [Google Scholar] [CrossRef] [Green Version]
- Cao, S.; An, X. White light emitting ternary quantum dots phosphors with controllable chromaticity and fluorescence resonance energy transfer. Mater. Lett. 2015, 155, 118–120. [Google Scholar] [CrossRef]
- Gao, X.; Li, D.; Tong, Y.; Ge, D.; Tang, Y.; Zhang, D.; Li, J. Highly sensitive fluorescence detection of glycoprotein based on energy transfer between CuInS2 QDs and rhodamine B. Luminescence 2015, 30, 1389–1394. [Google Scholar] [CrossRef]
- Evstigneev, R.; Parfenov, P.; Dubavik, A.; Cherevkov, S.; Fedorov, A.; Martynenko, I.; Resch-Genger, U.; Ushakova, E.; Baranov, A. Time-resolved FRET in AgInS2/ZnS-CdSe/ZnS quantum dot systems. Nanotechnology 2019, 30, 19. [Google Scholar] [CrossRef]
- Grecco, H.E.; Lidke, K.A.; Heintzmann, R.; Lidke, D.S.; Spagnuolo, C.; Martinez, O.E.; Jares-Erijman, E.A.; Jovin, T.M. Ensemble and single particle photophysical properties (two-photon excitation, anisotropy, FRET, lifetime, spectral conversion) of commercial quantum dots in solution and in live cells. Microsc. Res. Tech. 2004, 65, 169–179. [Google Scholar] [CrossRef]
- Martynenko, I.; Baimuratov, A.; Weigert, F.; Soares, J.; Dhamo, L.; Nickl, P.; Dörfel, I.; Pauli, J.; Rukhlenko, I.; Baranov, A.; et al. Photoluminescence of Ag-In-S/ZnS quantum dots: Excitation energy dependence and low-energy electronic structure. Nano Res. 2019, 12, 1–9. [Google Scholar] [CrossRef]
- Baimuratov, A.S.; Martynenko, I.V.; Baranov, A.V.; Fedorov, A.V.; Rukhlenko, I.D.; Kruchinin, S.Y. Giant Stokes Shifts in AgInS2 Nanocrystals with Trapped Charge Carriers. J. Phys. Chem. C 2019, 123, 16430–16438. [Google Scholar] [CrossRef] [Green Version]
- Conroy, E.M.; Li, J.J.; Kim, H.; Algar, W.R. Self-Quenching, Dimerization, and Homo-FRET in Hetero-FRET Assemblies with Quantum Dot Donors and Multiple Dye Acceptors. J. Phys. Chem. C 2016, 120, 17817–17828. [Google Scholar] [CrossRef]
- Bunt, G.; Wouters, S. FRET from single to multiplexed signaling events. Biophys. Rev. 2017, 9, 119–129. [Google Scholar] [CrossRef]
- Chen, S.; Ahmadiantehrani, M.; Zhao, J.; Zhu, S.; Mamalis, A.G.; Zhu, X. Heat-up synthesis of Ag–In–S and Ag–In–S/ZnS nanocrystals: Effect of indium precursors on their optical properties. J. Alloys Compd. 2016, 665, 137–143. [Google Scholar] [CrossRef] [PubMed] [Green Version]
- Vokhmintcev, K.; Linkov, P.; Samokhvalov, P.; Nabiev, I. Two-stage ZnS Shell Coating on the CuInS2 Quantum Dots for Their Effective Solubilization. KnE Energy 2018, 3, 535. [Google Scholar] [CrossRef]
- Martynenko, I.V.; Orlova, A.O.; Maslov, V.G.; Baranov, A.V.; Fedorov, A.V.; Artemyev, M. Energy transfer in complexes of water-soluble quantum dots and chlorin e6 molecules in different environments. J. Nanotechnol. 2013, 4, 895–902. [Google Scholar] [CrossRef] [PubMed] [Green Version]
- Martynenko, I.; Kuznetsova, V.; Orlova, A.; Kanaev, P.; Gromova, Y.; Maslov, V.; Baranov, A.; Fedorov, A. ZnSe/ZnS quantum dots-Photosensitizer complexes: Optical properties and cancer cell photodynamic destruction effect. In Proceedings of the Proceedings of SPIE-The International Society for Optical Engineering; SPIE Digital Library, Brussels, Beligium, 2 May 2014; Volume 9126, p. 91263C. [Google Scholar]
- Visheratina, A.K.; Loudon, A.; Kuznetsova, V.A.; Orlova, A.O.; Gun’ko, Y.K.; Baranov, A.V.; Fedorov, A. V Water-Soluble Conjugates of ZnS:Mn Quantum Dots with Chlorin e6 for Photodynamic Therapy. Opt. Spectrosc. 2018, 125, 94–98. [Google Scholar] [CrossRef]
- Raevskaya, A.; Lesnyak, V.; Haubold, D.; Dzhagan, V.; Stroyuk, O.; Gaponik, N.; Zahn, D.R.T.; Eychmüller, A. A Fine Size Selection of Brightly Luminescent Water-Soluble Ag–In–S and Ag–In–S/ZnS Quantum Dots. J. Phys. Chem. C 2017, 121, 9032–9042. [Google Scholar] [CrossRef] [Green Version]
- Egorov, V. Optical lineshapes for dimers of polymethine dyes: Dozy-chaos theory of quantum transitions and Frenkel exciton effect. RSC Adv. 2013, 3, 4598. [Google Scholar] [CrossRef]
- Horng, M.-L.; Quitevis, E.L. Visible Absorption Spectroscopy and Structure of Cyanine Dimers in Aqueous Solution: An Experiment for Physical Chemistry. J. Chem. Educ. 2000, 77, 637. [Google Scholar] [CrossRef]
- Dadadzhanov, D.R.; Martynenko, I.V.; Orlova, A.O.; Maslov, V.G.; Fedorov, A.V.; Baranov, A.V. The formation of molecular aggregates of sulfophthalocyanine in complexes with semiconductor nanocrystals. Opt. Spectrosc. 2015, 119, 738–743. [Google Scholar] [CrossRef]
- Xiang, W.; Xie, C.; Wang, J.; Zhong, J.; Liang, X.; Yang, H.; Luo, L.; Chen, Z. Studies on highly luminescent AgInS2 and Ag–Zn–In–S quantum dots. J. Alloys Compd. 2014, 588, 114–121. [Google Scholar] [CrossRef]
- Mao, B.; Chuang, C.-H.; Wang, J.; Burda, C. Synthesis and Photophysical Properties of Ternary I–III–VI AgInS2 Nanocrystals: Intrinsic versus Surface States. J. Phys. Chem. C 2011, 115, 8945–8954. [Google Scholar] [CrossRef]
- Mao, B.; Chuang, C.-H.; Lu, F.; Sang, L.; Zhu, J.; Burda, C. Study of the Partial Ag-to-Zn Cation Exchange in AgInS2/ZnS Nanocrystals. J. Phys. Chem. C 2013, 117, 648–656. [Google Scholar] [CrossRef]
- Ogawa, T.; Kuzuya, T.; Hamanaka, Y.; Sumiyama, K. Synthesis of Ag–In binary sulfide nanoparticles—structural tuning and their photoluminescence properties. J. Mater. Chem. 2010, 20, 2226–2231. [Google Scholar] [CrossRef]
- Kang, X.; Yang, Y.; Huang, L.; Tao, Y.; Wang, L. Large-scale synthesis of water-soluble CuInSe2/ZnS and AgInSe2/ZnS core/shell quantum dots. Green Chem. 2015, 17, 4482–4488. [Google Scholar] [CrossRef]
- Hong, S.P.; Park, H.K.; Oh, J.H.; Yang, H.; Do, Y.R. Comparisons of the structural and optical properties of o-AgInS2, t-AgInS2, and c-AgIn5S8 nanocrystals and their solid-solution nanocrystals with ZnS. J. Mater. Chem. 2012, 22, 18939–18949. [Google Scholar] [CrossRef]


| Complex | Extinction of the Dye (εA) | Quantum Yield of QDs (QYD) | Overlap Integral |
|---|---|---|---|
| QDs/Cy3 | 140,000 | 5.6% | 4.7 × 10⁻¹³ |
| QDs/Cy5 | 230,000 | 5.6% | 4.2 × 10⁻¹³ |
© 2020 by the authors. Licensee MDPI, Basel, Switzerland. This article is an open access article distributed under the terms and conditions of the Creative Commons Attribution (CC BY) license (http://creativecommons.org/licenses/by/4.0/).
Share and Cite
Kuznetsova, V.; Tkach, A.; Cherevkov, S.; Sokolova, A.; Gromova, Y.; Osipova, V.; Baranov, M.; Ugolkov, V.; Fedorov, A.; Baranov, A. Spectral-Time Multiplexing in FRET Complexes of AgInS2/ZnS Quantum Dot and Organic Dyes. Nanomaterials 2020, 10, 1569. https://0-doi-org.brum.beds.ac.uk/10.3390/nano10081569
Kuznetsova V, Tkach A, Cherevkov S, Sokolova A, Gromova Y, Osipova V, Baranov M, Ugolkov V, Fedorov A, Baranov A. Spectral-Time Multiplexing in FRET Complexes of AgInS2/ZnS Quantum Dot and Organic Dyes. Nanomaterials. 2020; 10(8):1569. https://0-doi-org.brum.beds.ac.uk/10.3390/nano10081569
Chicago/Turabian StyleKuznetsova, Vera, Anton Tkach, Sergei Cherevkov, Anastasiia Sokolova, Yulia Gromova, Viktoria Osipova, Mikhail Baranov, Valery Ugolkov, Anatoly Fedorov, and Alexander Baranov. 2020. "Spectral-Time Multiplexing in FRET Complexes of AgInS2/ZnS Quantum Dot and Organic Dyes" Nanomaterials 10, no. 8: 1569. https://0-doi-org.brum.beds.ac.uk/10.3390/nano10081569