Preparation and Performance of Porous Carbon Nanocomposite from Renewable Phenolic Resin and Halloysite Nanotube

Abstract
:1. Introduction
2. Experimental
2.1. Materials
2.2. Materials Preparation
2.2.1. Synthesis of Renewable Phenolic Resin
2.2.2. Pretreatment of HNT
2.2.3. Preparation of HNT/C
2.3. Characterizations
2.4. Electrochemical Measurements
3. Results and Discussion
4. Conclusions
Supplementary Materials
Author Contributions
Funding
Acknowledgments
Conflicts of Interest
References
- Zhang, L.L.; Zhao, X.S. Carbon-based materials as supercapacitor electrodes. Chem. Soc. Rev. 2009, 38, 2520–2531. [Google Scholar] [CrossRef] [PubMed]
- Zheng, Z.; Gao, Q. Hierarchical porous carbons prepared by an easy one-step carbonization and activation of phenol–formaldehyde resins with high performance for supercapacitors. J. Power Sources 2011, 196, 1615–1619. [Google Scholar] [CrossRef]
- Wang, Y.; Shi, Z.; Huang, Y.; Ma, Y.; Wang, C.; Chen, M.; Chen, Y. Supercapacitor Devices Based on Graphene Materials. J. Phys. Chem. C 2009, 113, 13103–13107. [Google Scholar] [CrossRef]
- Kim, B.K.; Chabot, V.; Yu, A. Carbon nanomaterials supported Ni(OH)2/NiO hybrid flower structure for supercapacitor. Electrochim. Acta 2013, 109, 370–380. [Google Scholar] [CrossRef]
- Liang, Q.; Ye, L.; Huang, Z.H.; Xu, Q.; Bai, Y.; Kang, F.; Yang, Q.H. A honeycomb-like porous carbon derived from pomelo peel for use in high-performance supercapacitors. Nanoscale 2014, 6, 13831–13837. [Google Scholar] [CrossRef]
- Chan, K.; Lee, J.W.; Kim, J.H.; Yang, K.S. Feasibility of bamboo-based activated carbons for an electrochemical supercapacitor electrode. Korean J. Chem. Eng. 2006, 23, 592–594. [Google Scholar]
- Du, C.; Pan, N. High power density supercapacitor electrodes of carbon nanotube films by electrophoretic deposition. Nanotechnology 2006, 17, 5314–5318. [Google Scholar] [CrossRef]
- Zhang, L.L.; Zhou, R.; Zhao, X.S. Graphene-based materials as supercapacitor electrodes. J. Mater. Chem. 2010, 20, 5980–5983. [Google Scholar] [CrossRef]
- Kim, C.; Yang, K.S. Electrochemical properties of carbon nanofiber web as an electrode for supercapacitor prepared by electrospinning. Appl. Phys. Lett. 2003, 83, 1216. [Google Scholar] [CrossRef]
- Chen, H.; Zhou, M.; Wang, Z.; Zhao, S.; Guan, S. Rich nitrogen-doped ordered mesoporous phenolic resin-based carbon for supercapacitors. Electrochim. Acta 2014, 148, 187–194. [Google Scholar] [CrossRef]
- Torop, J.; Palmre, V.; Arulepp, M.; Sugino, T.; Asaka, K.; Aabloo, A. Flexible supercapacitor-like actuator with carbide-derived carbon electrodes. Carbon 2011, 49, 3113–3119. [Google Scholar] [CrossRef]
- Wu, F.; Gao, J.; Zhai, X.; Xie, M.; Sun, Y.; Kang, H.; Tian, Q.; Qiu, H. Hierarchical porous carbon microrods derived from albizia flowers for high performance supercapacitors. Carbon 2019, 147, 242–251. [Google Scholar] [CrossRef]
- Wang, Q.; Yan, J.; Wang, Y.; Wei, T.; Zhang, M.; Jing, X.; Fan, Z. Three-dimensional flower-like and hierarchical porous carbon materials as high-rate performance electrodes for supercapacitors. Carbon 2014, 67, 119–127. [Google Scholar] [CrossRef]
- Sarkar, S.; Adhikari, B. Lignin-modified phenolic resin: Synthesis optimization, adhesive strength, and thermal stability. J. Adhes. Sci. Technol. 2000, 14, 1179–1193. [Google Scholar] [CrossRef]
- Xue, R.; Yan, J.; Liu, X.; Tian, Y.; Yi, B. Effect of activation on the carbon fibers from phenol–formaldehyde resins for electrochemical supercapacitors. J. Appl. Electrochem. 2011, 41, 1357–1366. [Google Scholar] [CrossRef]
- Pekala, R.W.; Kong, F.-M. A synthetic route to organic aerogels-mechanism, structure, and properties. J. Phys. Colloq. 1989, 50, 33–40. [Google Scholar] [CrossRef]
- Sui, D.; Xu, L.; Zhang, H.; Sun, Z.; Kan, B.; Ma, Y.; Chen, Y. A 3D cross-linked graphene-based honeycomb carbon composite with excellent confinement effect of organic cathode material for lithium-ion batteries. Carbon 2020, 157, 656–662. [Google Scholar] [CrossRef]
- Lei, C.; Amini, N.; Markoulidis, F.; Wilson, P.; Tennison, S.; Lekakou, C. Activated carbon from phenolic resin with controlled mesoporosity for an electric double-layer capacitor (EDLC). J. Mater. Chem. A 2013, 1, 6037–6042. [Google Scholar] [CrossRef]
- Ibrahim, M.N.M.; Zakaria, N.; Sipaut, C.S.; Sulaiman, O.; Hashim, R. Chemical and thermal properties of lignins from oil palm biomass as a substitute for phenol in a phenol formaldehyde resin production. Carbohydr. Polym. 2011, 86, 112–119. [Google Scholar] [CrossRef] [Green Version]
- Zhang, Y.; Ferdosian, F.; Yuan, Z.; Xu, C. (Charles) Sustainable glucose-based phenolic resin and its curing with a DGEBA epoxy resin. J. Taiwan Inst. Chem. Eng. 2017, 71, 381–387. [Google Scholar] [CrossRef]
- Frackowiak, E.; Béguin, F. Carbon materials for the electrochemical storage of energy in capacitors. Carbon 2001, 39, 937–950. [Google Scholar] [CrossRef]
- Kausar, A. Review on Polymer/Halloysite Nanotube Nanocomposite. Polym. Technol. Eng. 2017, 57, 548–564. [Google Scholar] [CrossRef]
- Pandi, N.; Sonawane, S.H.; Kola, A.K.; Zore, U.K.; Borse, P.H.; Ambade, S.B.; AshokKumar, M. Halloysite nanotubes-based supercapacitor: Preparation using sonochemical approach and its electrochemical performance. Energy Ecol. Environ. 2020, 1–13. [Google Scholar] [CrossRef]
- Huang, H.; Yao, J.; Chen, H.; Zeng, X.; Chen, C.; She, X.; Li, L. Facile preparation of halloysite/polyaniline nanocomposites via in situ polymerization and layer-by-layer assembly with good supercapacitor performance. J. Mater. Sci. 2016, 51, 4047–4054. [Google Scholar] [CrossRef]
- Liu, Y.; Jiang, X.; Li, B.; Zhang, X.; Liu, T.; Yan, X.; Ding, J.; Cai, Q.; Zhang, J. Halloysite nanotubes@reduced graphene oxide composite for removal of dyes from water and as supercapacitors. J. Mater. Chem. A 2014, 2, 4264–4269. [Google Scholar] [CrossRef]
- Joussein, E.; Petit, S.; Delvaux, B. Behavior of halloysite clay under formamide treatment. Appl. Clay Sci. 2007, 35, 17–24. [Google Scholar] [CrossRef]
- Shchukin, D.; Sukhorukov, G.; Price, R.; Lvov, Y. Halloysite Nanotubes as Biomimetic Nanoreactors. Small 2005, 1, 510–513. [Google Scholar] [CrossRef]
- Yang, C.; Liu, P.; Zhao, Y. Preparation and characterization of coaxial halloysite/polypyrrole tubular nanocomposites for electrochemical energy storage. Electrochim. Acta 2010, 55, 6857–6864. [Google Scholar] [CrossRef]
- Ma, C.; Chen, X.; Long, D.; Wang, J.; Qiao, W.; Ling, L. High-surface-area and high-nitrogen-content carbon microspheres prepared by a pre-oxidation and mild KOH activation for superior supercapacitor. Carbon 2017, 118, 699–708. [Google Scholar] [CrossRef] [Green Version]
- Qie, L.; Chen, W.; Xu, H.; Xiong, X.; Jiang, Y.; Zou, F.; Hu, X.; Xin, Y.; Zhang, Z.; Huangb, Y. Synthesis of functionalized 3D hierarchical porous carbon for high-performance supercapacitors. Energy Environ. Sci. 2013, 6, 2497–2504. [Google Scholar] [CrossRef]
- Lv, Y.; Zhang, F.; Dou, Y.; Zhai, Y.; Wang, J.; Liu, H.; Xia, Y.; Tu, B.; Zhao, D. A comprehensive study on KOH activation of ordered mesoporous carbons and their supercapacitor application. J. Mater. Chem. 2012, 22, 93–99. [Google Scholar] [CrossRef]
- Wu, Z.; Yang, Y.; Tu, B.; Webley, P.A.; Zhao, D. Adsorption of xylene isomers on ordered hexagonal mesoporous FDU-15 polymer and carbon materials. Adsorption 2009, 15, 123–132. [Google Scholar] [CrossRef]
- Wang, Z.; Zhou, M.; Chen, H.; Jiang, J.; Guan, S. Hierarchical Activated Mesoporous Phenolic-Resin-Based Carbons for Supercapacitors. Chem. Asian J. 2014, 9, 2789–2797. [Google Scholar] [CrossRef]
- Tao, Y.; Wu, Y.; Chen, H.; Chen, W.; Wang, J.; Tong, Y.; Pei, G.; Shena, Z.; Guan, C. Synthesis of amorphous hydroxyl-rich Co3O4 for flexible high-rate supercapacitor. Chem. Eng. J. 2020, 396, 125364. [Google Scholar] [CrossRef]
- Liang, J.; Tan, H.; Xiao, C.; Zhou, G.; Guo, S.; Ding, S. Hydroxyl-riched halloysite clay nanotubes serving as substrate of NiO nanosheets for high-performance supercapacitor. J. Power Sources 2015, 285, 210–216. [Google Scholar] [CrossRef]
- Yang, H.; He, X.; Ouyang, J.; Yang, H. Palladium nanoparticles deposited on silanized halloysite nanotubes: Synthesis, characterization and enhanced catalytic property. Sci. Rep. 2013, 3, srep02948. [Google Scholar] [CrossRef]
- Chen, X.Y.; Chen, C.; Zhang, Z.J.; Xie, D.H.; Deng, X.; Liu, J.W. Nitrogen-doped porous carbon for supercapacitor with long-term electrochemical stability. J. Power Sources 2013, 230, 50–58. [Google Scholar] [CrossRef]
- Biniak, S.; Szymański, G.S.; Siedlewski, J.; Świa̧tkowski, A. The characterization of activated carbons with oxygen and nitrogen surface groups. Carbon 1997, 35, 1799–1810. [Google Scholar] [CrossRef]
- Zhang, Y.; Wen, G.; Fan, S.; Ma, W.; Li, S.; Wu, T.; Yu, Z.; Zhao, B. Alcoholic hydroxyl functionalized partially reduced graphene oxides for symmetric supercapacitors with long-term cycle stability. Electrochim. Acta 2019, 313, 59–69. [Google Scholar] [CrossRef]
- Abbas, Q.; Pajak, D.; Frackowiak, E.; Béguin, F. Effect of binder on the performance of carbon/carbon symmetric capacitors in salt aqueous electrolyte. Electrochim. Acta 2014, 140, 132–138. [Google Scholar] [CrossRef]
- Varzi, A.; Raccichini, R.; Marinaro, M.; Wohlfahrt-Mehrens, M.; Passerini, S. Probing the characteristics of casein as green binder for non-aqueous electrochemical double layer capacitors’ electrodes. J. Power Sources 2016, 326, 672–679. [Google Scholar] [CrossRef]
- Ricketts, B.; Ton-That, C. Self-discharge of carbon-based supercapacitors with organic electrolytes. J. Power Sources 2000, 89, 64–69. [Google Scholar] [CrossRef]
- Li, Y.; Zhang, H.; Wang, S.; Lin, Y.; Chen, Y.; Shi, Z.; Li, N.; Wang, W.; Guo, Z. Facile low-temperature synthesis of hematite quantum dots anchored on a three-dimensional ultra-porous graphene-like framework as advanced anode materials for asymmetric supercapacitors. J. Mater. Chem. A 2016, 4, 11247–11255. [Google Scholar] [CrossRef]
- Salitra, G.; Soffer, A.; Eliad, L.; Cohen, Y.; Aurbach, D. Carbon Electrodes for Double-Layer Capacitors I. Relations Between Ion and Pore Dimensions. J. Electrochem. Soc. 2000, 147, 2486–2493. [Google Scholar] [CrossRef]
- Zhou, Z.; Liu, T.; Khan, A.U.; Liu, G. Block copolymer–based porous carbon fibers. Sci. Adv. 2019, 5, eaau6852. [Google Scholar] [CrossRef] [PubMed] [Green Version]
- Huang, Z.-H.; Liu, T.; Song, Y.; Li, Y.; Liu, X.-X. Balancing the electrical double layer capacitance and pseudocapacitance of hetero-atom doped carbon. Nanoscale 2017, 9, 13119–13127. [Google Scholar] [CrossRef] [Green Version]
- Li, Y.; Yu, N.; Yan, P.; Li, Y.; Zhou, X.; Chen, S.; Wang, G.; Wei, T.; Fan, Z. Fabrication of manganese dioxide nanoplates anchoring on biomass-derived cross-linked carbon nanosheets for high-performance asymmetric supercapacitors. J. Power Sources 2015, 300, 309–317. [Google Scholar] [CrossRef]
- Alavi, S.; Birkl, C.R.; Howey, D.A. Time-domain fitting of battery electrochemical impedance models. J. Power Sources 2015, 288, 345–352. [Google Scholar] [CrossRef]
- Li, Y.; Wang, G.; Wei, T.; Fan, Z.; Yan, P. Nitrogen and sulfur co-doped porous carbon nanosheets derived from willow catkin for supercapacitors. Nano Energy 2016, 19, 165–175. [Google Scholar] [CrossRef]
- Zhou, J.; Qiu, Z.; Zhou, J.; Si, W.; Cui, H.; Zhuo, S. Hierarchical porous carbons from alkaline poplar bark extractive-based phenolic resins for supercapacitors. Electrochim. Acta 2015, 180, 1007–1013. [Google Scholar] [CrossRef]
- Ganganboina, A.B.; Chowdhury, A.D.; Doong, R.-A. New Avenue for Appendage of Graphene Quantum Dots on Halloysite Nanotubes as Anode Materials for High Performance Supercapacitors. ACS Sustain. Chem. Eng. 2017, 5, 4930–4940. [Google Scholar] [CrossRef]
- Ganganboina, A.B.; Chowdhury, A.D.; Doong, R.-A. Nano assembly of N-doped graphene quantum dots anchored Fe3O4 /halloysite nanotubes for high performance supercapacitor. Electrochim. Acta 2017, 245, 912–923. [Google Scholar] [CrossRef]
- Guo, J.; Wu, D.; Wang, T.; Ma, Y. P-doped hierarchical porous carbon aerogels derived from phenolic resins for high performance supercapacitor. Appl. Surf. Sci. 2019, 475, 56–66. [Google Scholar] [CrossRef]


| Sample | SBET m2·g−1 | Vtotal cm3·g−1 | Pore Size nm | CKOH F·g−1 |
|---|---|---|---|---|
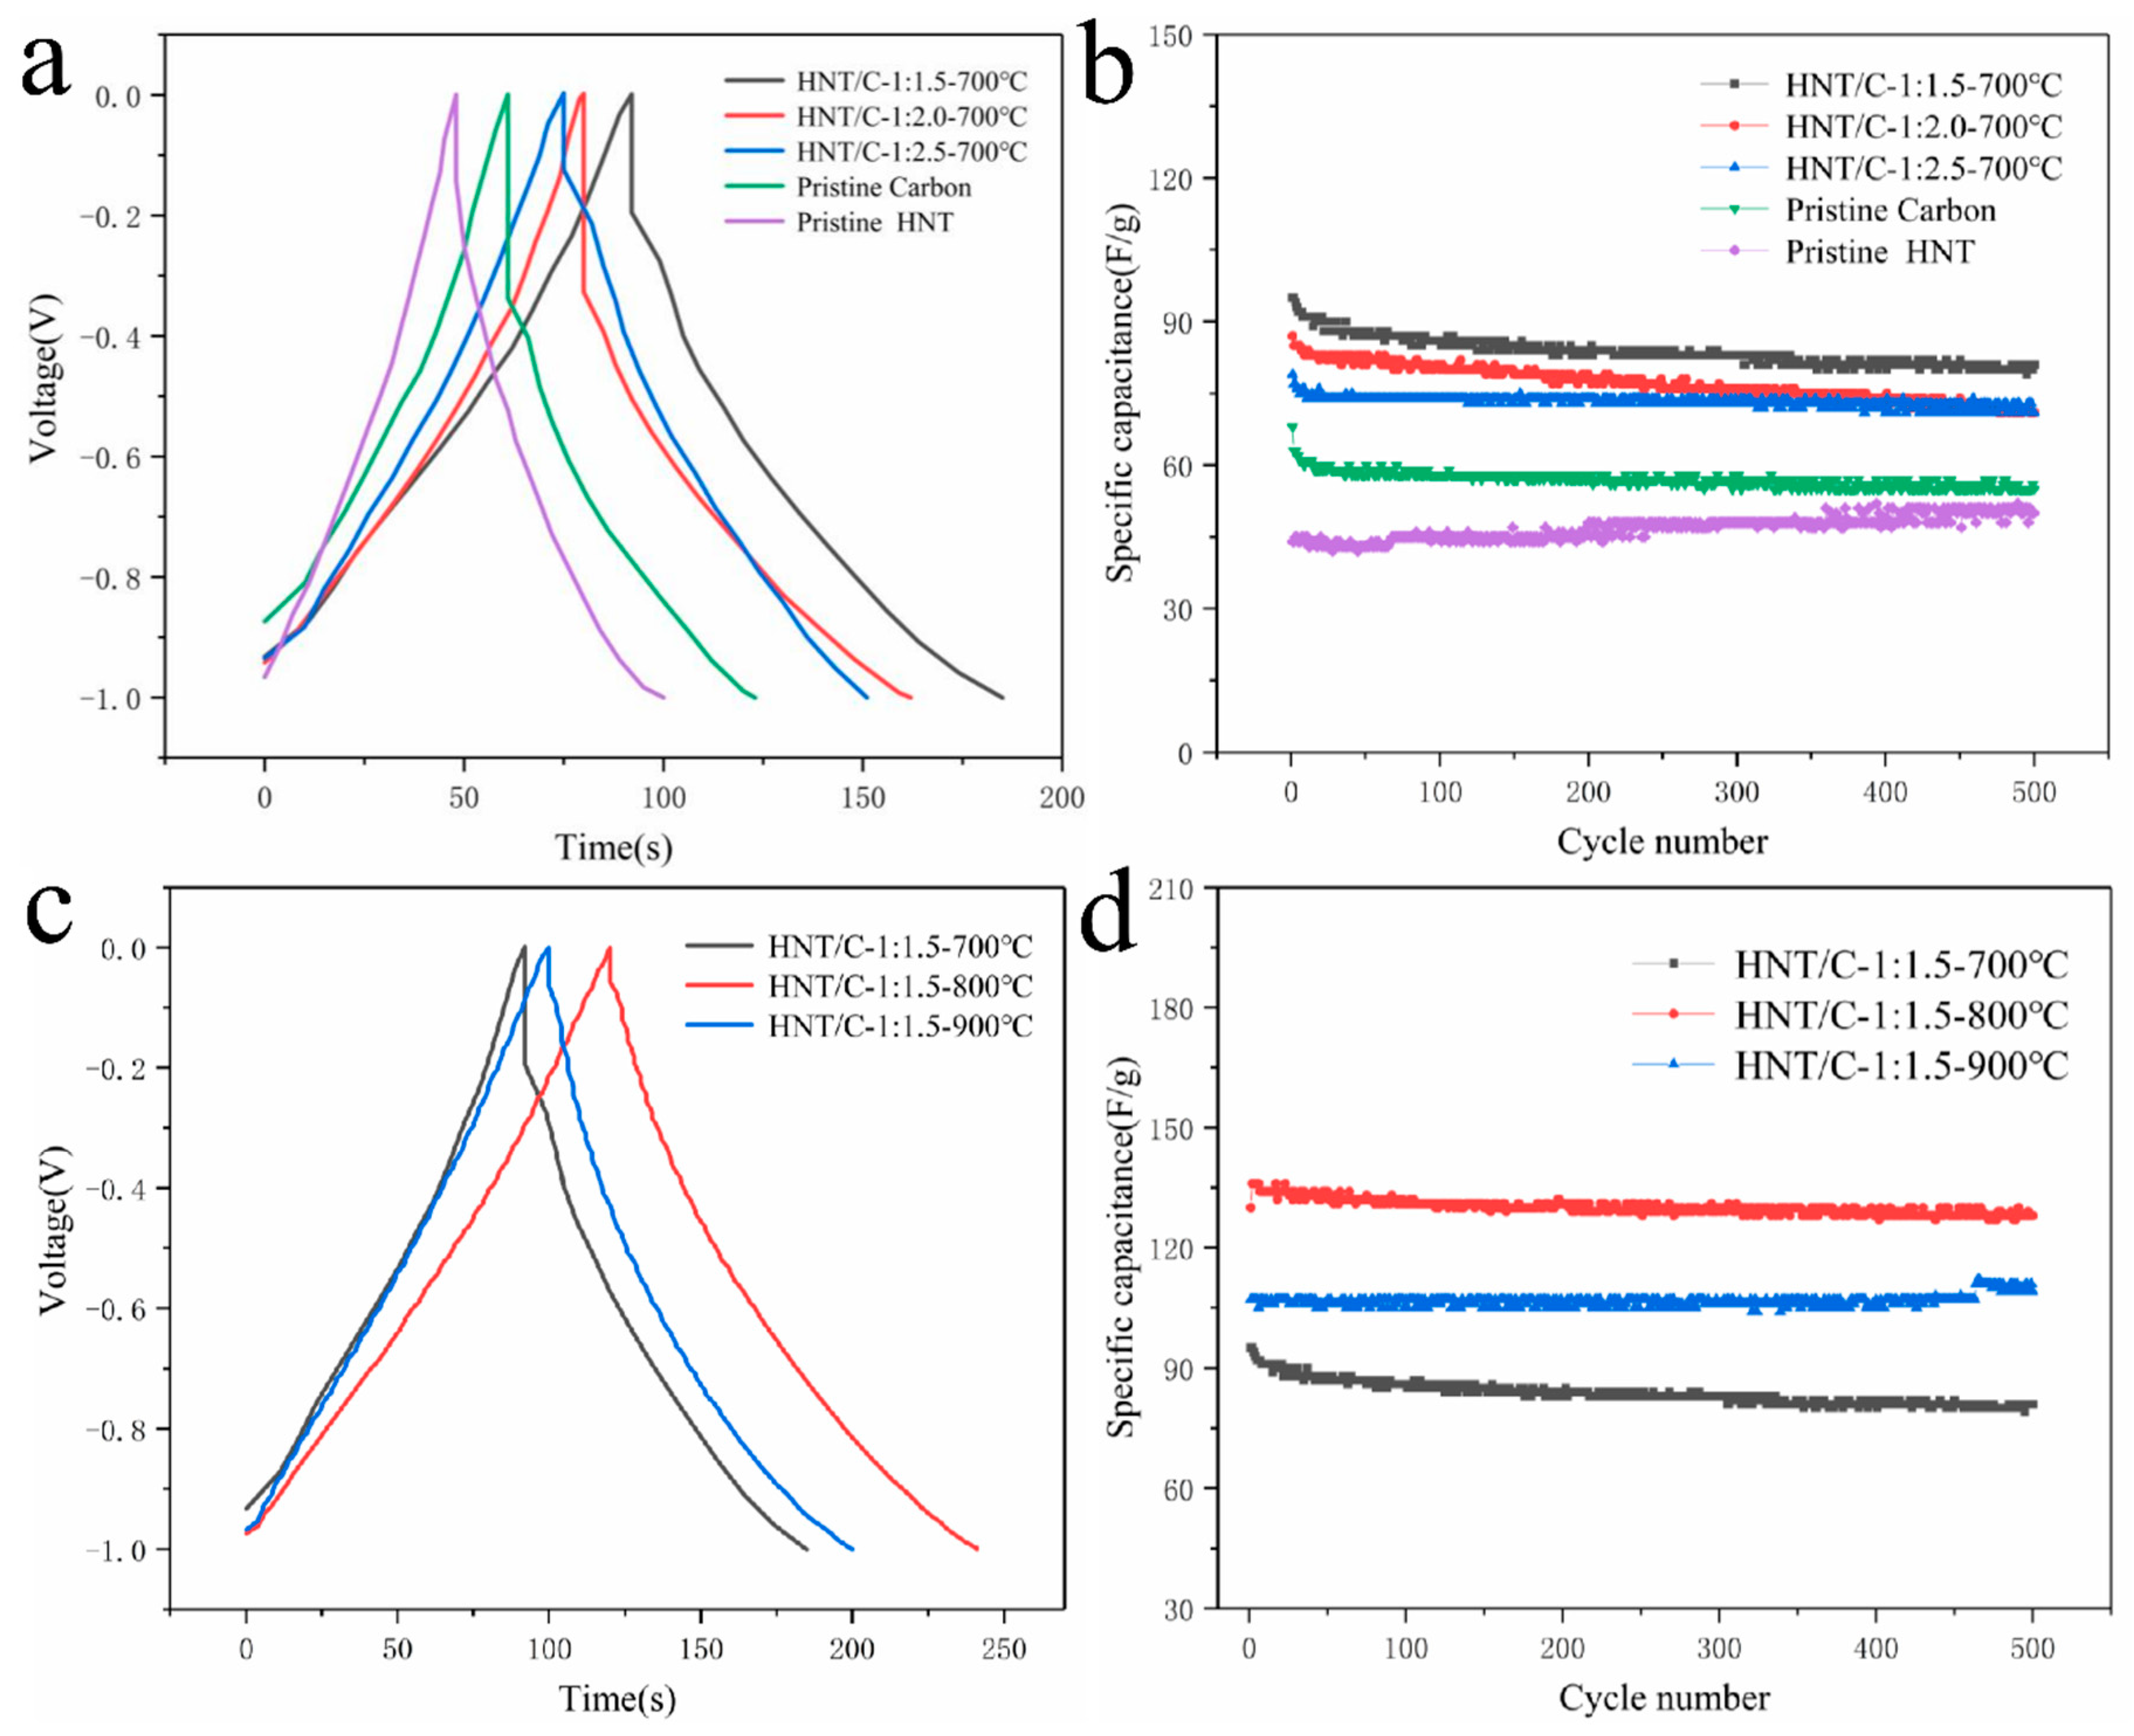
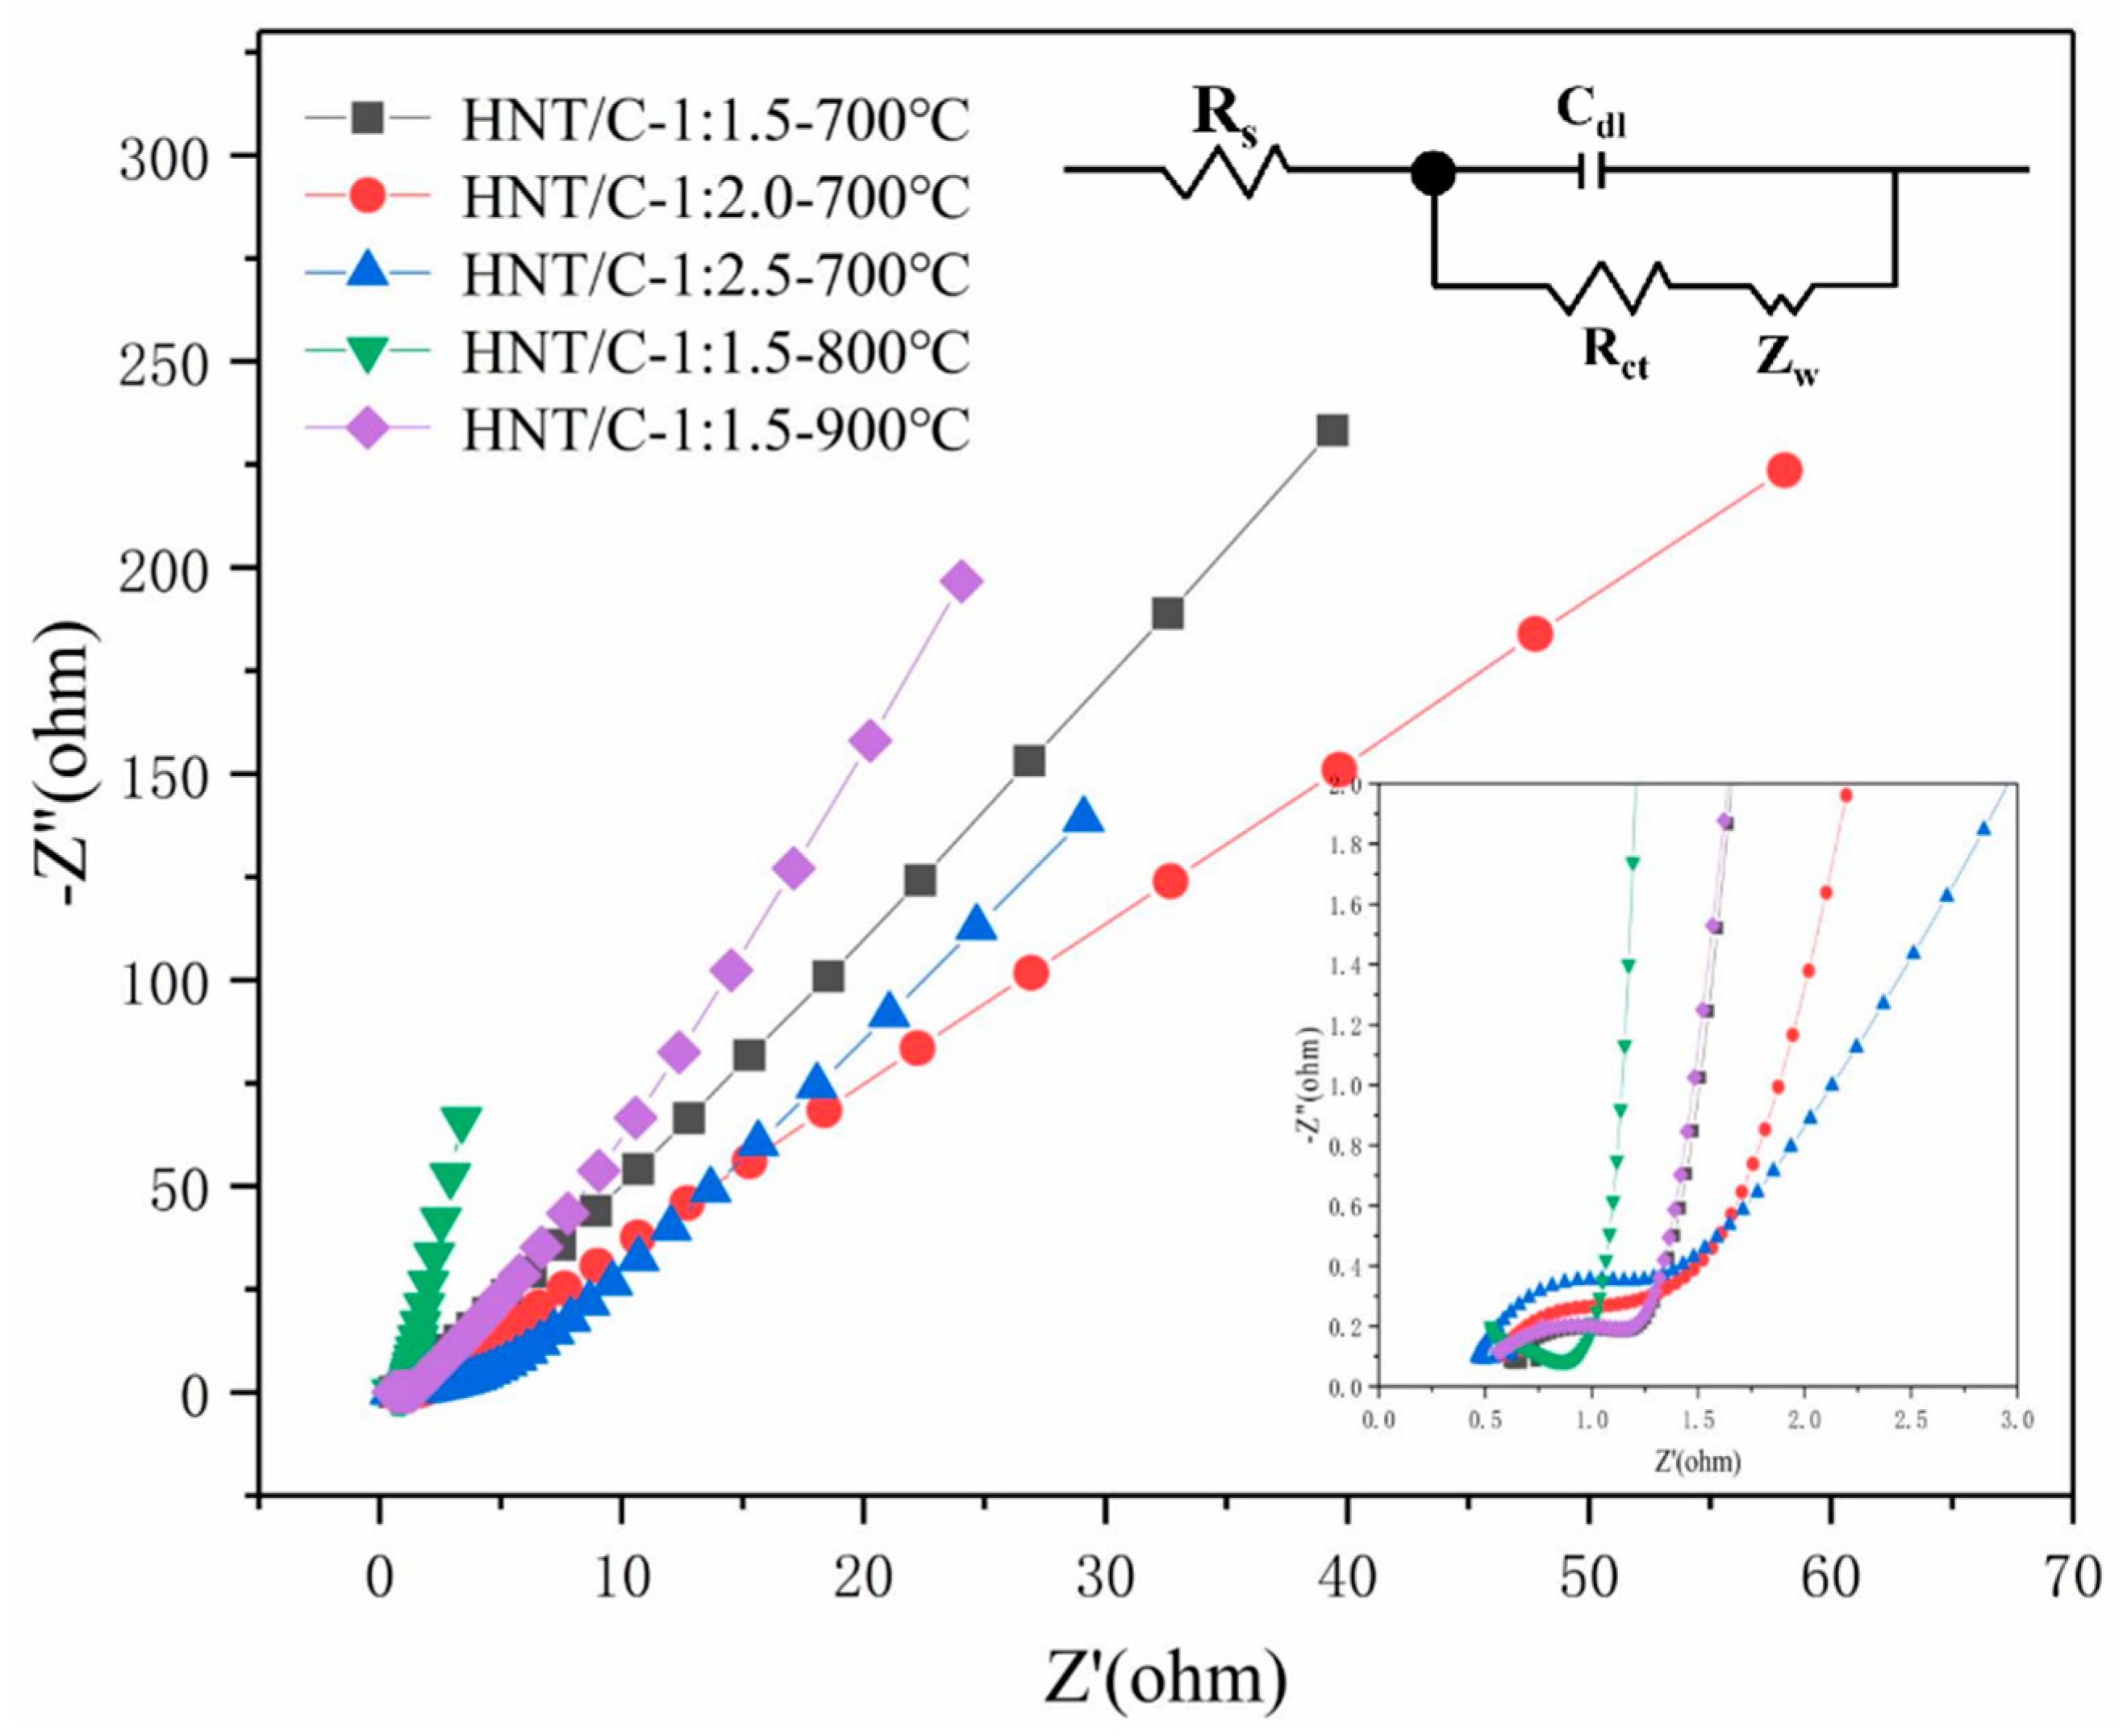
| HNT/C-1:1.5-700 | 211 | 0.24 | 10.3 | 95 |
| HNT/C-1:2.0-700 | 245 | 0.31 | 8.8 | 87 |
| HNT/C-1:2.5-700 | 254 | 0.27 | 9.7 | 79 |
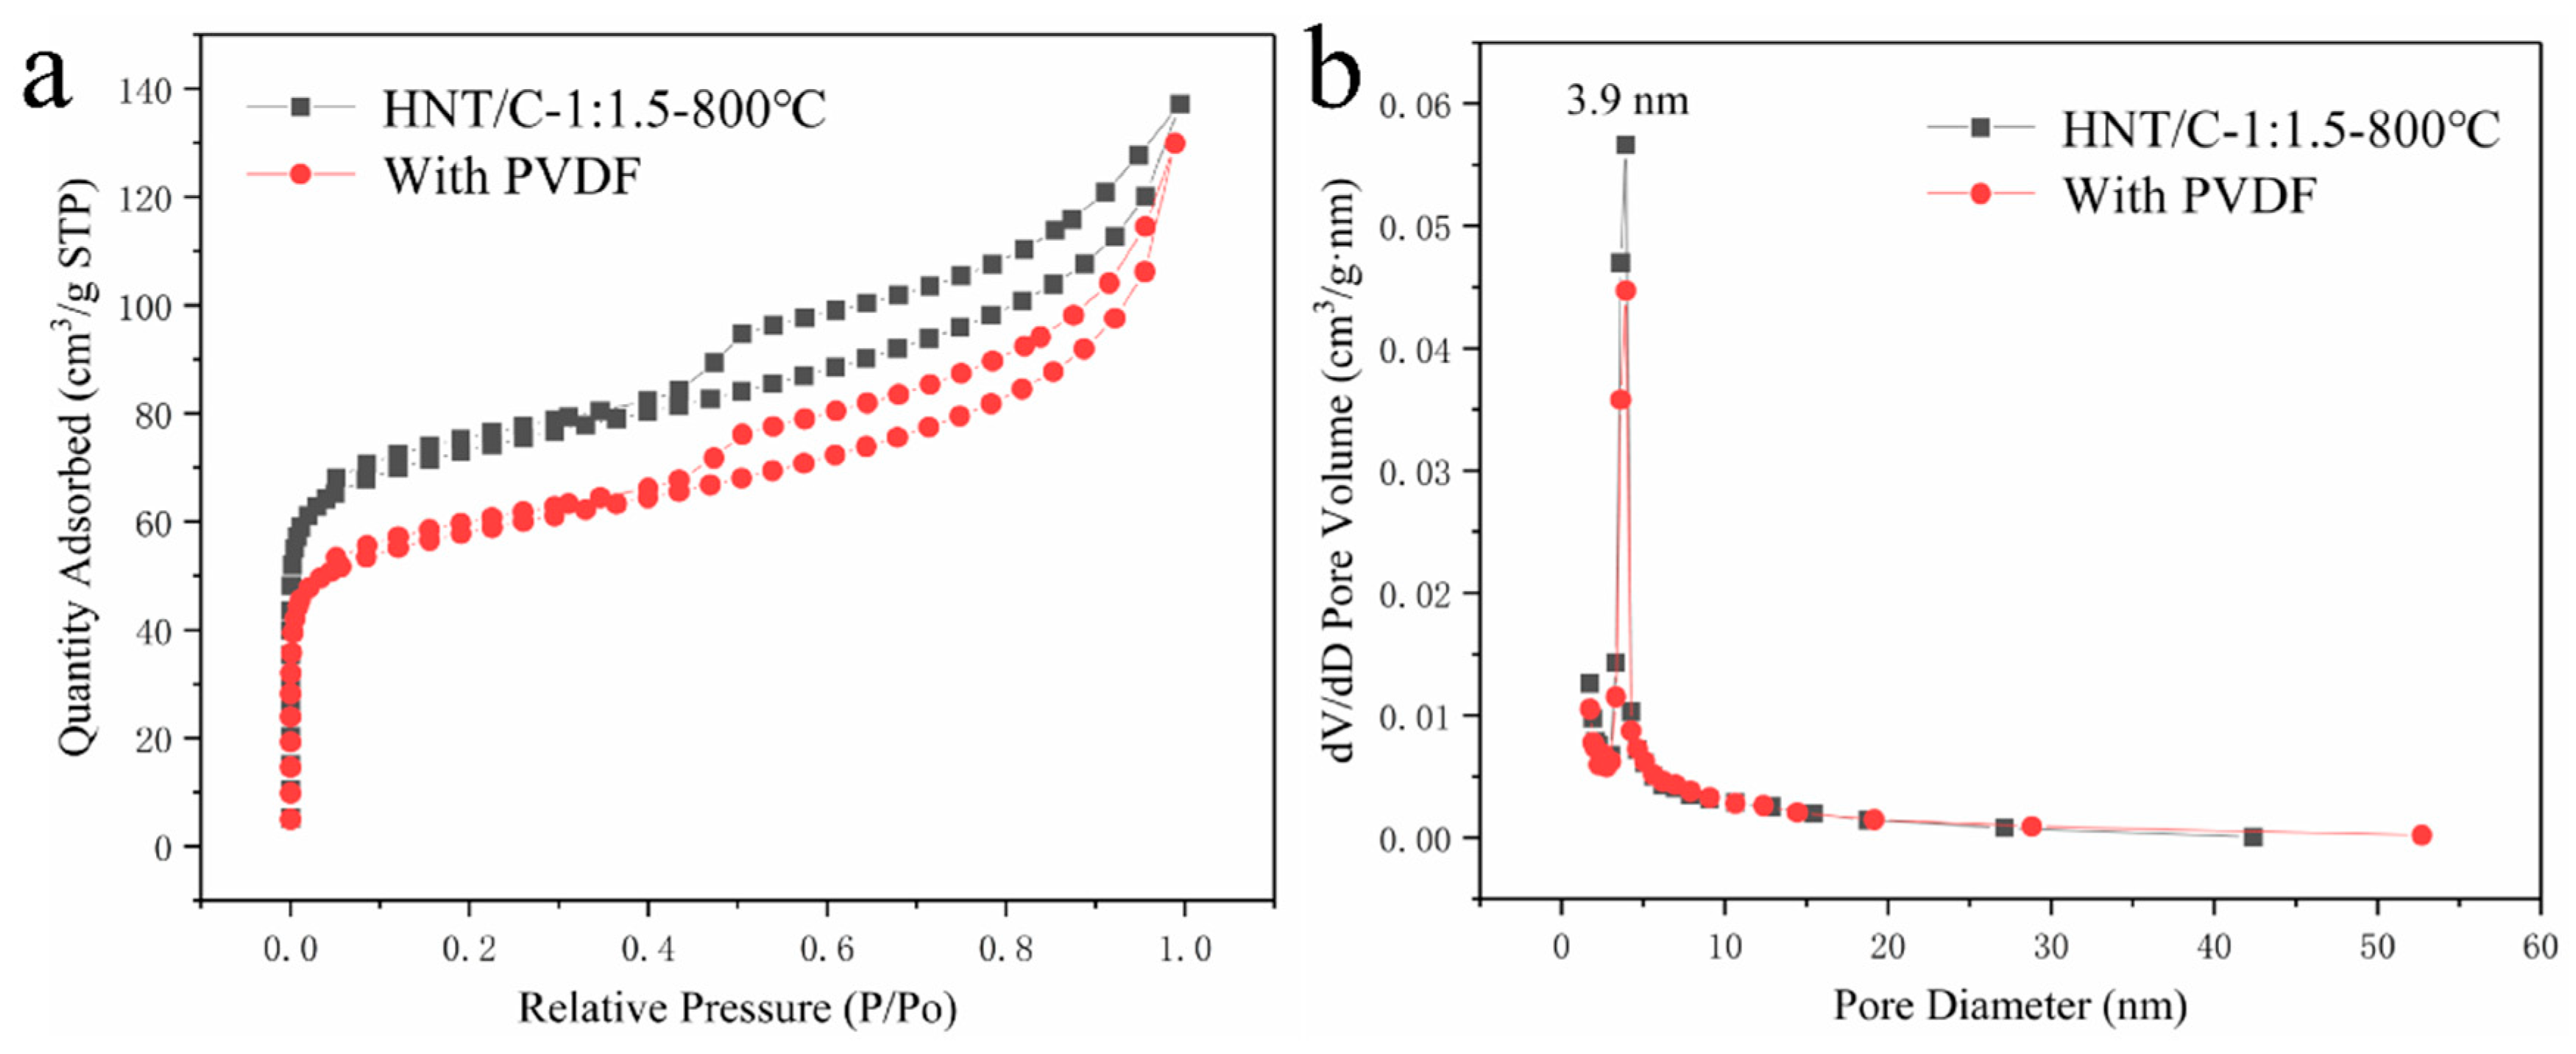
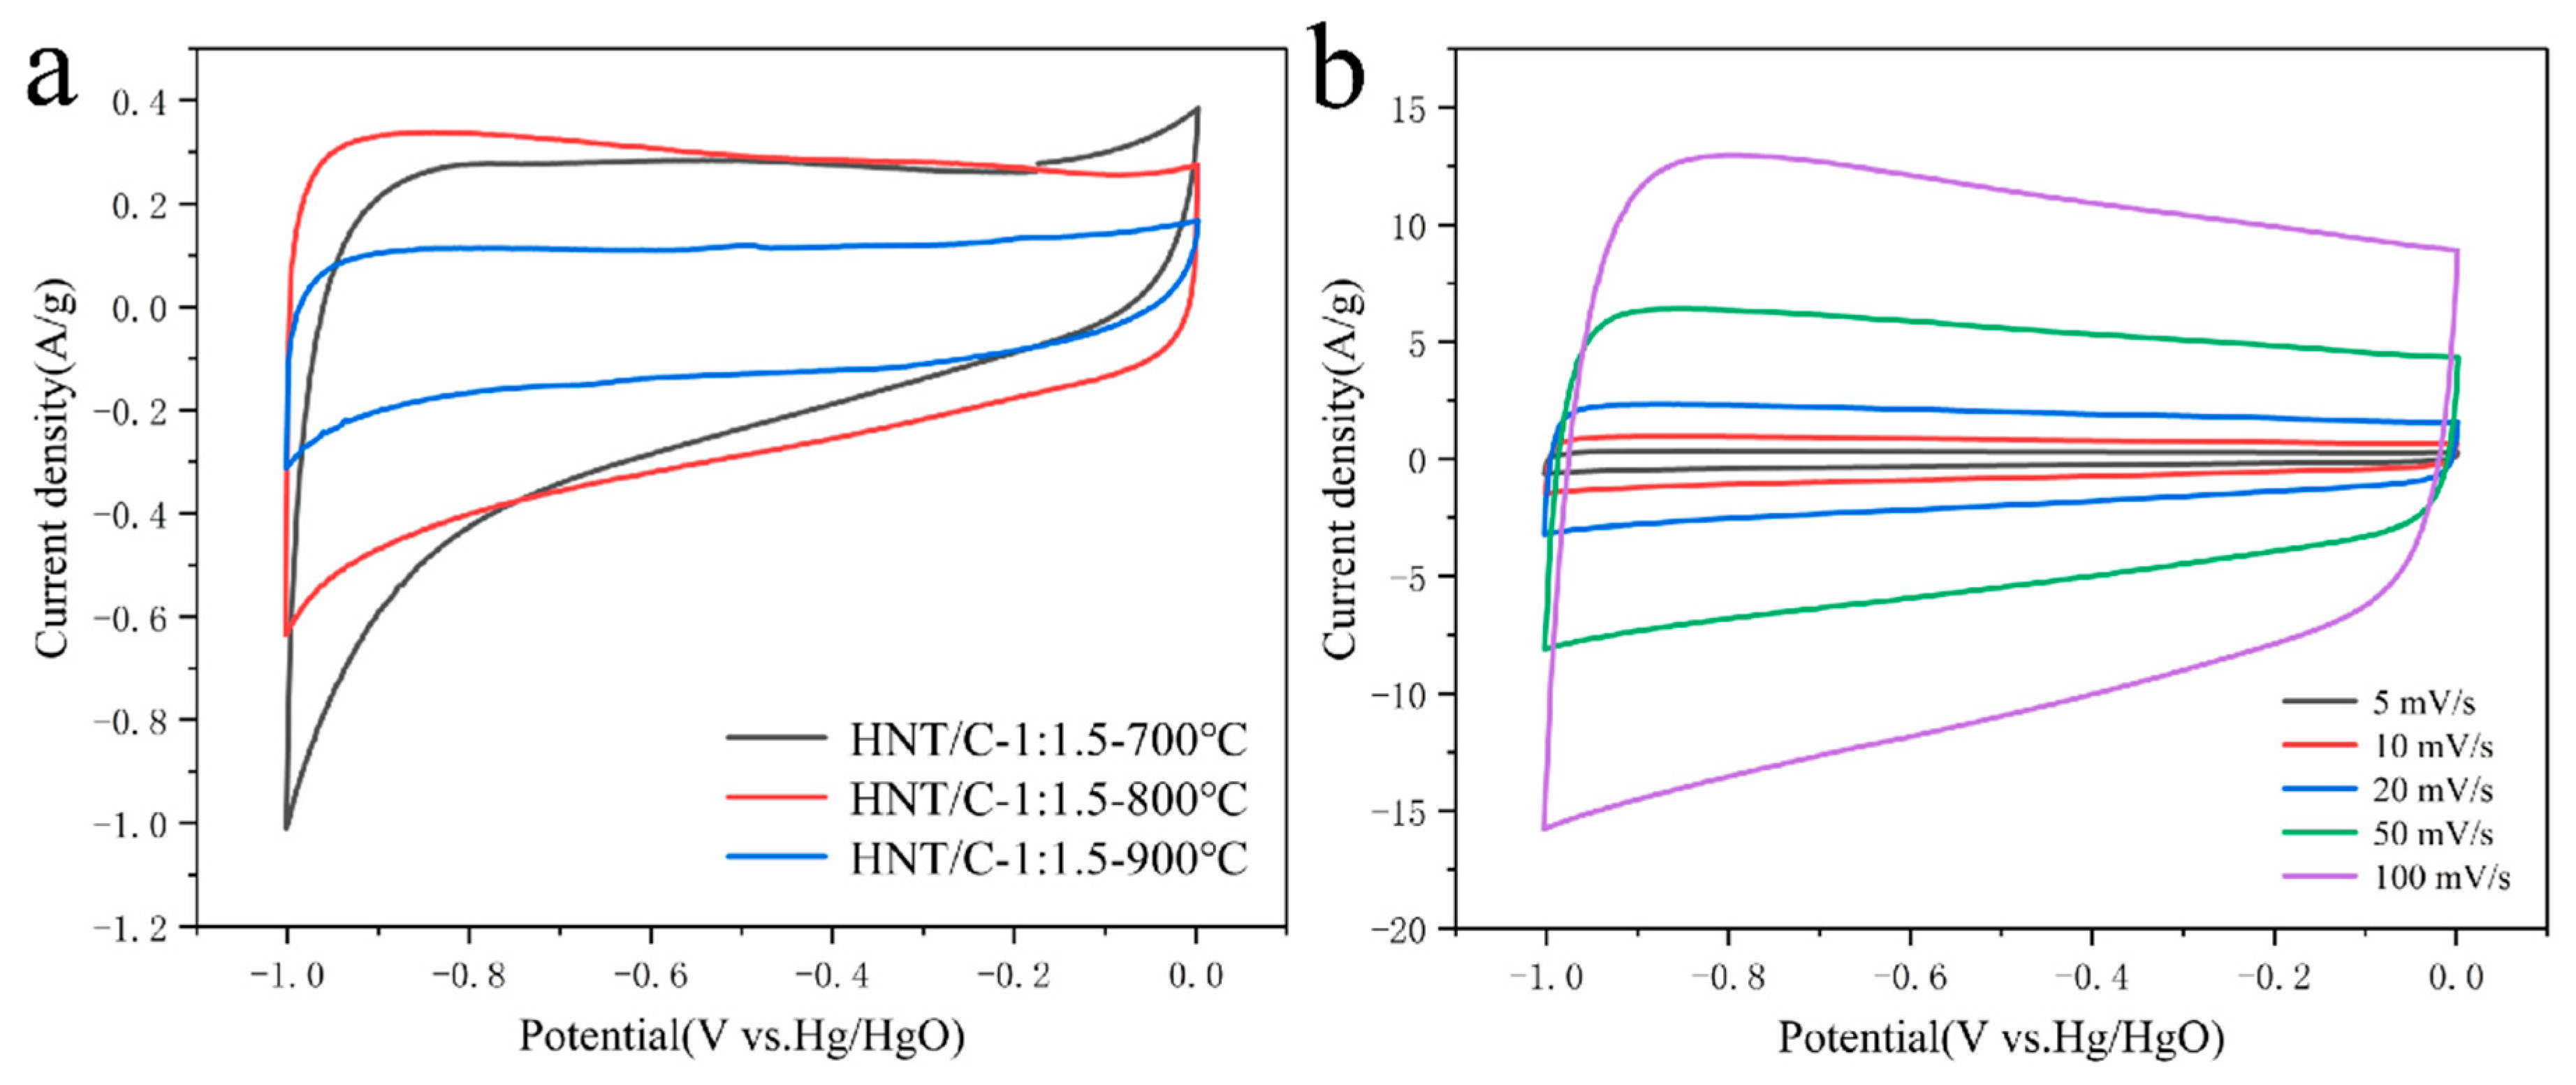
| HNT/C-1:1.5-800 | 248 | 0.20 | 5.8 | 136 |
| HNT/C-1:1.5-800 with PVDF and carbon black | 186 | 0.14 | 7.1 | 136 |
| HNT/C-1:1.5-900 | 156 | 0.06 | 42.8 | 107 |
| Pristine C | 122 | - | - | 68 |
| Pristine HNT | 115 | 0.27 | 13.7 | 50 |
| Materials | Current Density | Specific Capacitance (F g−1) | Cycle Life | Capacitance Retention (%) | Reference | |
|---|---|---|---|---|---|---|
| Phenolic resin based materials | AC | 1 mA cm−2 | 160 | - | - | [18] |
| N-OMC | 0.1 A g−1 | 216 | 10,000 | >100% | [10] | |
| HPC | 2 A g−1 | 215 | 10,000 | 98.2 | [50] | |
| HNT based materials | GQD-HNT | 6 A g−1 | 258 | 5000 | 88 | [51] |
| HNT/rGO | 0.1 A g−1 | 22.73 | 50 | 84.7 | [25] | |
| H-PANI-PSS-PANI | 0.5 A g−1 | 137 | - | - | [24] | |
| HNT/C | 1 A g−1 | 136 | 500 | 98.5 | This work | |
© 2020 by the authors. Licensee MDPI, Basel, Switzerland. This article is an open access article distributed under the terms and conditions of the Creative Commons Attribution (CC BY) license (http://creativecommons.org/licenses/by/4.0/).
Share and Cite
Yang, X.; Zeng, X.; Han, G.; Sui, D.; Song, X.; Zhang, Y. Preparation and Performance of Porous Carbon Nanocomposite from Renewable Phenolic Resin and Halloysite Nanotube. Nanomaterials 2020, 10, 1703. https://0-doi-org.brum.beds.ac.uk/10.3390/nano10091703
Yang X, Zeng X, Han G, Sui D, Song X, Zhang Y. Preparation and Performance of Porous Carbon Nanocomposite from Renewable Phenolic Resin and Halloysite Nanotube. Nanomaterials. 2020; 10(9):1703. https://0-doi-org.brum.beds.ac.uk/10.3390/nano10091703
Chicago/Turabian StyleYang, Xiaomeng, Xiaorui Zeng, Guihong Han, Dong Sui, Xiangyu Song, and Yongsheng Zhang. 2020. "Preparation and Performance of Porous Carbon Nanocomposite from Renewable Phenolic Resin and Halloysite Nanotube" Nanomaterials 10, no. 9: 1703. https://0-doi-org.brum.beds.ac.uk/10.3390/nano10091703