Article

Evaluating the Effect of Varying the Metal Precursor in the Colloidal Synthesis of MoSe2 Nanomaterials and Their Application as Electrodes in the Hydrogen Evolution Reaction

1
Molecular Sciences Institute, School of Chemistry, University of the Witwatersrand, Private Bag 3, Wits 2050, South Africa
2
Department of Chemistry, University of Limpopo Private Bag x1106, Sovenga 0727, South Africa
3
DST/NRF Centre of Excellence in Strong Materials, University of the Witwatersrand, Private Bag 3, Wits 2050, South Africa
4
Microscopy and Microanalysis Unit, University of the Witwatersrand, Private Bag 3, Johannesburg, Wits 2050, South Africa
*
Authors to whom correspondence should be addressed.
Submission received: 7 July 2020 / Revised: 18 July 2020 / Accepted: 24 July 2020 / Published: 9 September 2020
(This article belongs to the Special Issue Characterization and Preparation of Electrocatalytic Nanomaterials)

Abstract

:
Herein we report on the use of different metal precursors in the synthesis of MoSe2 nanomaterials in order to control their morphology. The use of Mo(CO)6 as the metal precursor resulted in the formation of wrinkled few-layer nanosheets, while the use of H2MoO4 as the metal precursor resulted in the formation of nanoflowers. To investigate the effect of the morphologies on their performance as catalysts in the hydrogen evolution reaction, electrochemical characterization was done using linear sweep voltammetry (LSV), cyclic voltammetry (CV), and electrical impedance spectroscopy (EIS). The MoSe2 nanoflowers were found to have superior electrochemical performance towards the hydrogen evolution reaction with a lower Tafel slope, on-set potential, and overpotential at 10 mA/cm2 compared to the wrinkled few-layer nanosheets. This was found to be due to the higher effective electrochemical surface area of the nanoflowers compared to the nanosheets which suggests a higher number of exposed edge sites in the nanoflowers.

1. Introduction

2D layered materials such as MoSe2 are quickly becoming some of the most exciting materials, with interesting properties that have put them at the forefront for use in various applications and technologies including energy storage and generation devices, field-effect transistors and biosensors [1,2,3]. MoSe2 is a layered transition metal dichalcogenide (TMD) material where each layer is comprised of atom-thin layers of transition metal sandwiched between two chalcogen layers. Monolayer and few-layer MoSe2 nanomaterials have been shown to have interesting properties that can be used in various applications [4,5,6]. Colloidal synthesis is a wet-chemical technique that has been identified to have the potential to synthesize TMDs such as MoSe2 in high yields with control over the size, morphology and layer thickness which would, in turn, control their properties [7,8,9]. This control is achieved through the modification of the reaction parameters such as the temperature, chemical reagents, solvent/surfactant, and reagent concentration.
Unfortunately, achieving this level of control on the properties of TMD nanomaterials is not a small task and is currently a significant challenge in the synthesis of TMDs using colloidal synthetic techniques. There has been a significant effort to investigate how the reaction parameters can be used to control some properties of the TMD nanomaterials [10,11,12]. Much of the work on the effect of precursors on the synthesis of MoSe2 nanomaterials has focused on the effect of the selenium precursor and largely ignored is the effect of the metal precursor [13,14,15]. The effect of the metal precursor choice in colloidal syntheses has been shown to be crucial in controlling the size, morphology, and phase of nanomaterials [16,17,18,19]. This work investigates the unexplored effect of two different metal precursors on the morphology of MoSe2 nanomaterials. In this work molybdenum hexacarbonyl and molybdic acid were used to evaluate the effect of these different metal precursors on the morphology of MoSe2 nanomaterials.
To demonstrate how important a difference in the morphology of the MoSe2 nanomaterials can have on any application, the electrochemical properties of the nanomaterials were evaluated for application of the nanomaterials in the hydrogen evolution reaction (HER). The hydrogen evolution reaction is an electrocatalytic technique that is used in the production of hydrogen gas. This process is important because it provides a way to produce hydrogen which is a clean and efficient energy carrier in an eco-friendly manner [20]. MoSe2 has been identified as a potentially cost-effective alternative to platinum which is the current catalyst used for the HER [21,22]. The active sites for the HER in MoSe2 have been identified as the edge sites [22,23]. Thus, finding a morphology that maximizes the exposure of these edge sites in MoSe2 is crucial. This work shows how changing the morphology of the MoSe2 nanomaterials using the metal precursors influences the catalytic activity of the nanomaterials.

2. Experimental

2.1. Chemicals

Molybdenum hexacarbonyl (Mo(CO)6, 98%, Sigma-Aldrich, Modderfontein, South Africa), molybdic acid (H2MoO4, 85%, Sigma-Aldrich), selenourea (CH4N2Se, 98%, Sigma-Aldrich), oleylamine (OAm, 70%, Sigma-Aldrich), toluene (anhydrous, 99.8%, Sigma-Aldrich) and ethanol (absolute, ≥99.8%, Sigma-Aldrich) were used as received without further purification.

2.2. Synthesis of MoSe2 Nanomaterials

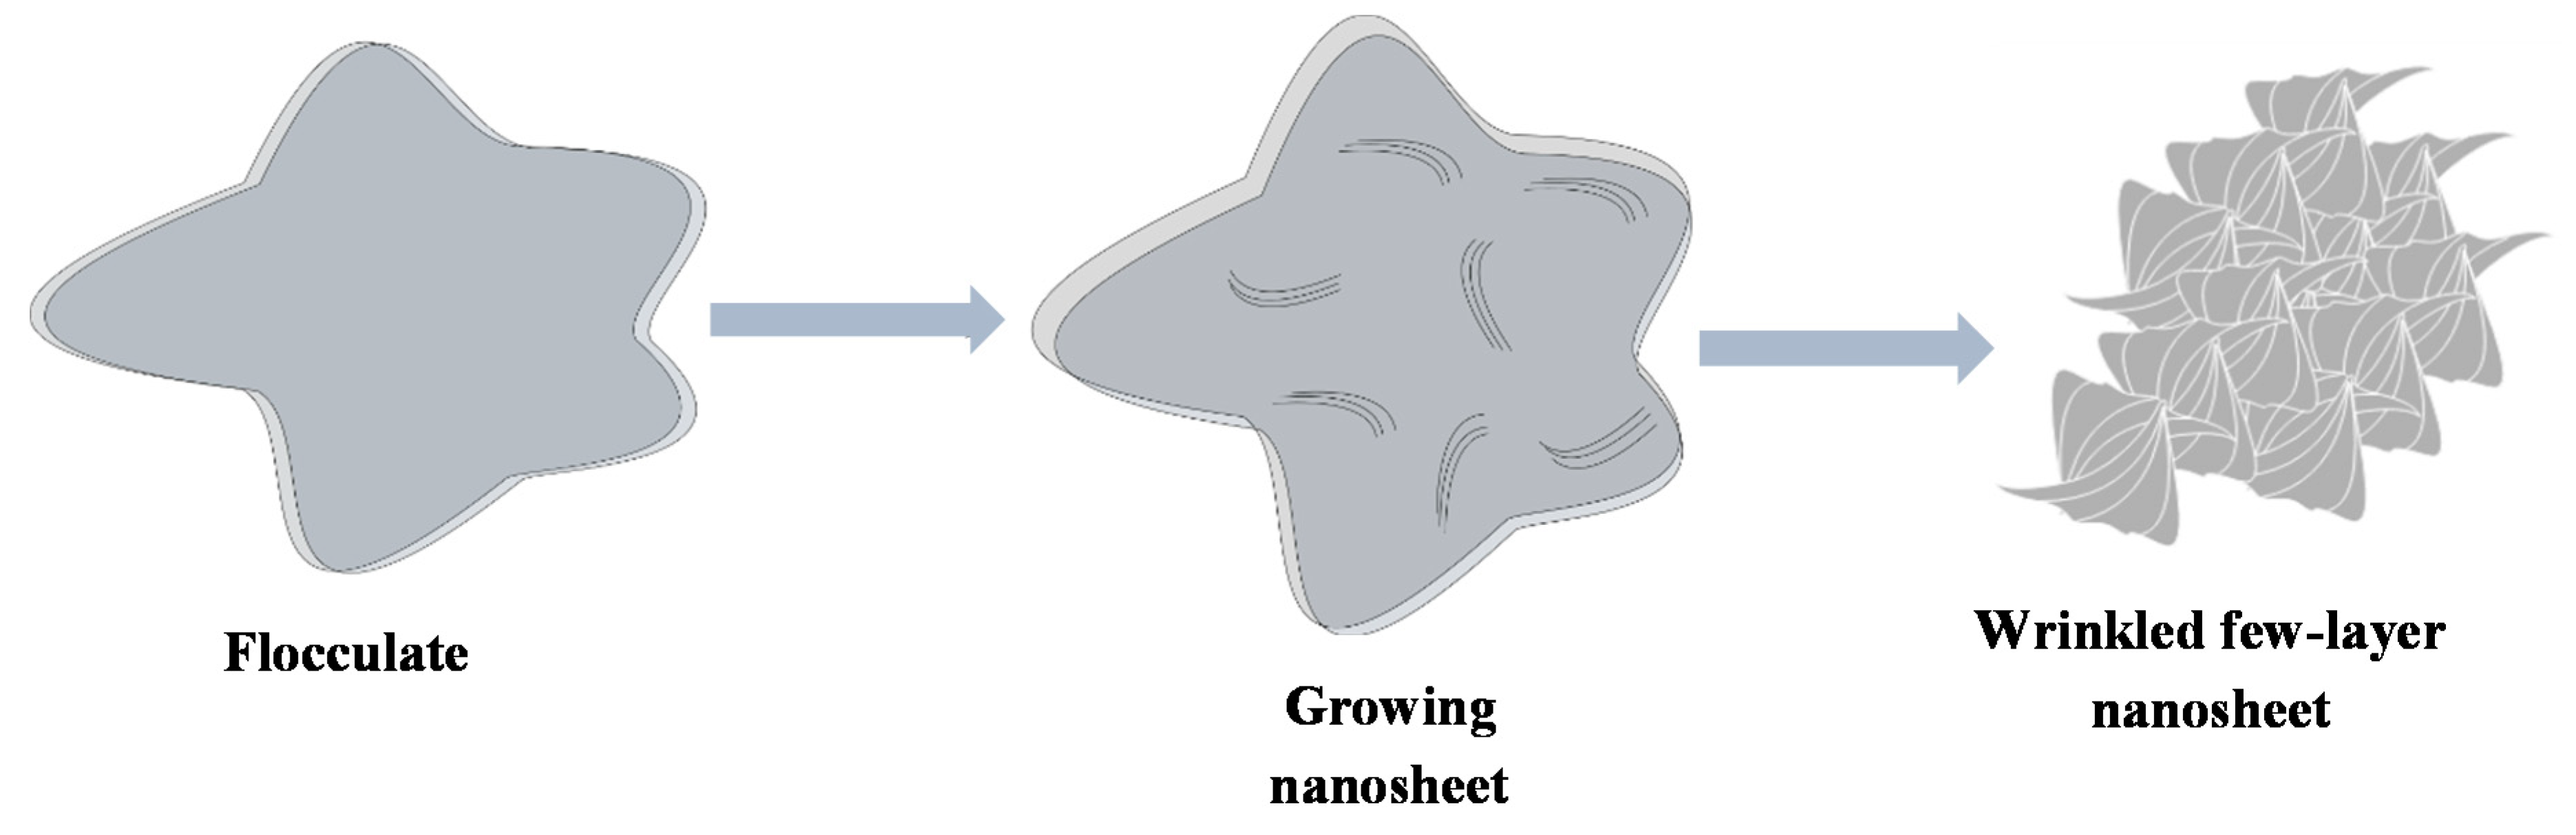
2.2.1. Synthesis of MoSe2 Wrinkled Few-Layer Nanosheets

A three-neck round bottom flask was filled with 20 mL of OAm and degassed in N2 for 20 min. The temperature was increased to 50 °C and 0.362 g (2.49 mmol) of selenourea was added to the reaction mixture and stirred for 10 min. At 220 °C, the selenourea decomposes to H2Se and a carboamide (C(NH)2), this is shown in the TGA profile in Figure S1. After selenourea decomposes the colour of the mixture changed from black to a dark orange colour. Molybdenum hexacarbonyl (0.212 g, 0.802 mmol)) was dissolved in the OAm. The mixture of molybdenum hexacarbonyl and OAm was then injected into the selenourea mixture at 300 °C. The reaction mixture turned black immediately. The reaction was allowed to run for 120 min. The black powder product was washed and collected by centrifugation using toluene and ethanol.

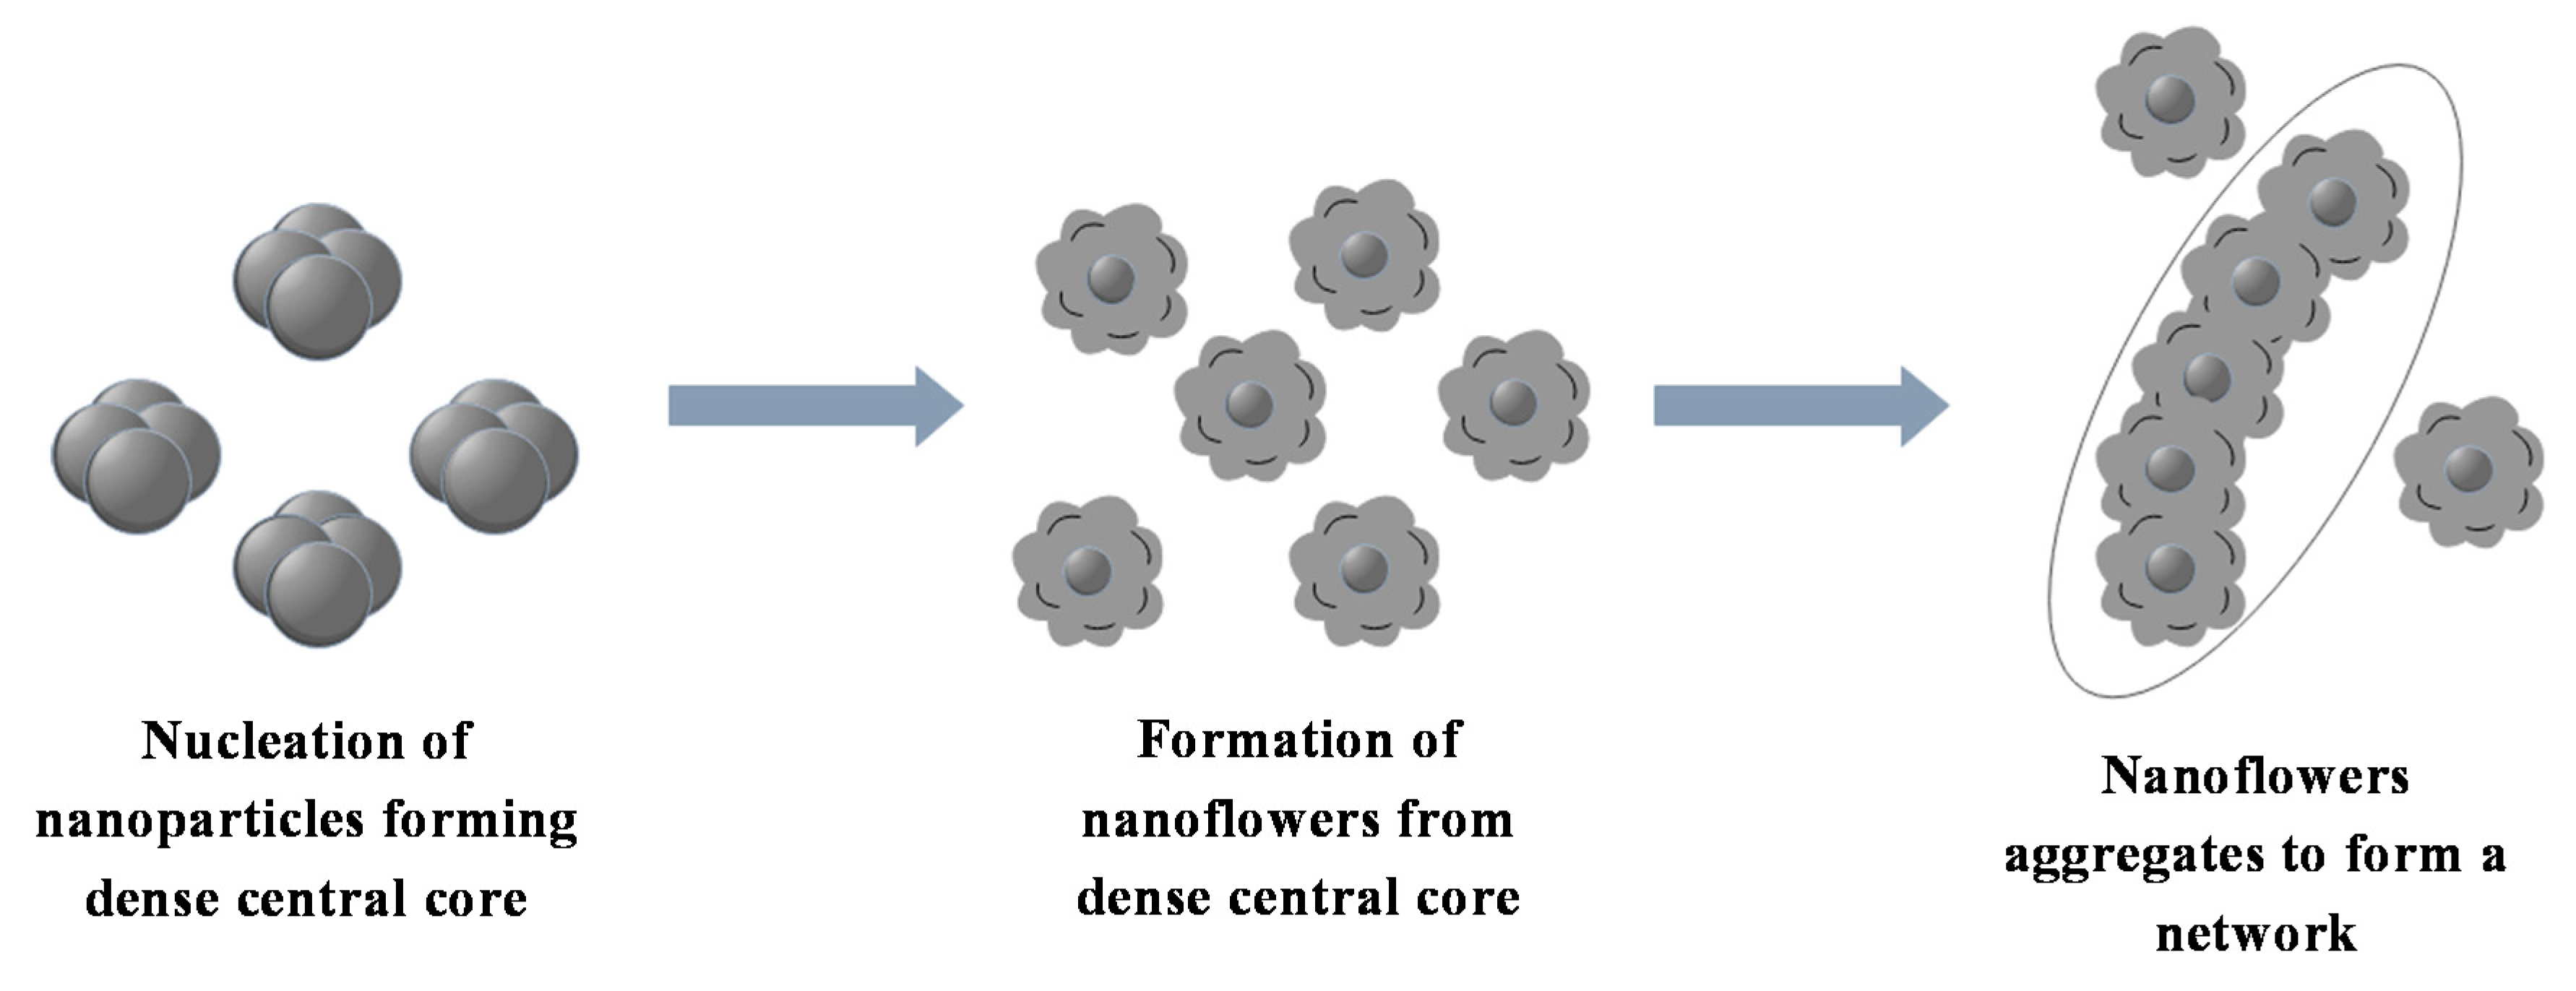
2.2.2. Synthesis of MoSe2 Nanoflowers

In a three-neck round bottom flask 20 mL of OAm was added, the solvent was degassed for 20 min under nitrogen. The temperature was increased to 50 °C and 0.4 g (3.0 mmol) of selenourea was added to the reaction mixture and stirred for 10 min. About 0.2 g (0.15 mmol) of molybdic acid was added once the reaction temperature reached 300 °C. The reaction was allowed to run for 120 min, after which the product was collected and washed with toluene and ethanol by centrifugation.

2.3. Characterization Techniques

The phase purity, crystallinity and preferred crystal orientation of the products were examined by using PXRD on a MeasSrv (D2-205530)/D2-205530 diffractometer (Bruker, Billerica, MA, USA) using secondary graphite monochromated CoKα radiation (λ 1.78897 Å) at 30 kV/30 mA. Measurements were taken using a glancing angle of incidence detector at an angle of 2°, for 2θ values over 10–90° in steps of 0.026° with a step time of 37 s and at a temperature of 25 °C. Raman spectroscopy experiments were performed on a J-Y T64000 micro-Raman spectrometer (Horiba Jobin-Yvon, Ltd., Stanmore, UK) equipped with a liquid nitrogen cooled charge-coupled device detector. All samples were measured after excitation with a laser wavelength of 514.5 nm. The particle sizes and morphologies were determined by the transmission electron microscopy (TEM) carried out on a Technai T12 TEM microscope (FEI, Hillsboro, OR, USA) operated at an acceleration voltage of 200 kV with a beam spot size of 20–100 nm in TEM mode. The HRTEM images were obtained from a JEM-2100 microscope (JEOL, Akishima, Tokyo, Japan) equipped with a LAB6 filament and an EDS detector, operated at 200 kV. SEM images were obtained with a high-resolution FEI Nova Nanolab 600 instrument at 30 kV (FEI, Hillsboro, OR, USA). The total surface area and pore volume of the nanomaterials were ascertained using a Micromeritics TriStar Surface Area and Porosity Analyzer (Micromeritics Instrument Corp., Norcross, GA, USA). The electrochemical measurements were carried out on a BASi epsilon E2 (1231) (West Lafayette, IN, USA). All measurements were carried out in 0.5 M H2SO4 using a three-electrode system. A Ag/AgCl electrode was used as the reference electrode, platinum wire was used as the counter electrode. A modified glassy carbon electrode with 3 mm diameter was used as the working electrode. The ink or fresh dispersion of the sample was prepared by dispersing 5 mg of the MoSe2 nanomaterials with 0.5 mg carbon black and 40 µL of Nafion solution (5 wt%) in a 1 mL mixture of water and isopropanol at a 3:1 ratio. The solution was then sonicated for 30 min and 5 µL of the ink was drop-casted onto the glassy carbon electrode. The electrode was allowed to dry at room temperature. The linear sweep voltammograms were obtained at a scan rate of 2 mV/s and the cyclic voltammograms were obtained at a potential range of 0.2–0.6 V vs RHE. A 20% Pt/C catalyst was used for comparison. The impedance spectroscopy studies were conducted on a SP 300 system (Biologic, Seyssinet-Pariset, France). The measurements were done at a potential of −200 mV vs RHE and it was done at a frequency range between 0.01 Hz and 100 kHz.

3. Results and Discussion

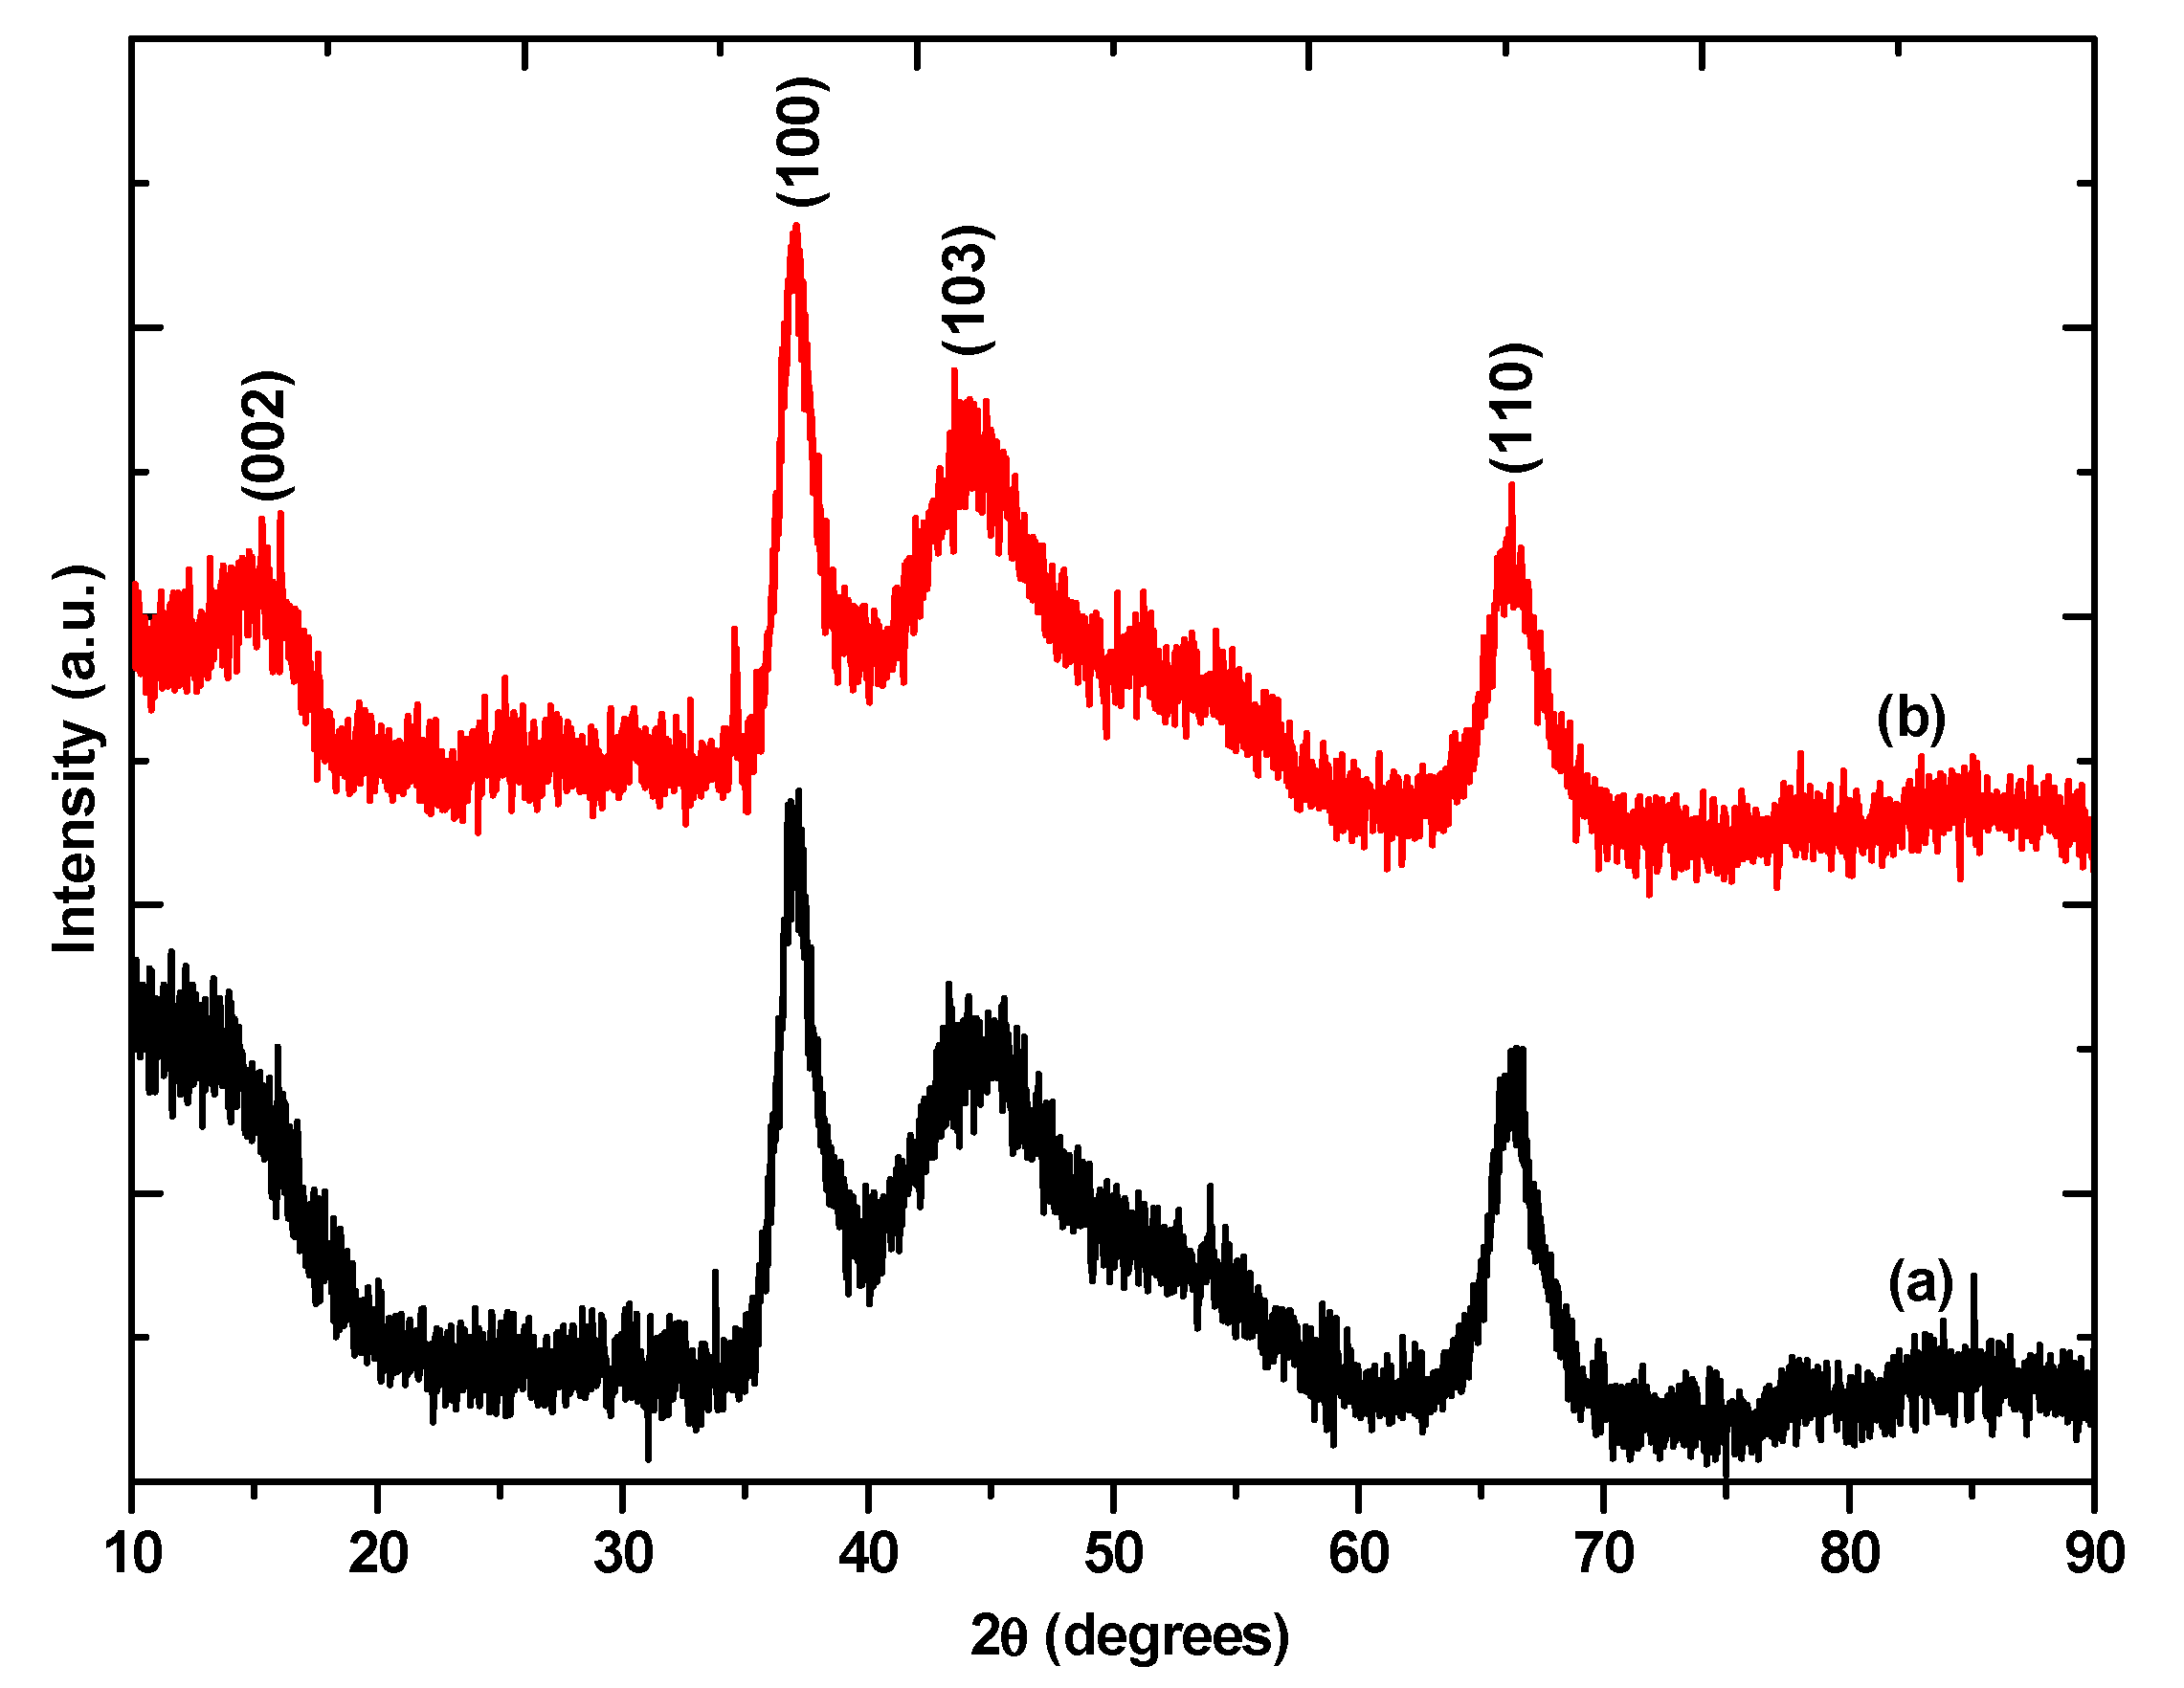
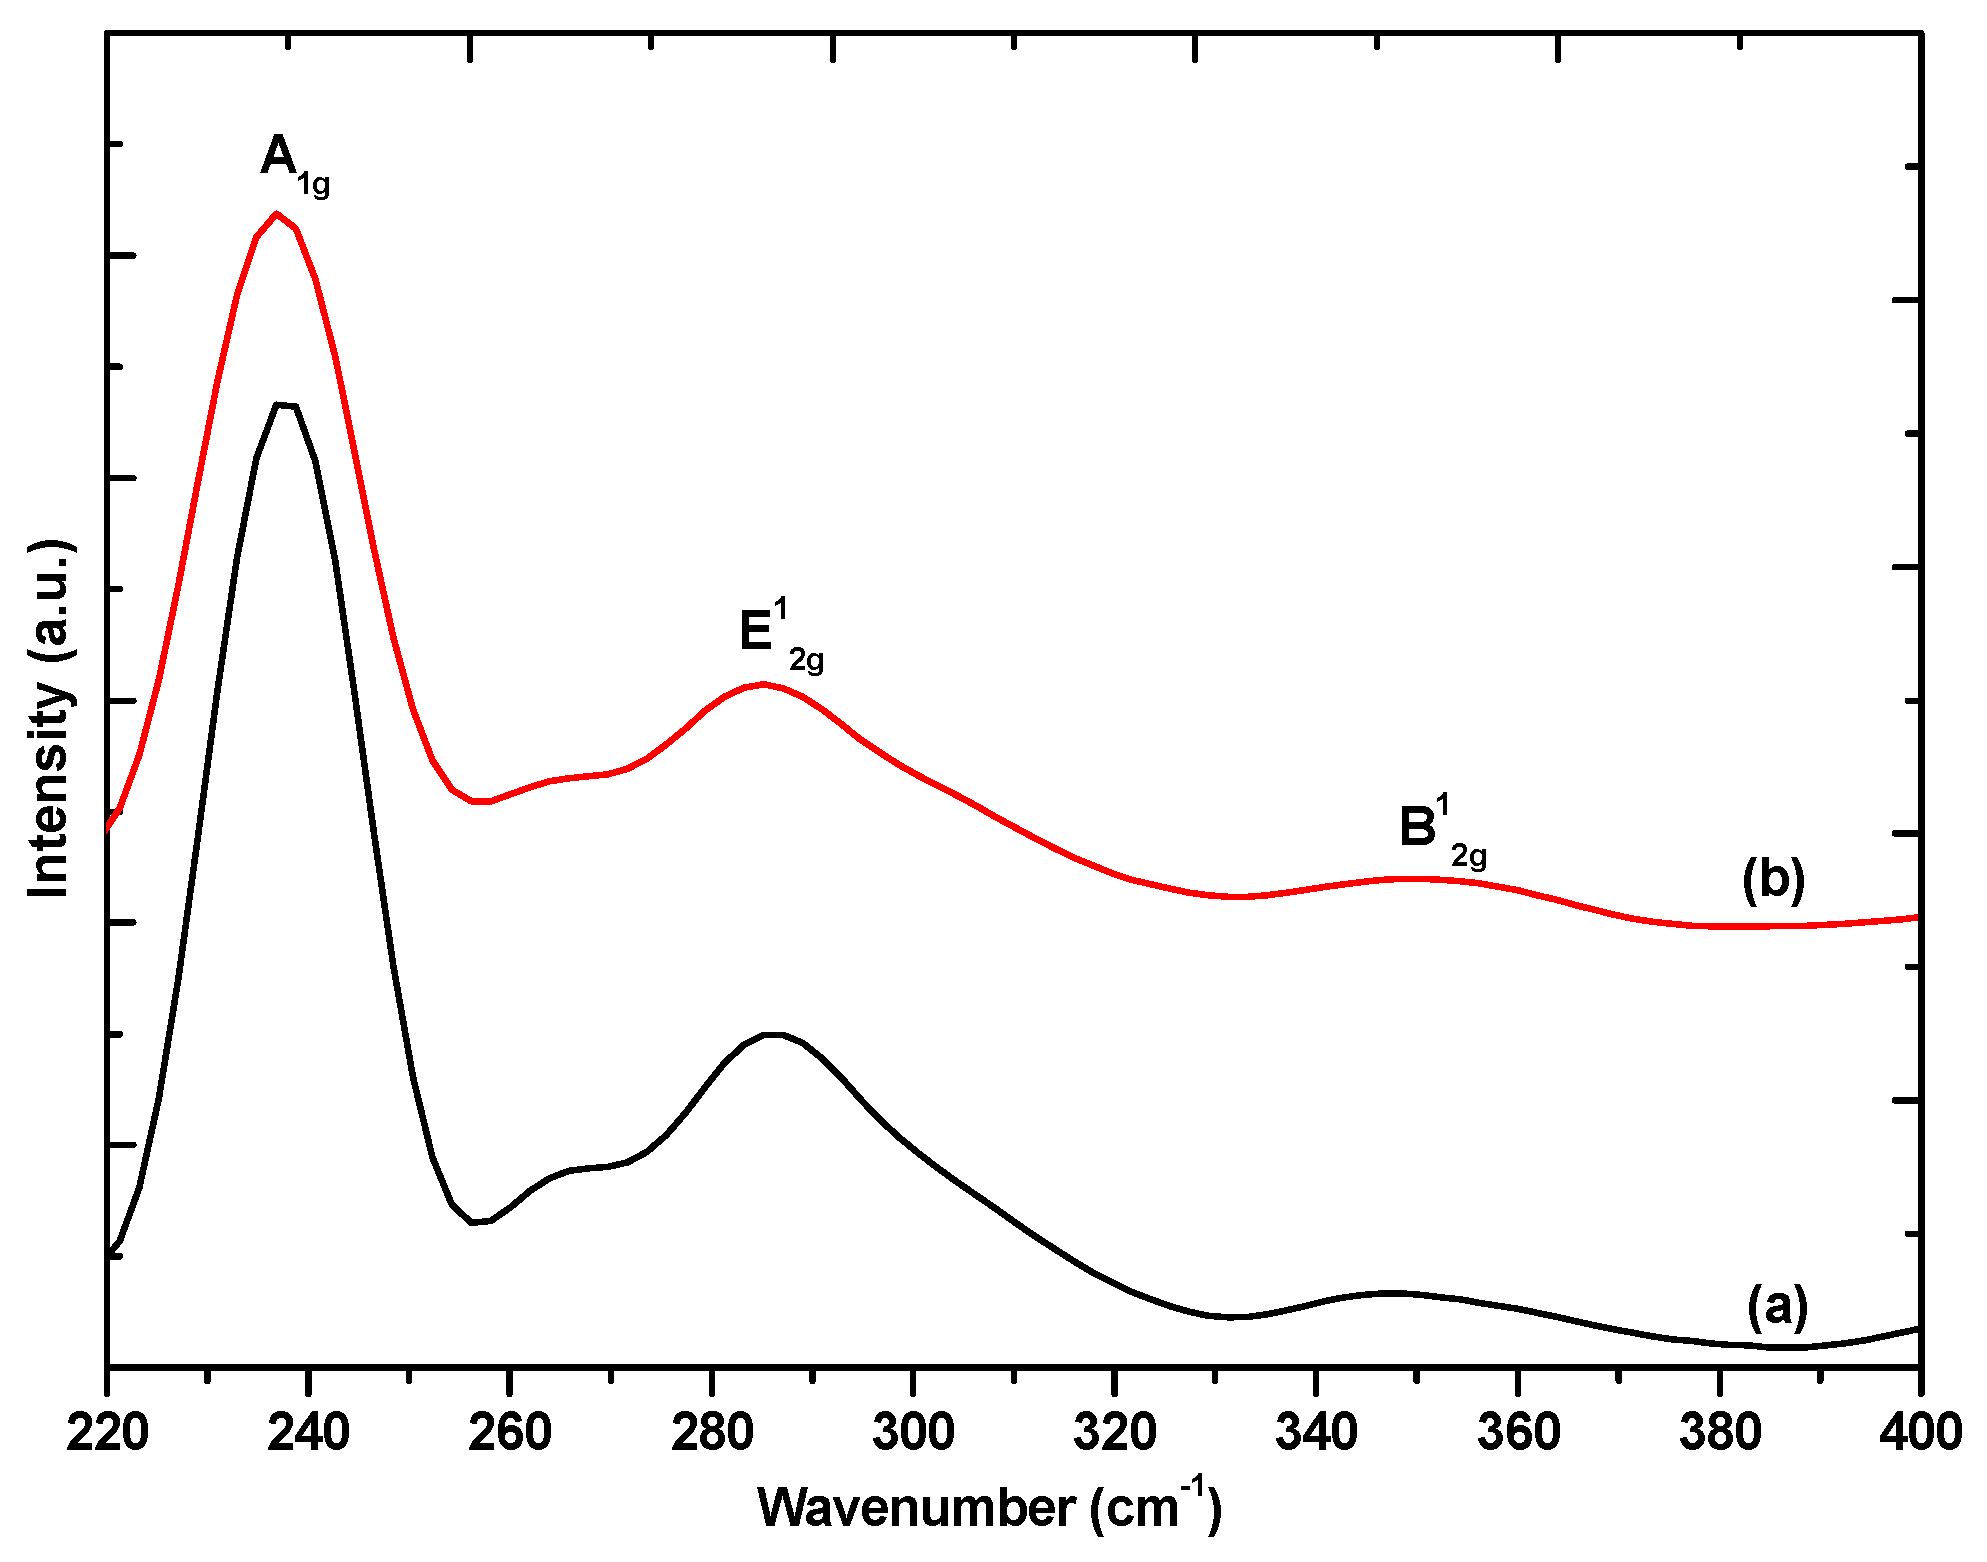
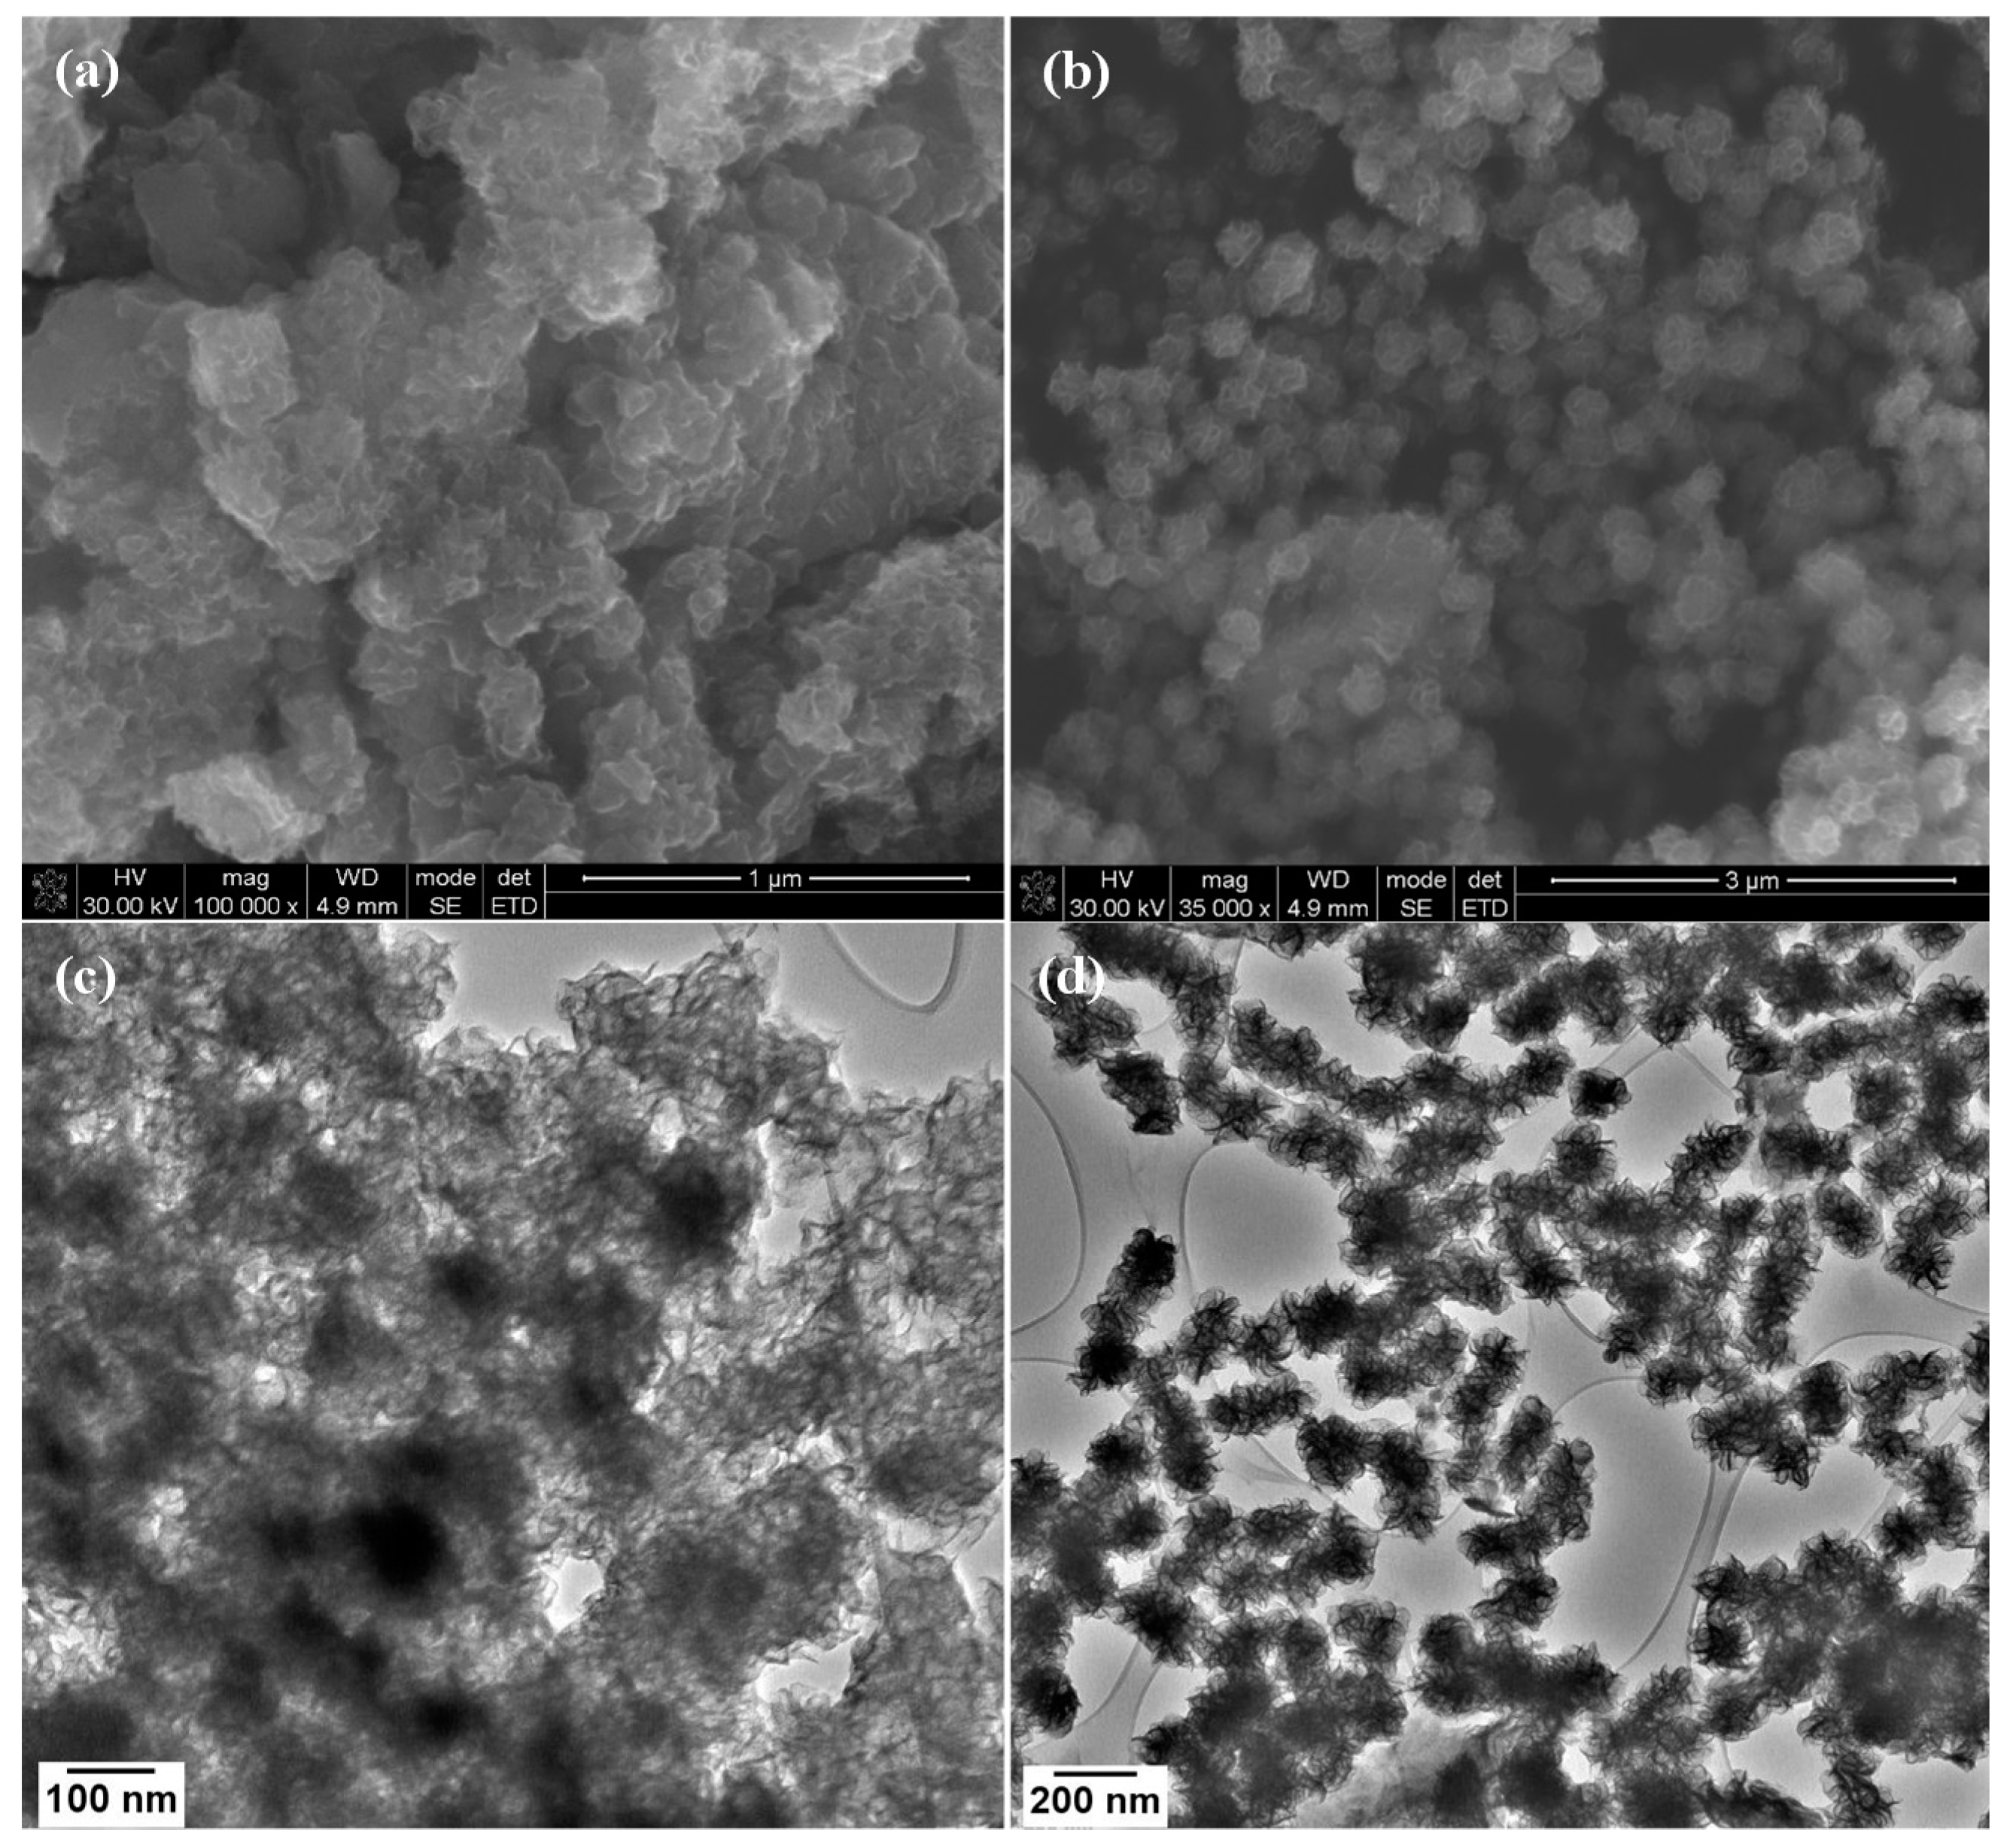
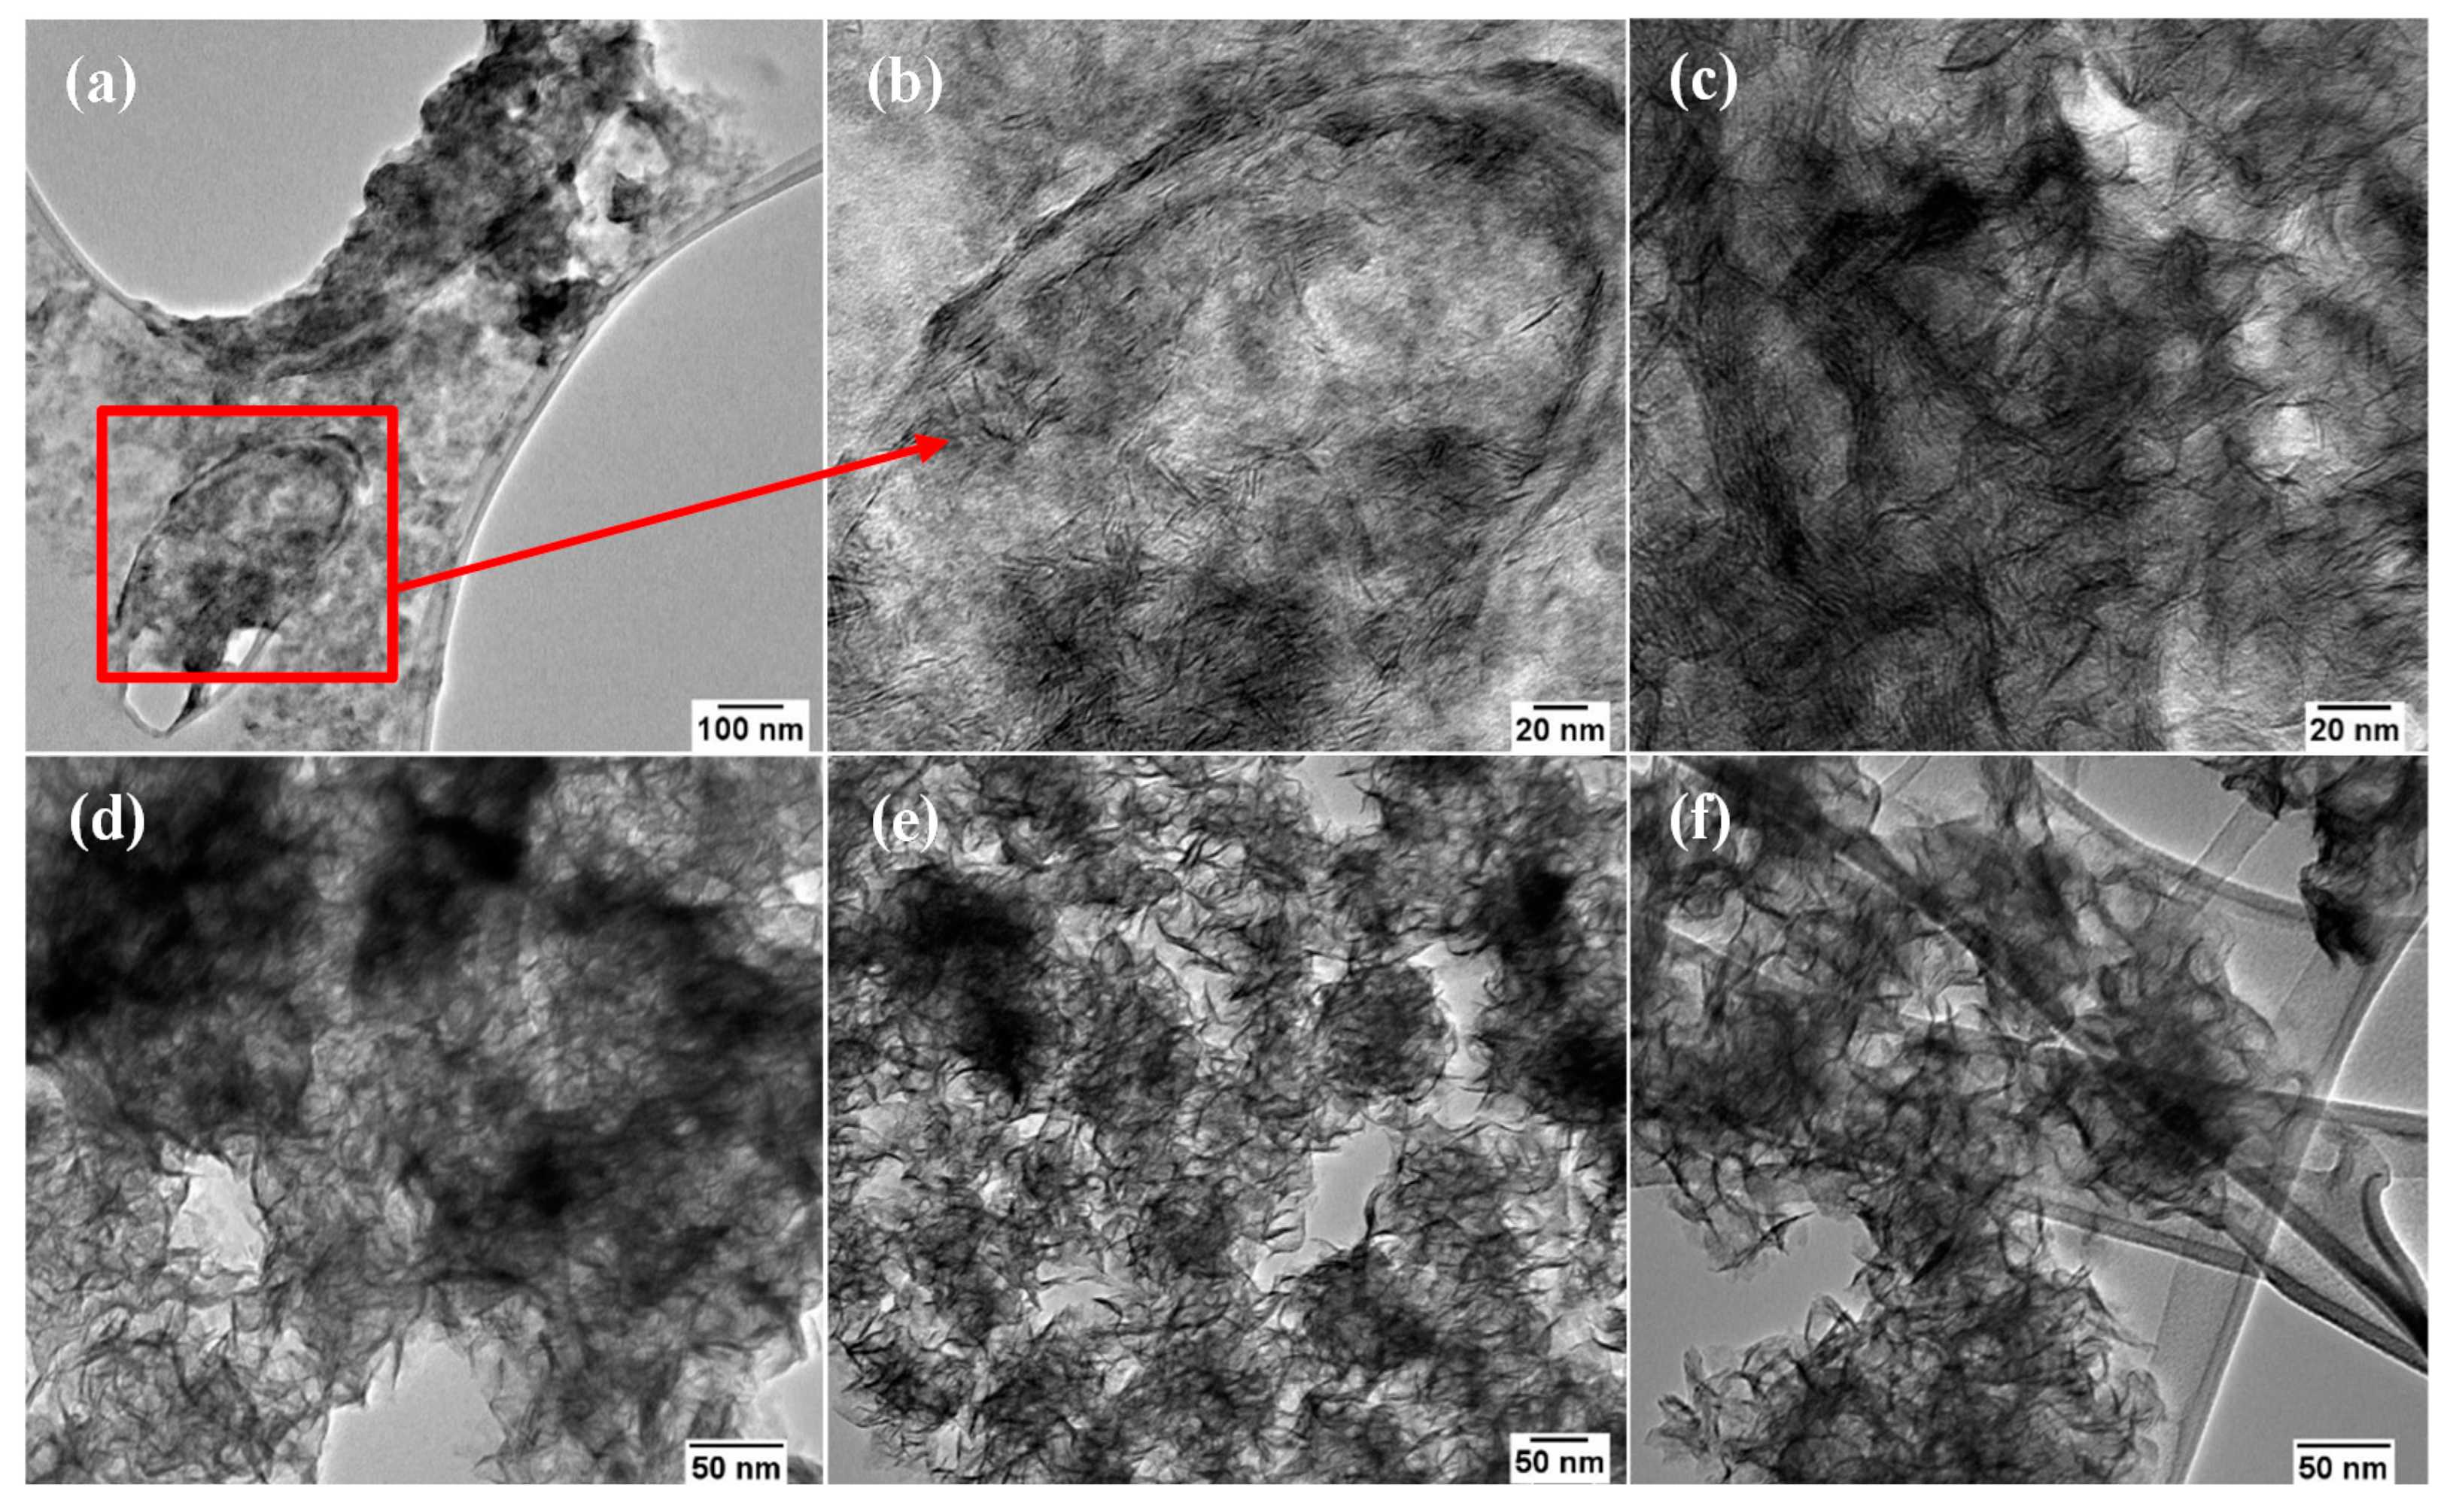
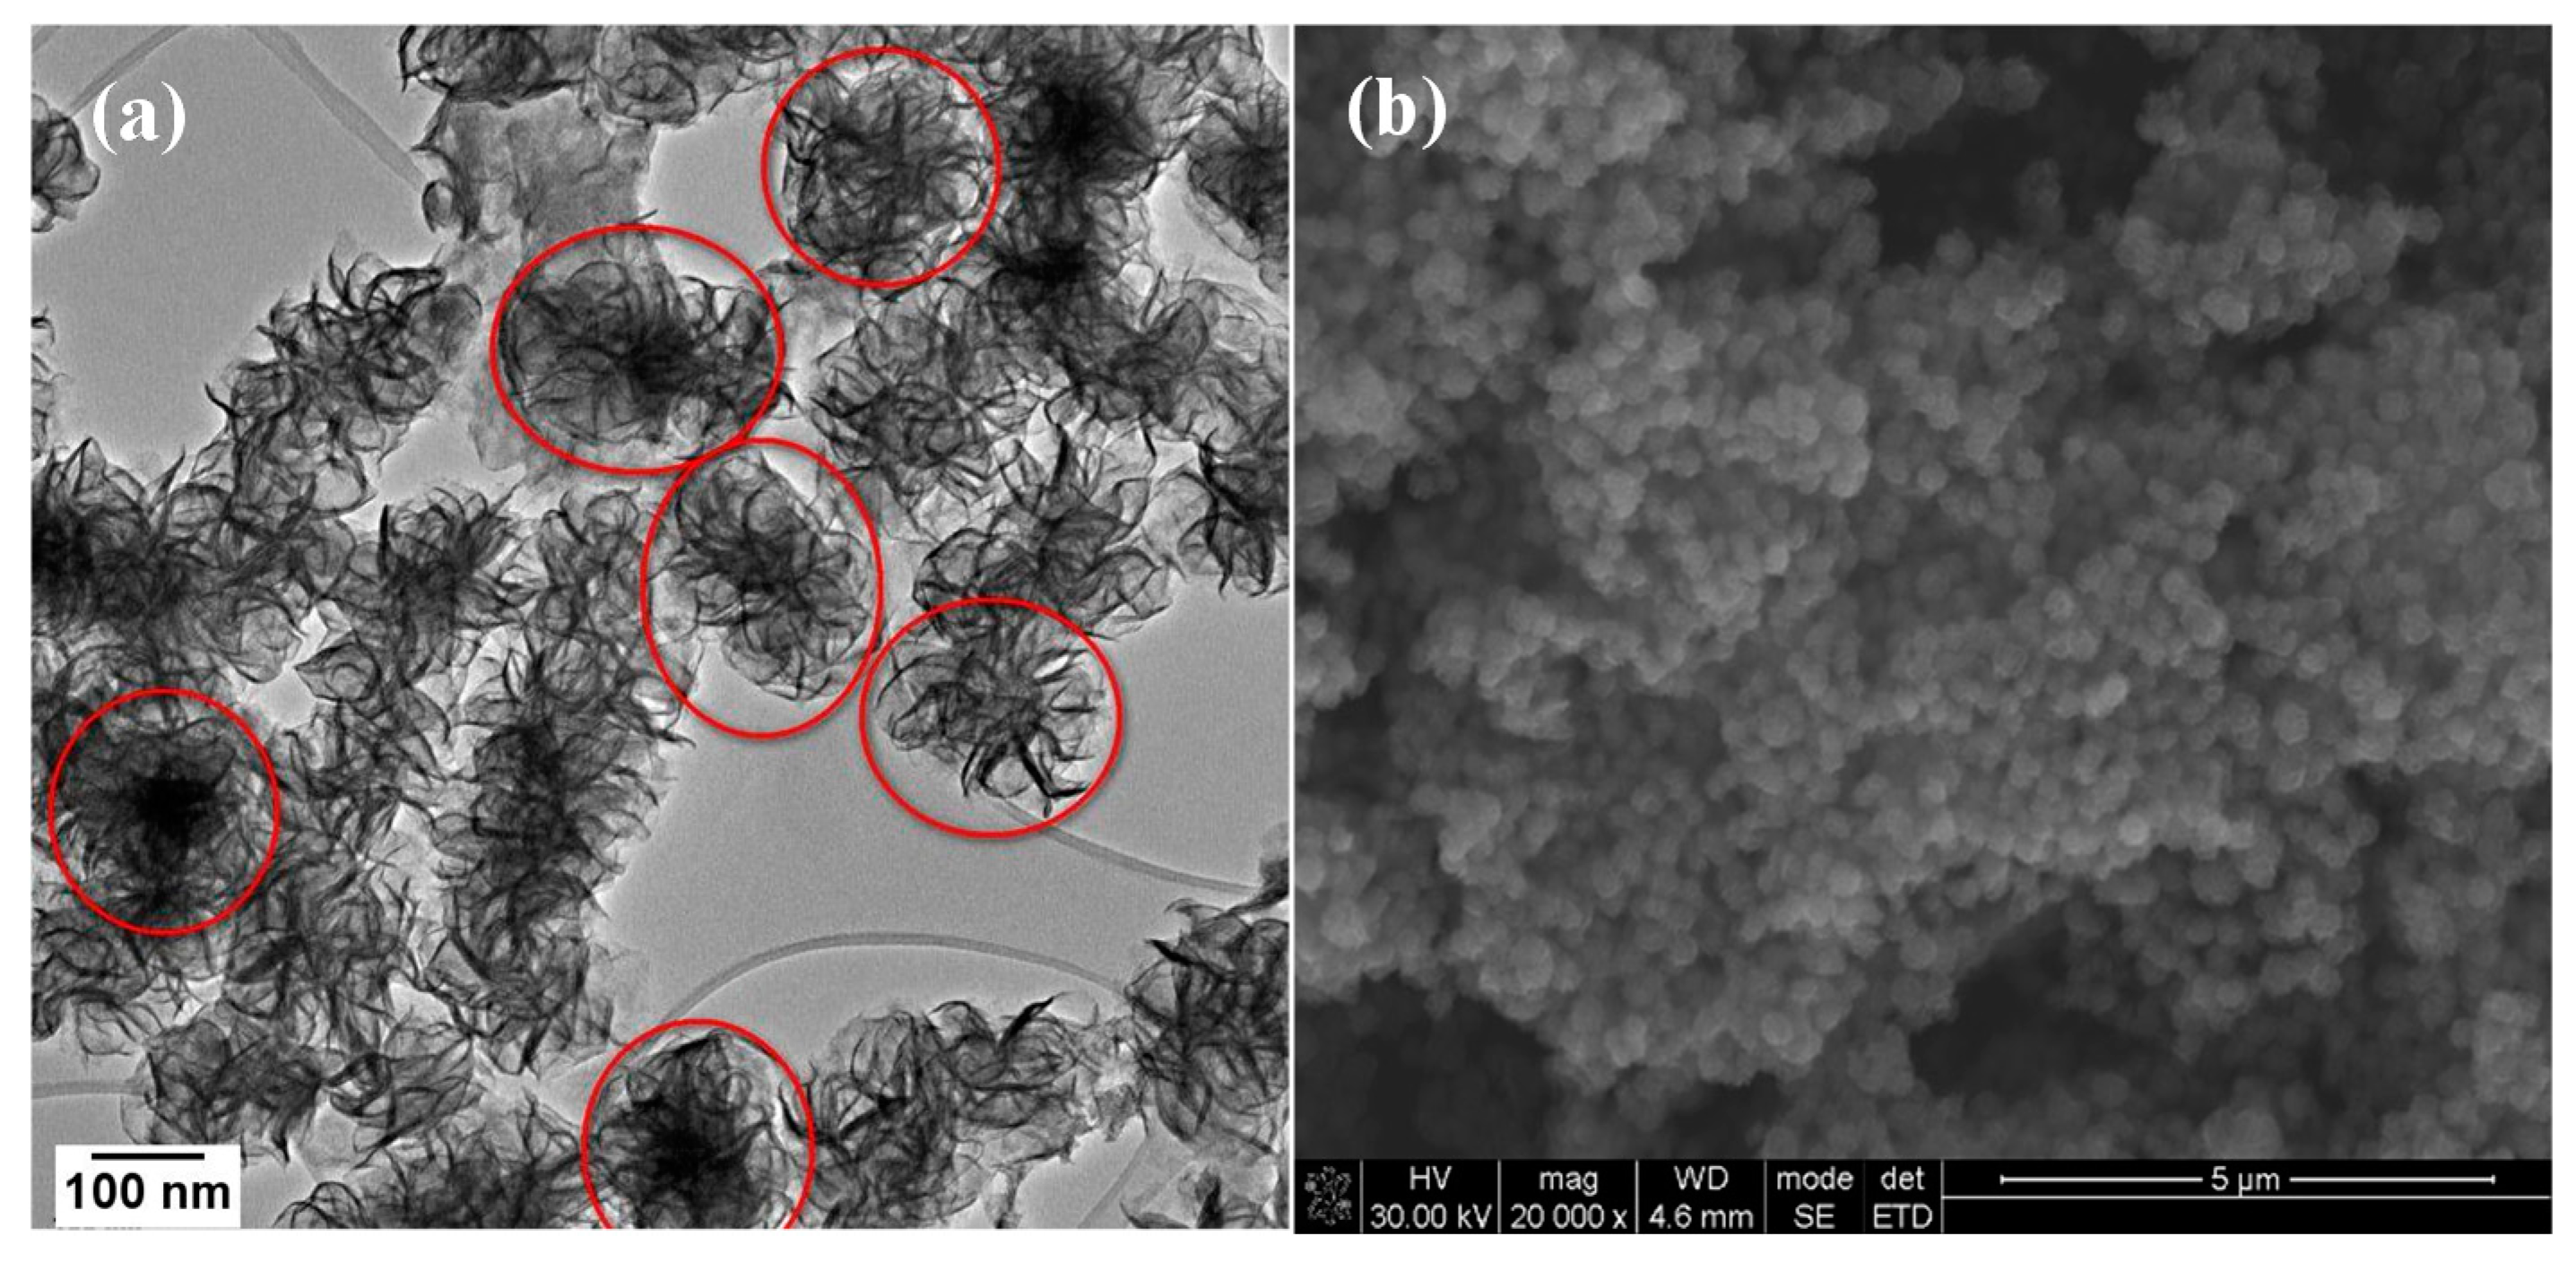
3.1. Structural Characterisation

Powder X-ray diffraction (PXRD) was used to confirm the synthesis of MoSe2 and to also determine the crystallinity, phase and composition of the nanomaterials. The PXRD confirms the formation of 2H hexagonal MoSe2 nanomaterials (JCPDS card no: 03-065-3999). The reflection peaks located at 14.63°, 37.06°, 44.44°, and 66.02°, corresponding to the lattice planes (002), (100), (103), and (110) respectively. The broad nature of the peaks as shown in Figure 1 is indicative of nanostructured materials.
There are no peaks not belonging to MoSe2 in the diffractograms, thus we can state that the nanomaterials are free of any impurities. The (002) peak arises due to the stacking of the layers in multilayer nanosheets. The appearance of the (002) peak in both diffraction patterns suggests the formation of multilayer MoSe2 [18]. However, the (002) diffraction peak in the MoSe2 nanosheets seems much broader than the (002) diffraction peak of the MoSe2 nanoflowers. This broadening is attributed to an inhomogeneity in the spacing between the van der Waals planes [24]. The Raman spectrum of MoSe2 has two main characteristic peaks which are the out of plane A1g and the in plane E12g, the mono or few-layer nanomaterials are identified by the shift in position of these characteristic peaks from their positions in the bulk material [25]. The Raman spectra of MoSe2 nanosheets and MoSe2 nanoflowers are shown in Figure 2.
The appearance of the characteristic out of plane A1g and in plane E12g bands in both the Raman spectra confirms the formation of MoSe2. The A1g appears at 242 cm−1 and the E12g appears at 286 cm−1 in the bulk [25]. The Raman spectra for both the nanosheets and nanoflowers show the A1g has red-shifted from the bulk to 237 cm−1. The E12g has shifted to 285 cm−1. The red-shift of both the A1g and E12g is indicative of the formation of few-layers [26]. There is one other characteristic peak observed in both the Raman spectra, the B12g which has been shown to not appear in monolayers or in the bulk materials. This peak only appears for few-layer materials with a layer number between 2–5 layers [25]. This result is in agreement with the PXRD analysis which confirmed the formation of few-layers nanosheets by the appearance of the (002) diffraction peak. The peak positions of the two samples do not show a significant difference from one another so the number of layers in the two samples is comparable.
The images in Figure 3a,c show a network of interconnected wrinkled few-layer nanosheets, while the images in Figure 3b,d show the formation of MoSe2 nanoflowers which are composed of small lateral dimension nanosheets that seem to form from one central point. To investigate the formation of the wrinkled few-layer nanosheets a time study of the reaction was conducted where aliquots were obtained at the 30, 60, 90, and 120 min time intervals. Initial observation of the 30 min sample under low-resolution TEM revealed the appearance of a flocculate. This flocculate has also been observed by Savjani et al. in the synthesis of MoSe2. The flocculates have lateral dimensions of several hundred nanometres. They seem to mould and blanket the lacey carbon grids as shown in Figure 4a [27]. A closer look at these flocculates at higher magnification revealed that some ultrathin MoSe2 nanosheets had begun to form Figure 4b. These nanosheets seem to overlap with one another forming an interconnected network of few-layer nanosheets Figure 4c. The HRTEM images in Figure S2 confirms these as MoSe2 nanosheets due to the lattice fringes being ~0.66 nm which is the d-spacing of the (002) lattice plane in multi-layer nanosheets.
Figure 4d shows that there is a transition that occurs between 30 and 60 min that results in a change of the morphology of the nanosheets. At 30 min flocculates of the material with small ultrathin nanosheets in an OAm matrix can be observed. As the reaction continues to run for a longer period the flocculate is gradually phased out to form a network of densely packed wrinkled few-layer nanosheets beginning at 60 min as shown in Figure 4d. This transition continues from 60 to 120 min as shown in Figure 4e,f. This transition suggests that the reaction had not run to completion at 30 min, this could be due to the slow release of the Mo monomer as the Mo(CO)6 decomposes via decarbonylation of the CO ligands [28]. The formation of MoSe2 via Mo(CO)6 precursor is shown in Equations (1) and (2):
2 CH 4 N 2 Se   2 H 2 Se + 2 C ( NH ) 2
Mo ( CO ) 6 + 2 H 2 Se   MoSe 2 + 6 CO + 2 H 2
The amorphous flocculate which is made up of the monomer from the decomposed precursors is consumed as the reaction runs for longer time periods until the large area wrinkled few-layer nanosheets are formed; a schematic diagram of the process is depicted in Scheme 1.
This phenomenon was also observed by Gao and co-workers [29], who were able to form few layer nanosheets from the flocculate by increasing the reaction temperature in their microwave synthesis reaction when synthesizing MoS2 nanosheets. They suggested that the few layer nanosheets are formed by consuming the amorphous material in the flocculates as suggested in the process described in this synthetic method. However, in this work it has been proven that the few layer nanosheets form and grow from the flocculates at 300 °C just by increasing the reaction time from 30 to 60 min, which suggests that the temperature at which the reaction occurs is suitable for the synthesis of the material but longer reaction times are needed for the reaction to run to completion.
To elucidate the formation mechanism for the nanoflowers a time study was also done. However, the nanoflowers had already formed 30 min into the reaction hence only the 30 min sample is shown. The TEM and SEM images are shown in Figure 5a,b, respectively. The synthesis procedure for MoSe2 nanoflowers was slightly modified from the method used to synthesize the wrinkled few-layer nanosheets by changing the metal precursor from molybdenum hexacarbonyl to molybdic acid. It was found that the use of molybdic acid (H2MoO4) resulted in the formation of a network of nanoflower-like nanomaterials that arise through the formation of individual nanoflowers that are formed out of a central core as opposed to the flocculate observed when molybdenum hexacarbonyl was used [30]. Nanosheets with small lateral dimensions grow randomly outward from this central core in a fashion closely resembling a blooming flower. However, the nanoflowers that form do come together and agglomerated forming an interconnected network of these nanoflower structures. A schematic representation of the process is shown in Scheme 2.
The mechanism by which the dense central cores form can be understood by considering the decomposition of molybdic acid in oleylamine. The product obtained when molybdic acid is heated to 300 °C in oleylamine was found to be a mixture of MoO42− and oleylamine; this was confirmed by FTIR shown in Figure S3 [30]. The FTIR spectra show the characteristic antisymmetric stretching vibration of Mo-O-Mo in MoO42− at 827 cm−1 [31]. The anion has been shown to react with S2− in the synthesis of MoS2 to form the intermediate MoO42− which converts to the MoS2 as the Mo(VI) is reduced to Mo(IV) [32,33]. A similar phenomenon occurs in the formation of MoSe2. The MoO42− has been shown in this work to readily react with H2Se to form nanoflowers through the formation of a central nucleation core. This rapid formation of the central core then results in the formation of the nanoflowers with the nanosheets growing outwardly simulating the behaviour of a blooming flower. Following the production of H2Se from selenourea (Equation (1)), its reaction with MoO42− is shown in Equation (3):
MoO 4 2 + 4 H + + 2 H 2 Se   MoSe 2 + 4 H 2 O  
Brunauer-Emmett-Teller (BET) surface area analysis was used to determine the surface area of the MoSe2 wrinkled few-layer nanosheets and the nanoflowers. The surface area of the MoSe2 nanosheets was determined to be 14.1 m2/g while the surface area of the MoSe2 nanoflowers was determined to be 36.4 m2/g. The surface area of the MoSe2 nanoflowers was found to be larger than that of the MoSe2-nanosheets. This was expected because nanoflower structures have been known to possess higher surface area and also be microporous in nature [34].

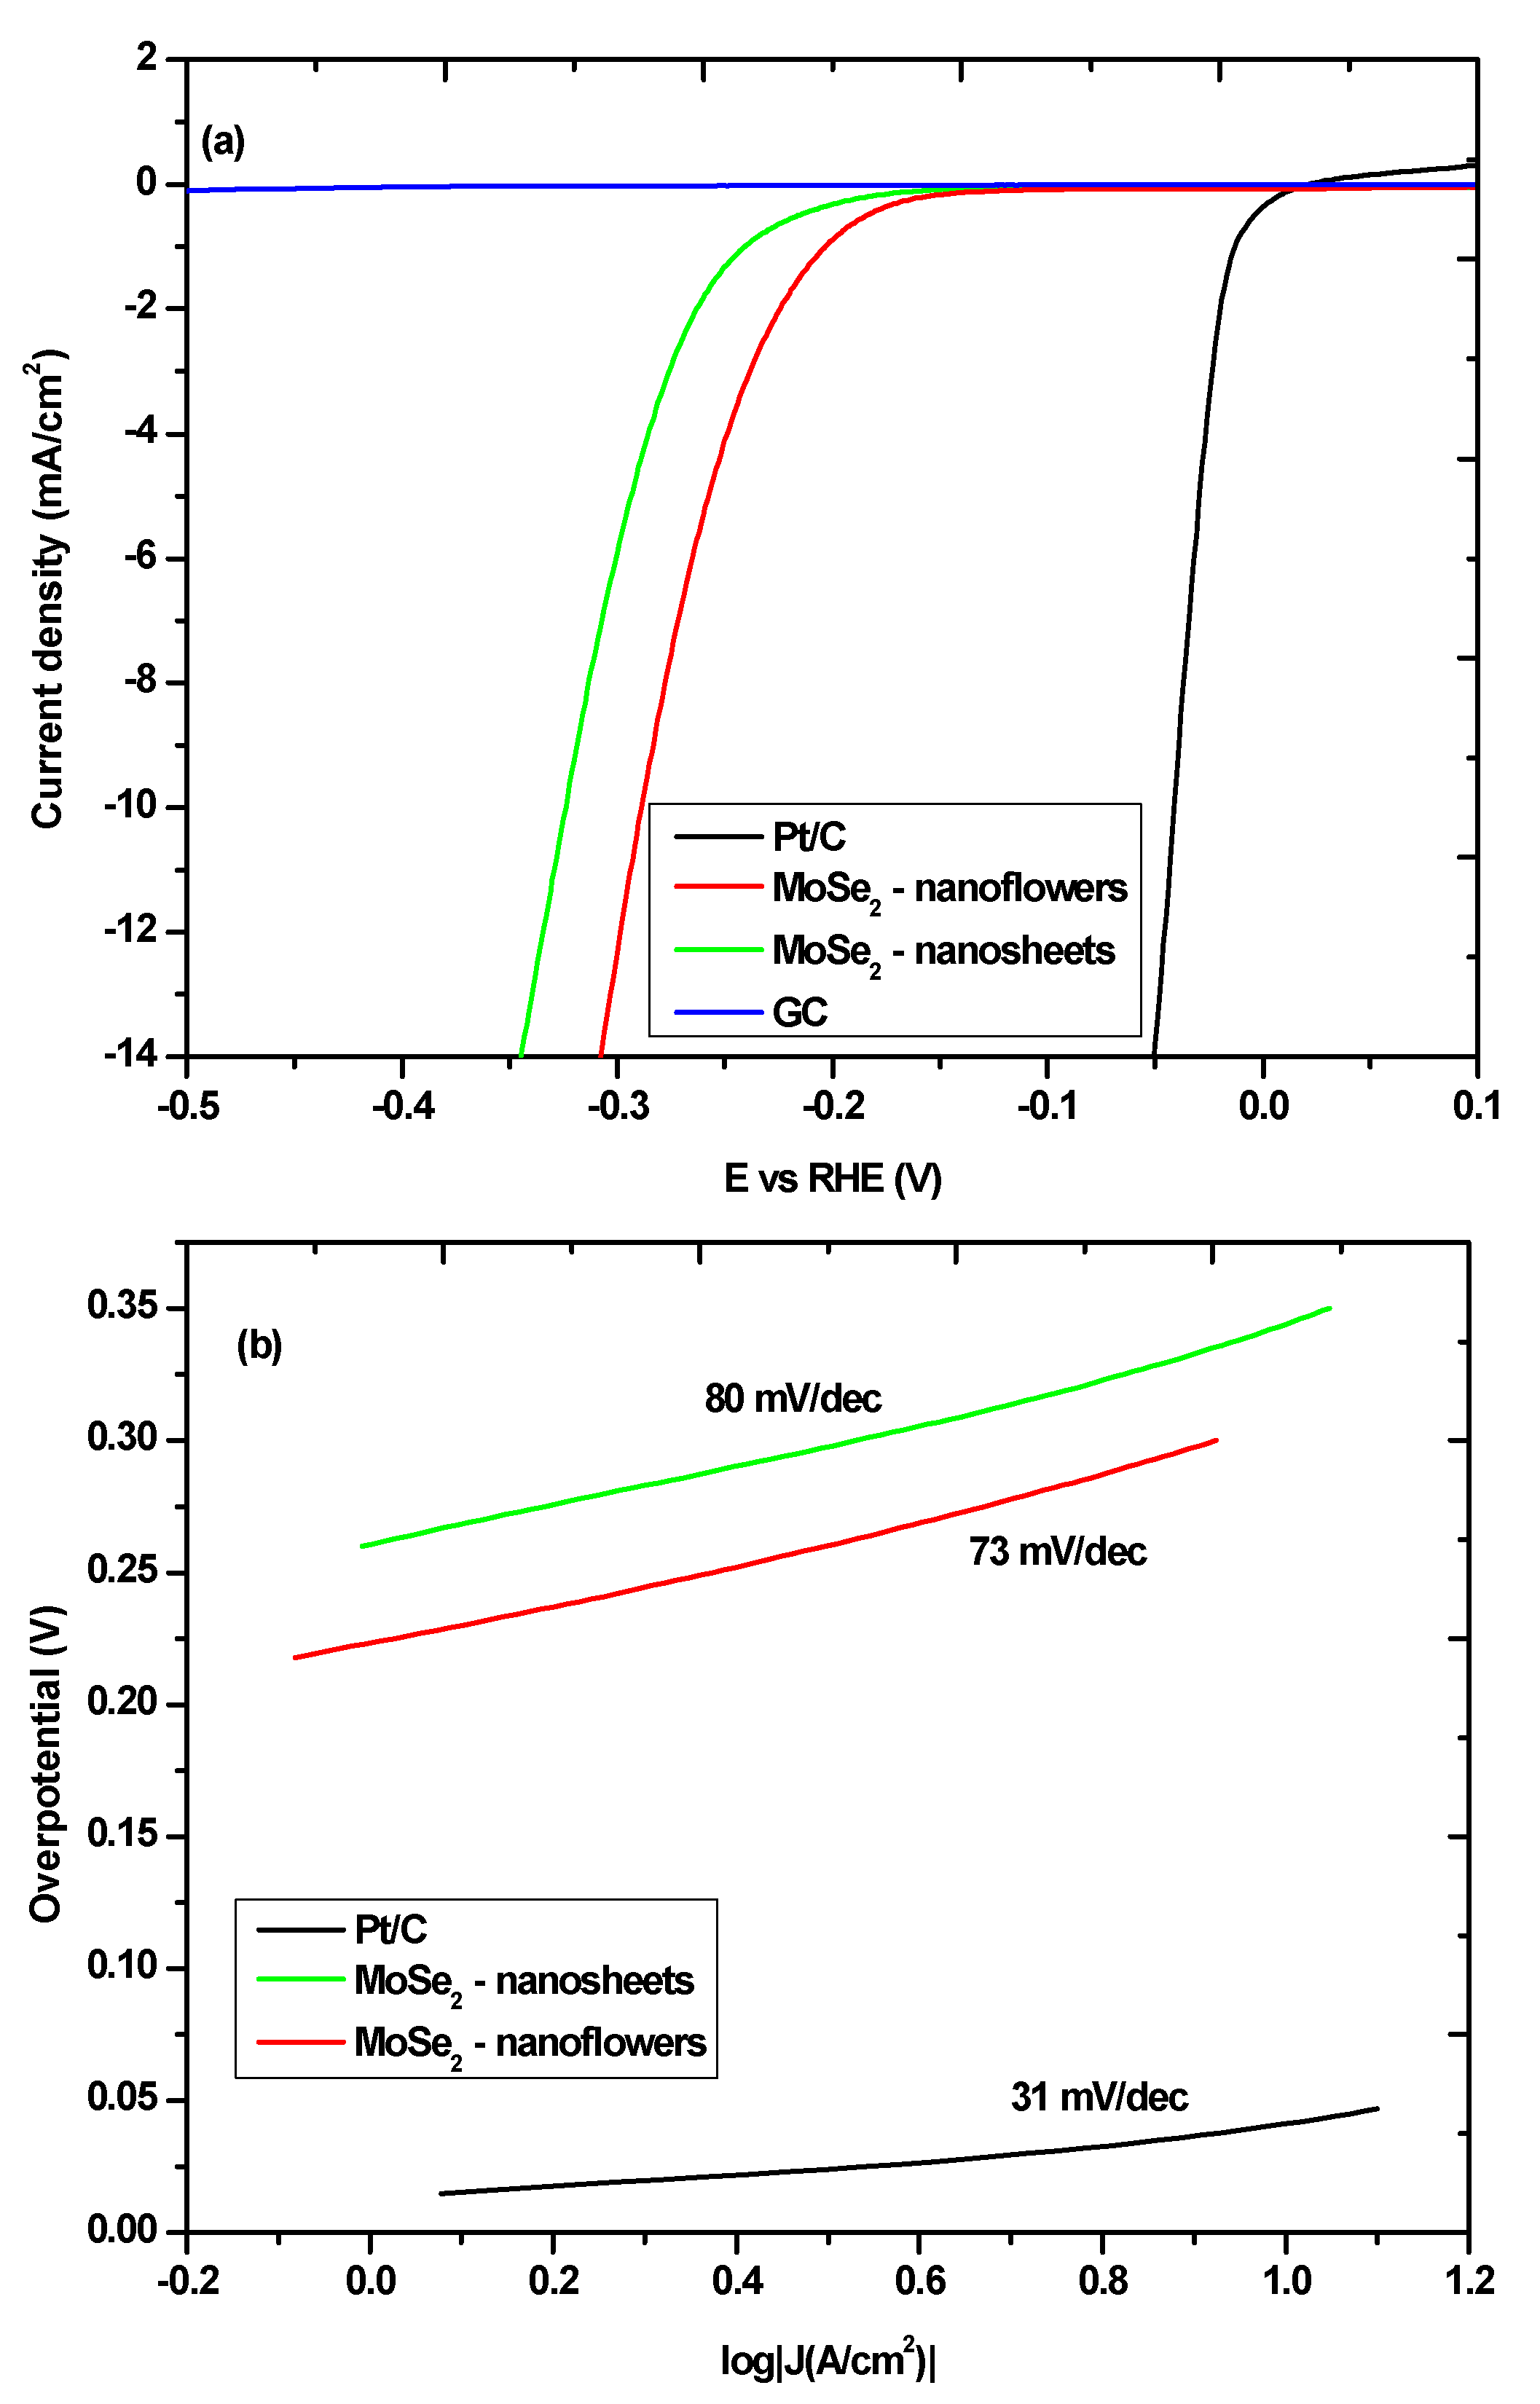
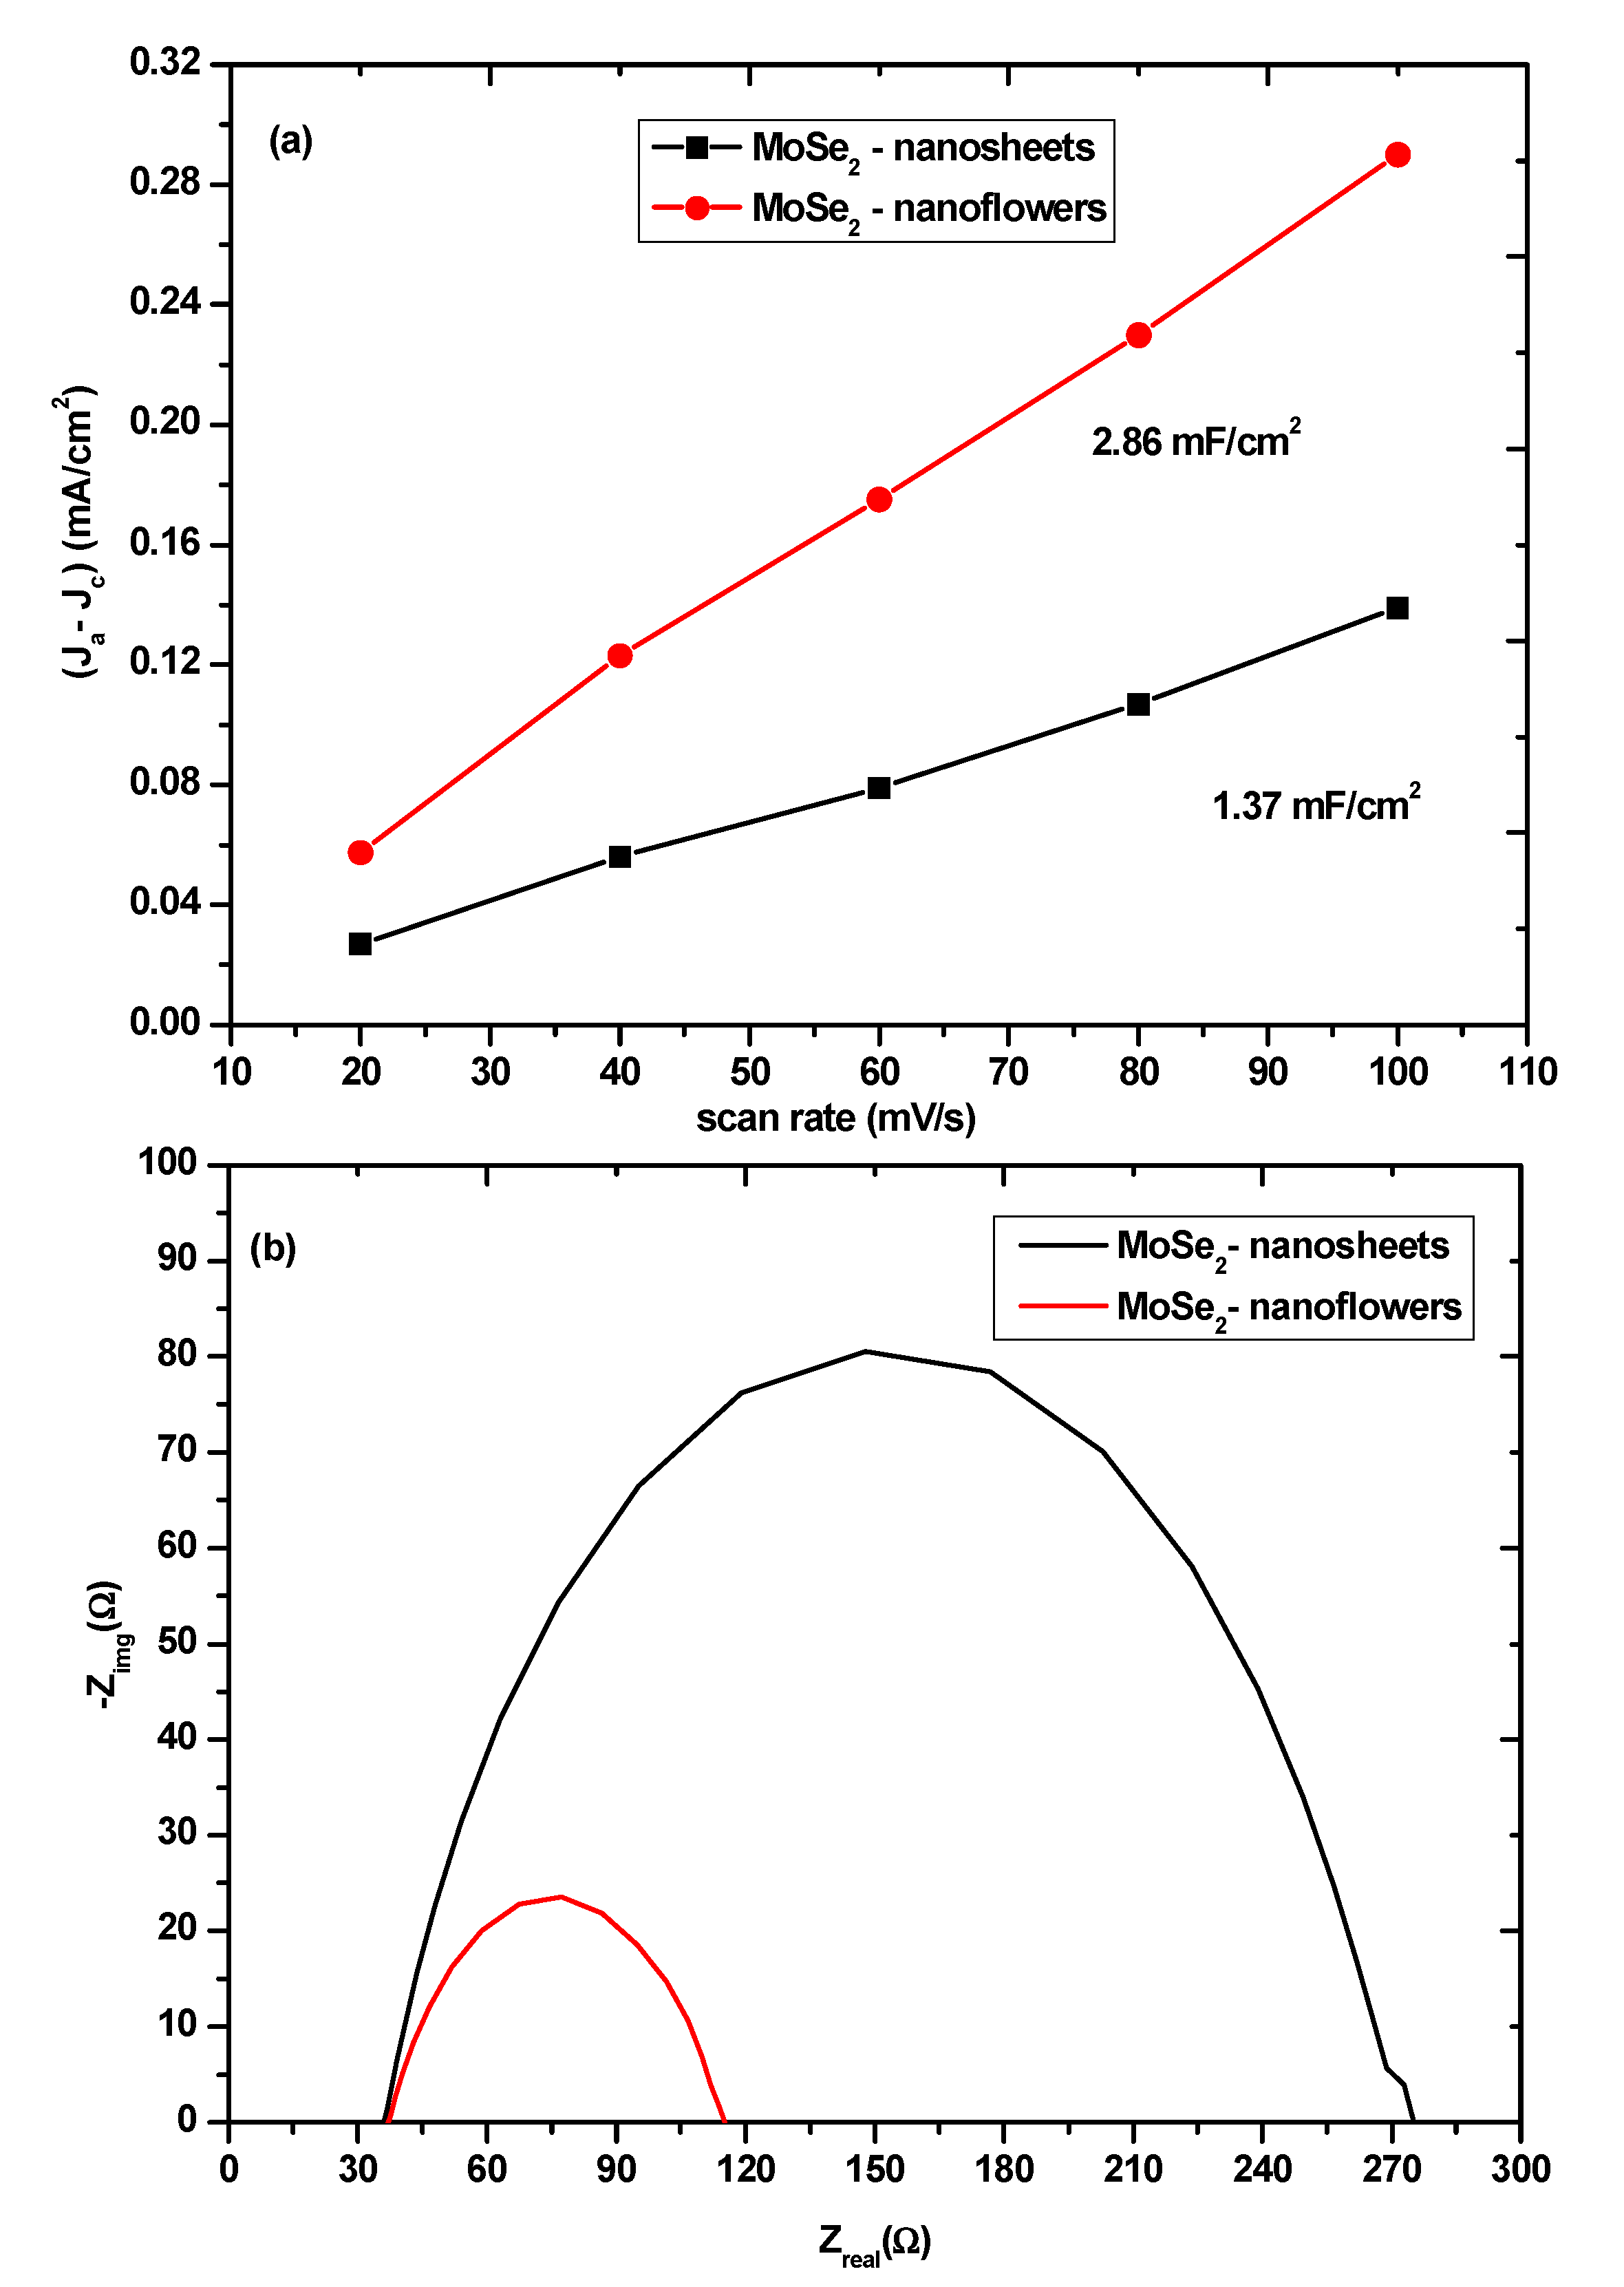
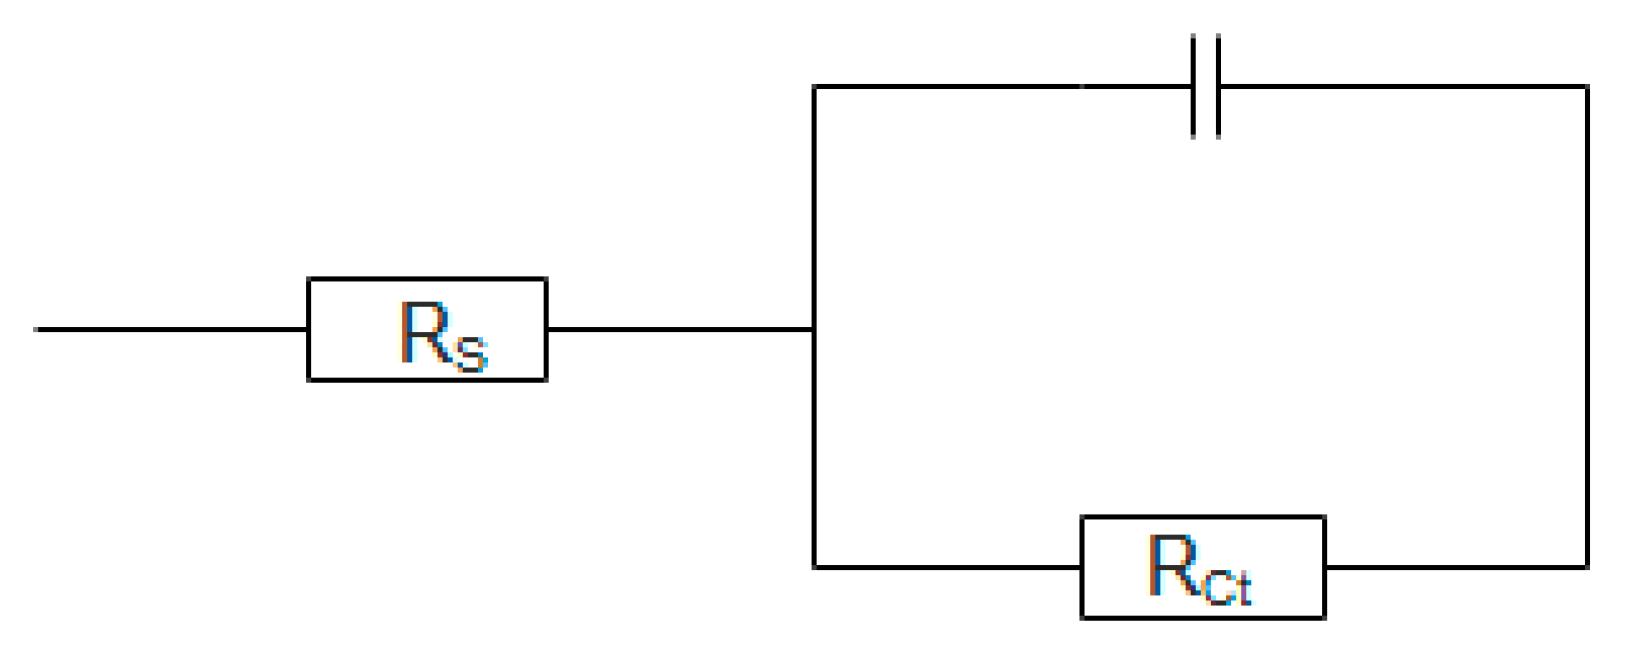
3.2. Electrochemical Characterization

Electrochemical characterization was done on the MoSe2 nanomaterials. This was done in order to show how the control of the morphology using the metal precursors can be used to improve the electrocatalytic activity of MoSe2 nanomaterials towards the hydrogen evolution reaction. Polarisation curves of the MoSe2 nanosheets and MoSe2 nanoflowers are shown in Figure 6a along with the polarization curves for 20% Pt/C and glassy carbon (GC). The 20% Pt/C was used as a standard and the GC polarization curve was done to ensure that the current response from the MoSe2 nanomaterials was not due to the effect of the GC.
The polarization curves show that the nanoflowers have superior electrocatalytic activity towards the HER compared to nanosheets. The on-set potential for the -nanoflowers was lower than that of the nanosheets at 156 mV and 182 mV, respectively. This shows that a smaller overpotential is needed to start the reaction for the nanoflowers than the nanosheets. This trend is also observed when looking at the over-potential needed to reach a specified current density; the over-potentials at approximately 10 mA/cm210) for the nanoflowers and nanosheets were found to be 301 mV and 340 mV respectively. As expected, the Pt/C sample displayed a lower on-set potential and potential at 10 mA/cm2. The GC electrode displayed negligible activity towards the HER. The Tafel plots of the MoSe2 nanomaterials and the Pt/C samples are shown in Figure 6b.
The Tafel plot was used to ascertain the Tafel slope which is a measure of the amount of over-potential needed to increase the reaction rate by a factor of 10. More accurately the Tafel slope is used to analyze the sensitivity of the current response to the applied potential. The Tafel slope for Pt/C was found to be 31 mV/dec which is roughly the number reported for this particular catalyst [35,36]. The Tafel slope for the MoSe2 nanoflowers was determined to be lower than that of the MoSe2 nanosheets at 73 mV/dec and 80 mV/dec respectively. This result shows that the activity of the MoSe2 nanomaterials is partly dependant on the morphology of the nanomaterials. This result is not surprising as it has been determined that the active sites for the HER in TMDs such as MoSe2 are the edge sites and as such the morphology that can effectively expose these edge sites would, therefore, have a better activity towards the HER. In this case the nanoflowers seem to be more effective at exposing these edge sites compared to the nanosheets as seen by the superior performance of the nanoflowers compared to the nanosheets. This is consistent with what has been reported in the literature with respect to how the nanoflowers morphology seems to be more ideal for the HER compared to other nanomaterial morphologies [36,37]. This can also be attributed to the higher surface area of the nanoflowers compared to the nanosheets which may afford the nanoflowers more available active sites.
To get a better understanding of the role of the surface area on the activity of the catalysts the Cdl plots for the two morphologies were obtained in order to get an estimation of the effective electrochemical surface area. Cyclic voltammetry (CV) was employed in order to determine the Cdl, the current response from the CV curves in the potential range between 0.2 V to 0.6 V shown in Figure S4 is due to the double layer charging. The electrochemical double layer can be used to estimate the effective electrochemical surface area because it is expected that the double layer capacitance is linearly proportional to the active surface area [38]. The estimation is done by plotting the difference between anodic and cathodic current densities (ΔJ = Ja − Jc) vs the scan rate at 0.41 V vs RHE which is shown in Figure 7a. In this linear plot, the slope is the Cdl. As expected, the Cdl of the MoSe2-nanoflowers was found to be higher than that of the MoSe2 nanosheets which indicates that the nanoflowers have more exposed edge sites. This would then explain why the nanoflowers seem to possess better electrocatalytic performance compared to the nanosheets.
The Cdl can be used to estimate the electrochemical surface area (ECSA); the ECSA is estimated using the ratio of the Cdl to the specific capacitance for the atomically smooth MoSe2 materials. By assuming that the specific capacitance for the atomically smooth MoSe2 is similar to that of MoS2 and using the Equation (4) [39].
ECSA = Cdl ( mF / c m 2 ) Cdl ( μ F / c m 2 )
The ECSA of the nanoflowers and nanosheets was found to be 48 and 23, respectively. The higher ECSA of the nanoflowers further shows why the nanoflowers have superior electrochemical properties towards the HER. It should be noted that the wrinkled few-layer nanosheets also have a significant exposure of active edge sites because the nanosheets have a lot of standing edges but the nanoflowers have an advantage because all of the nanosheets that grow from the dense central-core terminate in the active edge sites. The electrode kinetics under HER conditions was investigated using impedance spectroscopy (EIS). The impedance spectra in Figure 7b can reveal information about the charge transfer resistance in the Nyquist plot. A small semicircle indicates a small charge transfer resistance which is the resistance associated with the transfer of electrons from the electrode material to the ions in solution. When the impedance data was fitted to the appropriate equivalent circuit shown in Figure 8, the values of the charge transfer resistance (Rct) were ascertained.
The impedance spectra show that the charge transfer resistance of the MoSe2 nanoflowers (89 Ω) is much smaller than that of the MoSe2 nanosheets (220 Ω). This suggests that the electron transfer between the electrode material and the electrolyte in the nanoflowers is much more effective than in the nanosheets. Stability studies were also performed on the nanomaterials to determine whether they are stable in acidic media. An initial LSV scan was compared to a LSV scan that was measured after a thousand cycles were performed at 100 mV/s. As shown in Figure S5 there was no significant change in the LSV curves after a thousand cycles for both the nanoflowers and the nanosheets which suggest that the nanomaterials are fairly stable in acidic media. A comparison of the overpotential at 10 mA/cm2 and the Tafel slopes of MoSe2 synthesized using different techniques is shown in Table 1. The electrochemical characterisation for the data in the table was done at 0.5 M H2SO4. Table 1 shows that the overpotential and Tafel slope of the MoSe2 nanomaterials synthesized using the colloidal synthesis is comparable to those of other synthetic techniques. This is also true for the results found in this study.

4. Conclusions

In summary, a colloidal synthetic method was developed to synthesize a network of wrinkled few-layer nanosheets. The method was also adapted to synthesize MoSe2 nanoflowers by using molybdic acid as the metal precursor. The electrochemical properties of the MoSe2 nanosheets and MoSe2 nanoflowers were used to ascertain which morphology of the nanomaterials was most suitable for use as an electrode material for the HER. The overall electrochemical performance of the MoSe2 nanoflowers was determined to be superior to that of the MoSe2 nanosheets due to their higher effective electrochemical surface area. This indicates that the MoSe2 nanoflowers would be more suitable for use as HER electrode materials.

Supplementary Materials

The following are available online at https://0-www-mdpi-com.brum.beds.ac.uk/2079-4991/10/9/1786/s1, Figure S1: TGA of selenourea showing the decomposition of the compound to H2Se and the carboamide (C(NH)2) at ~220 °C, Figure S2: HRTEM images of nanosheets synthesized at 30 min, showing the interlayer spacing of the nanosheets. The d-spacing of the lattice fringes can be used to determine whether the synthesized nanosheets are multi-layer or monolayer nanosheets. The d-spacing of the nanosheets was determined to be ~0.66 nm which is the d-spacing of the (002) lattice plane in multi-layer nanosheets. This confirms that the nanosheets at 30 min are indeed multi-layer, Figure S3: The FTIR spectrum of the product obtained when H2MoO4 is heated in oleylamine at 300 °C, Figure S4: CV curves of (a) MoSe2-nanosheets and (b) MoSe2-nanoflowers at scan-rates of 20, 40, 60, 80 and 100 mV/s, Figure S5: LSV curves of (a) MoSe2-nanoflowers and (b) MoSe2-nanosheets before and after a 1000 cycles of LSV.

Author Contributions

Z.N. was responsible for investigation, formal analysis and writing the original draft. N.S., S.N., T.K. and O.N. were responsible for formal analysis of some of the data and reviewing and editing the manuscript. P.S., Z.N.T. and E.C.L. were responsible for data curation in some of the techniques used, reviewing and editing the manuscript. S.S.G. and N.M. were responsible for conceptualization, supervision, funding acquisition and reviewing and editing of the manuscript. All authors have read and agreed to the published version of the manuscript.

Funding

This research was funded by the National Research Foundation, South Africa (UID: 115448) and the APC was funded by the University of the Witwatersrand.

Acknowledgments

The authors would like to thank the University of the Witwatersrand, the Wits Microscopy and Microanalysis Unit (MMU), and the National Research Foundation (NRF) for their financial support.

Conflicts of Interest

The authors declare no conflicts of interest.

References

  1. Memaran, S.; Pradhan, N.R.; Lu, Z.; Rhodes, D.; Ludwig, J.; Zhou, Q.; Ogunsolu, O.; Ajayan, P.M.; Smirnov, D.; Fernández-Domínguez, A.I. Pronounced photovoltaic response from multilayered transition-metal dichalcogenides PN-junctions. Nano Lett. 2015, 15, 7532–7538. [Google Scholar] [CrossRef] [Green Version]
  2. Airo, M.A.; Rodrigues, R.; Gqoba, S.; Ntholeng, N.; Otieno, F.; Moloto, M.J.; Greenshields, M.W.C.C.; Hümmelgen, I.A.; Moloto, N. Colloidal InSe nanostructures: Effect of morphology on their chemical sensitivity to methanol and formaldehyde fumes. Sens. Actuators B 2016, 236, 116–125. [Google Scholar] [CrossRef]
  3. Machogo, L.F.E.; Tetyana, P.; Sithole, R.; Gqoba, S.S.; Phao, N.; Airo, M.; Shumbula, P.M.; Moloto, M.J.; Moloto, N. Unravelling the structural properties of mixed-valence α-and β-AuSe nanostructures using XRD, TEM and XPS. Appl. Surf. Sci. 2018, 456, 973–979. [Google Scholar] [CrossRef]
  4. Balasingam, S.K.; Lee, J.S.; Jun, Y. Molybdenum diselenide/reduced graphene oxide based hybrid nanosheets for supercapacitor applications. Dalton Trans. 2016, 45, 9646–9653. [Google Scholar] [CrossRef]
  5. Jeong, Y.; Park, J.H.; Ahn, J.; Lim, J.Y.; Im, S. 2D MoSe2 field-effect transistor with small threshold voltage for piezoelectric touch sensor applications. ECS Meet. Abstr. 2018, MA2018–01, 2624. [Google Scholar]
  6. Ge, J.; Fan, L.; Wang, J.; Zhang, Q.; Liu, Z.; Zhang, E.; Liu, Q.; Yu, X.; Lu, B. MoSe2/N-doped carbon as anodes for potassium-ion batteries. Adv. Energy Mater. 2018, 8, 1801477. [Google Scholar] [CrossRef]
  7. Mao, B.; Bao, T.; Yu, J.; Zheng, L.; Qin, J.; Yin, W.; Cao, M. One-pot synthesis of MoSe2 hetero-dimensional hybrid self-assembled by nanodots and nanosheets for electrocatalytic hydrogen evolution and photothermal therapy. Nano Res. 2017, 10, 2667–2682. [Google Scholar] [CrossRef]
  8. Zhang, C.; Chen, X.; Peng, Z.; Fu, X.; Lian, L.; Luo, W.; Zhang, J.; Li, H.; Wang, Y.; Zhang, D. Phosphine-free synthesis and shape evolution of MoSe2 nanoflowers for electrocatalytic hydrogen evolution reactions. CrystEngComm 2018, 20, 2491–2498. [Google Scholar] [CrossRef]
  9. Yang, H.; Zhao, J.; Wu, C.; Ye, C.; Zou, D.; Wang, S. Facile synthesis of colloidal stable MoS2 nanoparticles for combined tumor therapy. Chem. Eng. J. 2018, 351, 548–558. [Google Scholar] [CrossRef]
  10. Sun, Y.; Alimohammadi, F.; Zhang, D.; Guo, G. Enabling colloidal synthesis of edge-oriented MoS2 with expanded interlayer spacing for enhanced HER catalysis. Nano Lett. 2017, 17, 1963–1969. [Google Scholar] [CrossRef]
  11. Lin, H.; Wang, C.; Wu, J.; Xu, Z.; Huang, Y.; Zhang, C. Colloidal synthesis of MoS2 quantum dots: Size-dependent tunable photoluminescence and bioimaging. New J. Chem. 2015, 39, 8492–8497. [Google Scholar] [CrossRef]
  12. van der Stam, W.; Akkerman, Q.A.; Ke, X.; van Huis, M.A.; Bals, S.; de Mello Donega, C. Solution-Processable Ultrathin Size-and Shape-Controlled Colloidal Cu2–x S Nanosheets. Chem. Mater. 2014, 27, 283–291. [Google Scholar] [CrossRef]
  13. Geisenhoff, J.Q.; Tamura, A.K.; Schimpf, A. Using ligands to control reactivity, size and phase in the colloidal synthesis of WSe2 nanocrystals. Chem. Commun. 2019, 55, 8856–8859. [Google Scholar] [CrossRef]
  14. Mansouri, A.; Semagina, N. Colloidal synthesis protocol of shape-and dimensionally-controlled transition-metal chalcogenides and their hydrodesulfurization activities. ACS Appl. Nano Mater. 2018, 1, 4408–4412. [Google Scholar] [CrossRef]
  15. Yoo, D.; Kim, M.; Jeong, S.; Han, J.; Cheon, J. Chemical synthetic strategy for single-layer transition-metal chalcogenides. J. Am. Chem. Soc. 2014, 136, 14670–14673. [Google Scholar] [CrossRef]
  16. Sayed, F.N.; Polshettiwar, V. Facile and sustainable synthesis of shaped iron oxide nanoparticles: Effect of iron precursor salts on the shapes of iron oxides. Sci. Rep. 2015, 5, 1–14. [Google Scholar] [CrossRef] [Green Version]
  17. Jangir, L.K.; Kumari, Y.; Kumar, A.; Kumar, M.; Awasthi, K. Investigation of luminescence and structural properties of ZnO nanoparticles, synthesized with different precursors. Mater. Chem. Front. 2017, 1, 1413–1421. [Google Scholar] [CrossRef]
  18. Arellano, J.S.; Rosendo, E.; Romano, R.; Nieto, G.; Diaz, T.; García, G.; Juárez, H.; Pacio, M.; Galeazzi, R.; Morales, C. Synthesis and characterization of CdSe nanoparticles with cadmium precursor variation in colloidal synthesis. Adv. Mate. Res. 2014, 976, 52–58. [Google Scholar] [CrossRef]
  19. Ghritlahre, V.; Kumari, J.; Agarwal, P. Synthesis and study of molybdenum diselenide (MoSe2) by Solvo-thermal method. AIP Conf. Proc. 2018, 1953, 050048. [Google Scholar]
  20. Mazloomi, K.; Gomes, C. Hydrogen as an energy carrier: Prospects and challenges. Renew. Sustain. Energy Rev. 2012, 16, 3024–3033. [Google Scholar] [CrossRef]
  21. Najafi, L.; Bellani, S.; Oropesa-Nuñez, R.; Ansaldo, A.; Prato, M.; Del Rio Castillo, A.E.; Bonaccorso, F. Engineered MoSe2-based heterostructures for efficient electrochemical hydrogen evolution reaction. Adv. Energy Mater. 2018, 8, 1703212. [Google Scholar] [CrossRef] [Green Version]
  22. Wang, H.; Kong, D.; Johanes, P.; Cha, J.J.; Zheng, G.; Yan, K.; Liu, N.; Cui, Y. MoSe2 and WSe2 nanofilms with vertically aligned molecular layers on curved and rough surfaces. Nano Lett. 2013, 13, 3426–3433. [Google Scholar] [CrossRef] [PubMed]
  23. Kong, D.; Wang, H.; Cha, J.J.; Pasta, M.; Koski, K.J.; Yao, J.; Cui, Y. Synthesis of MoS2 and MoSe2 films with vertically aligned layers. Nano Lett. 2013, 13, 1341–1347. [Google Scholar] [CrossRef] [PubMed]
  24. Joensen, P.; Frindt, R.; Morrison, S.R. Single-layer MoS2. Mater. Res. Bull. 1986, 21, 457–461. [Google Scholar] [CrossRef]
  25. Tonndorf, P.; Schmidt, R.; Böttger, P.; Zhang, X.; Börner, J.; Liebig, A.; Albrecht, M.; Kloc, C.; Gordan, O.; Zahn, D.R. Photoluminescence emission and Raman response of monolayer MoS2, MoSe2, and WSe2. Opt. Express 2013, 21, 4908–4916. [Google Scholar] [CrossRef]
  26. Niu, L.; Li, K.; Zhen, H.; Chui, Y.S.; Zhang, W.; Yan, F.; Zheng, Z. Salt-assisted high-throughput synthesis of single-and few-layer transition metal dichalcogenides and their application in organic solar cells. Small 2014, 10, 4651–4657. [Google Scholar] [CrossRef]
  27. Savjani, N.; Lewis, E.A.; Bissett, M.A.; Brent, J.R.; Dryfe, R.A.; Haigh, S.J.; O’Brien, P. Synthesis of lateral size-controlled monolayer 1 H-MoS2@ oleylamine as supercapacitor electrodes. Chem. Mater. 2016, 28, 657–664. [Google Scholar] [CrossRef]
  28. Cho, C.; Bernasek, S. Molybdenum deposition from the decomposition of molybdenum hexacarbonyl. J. Appl. Phys. 1989, 65, 3035–3043. [Google Scholar] [CrossRef]
  29. Gao, M.-R.; Chan, M.K.; Sun, Y. Edge-terminated molybdenum disulfide with a 9.4-Å interlayer spacing for electrochemical hydrogen production. Nat. Commun. 2015, 6, 1–8. [Google Scholar] [CrossRef] [Green Version]
  30. Sun, D.; Feng, S.; Terrones, M.; Schaak, R.E. Formation and interlayer decoupling of colloidal MoSe2 nanoflowers. Chem. Mater. 2015, 27, 3167–3175. [Google Scholar] [CrossRef]
  31. Yu, X.; Wang, J.; Zhang, M.; Yang, P.; Yang, L.; Cao, D.; Li, J. One-step synthesis of lamellar molybdate pillared hydrotalcite and its application for AZ31 Mg alloy protection. Solid State Sci. 2009, 11, 376–381. [Google Scholar] [CrossRef]
  32. Ghosh, S.; Srivastava, C.; Nath, S.; Celis, J.-P. Simple formation of nanostructured molybdenum disulfide thin films by electrodeposition. Int. J. Electrochem. 2013, 2013, 1–8. [Google Scholar] [CrossRef] [Green Version]
  33. Zhang, H. Synthesis of Highly Active Unsupported Molybdenum Sulfide Catalysts for Hydrosulfurization and Hydrodeoxygenation; University of New Brunswick: Bathurst, NB, Canada, 2014. [Google Scholar]
  34. Wang, R.; Jayakumar, A.; Xu, C.; Lee, J.-M. Ni(OH)2 nanoflowers/graphene hydrogels: A new assembly for supercapacitors. ACS Sustain. Chem. Eng. 2016, 4, 3736–3742. [Google Scholar] [CrossRef]
  35. Zhao, W.; Dong, B.; Guo, Z.; Su, G.; Gao, R.; Wang, W.; Cao, L. Colloidal synthesis of VSe2 single-layer nanosheets as novel electrocatalysts for the hydrogen evolution reaction. Chem. Commun. 2016, 52, 9228–9231. [Google Scholar] [CrossRef] [PubMed]
  36. Qu, Y.; Shao, M.; Shao, Y.; Yang, M.; Xu, J.; Kwok, C.T.; Shi, X.; Lu, Z.; Pan, H. Ultra-high electrocatalytic activity of VS2 nanoflowers for efficient hydrogen evolution reaction. J. Mater. Chem. A 2017, 5, 15080–15086. [Google Scholar] [CrossRef]
  37. Cao, J.; Zhang, X.; Zhang, Y.; Zhou, J.; Chen, Y.; Liu, X. Free MoS2 nanoflowers grown on graphene by microwave-assisted synthesis as highly efficient non-noble-metal electrocatalysts for the hydrogen evolution reaction. PLoS ONE 2016, 11, e0161374. [Google Scholar] [CrossRef]
  38. Qi, F.; Wang, X.; Zheng, B.; Chen, Y.; Yu, B.; Zhou, J.; He, J.; Li, P.; Zhang, W.; Li, Y. Self-assembled chrysanthemum-like microspheres constructed by few-layer ReSe2 nanosheets as a highly efficient and stable electrocatalyst for hydrogen evolution reaction. Electrochim. Acta 2017, 224, 593–599. [Google Scholar] [CrossRef]
  39. Benson, J.; Li, M.; Wang, S.; Wang, P.; Papakonstantinou, P. Electrocatalytic hydrogen evolution reaction on edges of a few layer molybdenum disulfide nanodots. ACS Appl. Mater. Interfaces 2015, 7, 14113–14122. [Google Scholar] [CrossRef] [Green Version]
  40. Masurkar, N.; Thangavel, N.K.; Arava, L.M.R. CVD-grown MoSe2 nanoflowers with dual active sites for efficient electrochemical hydrogen evolution reaction. ACS Appl. Mater. Interfaces 2018, 10, 27771–27779. [Google Scholar] [CrossRef]
  41. Zhang, L.; Wang, T.; Sun, L.; Sun, Y.; Hu, T.; Xu, K.; Ma, F. Hydrothermal synthesis of 3D hierarchical MoSe2/NiSe2 composite nanowires on carbon fiber paper and their enhanced electrocatalytic activity for the hydrogen evolution reaction. J. Mater. Chem. A 2017, 5, 19752–19759. [Google Scholar] [CrossRef]
  42. Guo, W.; Chen, Y.; Wang, L.; Xu, J.; Zeng, D.; Peng, D.-L. Colloidal synthesis of MoSe2 nanonetworks and nanoflowers with efficient electrocatalytic hydrogen-evolution activity. Electrochim. Acta 2017, 231, 69–76. [Google Scholar] [CrossRef]
  43. Zhou, X.; Jiang, J.; Ding, T.; Zhang, J.; Pan, B.; Zuo, J.; Yang, Q. Fast colloidal synthesis of scalable Mo-rich hierarchical ultrathin MoSe2-x nanosheets for high-performance hydrogen evolution. Nanoscale 2014, 6, 11046–11051. [Google Scholar] [CrossRef] [PubMed]
Figure 1. Powder X-ray diffraction patterns of (a) MoSe2 nanosheets (b) MoSe2 nanoflowers.
Nanomaterials 10 01786 g001
Figure 2. Raman spectra of (a) MoSe2 nanosheets and (b) MoSe2 nanoflowers.
Nanomaterials 10 01786 g002
Figure 3. SEM images of (a) MoSe2 nanosheets and (b) MoSe2 nanoflowers and TEM images of (c) MoSe2 nanosheets and (d) MoSe2 nanoflowers.
Nanomaterials 10 01786 g003
Figure 4. The TEM images of the MoSe2 nanosheets: (ac) are images of the nanomaterial taken at 30 min, (df) are the TEM images for MoSe2 wrinkled few-layer nanosheets at 60, 90 and 120 min.
Nanomaterials 10 01786 g004
Scheme 1. Mechanism for the formation of few-layer nanosheets.
Nanomaterials 10 01786 sch001
Figure 5. (a) TEM and (b) SEM images of MoSe2 nanoflowers formed at 30 min reaction time.
Nanomaterials 10 01786 g005
Scheme 2. Mechanism for the formation of MoSe2 nanoflowers.
Nanomaterials 10 01786 sch002
Figure 6. (a) Polarization curves for MoSe2 nanosheets and MoSe2 nanoflowers (b) Tafel slopes for MoSe2 nanosheets and MoSe2 nanoflowers.
Nanomaterials 10 01786 g006
Figure 7. (a) linear fitting of the capacitive currents of MoSe2-nanosheets and MoSe2-nanoflowers vs the increasing scan rates. (b) Nyquist plots of the MoSe2-nanosheets and MoSe2-nanoflowers at −200 mV vs RHE.
Nanomaterials 10 01786 g007
Figure 8. Equivalent circuit of the measured impedance spectra.
Nanomaterials 10 01786 g008
Table 1. Comparison of ƞ10 and Tafel slopes values of MoSe2 synthesized using different techniques.
HER CatalystSynthesis TechniqueȠ10
(mV)
Tafel Slope
(mV/dec)
Reference
MoSe2/GCLPE34088[21]
MoSe2-nanoflowersCVD22061[40]
MoSe2-nanosheetsHydrothermal30569[41]
MoSe2-nanonetworksColloidal302109[42]
MoSe2-nanoflowersColloidal23389[42]
MoSe2-x-nanosheetsColloidal30098[43]
MoSe2-nanosheetsColloidal34080This work
MoSe2-nanoflowersColloidal30173This work

