
Evaluation of Surface Change and Roughness in Implants Lost Due to Peri-Implantitis Using Erbium Laser and Various Methods: An In Vitro Study

 ,
,  ,
, 
Abstract
:1. Introduction
2. Materials and Methods
2.1. Sample Collection
2.2. Interventions
2.3. Analyses
2.3.1. SEM
- 1:
- Image without any contamination and resembling a positive control,
- 2:
- Spot contamination of observed image,
- 3:
- Image of contamination beyond spot contamination.
2.3.2. EDX
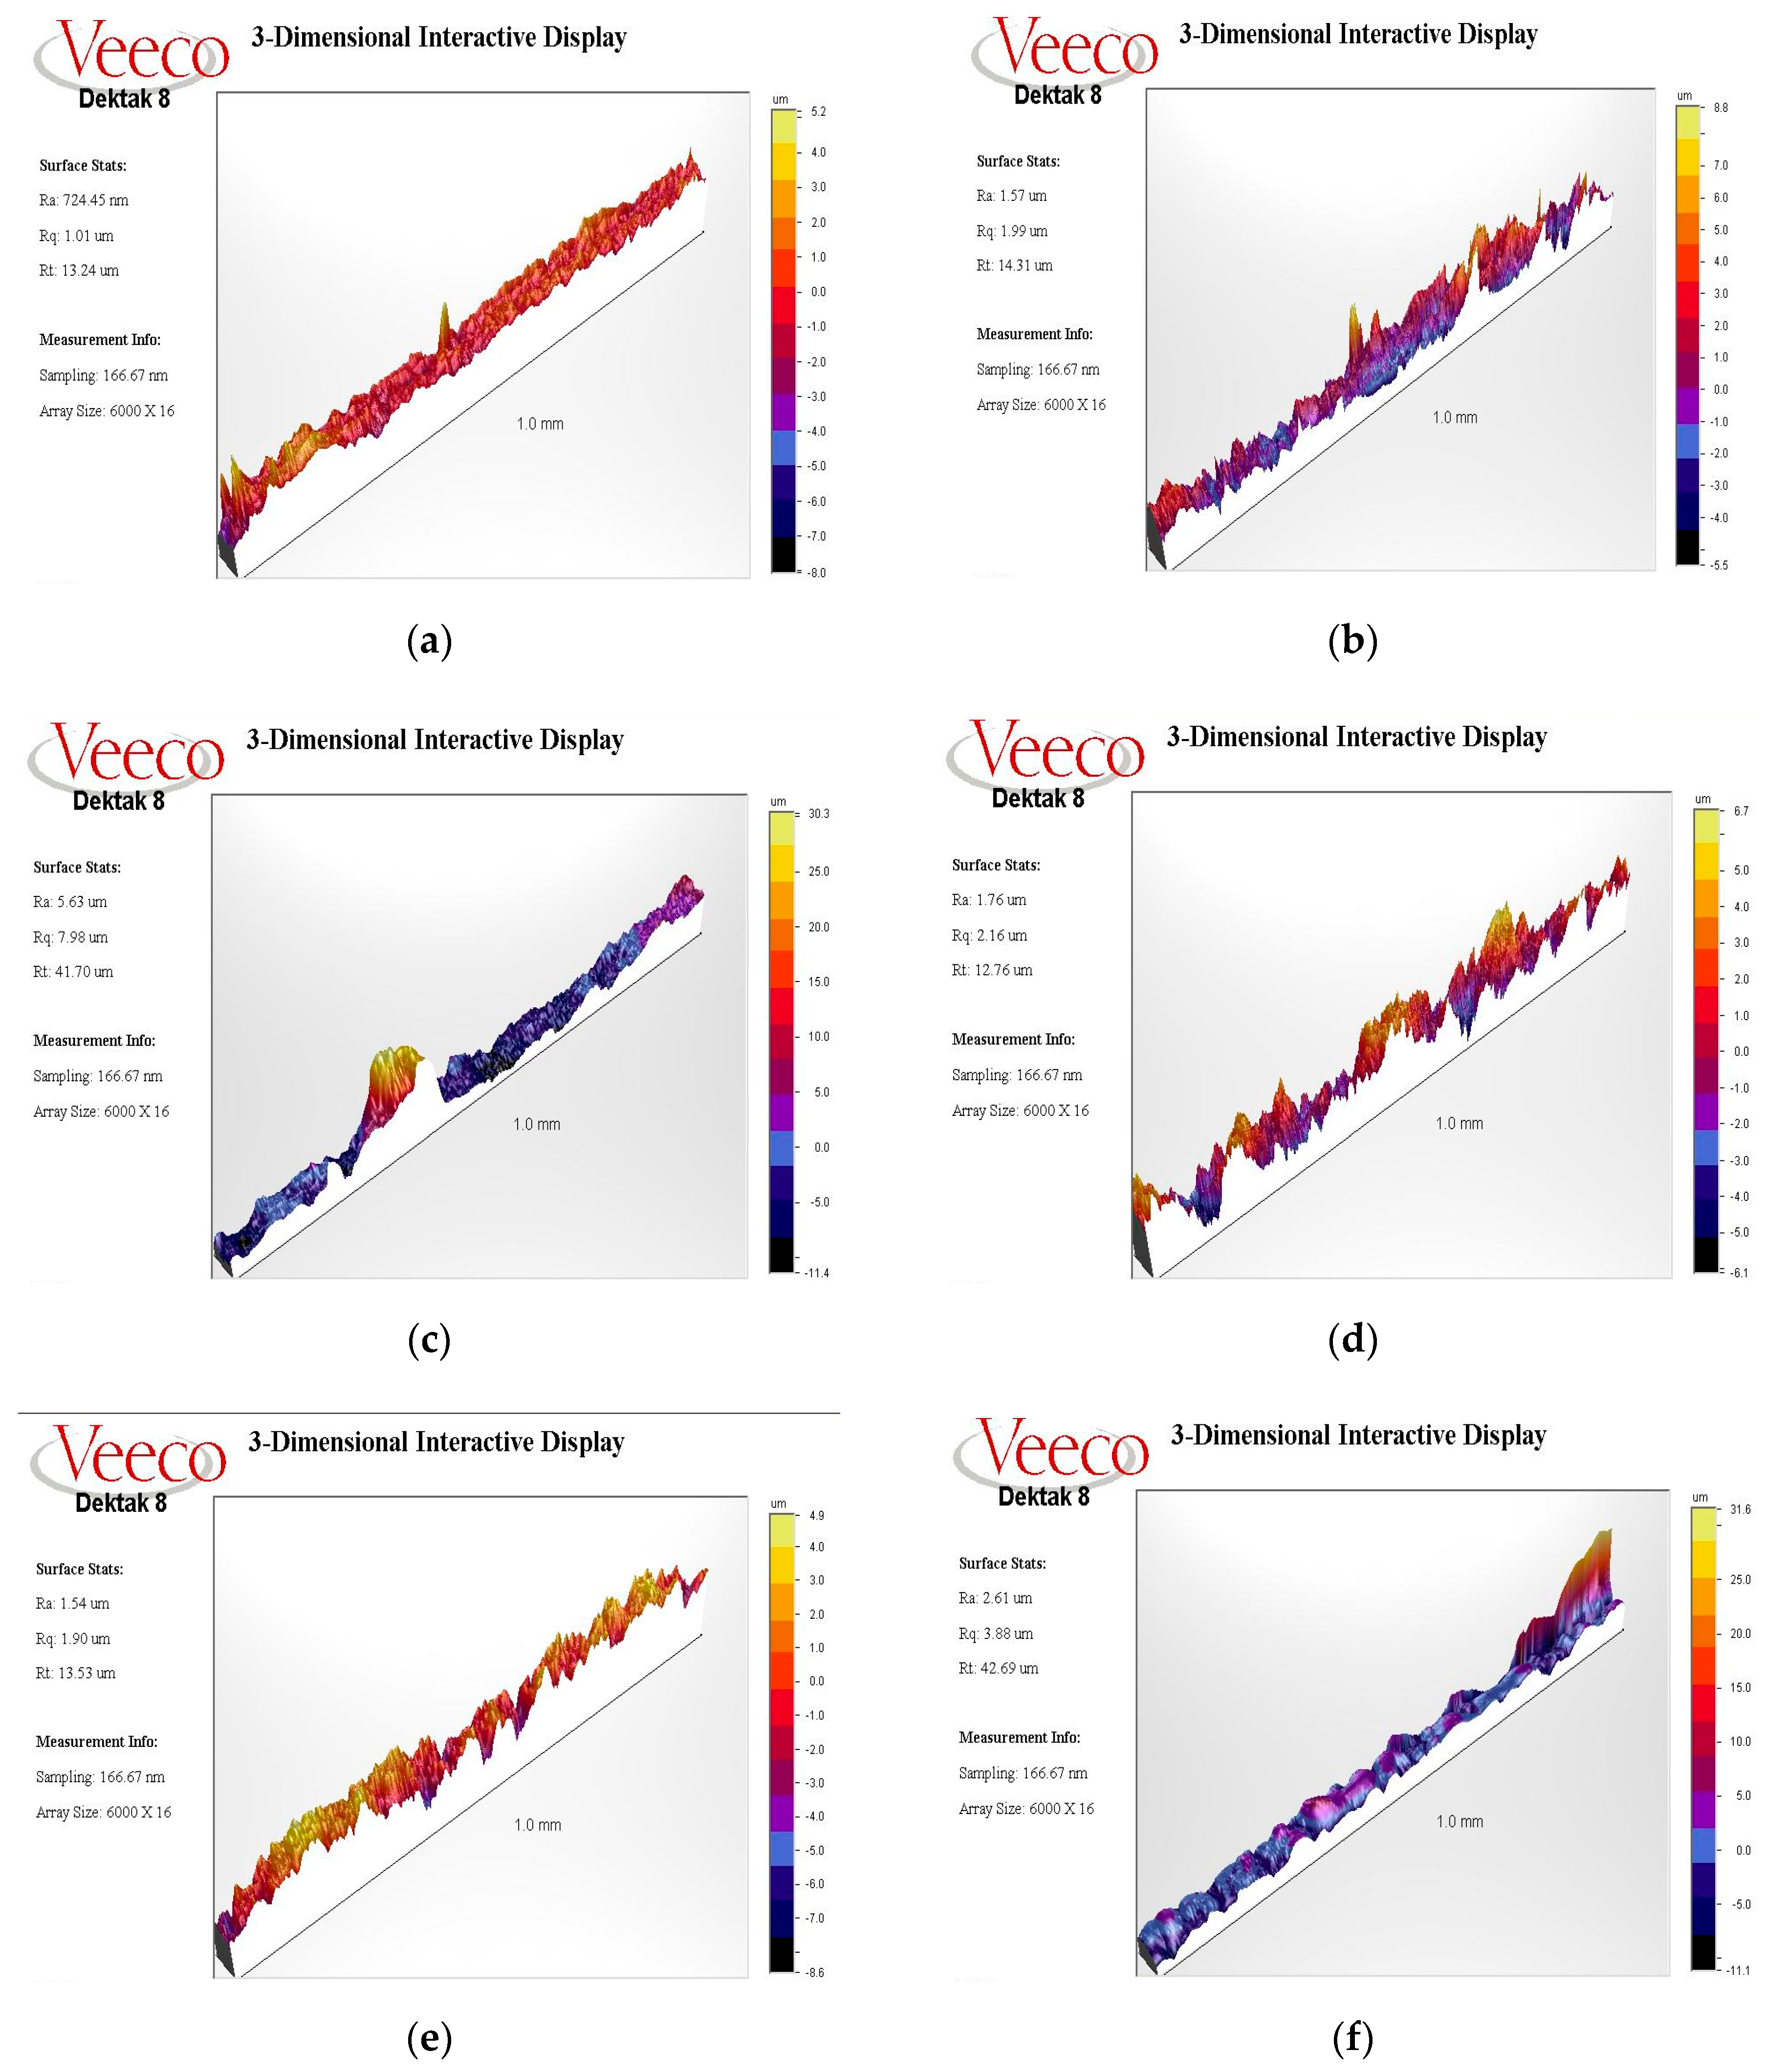
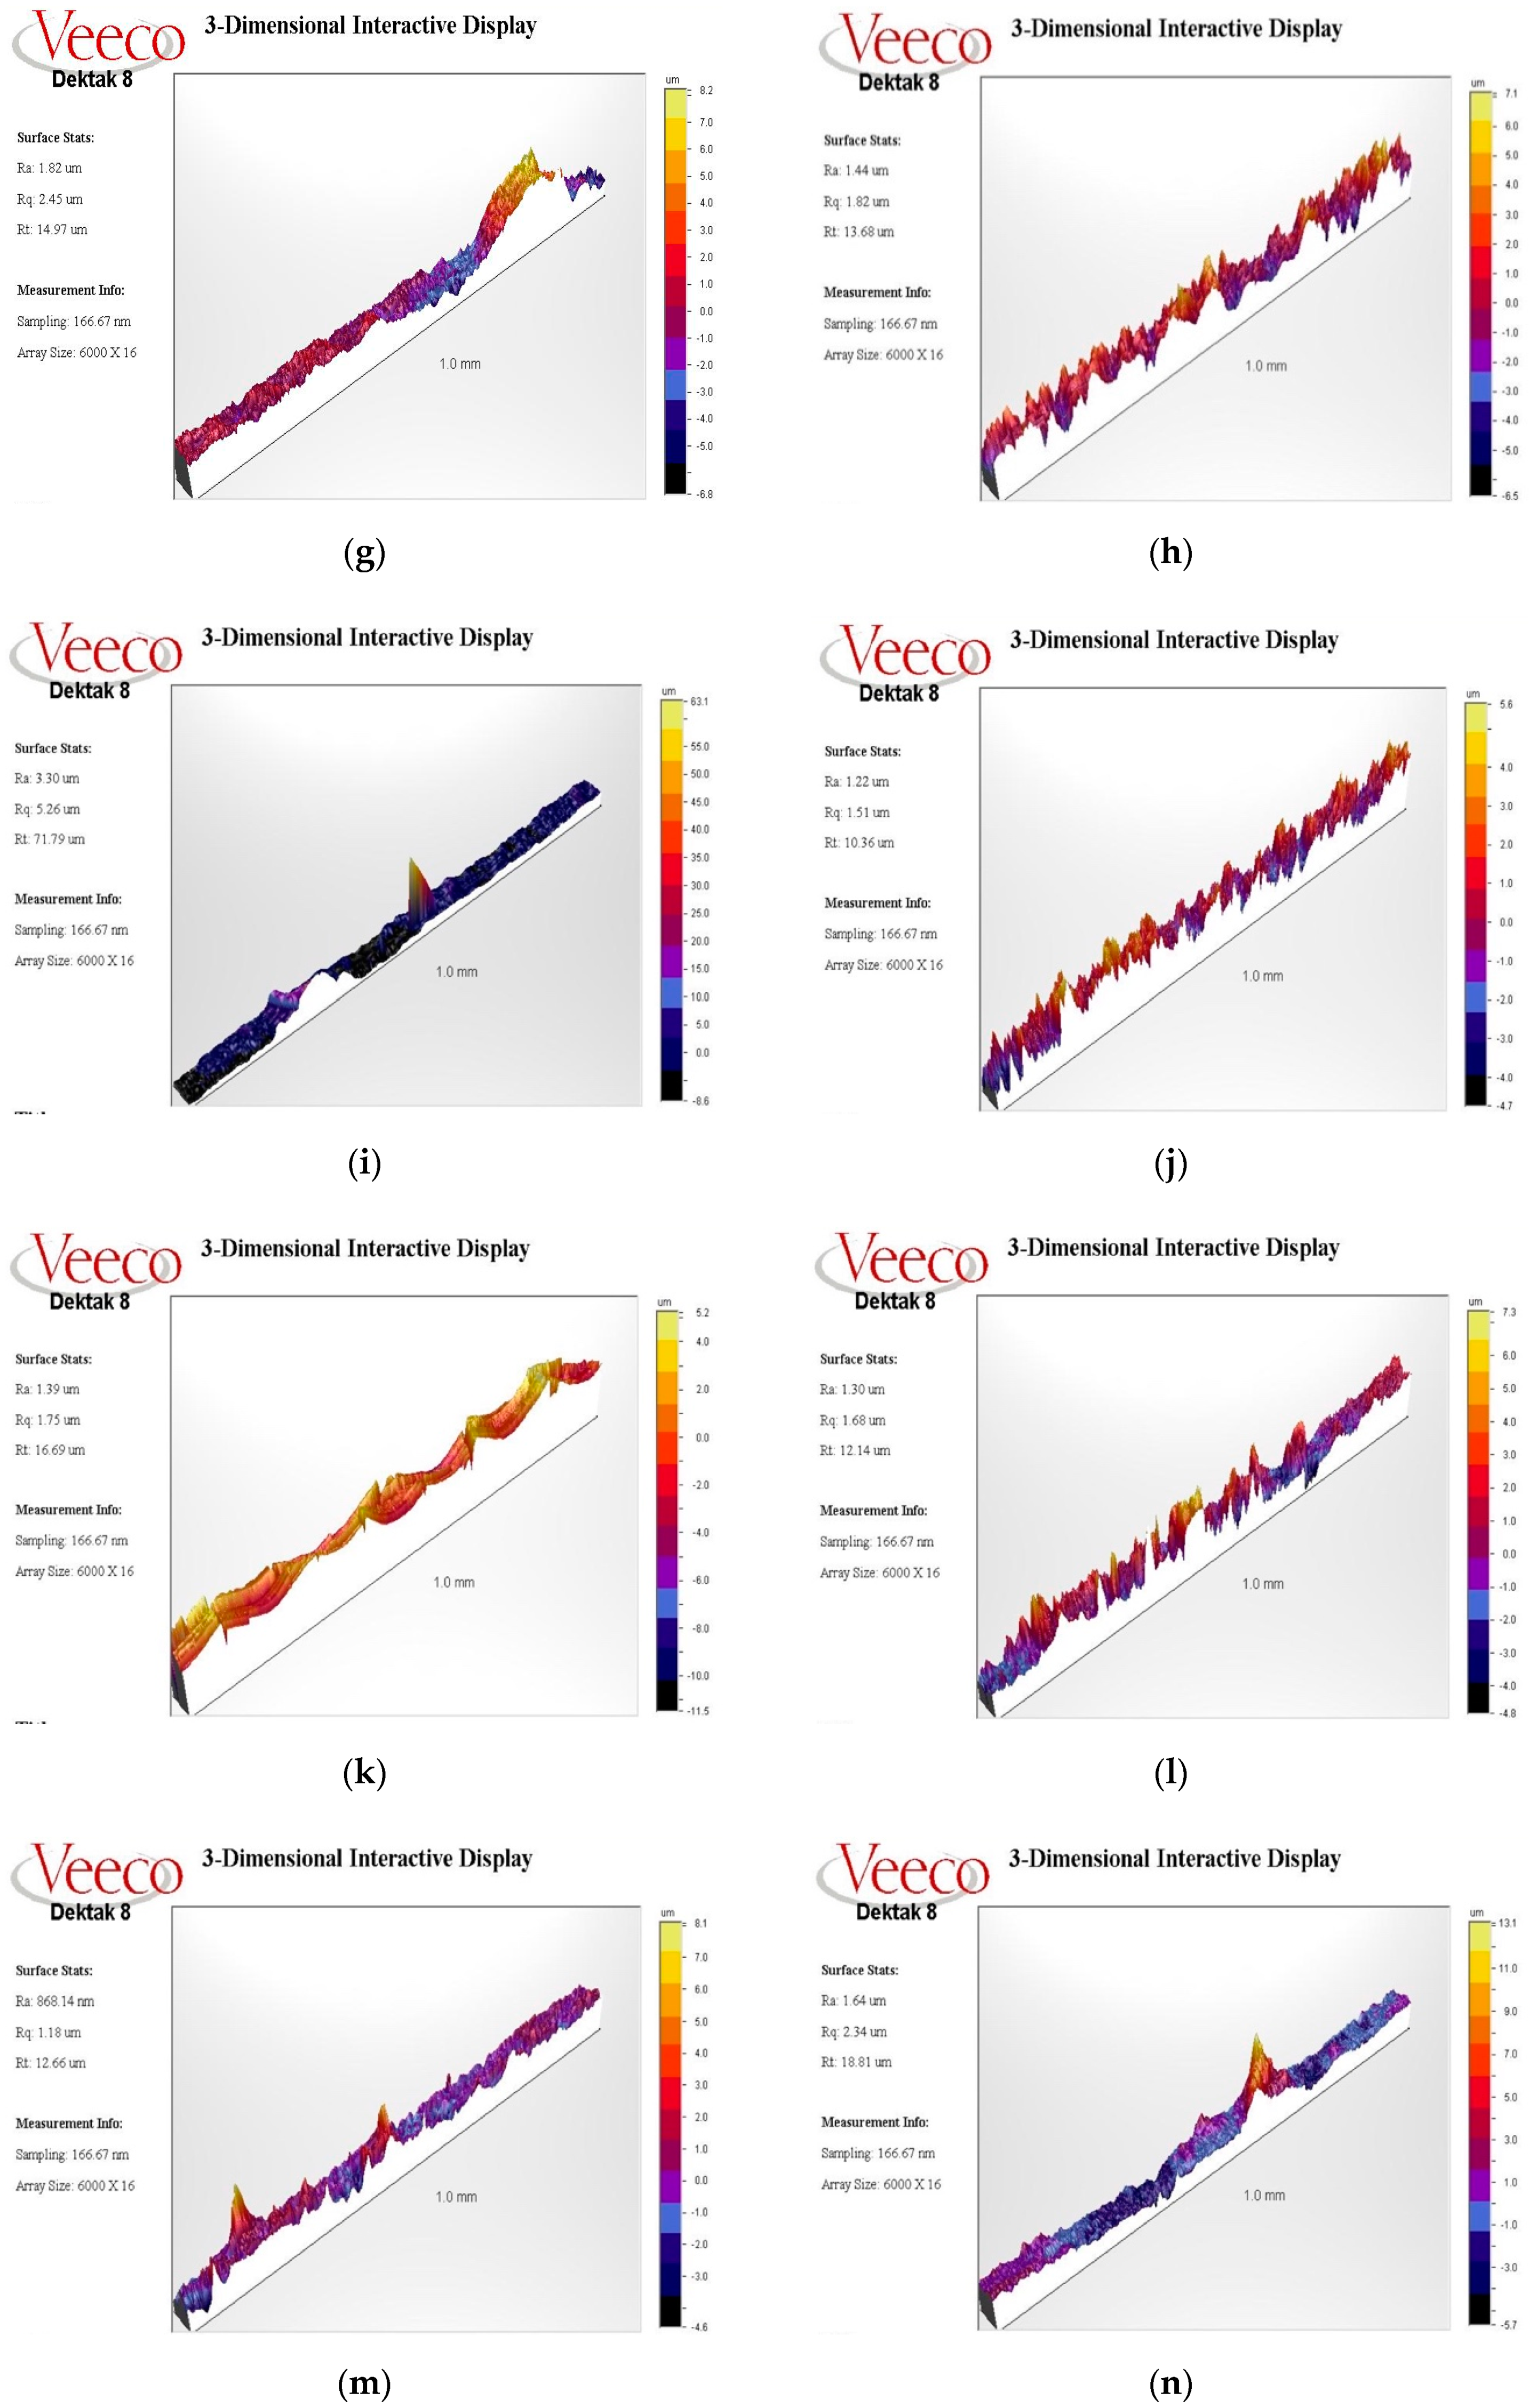
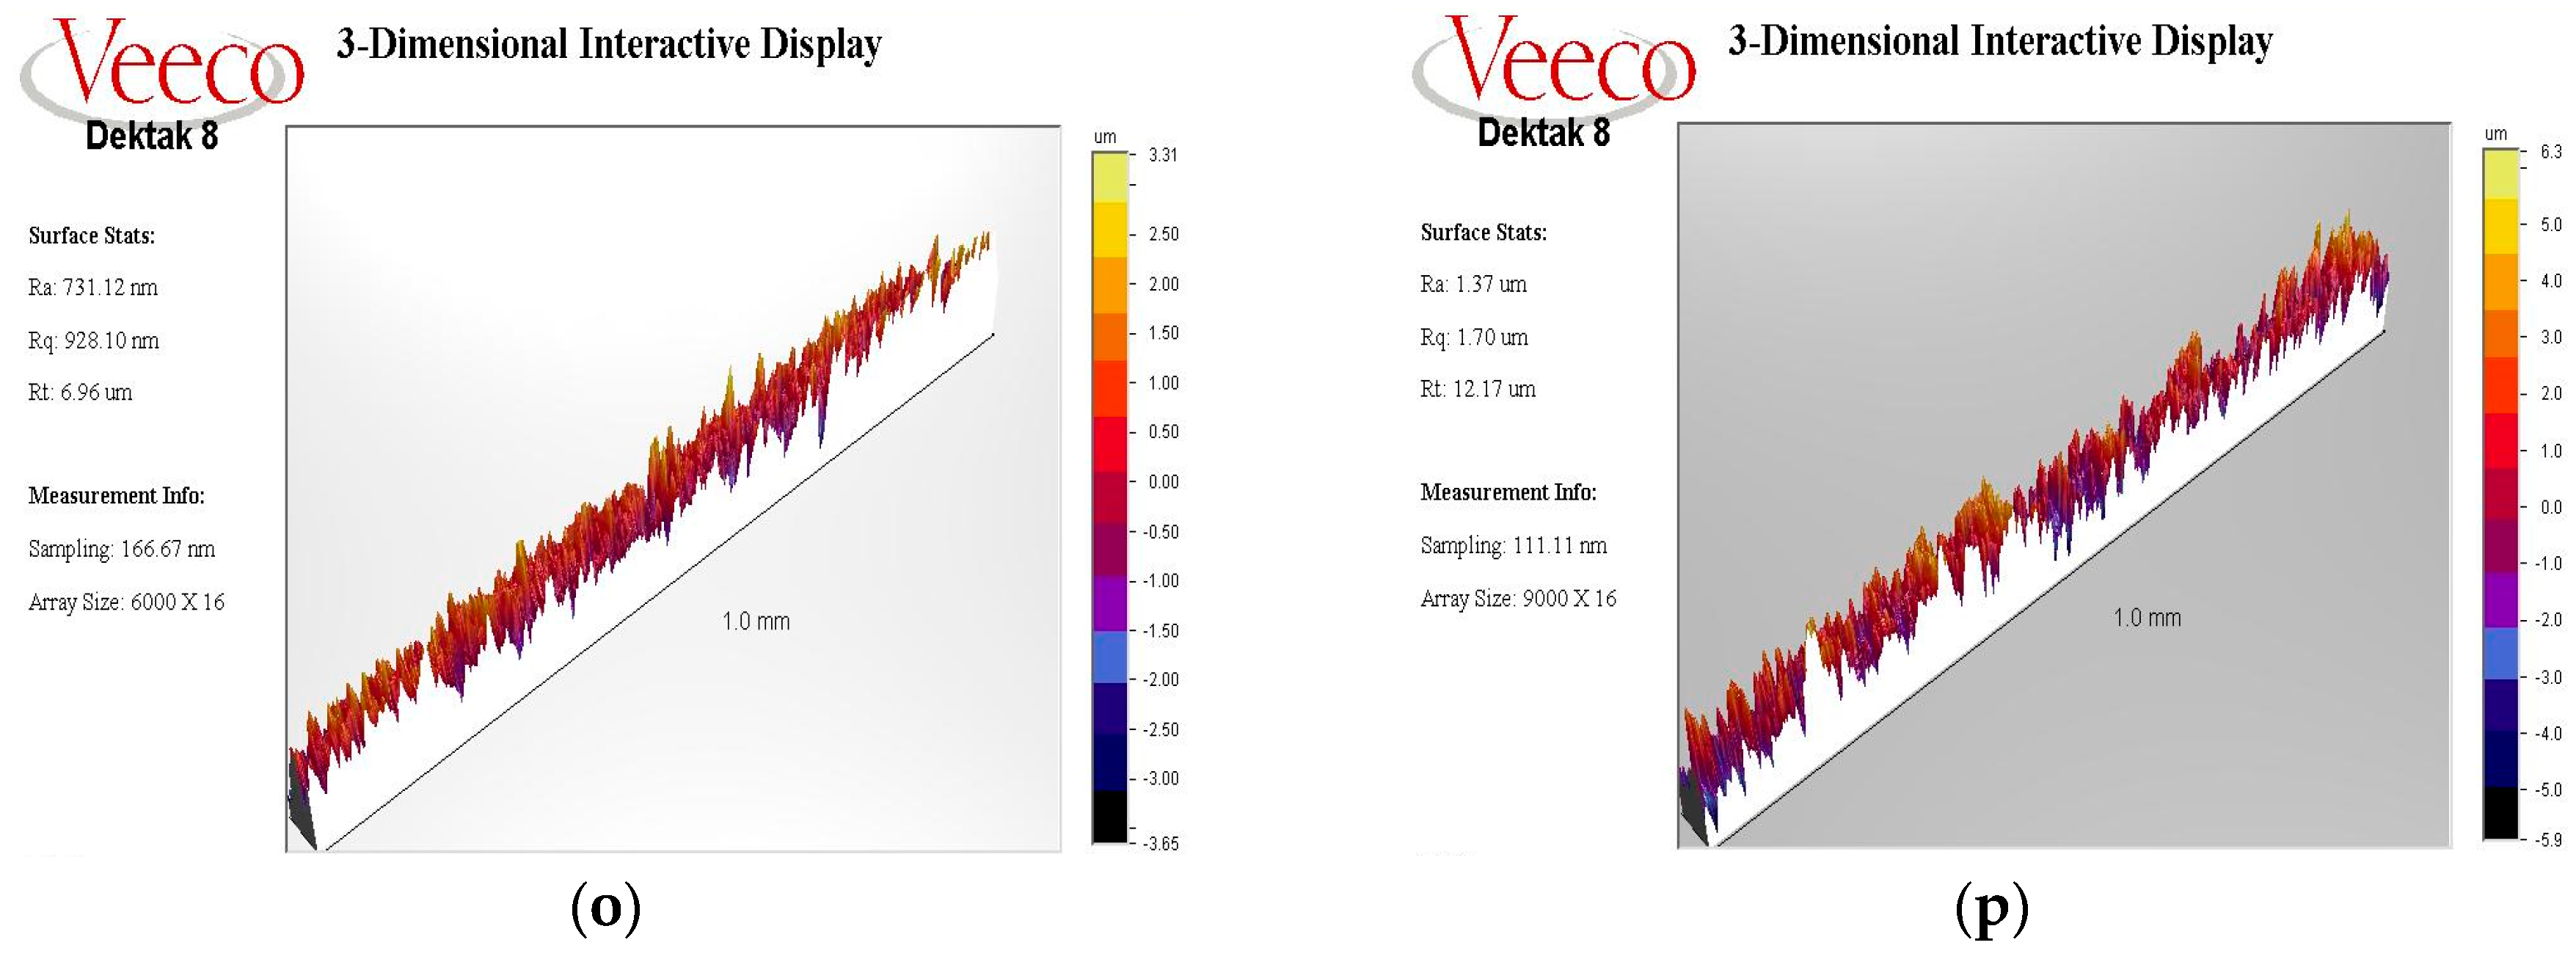
2.3.3. Profilometry
2.3.4. Statistical Analysis
3. Results
3.1. SEM Analysis
3.1.1. Ti-Cur Group
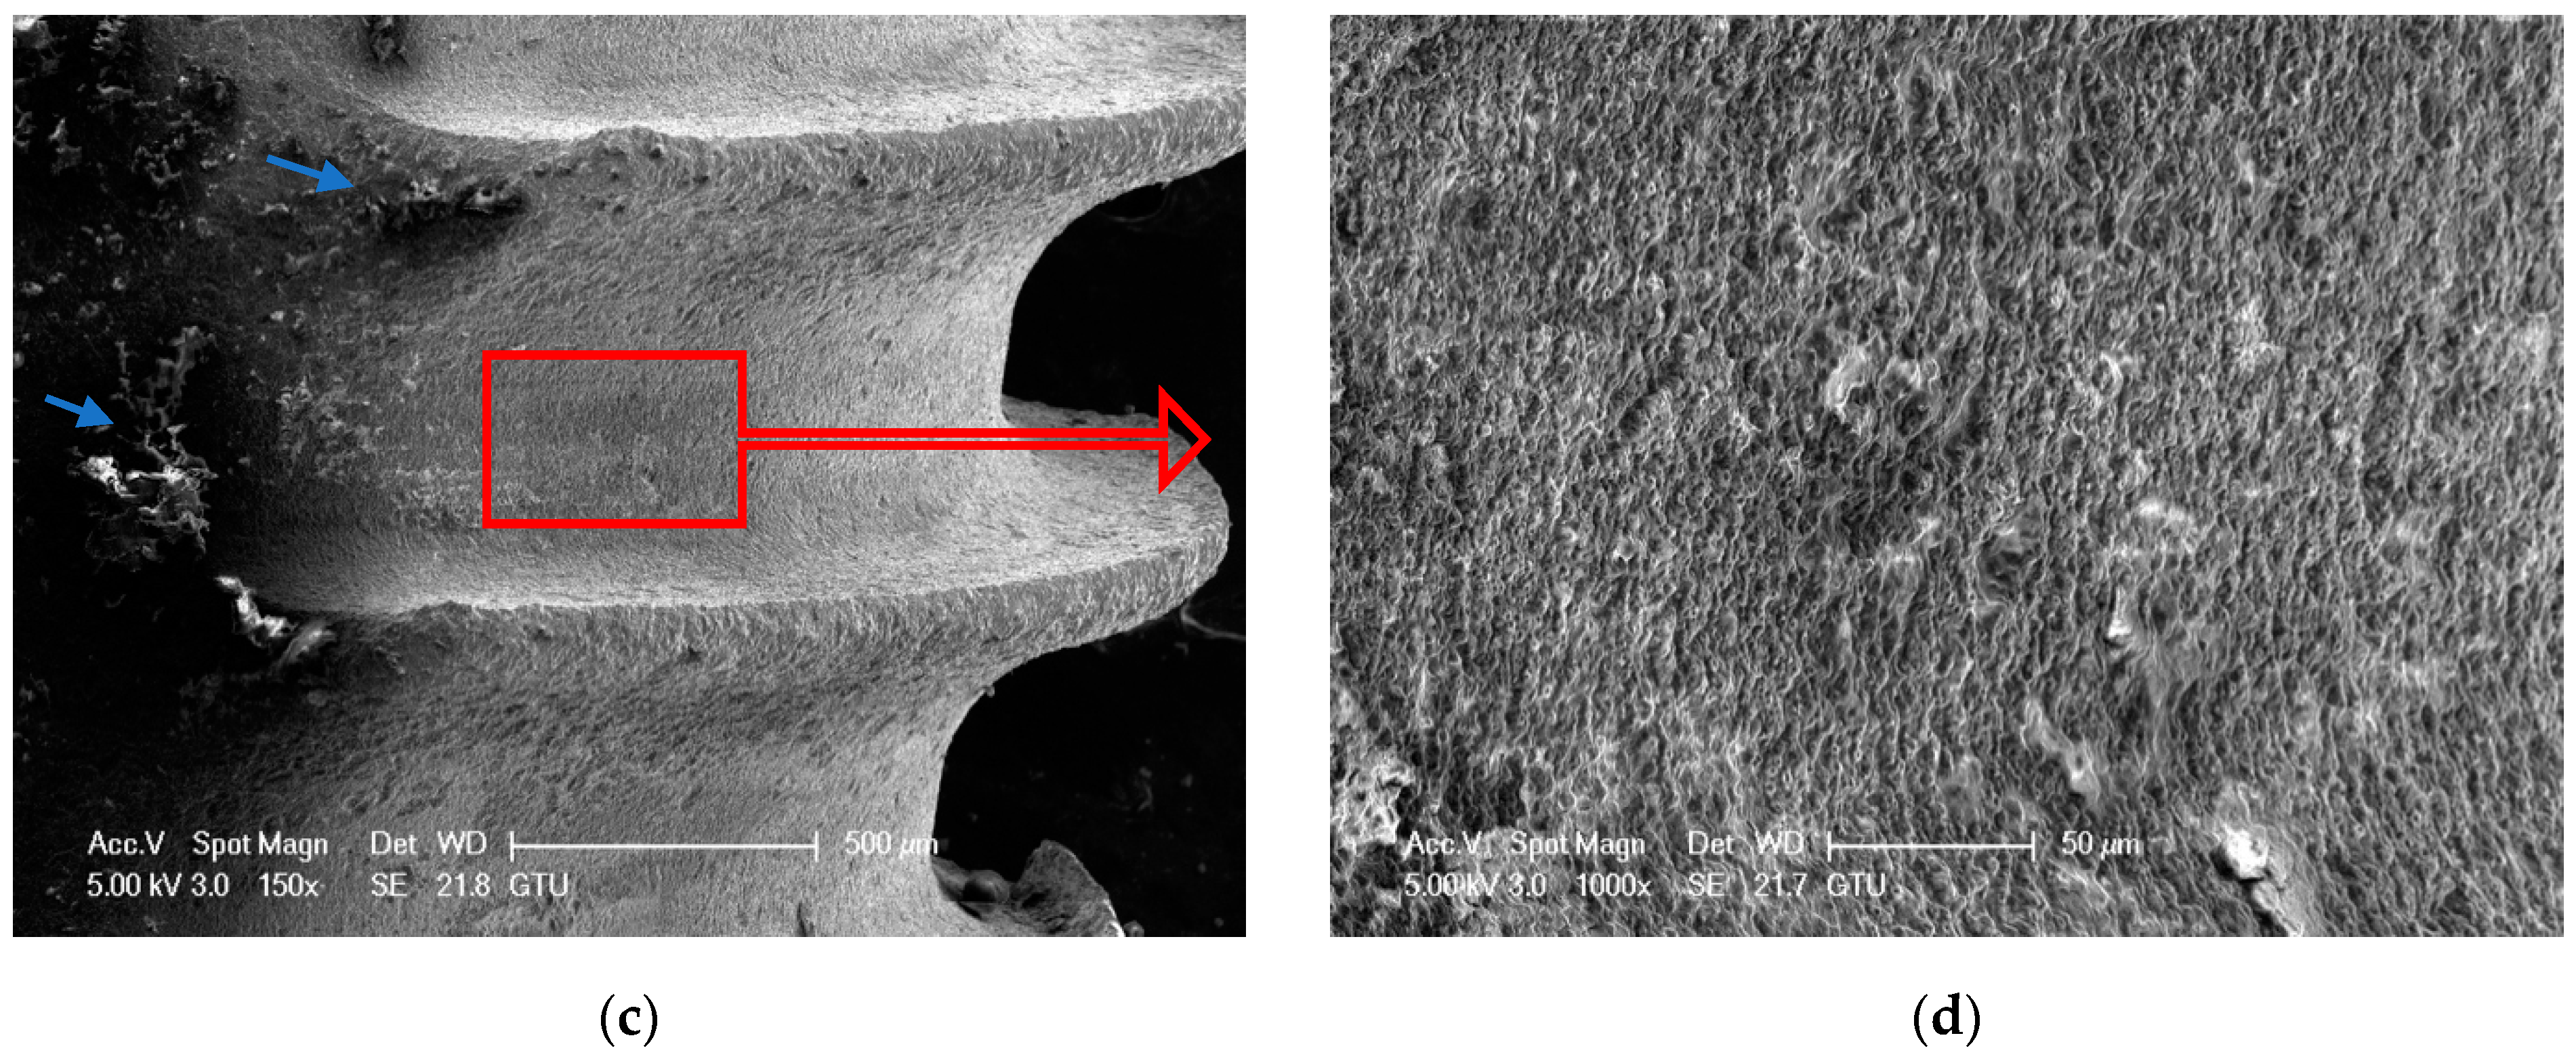
3.1.2. US-PEEK Group
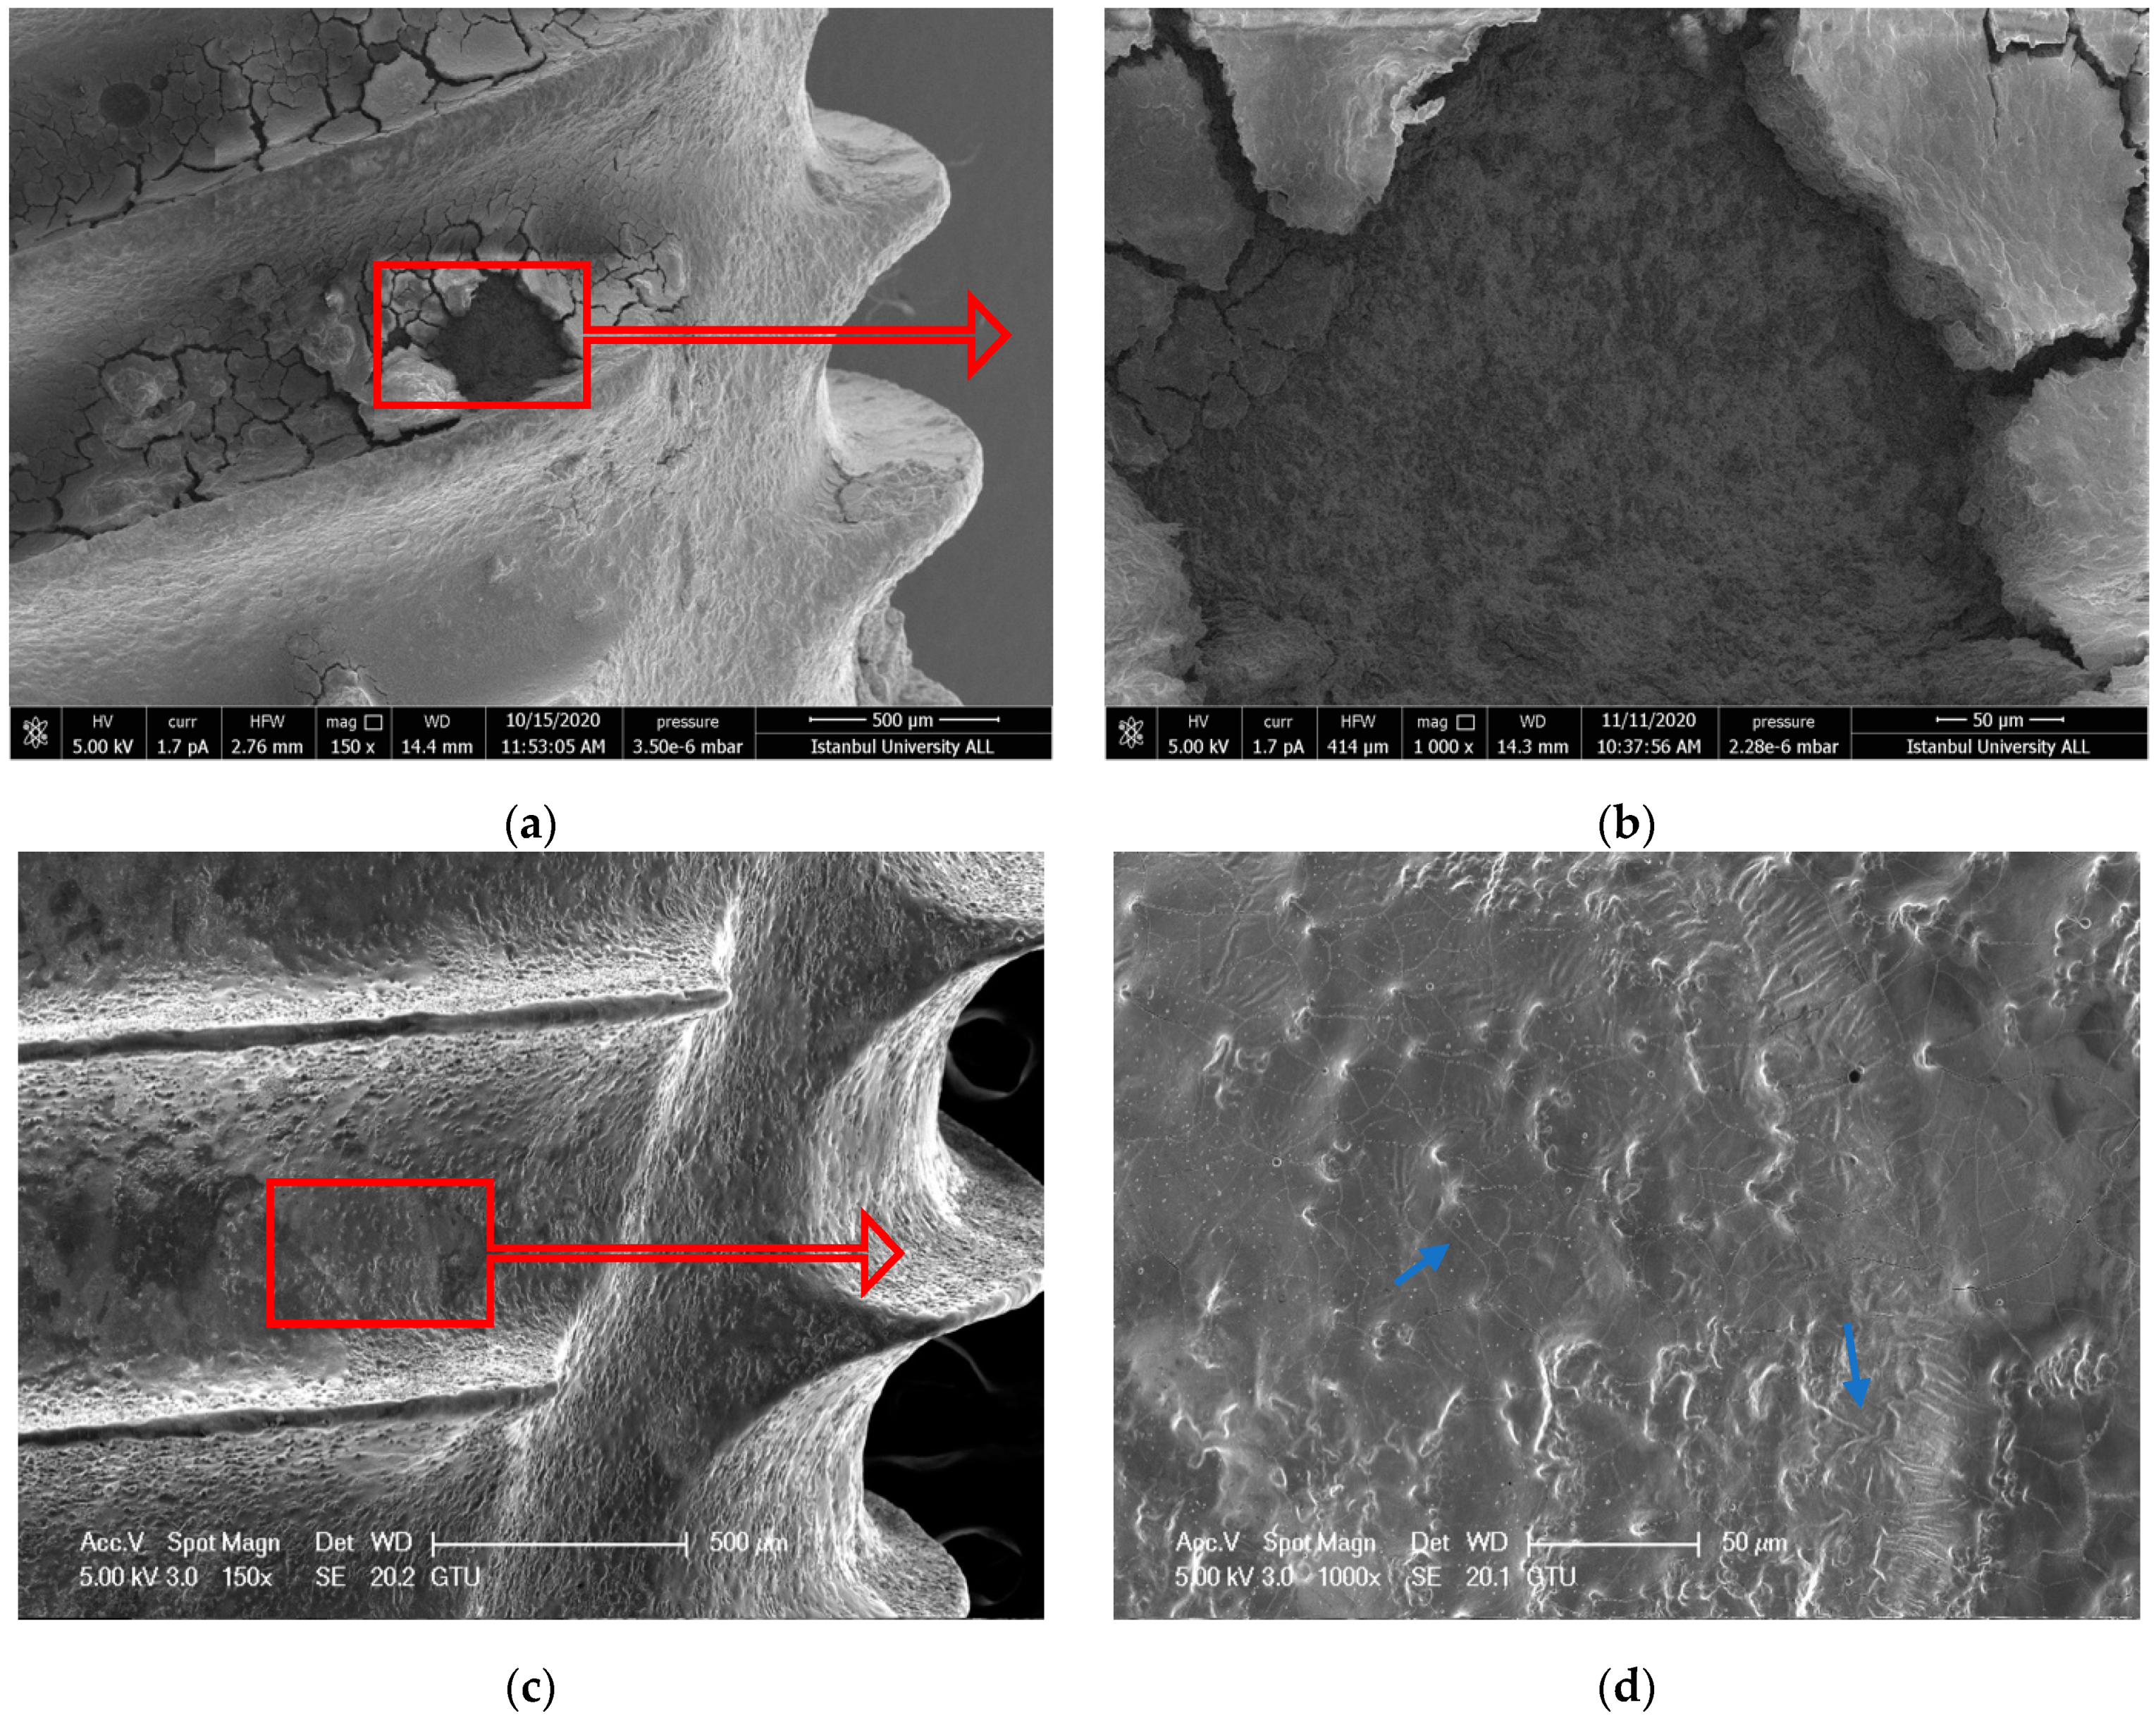
3.1.3. ErL-VSP Group
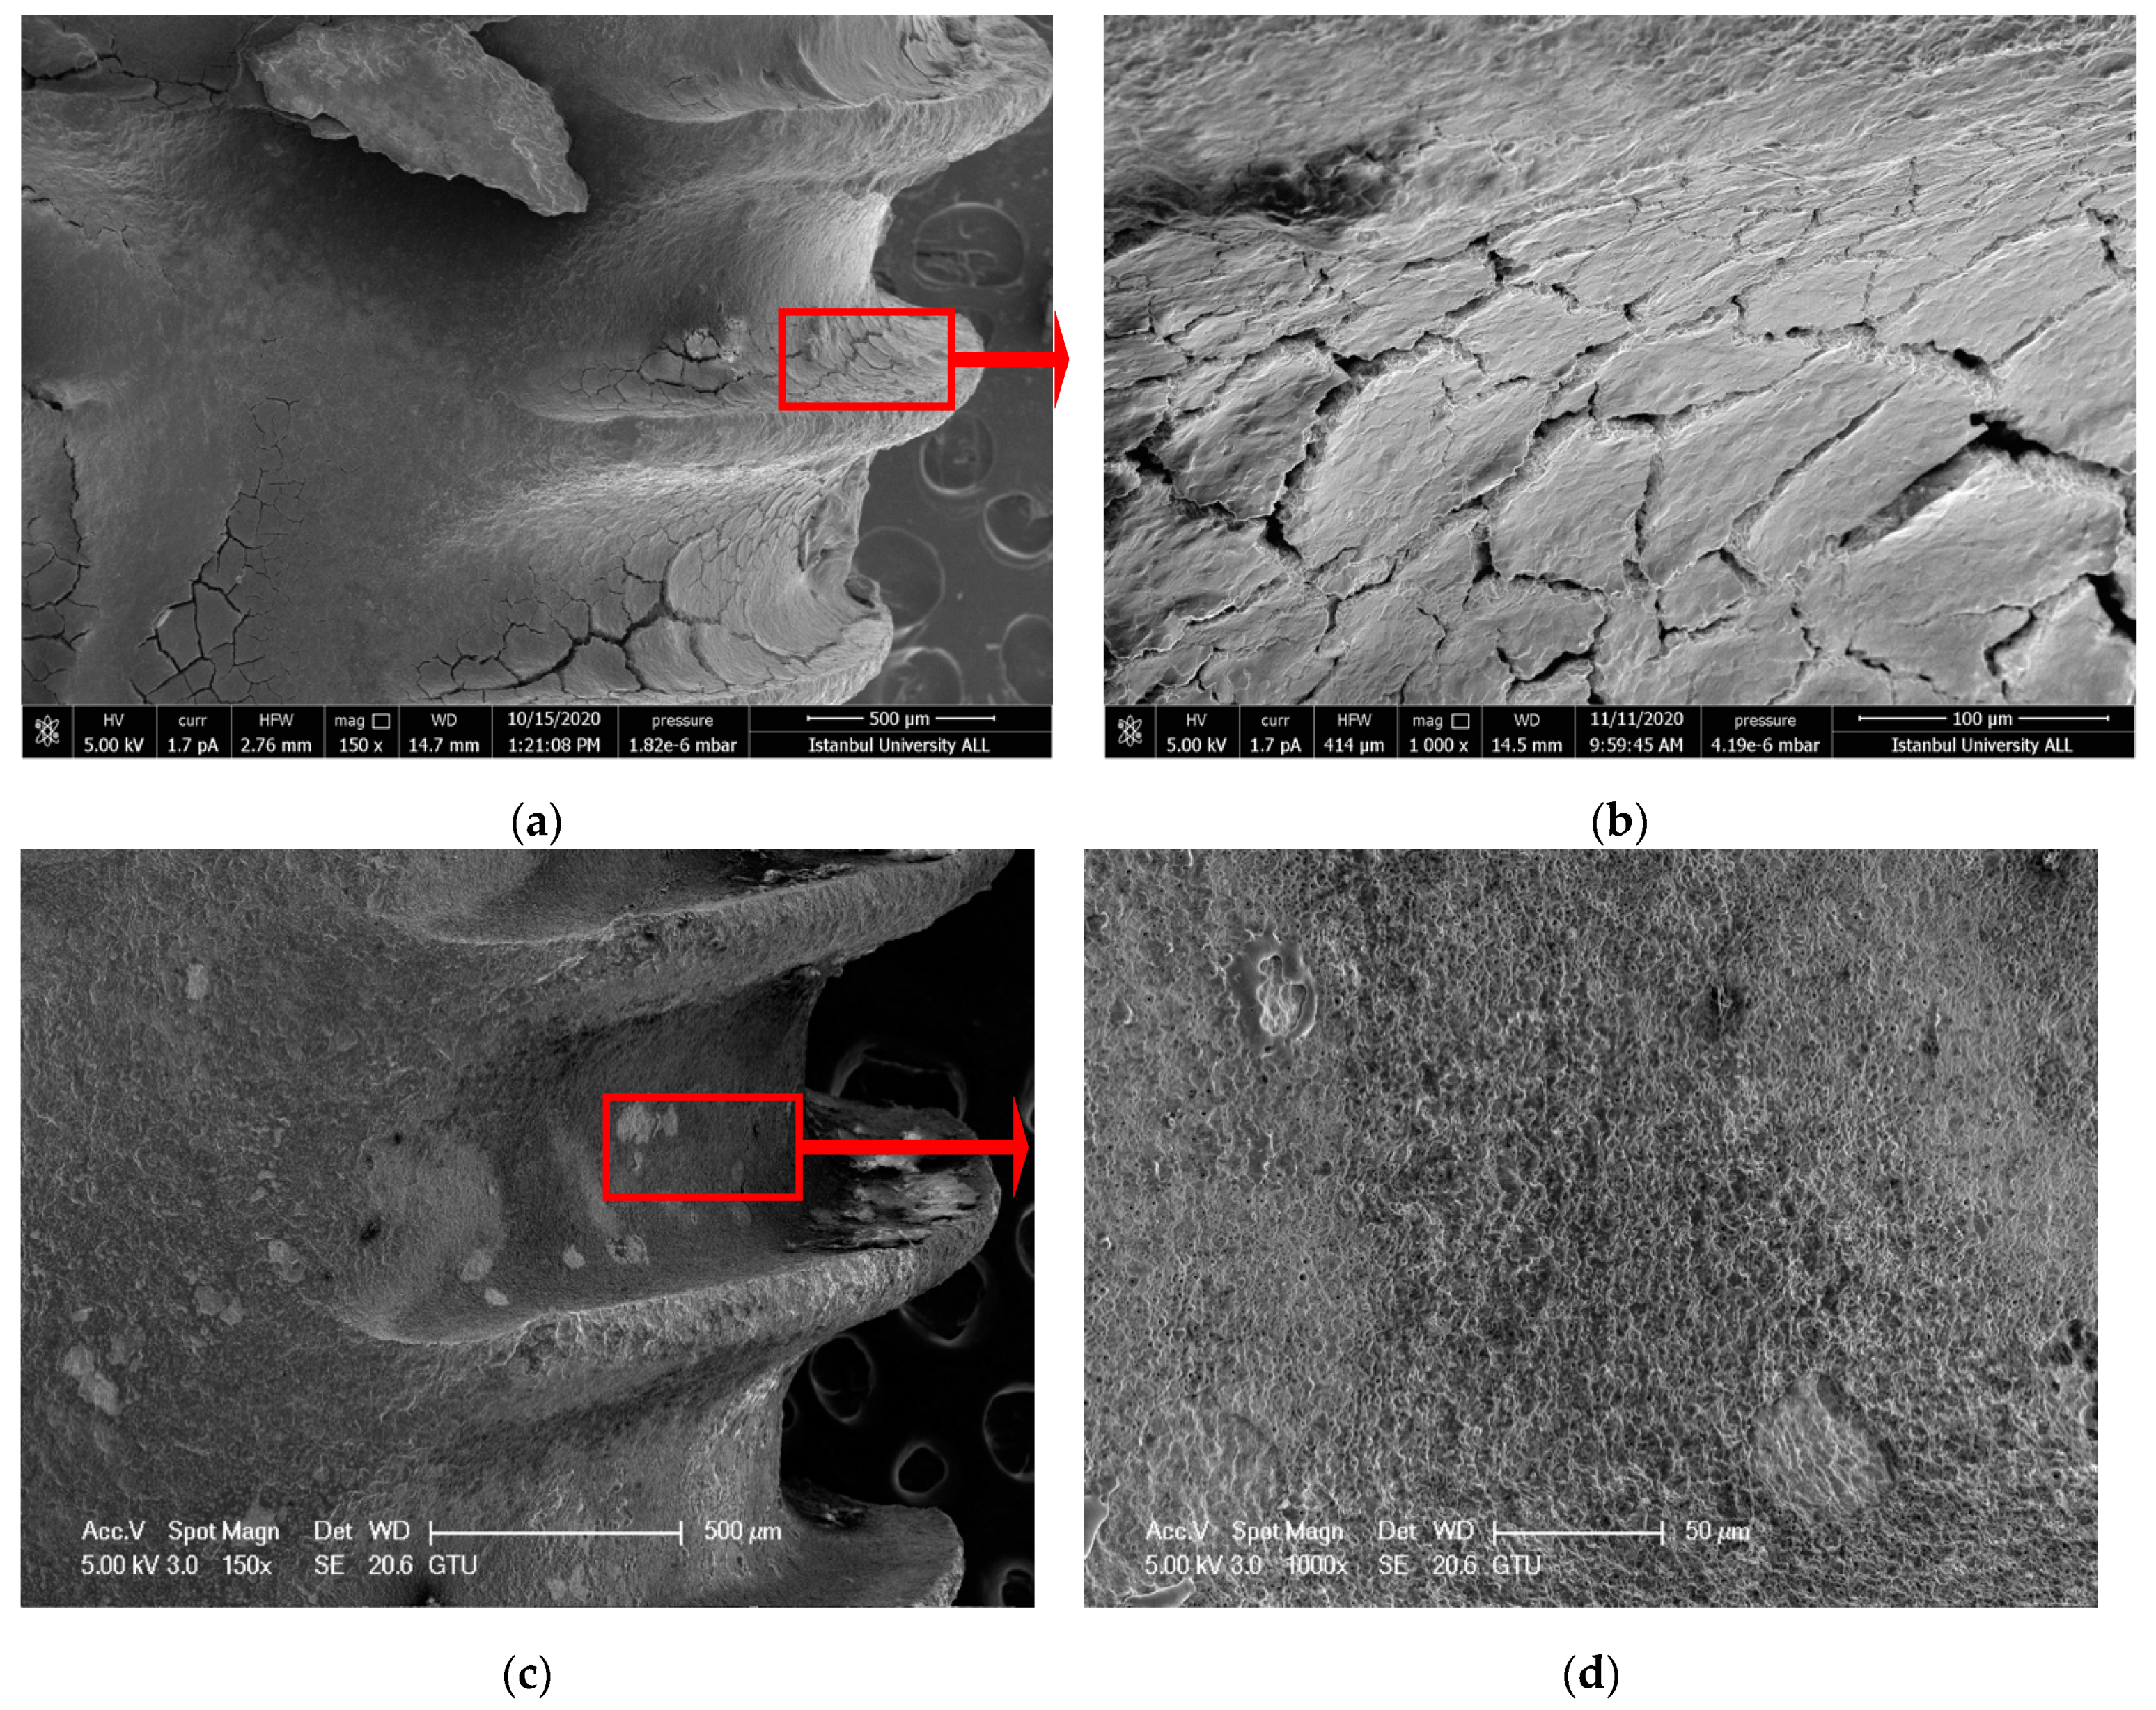
3.1.4. ErL-SP Group
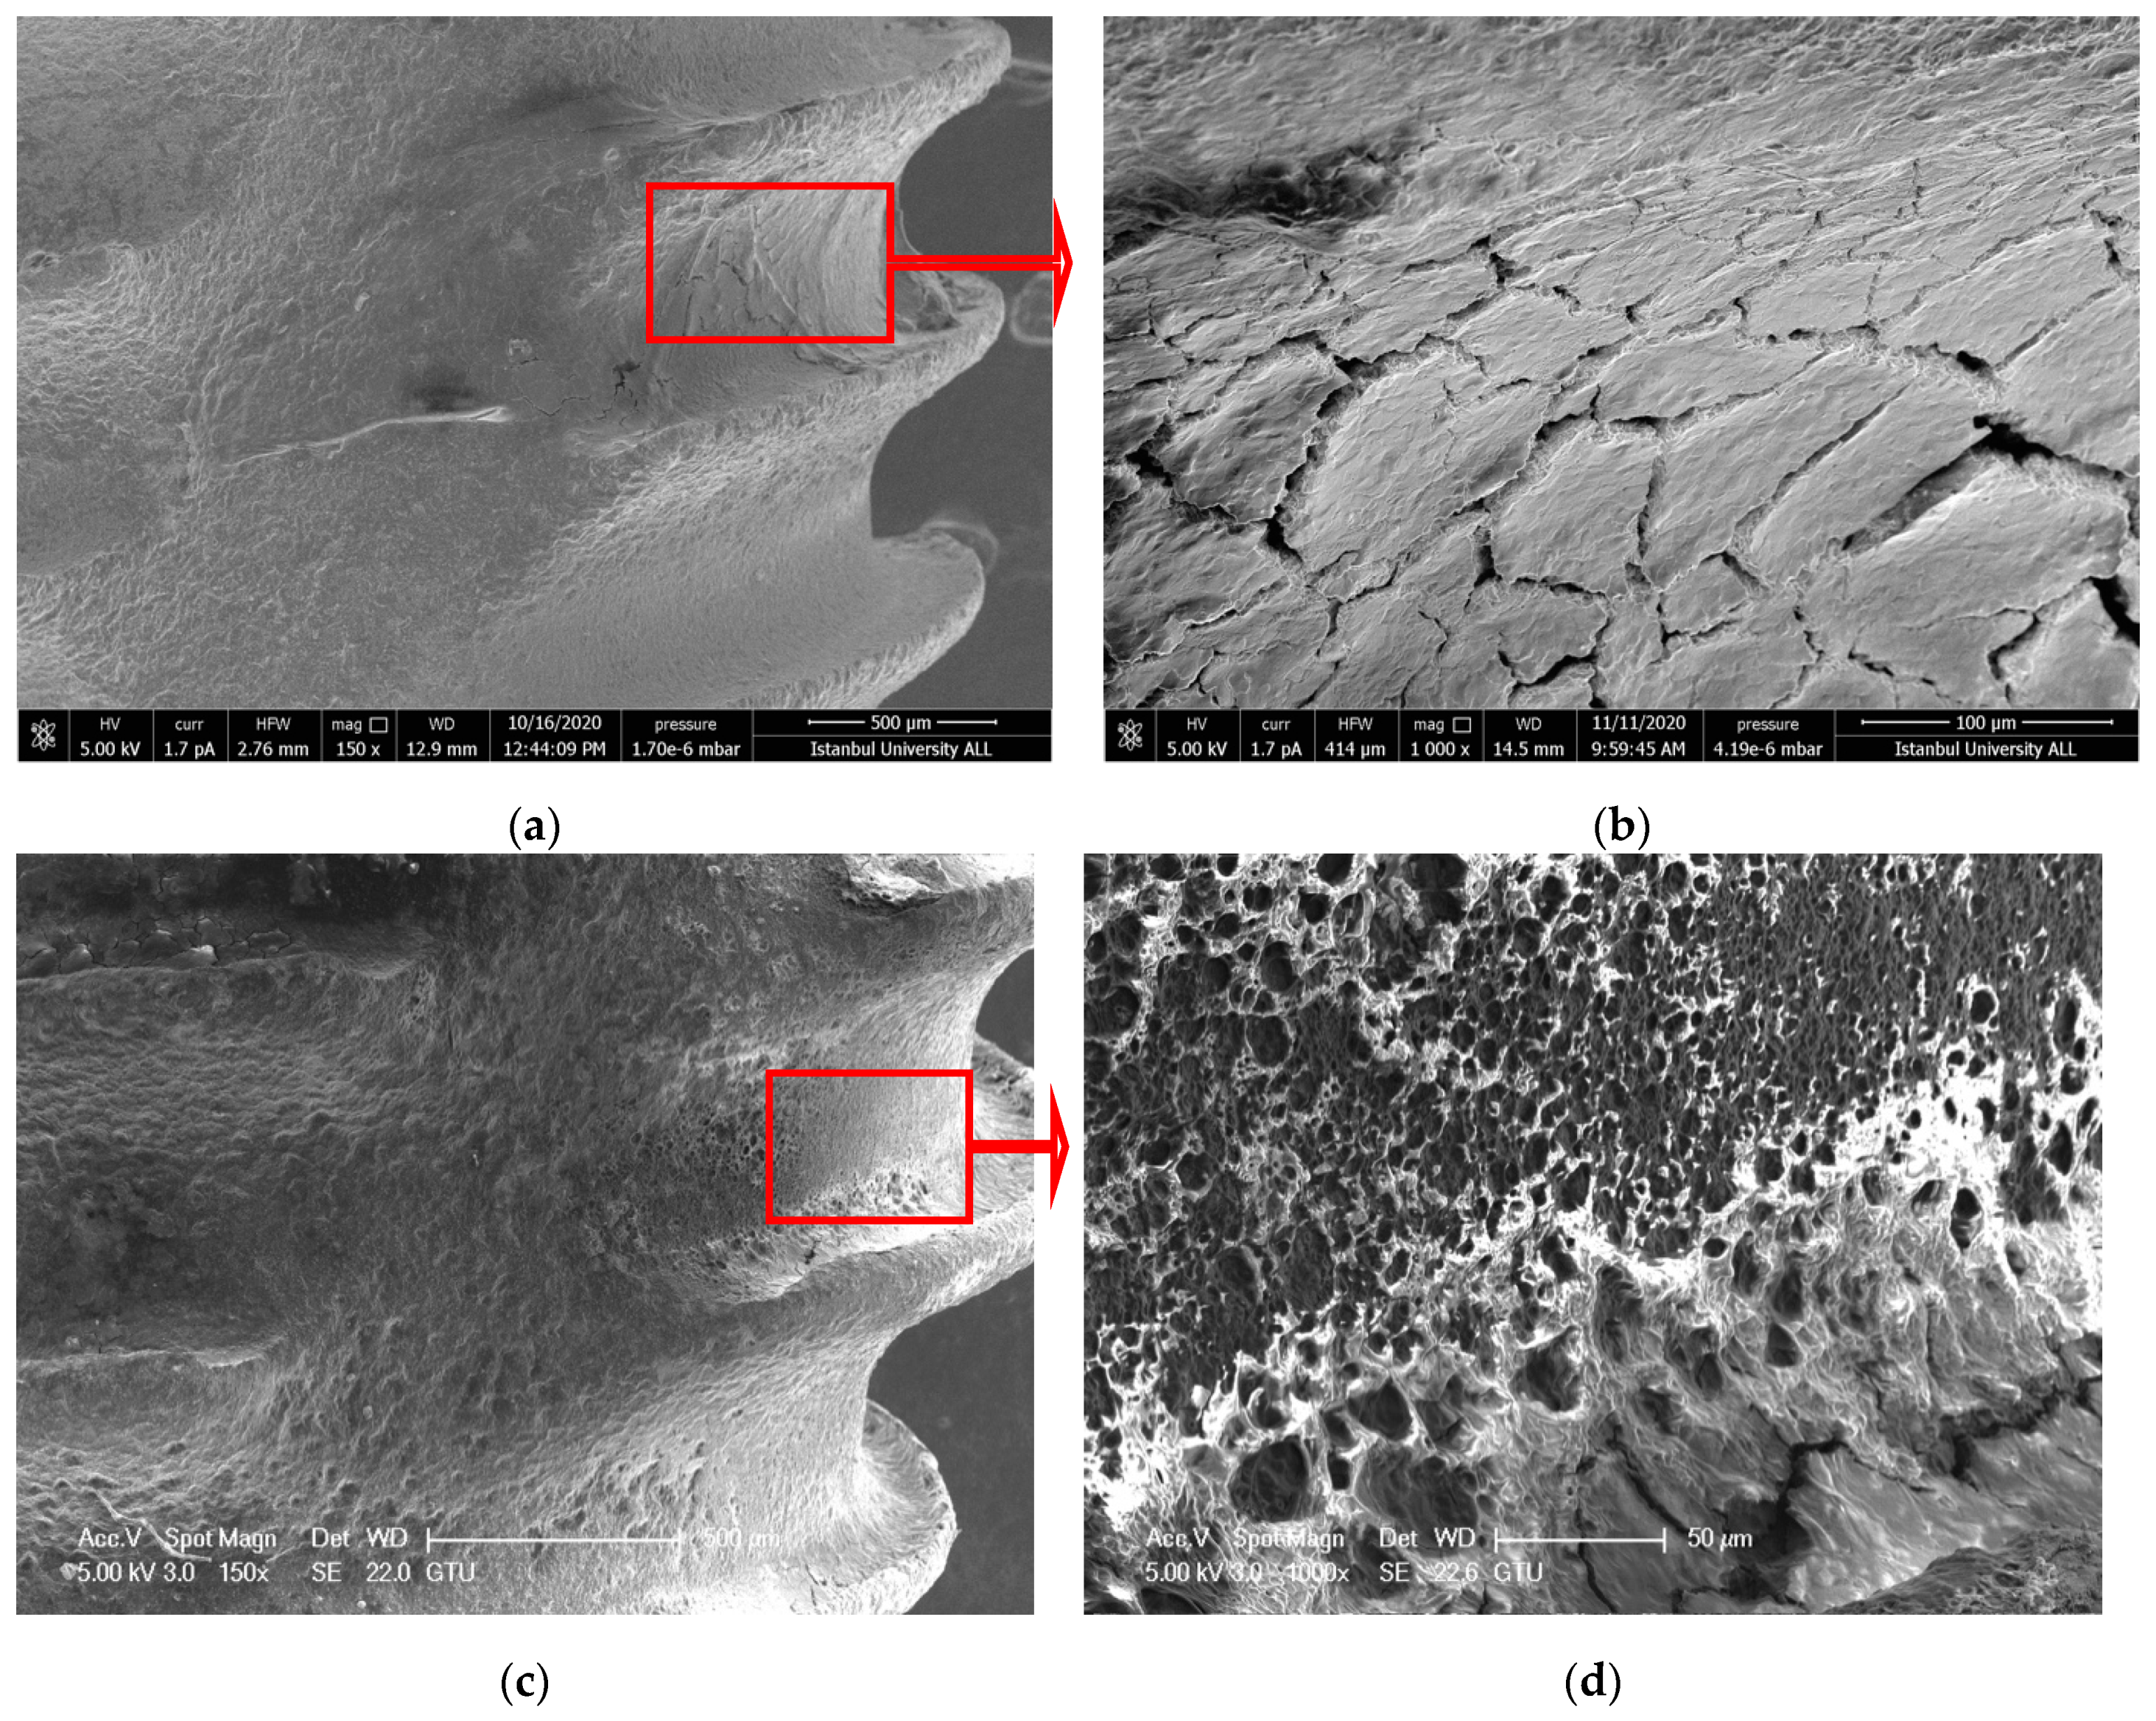
3.1.5. ErL-LP Group
3.1.6. ErCrL-1 Group
3.1.7. ErCrL-2 Group
3.1.8. Control Group
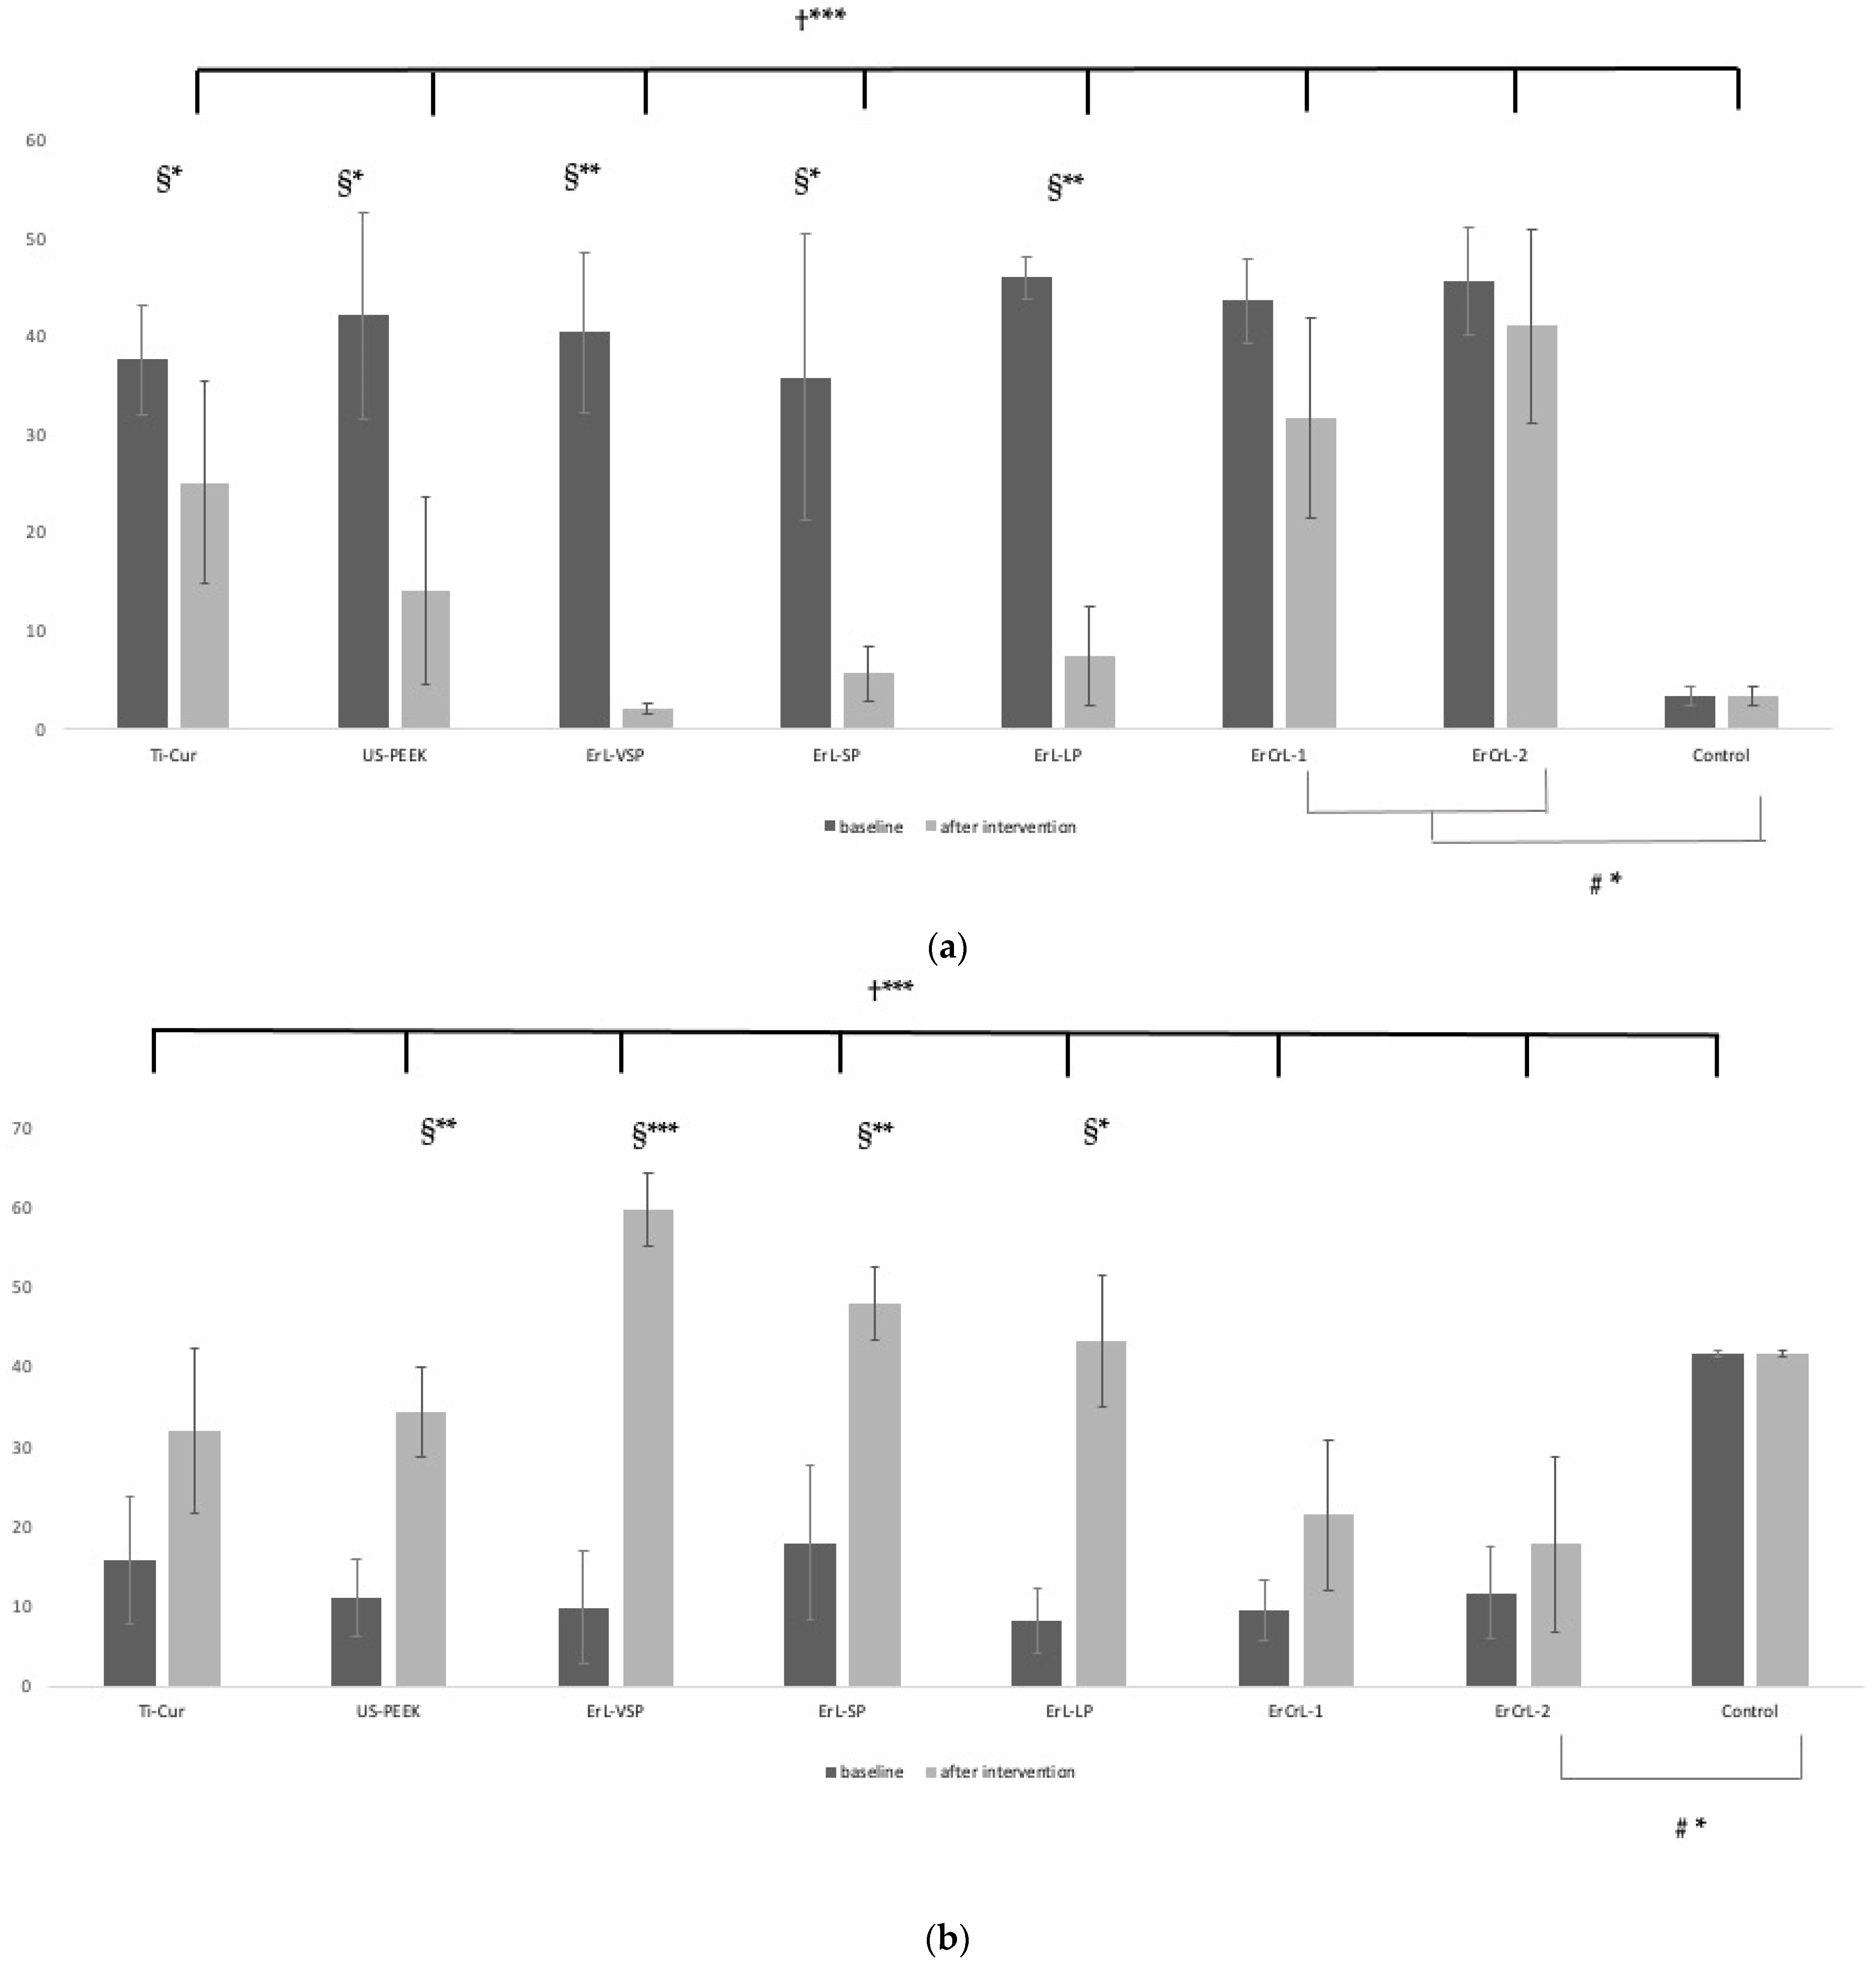
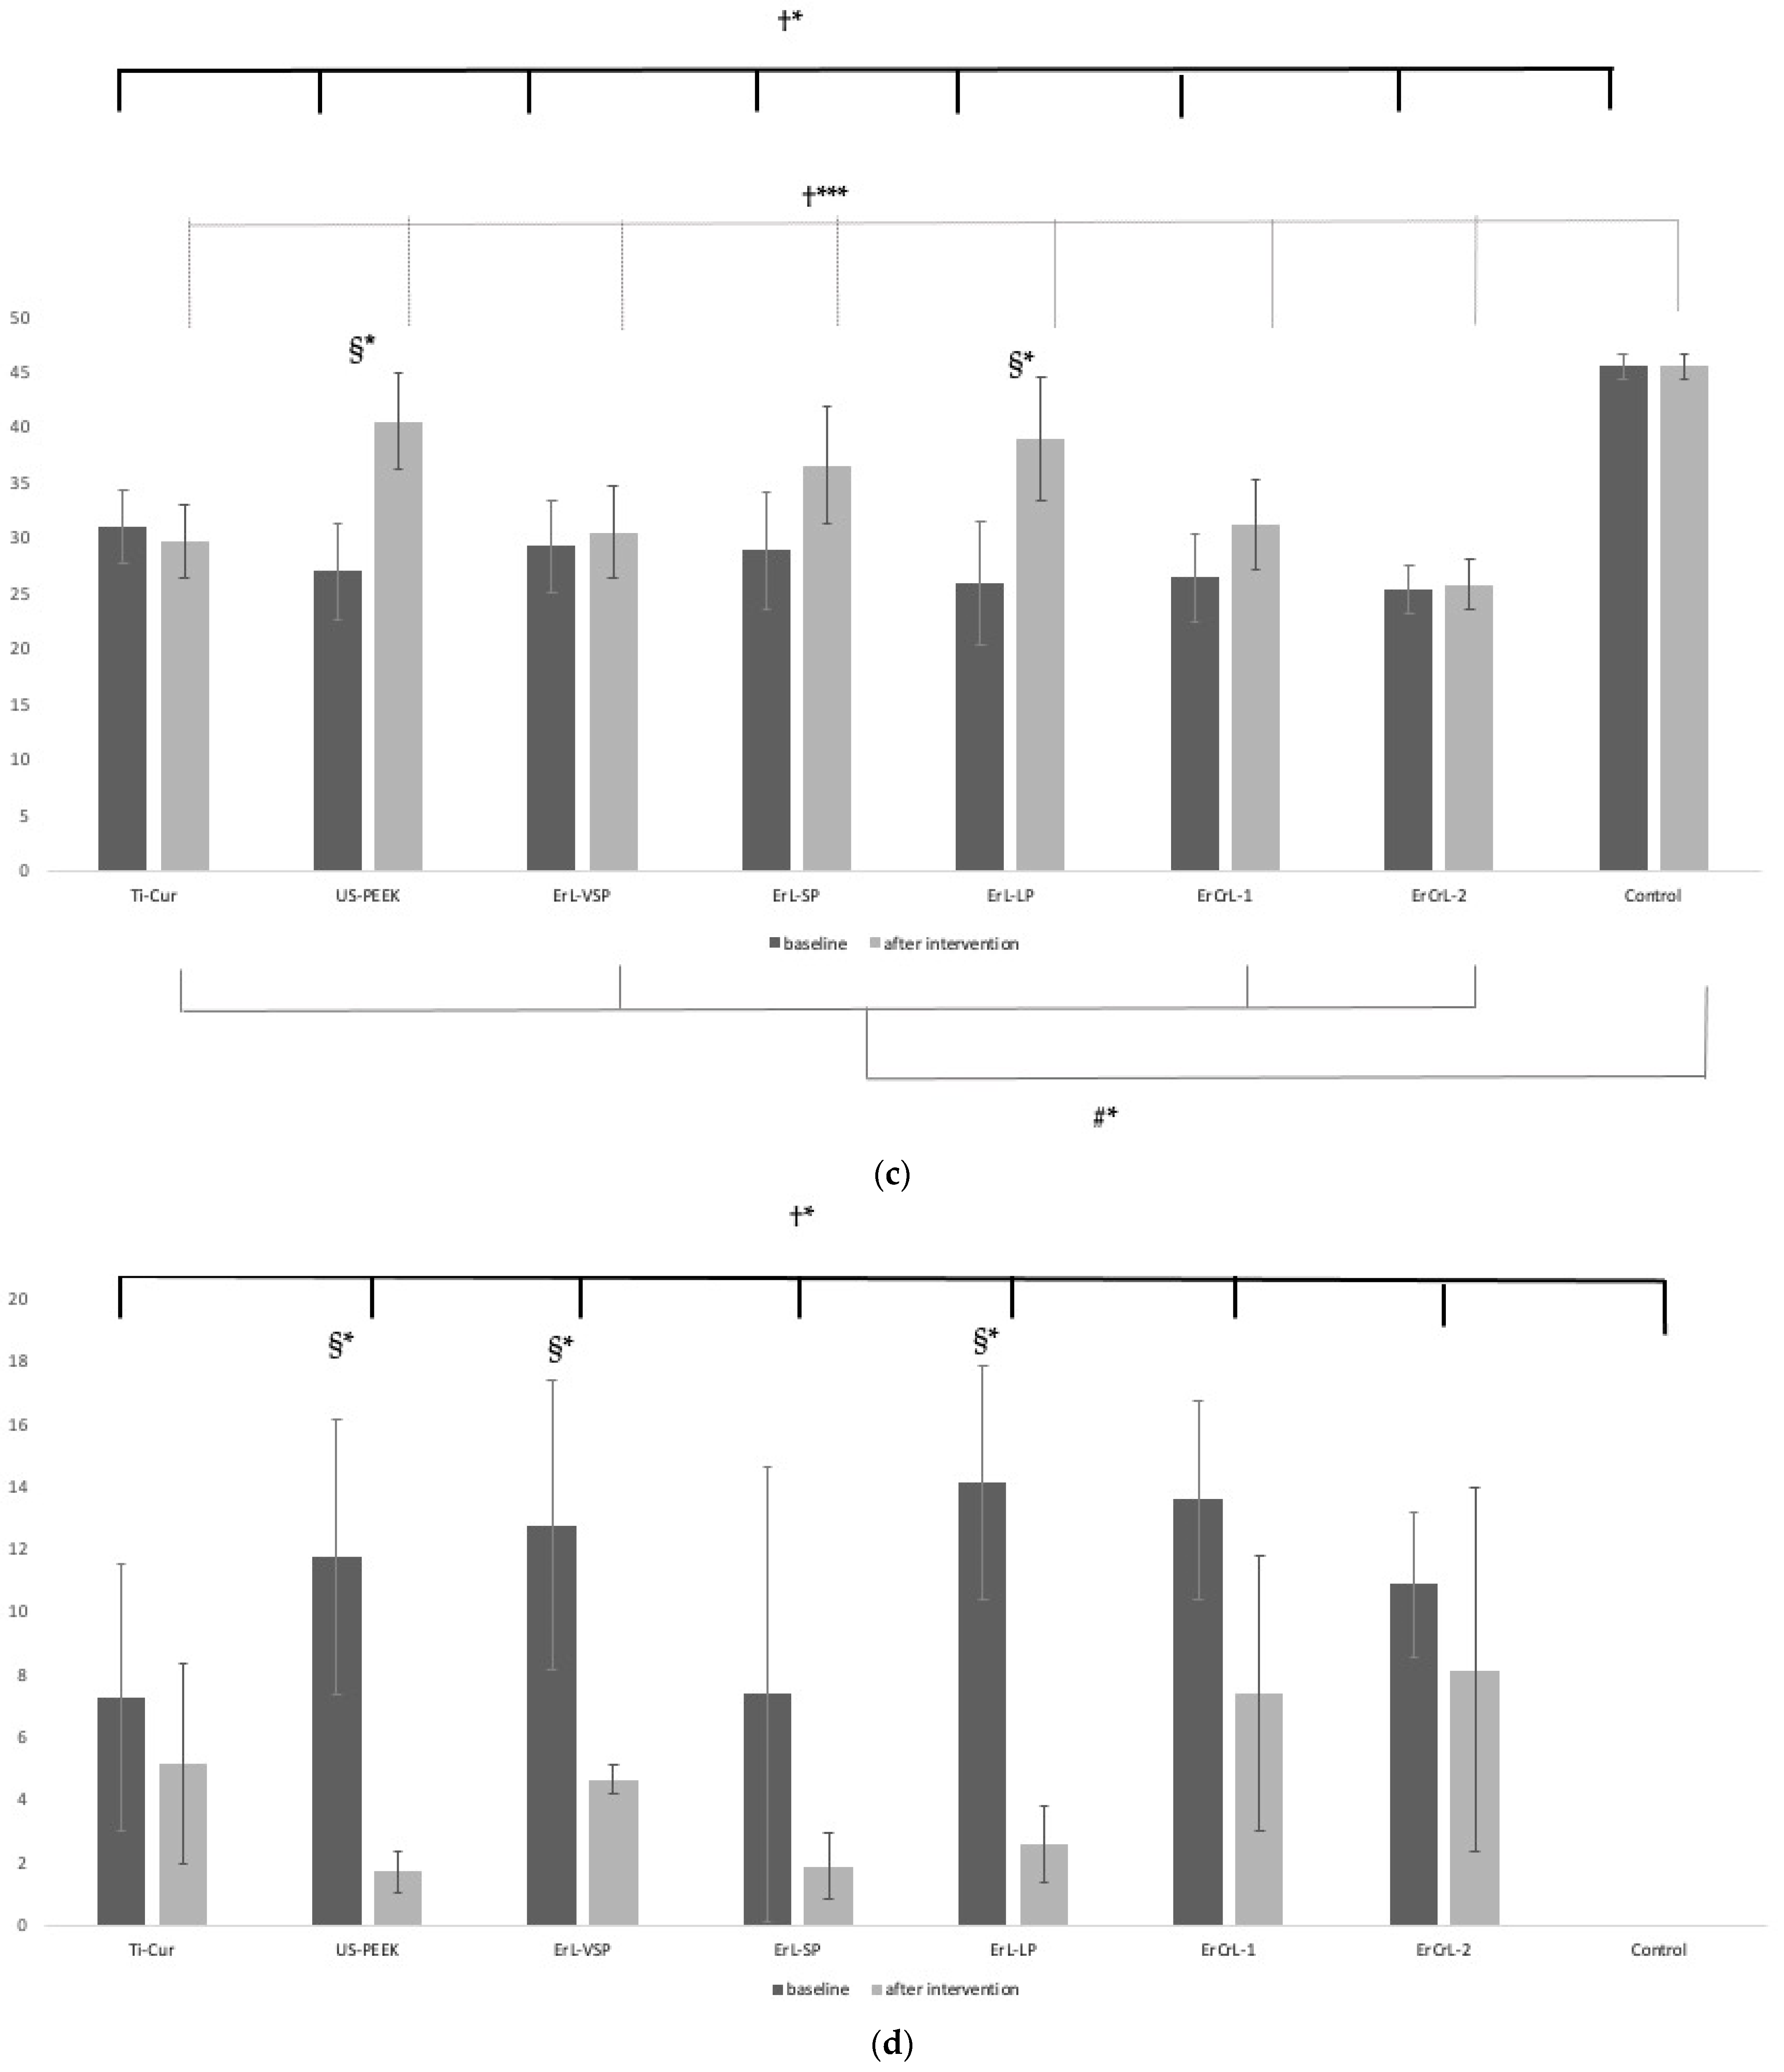
3.2. EDX Analysis
3.3. Profilometry Analysis
4. Discussion
5. Conclusions
Author Contributions
Funding
Institutional Review Board Statement
Data Availability Statement
Acknowledgments
Conflicts of Interest
References
- Lindhe, J.; Meyle, J.; Group D of European Workshop on Periodontology. Peri-implant diseases: Consensus Report of the Sixth European Workshop on Periodontology. J. Clin. Periodontol. 2008, 35, 282–285. [Google Scholar] [CrossRef] [PubMed] [Green Version]
- Natto, Z.S.; Aladmawy, M.; Levi, P.A., Jr.; Wang, H.L. Comparison of the efficacy of different types of lasers for the treatment of peri-implantitis: A systematic review. Int. J. Oral Maxillofac. Implant. 2015, 30, 338–345. [Google Scholar] [CrossRef] [PubMed] [Green Version]
- Zitzmann, N.U.; Berglundh, T. Definition and prevalence of peri-implant diseases. J. Clin. Periodontol. 2008, 35, 286–291. [Google Scholar] [CrossRef] [PubMed]
- Albrektsson, T.; Isidor, F. Consensus Report of Session IV. In Proceedings of the First European Workshop on Periodontology; Lang, N.P., Karring, T., Eds.; Quintessence Publishing: London, UK, 1994; pp. 365–369. [Google Scholar]
- Schwarz, F.; Rothamel, D.; Sculean, A.; Georg, T.; Scherbaum, W.; Becker, J. Effects of an Er:YAG laser and the Vector ultrasonic system on the biocompatibility of titanium implants in cultures of human osteoblast-like cells. Clin. Oral Implant. Res. 2003, 14, 784–792. [Google Scholar] [CrossRef]
- Mombelli, A.; Décaillet, F. The characteristics of biofilms in peri-implant disease. J. Clin. Periodontol. 2011, 38 (Suppl. 11), 203–213. [Google Scholar] [CrossRef] [Green Version]
- Berglundh, T.; Armitage, G.; Araujo, M.G.; Avila-Ortiz, G.; Blanco, J.; Camargo, P.M.; Chen, S.; Cochran, D.; Derks, J.; Figuero, E.; et al. Peri-implant diseases and conditions: Consensus report of workgroup 4 of the 2017 World Workshop on the Classification of Periodontal and Peri-Implant Diseases and Conditions. J. Clin. Periodontol. 2018, 45 (Suppl. 20), S286–S291. [Google Scholar] [CrossRef] [Green Version]
- Trino, L.D.; Bronze-Uhle, E.S.; Ramachandran, A.; Lisboa-Filho, P.N.; Mathew, M.T.; George, A. Titanium surface bio-functionalization using osteogenic peptides: Surface chemistry, biocompatibility, corrosion and tribocorrosion aspects. J. Mech. Behav. Biomed. Mater. 2018, 81, 26–38. [Google Scholar] [CrossRef] [PubMed] [Green Version]
- Mombelli, A.; Lang, N.P. Antimicrobial treatment of peri-implant infections. Clin. Oral Implant. Res. 1992, 3, 162–168. [Google Scholar] [CrossRef]
- Renvert, S.; Roos-Jansåker, A.M.; Claffey, N. Non-surgical treatment of peri-implant mucositis and peri-implantitis: A literature review. J. Clin. Periodontol. 2008, 35, 305–315. [Google Scholar] [CrossRef] [PubMed]
- Trejo, P.M.; Bonaventura, G.; Weng, D.; Caffesse, R.G.; Bragger, U.; Lang, N.P. Effect of mechanical and antiseptic therapy on peri-implant mucositis: An experimental study in monkeys. Clin. Oral Implant. Res. 2006, 17, 294–304. [Google Scholar] [CrossRef] [PubMed]
- Berglundh, T.; Zitzmann, N.U.; Donati, M. Are peri-implantitis lesions different from periodontitis lesions? J. Clin. Periodontol. 2011, 38 (Suppl. 11), 188–202. [Google Scholar] [CrossRef]
- Heitz-Mayfield, L.J.; Lang, N.P. Comparative biology of chronic and aggressive periodontitis vs. peri-implantitis. Periodontol. 2000 2010, 53, 167–181. [Google Scholar] [CrossRef]
- Renvert, S.; Lindahl, C.; Roos Jansåker, A.-M.; Persson, G.R. Treatment of peri-implantitis using an Er:YAG laser or an air-abrasive device: A randomized clinical trial. J. Clin. Periodontol. 2011, 38, 65–73. [Google Scholar] [CrossRef]
- Subramani, K.; Wismeijer, D. Decontamination of titanium implant surface and re-osseointegration to treat peri-implantitis: A literature review. Int. J. Oral Maxillofac. Implant. 2012, 27, 1043–1054. [Google Scholar]
- Fox, S.C.; Moriarty, J.D.; Kusy, R.P. The effects of scaling a titanium implant surface with metal and plastic instruments: An in vitro study. J. Periodontol. 1990, 61, 485–490. [Google Scholar] [CrossRef] [PubMed]
- London, R.M.; Roberts, F.A.; Baker, D.A.; Rohrer, M.D.; O’Neal, R.B. Histologic comparison of a thermal dual-etched implant surface to machined, TPS, and HA surfaces: Bone contact in vivo in rabbits. Int. J. Oral Maxillofac. Implant. 2002, 17, 369–376. [Google Scholar]
- Mengel, R.; Buns, C.E.; Mengel, C.; Flores-de-Jacoby, L. An in vitro study of the treatment of implant surfaces with different instruments. Int. J. Oral Maxillofac. Implant. 1998, 13, 91–96. [Google Scholar]
- Lausmaa, J.; Linder, L. Surface spectroscopic characterization of titanium implants after separation from plastic-embedded tissue. Biomaterials 1988, 9, 277–280. [Google Scholar] [CrossRef]
- Shibli, J.; Vitussi, T.; Garcia, R.; Zenóbio, E.; Tsuzuki, C.; Cassoni, A.; Piattelli, A.; d’Avila, S. Implant Surface Analysis and Microbiologic Evaluation of Failed Implants Retrieved From Smokers. J. Oral Implantol. 2007, 33, 232–238. [Google Scholar] [CrossRef]
- Berglundh, T.; Abrahamsson, I.; Albouy, J.P.; Lindhe, J. Bone healing at implants with a fluoride-modified surface: An experimental study in dogs. Clin. Oral Implant. Res. 2007, 18, 147–152. [Google Scholar] [CrossRef] [PubMed]
- Hayashi, R.; Ueno, T.; Migita, S.; Tsutsumi, Y.; Doi, H.; Ogawa, T.; Hanawa, T.; Wakabayashi, N. Hydrocarbon Deposition Attenuates Osteoblast Activity on Titanium. J. Dent. Res. 2014, 93, 698–703. [Google Scholar] [CrossRef] [PubMed] [Green Version]
- Eick, S.; Meier, I.; Spoerlé, F.; Bender, P.; Aoki, A.; Izumi, Y.; Salvi, G.E.; Sculean, A. In Vitro-Activity of Er:YAG Laser in Comparison with other Treatment Modalities on Biofilm Ablation from Implant and Tooth Surfaces. PLoS ONE 2017, 12, e0171086. [Google Scholar] [CrossRef] [PubMed] [Green Version]
- Koldsland, O.C.; Scheie, A.A.; Aass, A.M. Prevalence of peri-implantitis related to severity of the disease with different degrees of bone loss. J. Periodontol. 2010, 81, 231–238. [Google Scholar] [CrossRef] [PubMed]
- Roos-Jansåker, A.M.; Lindahl, C.; Renvert, H.; Renvert, S. Nine- to fourteen-year follow-up of implant treatment. Part II: Presence of peri-implant lesions. J. Clin. Periodontol. 2006, 33, 290–295. [Google Scholar] [CrossRef]
- Renvert, S.; Polyzois, I.; Claffey, N. Surgical therapy for the control of peri-implantitis. Clin. Oral Implant. Res. 2012, 23 (Suppl. 6), 84–94. [Google Scholar] [CrossRef]
- Romanos, G.E.; Weitz, D. Therapy of peri-implant diseases. Where is the evidence? J. Evid. Based Dent. Pract. 2012, 12, 204–208. [Google Scholar] [CrossRef]
- Mailoa, J.; Lin, G.H.; Chan, H.L.; MacEachern, M.; Wang, H.L. Clinical outcomes of using lasers for peri-implantitis surface detoxification: A systematic review and meta-analysis. J. Periodontol. 2014, 85, 1194–1202. [Google Scholar] [CrossRef]
- Sahrmann, P.; Ronay, V.; Hofer, D.; Attin, T.; Jung, R.E.; Schmidlin, P.R. In vitro cleaning potential of three different implant debridement methods. Clin. Oral Implant. Res. 2015, 26, 314–319. [Google Scholar] [CrossRef]
- Kreisler, M.; Götz, H.; Duschner, H. Effect of Nd:YAG, Ho:YAG, Er:YAG, CO2, and GaAIAs laser irradiation on surface properties of endosseous dental implants. Int. J. Oral Maxillofac. Implant. 2002, 17, 202–211. [Google Scholar]
- Schwarz, F.; Nuesry, E.; Bieling, K.; Herten, M.; Becker, J. Influence of an erbium, chromium-doped yttrium, scandium, gallium, and garnet (Er,Cr:YSGG) laser on the reestablishment of the biocompatibility of contaminated titanium implant surfaces. J. Periodontol. 2006, 77, 1820–1827. [Google Scholar] [CrossRef]
- Taniguchi, Y.; Aoki, A.; Mizutani, K.; Takeuchi, Y.; Ichinose, S.; Takasaki, A.A.; Schwarz, F.; Izumi, Y. Optimal Er:YAG laser irradiation parameters for debridement of microstructured fixture surfaces of titanium dental implants. Lasers Med. Sci. 2013, 28, 1057–1068. [Google Scholar] [CrossRef]
- Walsh, J.T., Jr.; Cummings, J.P. Effect of the dynamic optical properties of water on midinfrared laser ablation. Lasers Surg. Med. 1994, 15, 295–305. [Google Scholar] [CrossRef]
- Kamel, M.S.; Khosa, A.; Tawse-Smith, A.; Leichter, J. The use of laser therapy for dental implant surface decontamination: A narrative review of in vitro studies. Lasers Med. Sci. 2014, 29, 1977–1985. [Google Scholar] [CrossRef]
- Al-Hashedi, A.A.; Laurenti, M.; Benhamou, V.; Tamimi, F. Decontamination of titanium implants using physical methods. Clin. Oral Implant. Res. 2017, 28, 1013–1021. [Google Scholar] [CrossRef]
- Matsuyama, T.; Aoki, A.; Oda, S.; Yoneyama, T.; Ishikawa, I. Effects of the Er:YAG laser irradiation on titanium implant materials and contaminated implant abutment surfaces. J. Clin. Laser Med. Surg. 2003, 21, 7–17. [Google Scholar] [CrossRef]
- Nejem Wakim, R.; Namour, M.; Nguyen, H.V.; Peremans, A.; Zeinoun, T.; Vanheusden, A.; Rompen, E.; Nammour, S. Decontamination of Dental Implant Surfaces by the Er:YAG Laser Beam: A Comparative in Vitro Study of Various Protocols. Dent. J. 2018, 6, 66. [Google Scholar] [CrossRef] [PubMed] [Green Version]
- Clem, D.; Heard, R.; McGuire, M.; Scheyer, E.T.; Richardson, C.; Toback, G.; Gwaltney, C.; Gunsolley, J.C. Comparison of Er,Cr:YSGG laser to minimally invasive surgical technique in the treatment of intrabony defects: Six-month results of a multicenter, randomized, controlled study. J. Periodontol. 2021, 92, 496–506. [Google Scholar] [CrossRef] [PubMed]
- Lee, J.-B.; Jo, Y.-H.; Choi, J.-Y.; Seol, Y.-J.; Lee, Y.-M.; Ku, Y.; Rhyu, I.-C.; Yeo, I.-S.L. The Effect of Ultraviolet Photofunctionalization on a Titanium Dental Implant with Machined Surface: An In Vitro and In Vivo Study. Materials 2019, 12, 2078. [Google Scholar] [CrossRef] [PubMed] [Green Version]
- Namour, M.; Verspecht, T.; El Mobadder, M.; Teughels, W.; Peremans, A.; Nammour, S.; Rompen, E. Q-Switch Nd:YAG Laser-Assisted Elimination of Multi-Species Biofilm on Titanium Surfaces. Materials 2020, 13, 1573. [Google Scholar] [CrossRef] [PubMed] [Green Version]
- Yao, W.L.; Lin, J.C.Y.; Salamanca, E.; Pan, Y.H.; Tsai, P.Y.; Leu, S.J.; Yang, K.C.; Huang, H.M.; Huang, H.Y.; Chang, W.J. Er,Cr:YSGG Laser Performance Improves Biological Response on Titanium Surfaces. Materials 2020, 13, 756. [Google Scholar] [CrossRef] [PubMed] [Green Version]
- Hakki, S.S.; Tatar, G.; Dundar, N.; Demiralp, B. The effect of different cleaning methods on the surface and temperature of failed titanium implants: An in vitro study. Lasers Med. Sci. 2017, 32, 563–571. [Google Scholar] [CrossRef]
- Scarano, A.; Sinjari, B.; Di Iorio, D.; Murmura, G.; Carinci, F.; Lauritano, D. Surface analysis of failed oral titanium implants after irradiated with ErCR:YSGG 2780 laser. Eur. J. Inflamm. 2012, 10, 49–54. [Google Scholar]
- Takagi, T.; Aoki, A.; Ichinose, S.; Taniguchi, Y.; Tachikawa, N.; Shinoki, T.; Meinzer, W.; Sculean, A.; Izumi, Y. Effective removal of calcified deposits on microstructured titanium fixture surfaces of dental implants with erbium lasers. J. Periodontol. 2018, 89, 680–690. [Google Scholar] [CrossRef]
- Scarano, A.; Lorusso, F.; Inchingolo, F.; Postiglione, F.; Petrini, M. The Effects of Erbium-Doped Yttrium Aluminum Garnet Laser (Er: YAG) Irradiation on Sandblasted and Acid-Etched (SLA) Titanium, an In Vitro Study. Materials 2020, 13, 4174. [Google Scholar] [CrossRef] [PubMed]
- Textor, M.S., C.; Frauchiger, V.; Tosatti, S.; Brunette, D.M. Properties and Biological Significance of Natural Oxide Films on Titanium and Its Alloys. In Titanium in Medicine; Springer: Berlin/Heidelberg, Germany, 2001; pp. 171–230. [Google Scholar]
- Harrel, S.K.; Wilson, T.G., Jr.; Pandya, M.; Diekwisch, T.G.H. Titanium particles generated during ultrasonic scaling of implants. J. Periodontol. 2019, 90, 241–246. [Google Scholar] [CrossRef] [PubMed]


| Groups | Instruments | Parameters |
|---|---|---|
| Ti-Cur (n = 4) | Titanium curette 1 | 120 s |
| US-PEEK (n = 4) | Ultrasonic scaler 2 with PEEK 3 tip | 120 s |
| ErL-VSP (n = 4) | ER:YAG laser 4 with R02-C | VSP (100 µs); 120 mJ/pulse; 10 Hz; Air 6 Water 4; 120 s; 19.04 J/cm2 |
| ErL-SP (n = 4) | ER:YAG laser 4 with R02-C | SP (300 µs); 120 mJ/pulse; 10 Hz; Air 6 Water 4; 120 s; 19.04 J/cm2 |
| ErL-LP (n = 4) | ER:YAG laser 4 with R02-C | LP (600 µs); 120 mJ/pulse; 10 Hz; Air 6 Water 4; 120 s; 19.04 J/cm2 |
| ErCrL-1 (n = 4) | Er,Cr:YSGG laser 5 with RFPT5 14 mm fiber tip | 1 W, 10 Hz (100 mJ/pulse); Air 40 Water 50; 120 s; 38.46 J/cm2 |
| ErCrL-2 (n = 4) | Er,Cr:YSGG laser 5 with RFPT5 14 mm fiber tip | 1.5 W, 30 Hz (50 mJ/pulse); Air 40 Water 50; 120 s; 19.23 J/cm2 |
| Control (n = 2) | No intervention was made on the implants |
| Group | O1: DR/DnR | O2: DR/DnR | O3: DR/DnR |
|---|---|---|---|
| Ti-Cur | 0/4 | 1/3 | 1/3 |
| US-PEEK | 3/1 | 3/1 | 3/1 |
| ErL VSP | 4/0 | 4/0 | 4/0 |
| ErL SP | 4/0 | 4/0 | 3/1 |
| ErL LP | 4/0 | 4/0 | 4/0 |
| ErCrL-1 | 1/3 | 2/2 | 1/3 |
| ErCrL-2 | 2/2 | 2/2 | 2/2 |
Publisher’s Note: MDPI stays neutral with regard to jurisdictional claims in published maps and institutional affiliations. |
© 2021 by the authors. Licensee MDPI, Basel, Switzerland. This article is an open access article distributed under the terms and conditions of the Creative Commons Attribution (CC BY) license (https://creativecommons.org/licenses/by/4.0/).
Share and Cite
Secgin-Atar, A.; Aykol-Sahin, G.; Kocak-Oztug, N.A.; Yalcin, F.; Gokbuget, A.; Baser, U. Evaluation of Surface Change and Roughness in Implants Lost Due to Peri-Implantitis Using Erbium Laser and Various Methods: An In Vitro Study. Nanomaterials 2021, 11, 2602. https://0-doi-org.brum.beds.ac.uk/10.3390/nano11102602
Secgin-Atar A, Aykol-Sahin G, Kocak-Oztug NA, Yalcin F, Gokbuget A, Baser U. Evaluation of Surface Change and Roughness in Implants Lost Due to Peri-Implantitis Using Erbium Laser and Various Methods: An In Vitro Study. Nanomaterials. 2021; 11(10):2602. https://0-doi-org.brum.beds.ac.uk/10.3390/nano11102602
Chicago/Turabian StyleSecgin-Atar, Aslihan, Gokce Aykol-Sahin, Necla Asli Kocak-Oztug, Funda Yalcin, Aslan Gokbuget, and Ulku Baser. 2021. "Evaluation of Surface Change and Roughness in Implants Lost Due to Peri-Implantitis Using Erbium Laser and Various Methods: An In Vitro Study" Nanomaterials 11, no. 10: 2602. https://0-doi-org.brum.beds.ac.uk/10.3390/nano11102602