
Time-Dependent Density Functional Theory Calculations of N- and S-Doped TiO2 Nanotube for Water-Splitting Applications

 ,
, 
Abstract
:1. Introduction
2. Computational Details
3. Results and Discussion
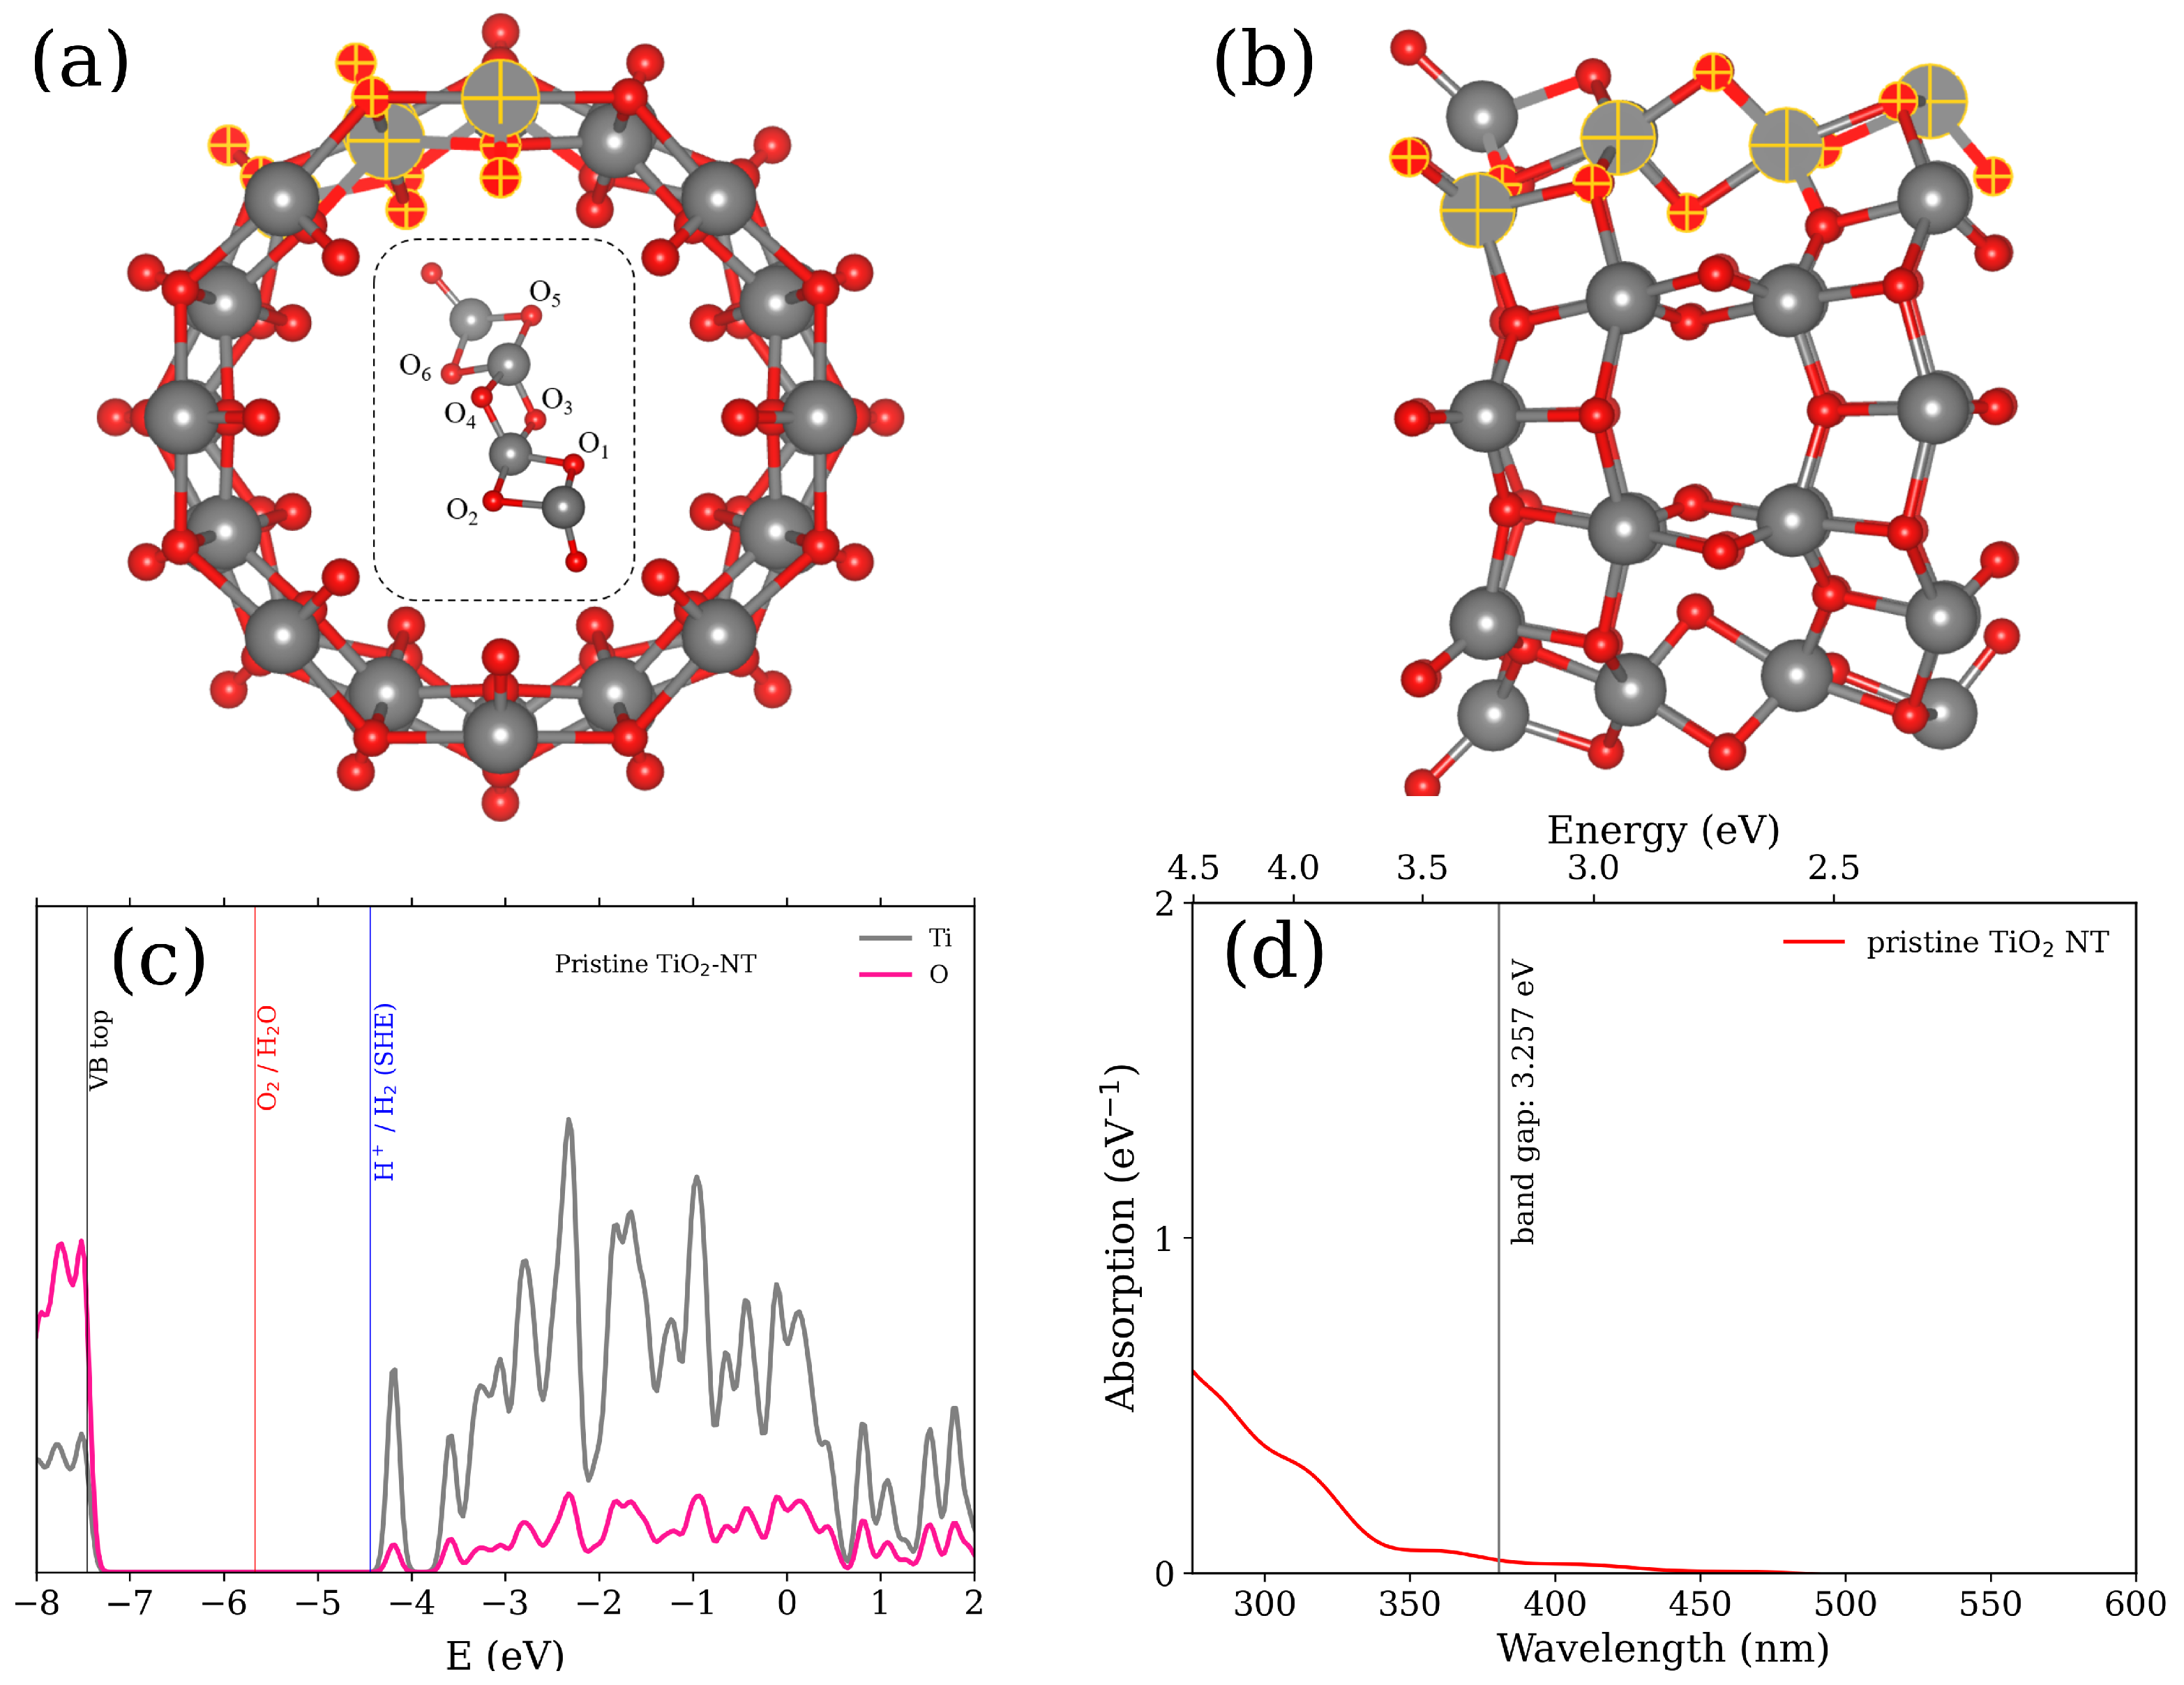
3.1. Pristine TiO NT
3.2. N- and S-Doped TiO NT
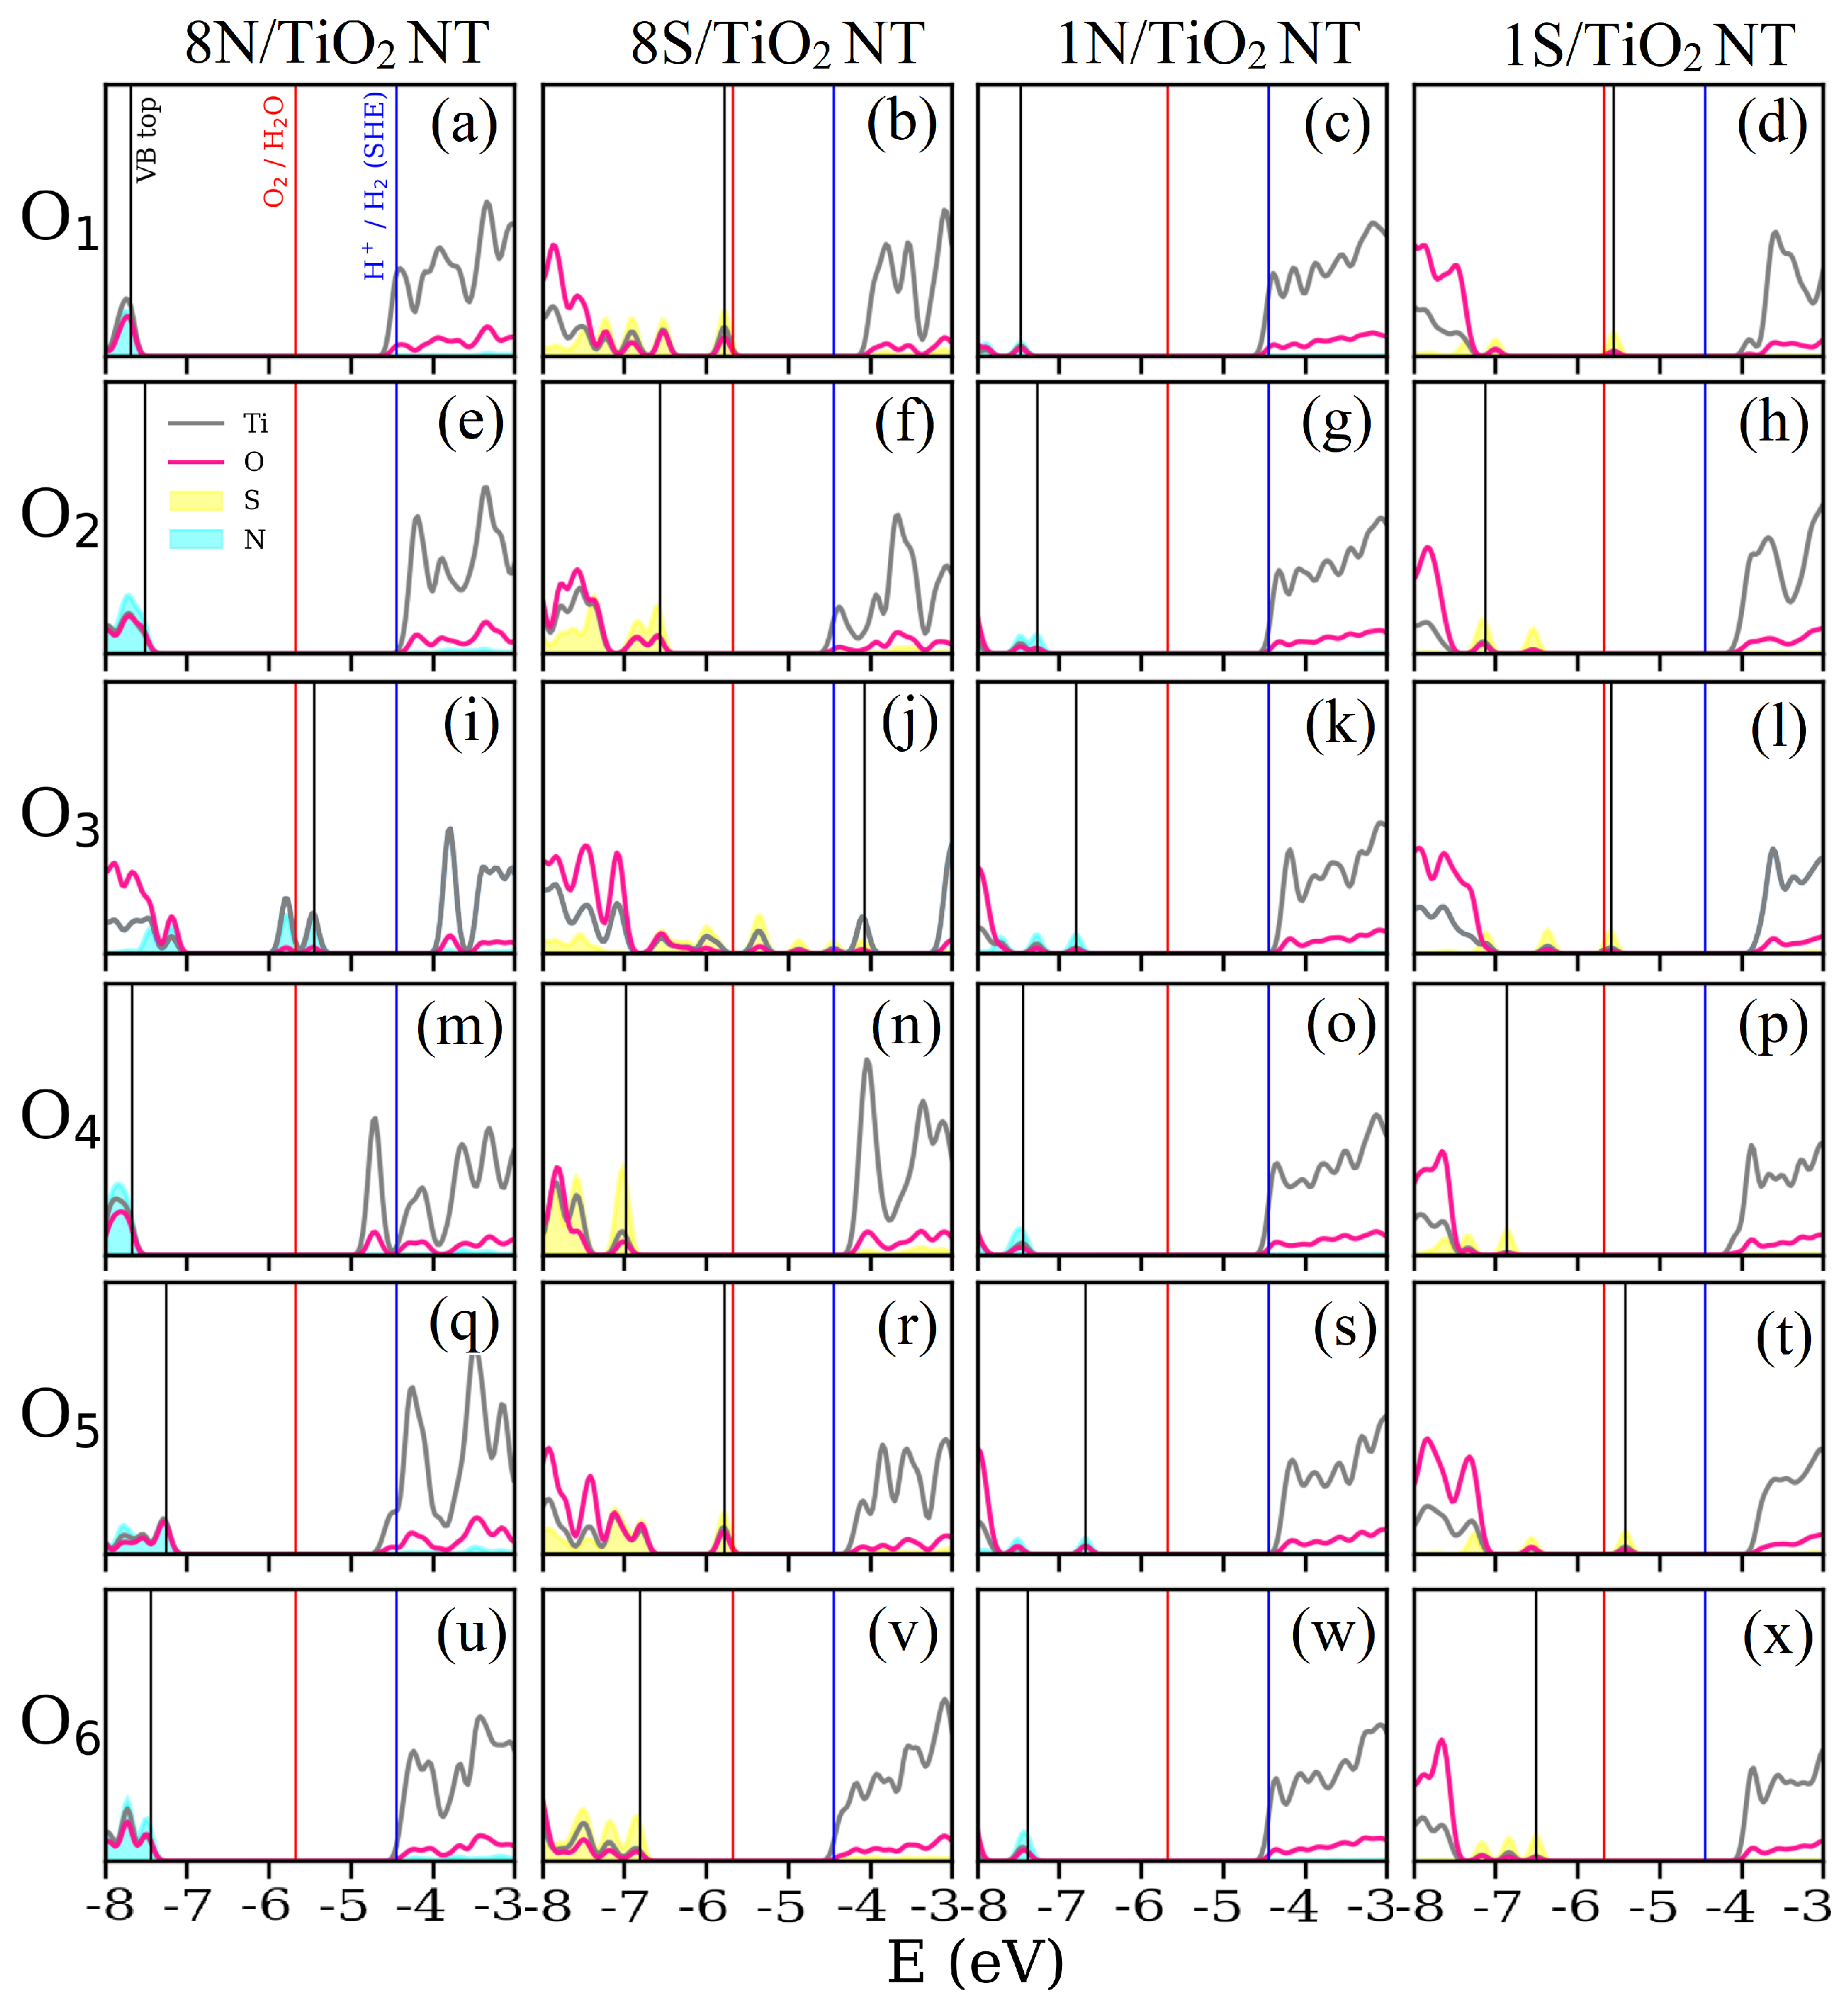
3.2.1. Ground State
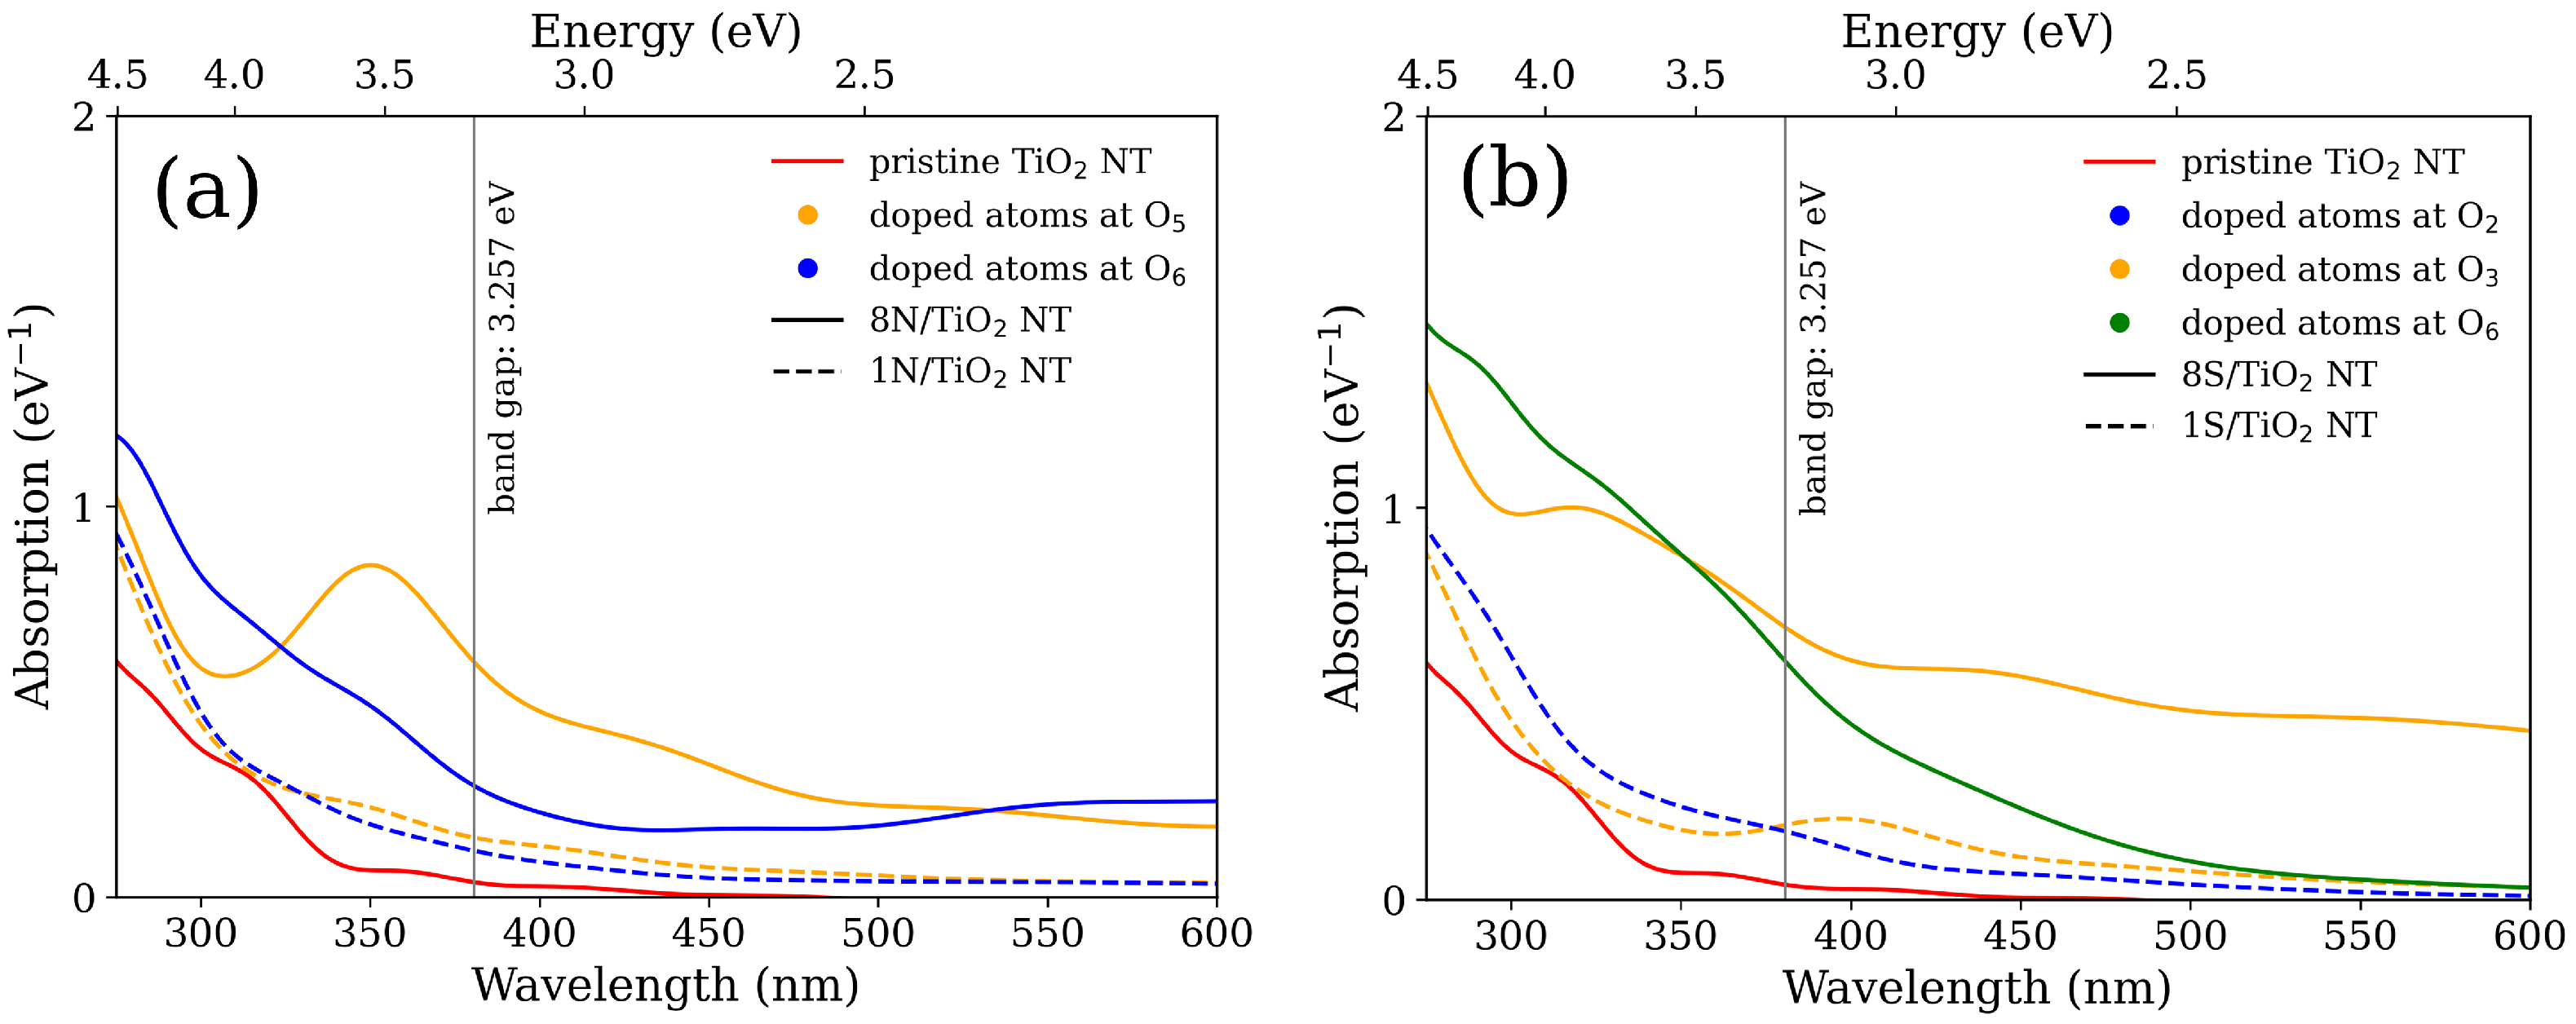
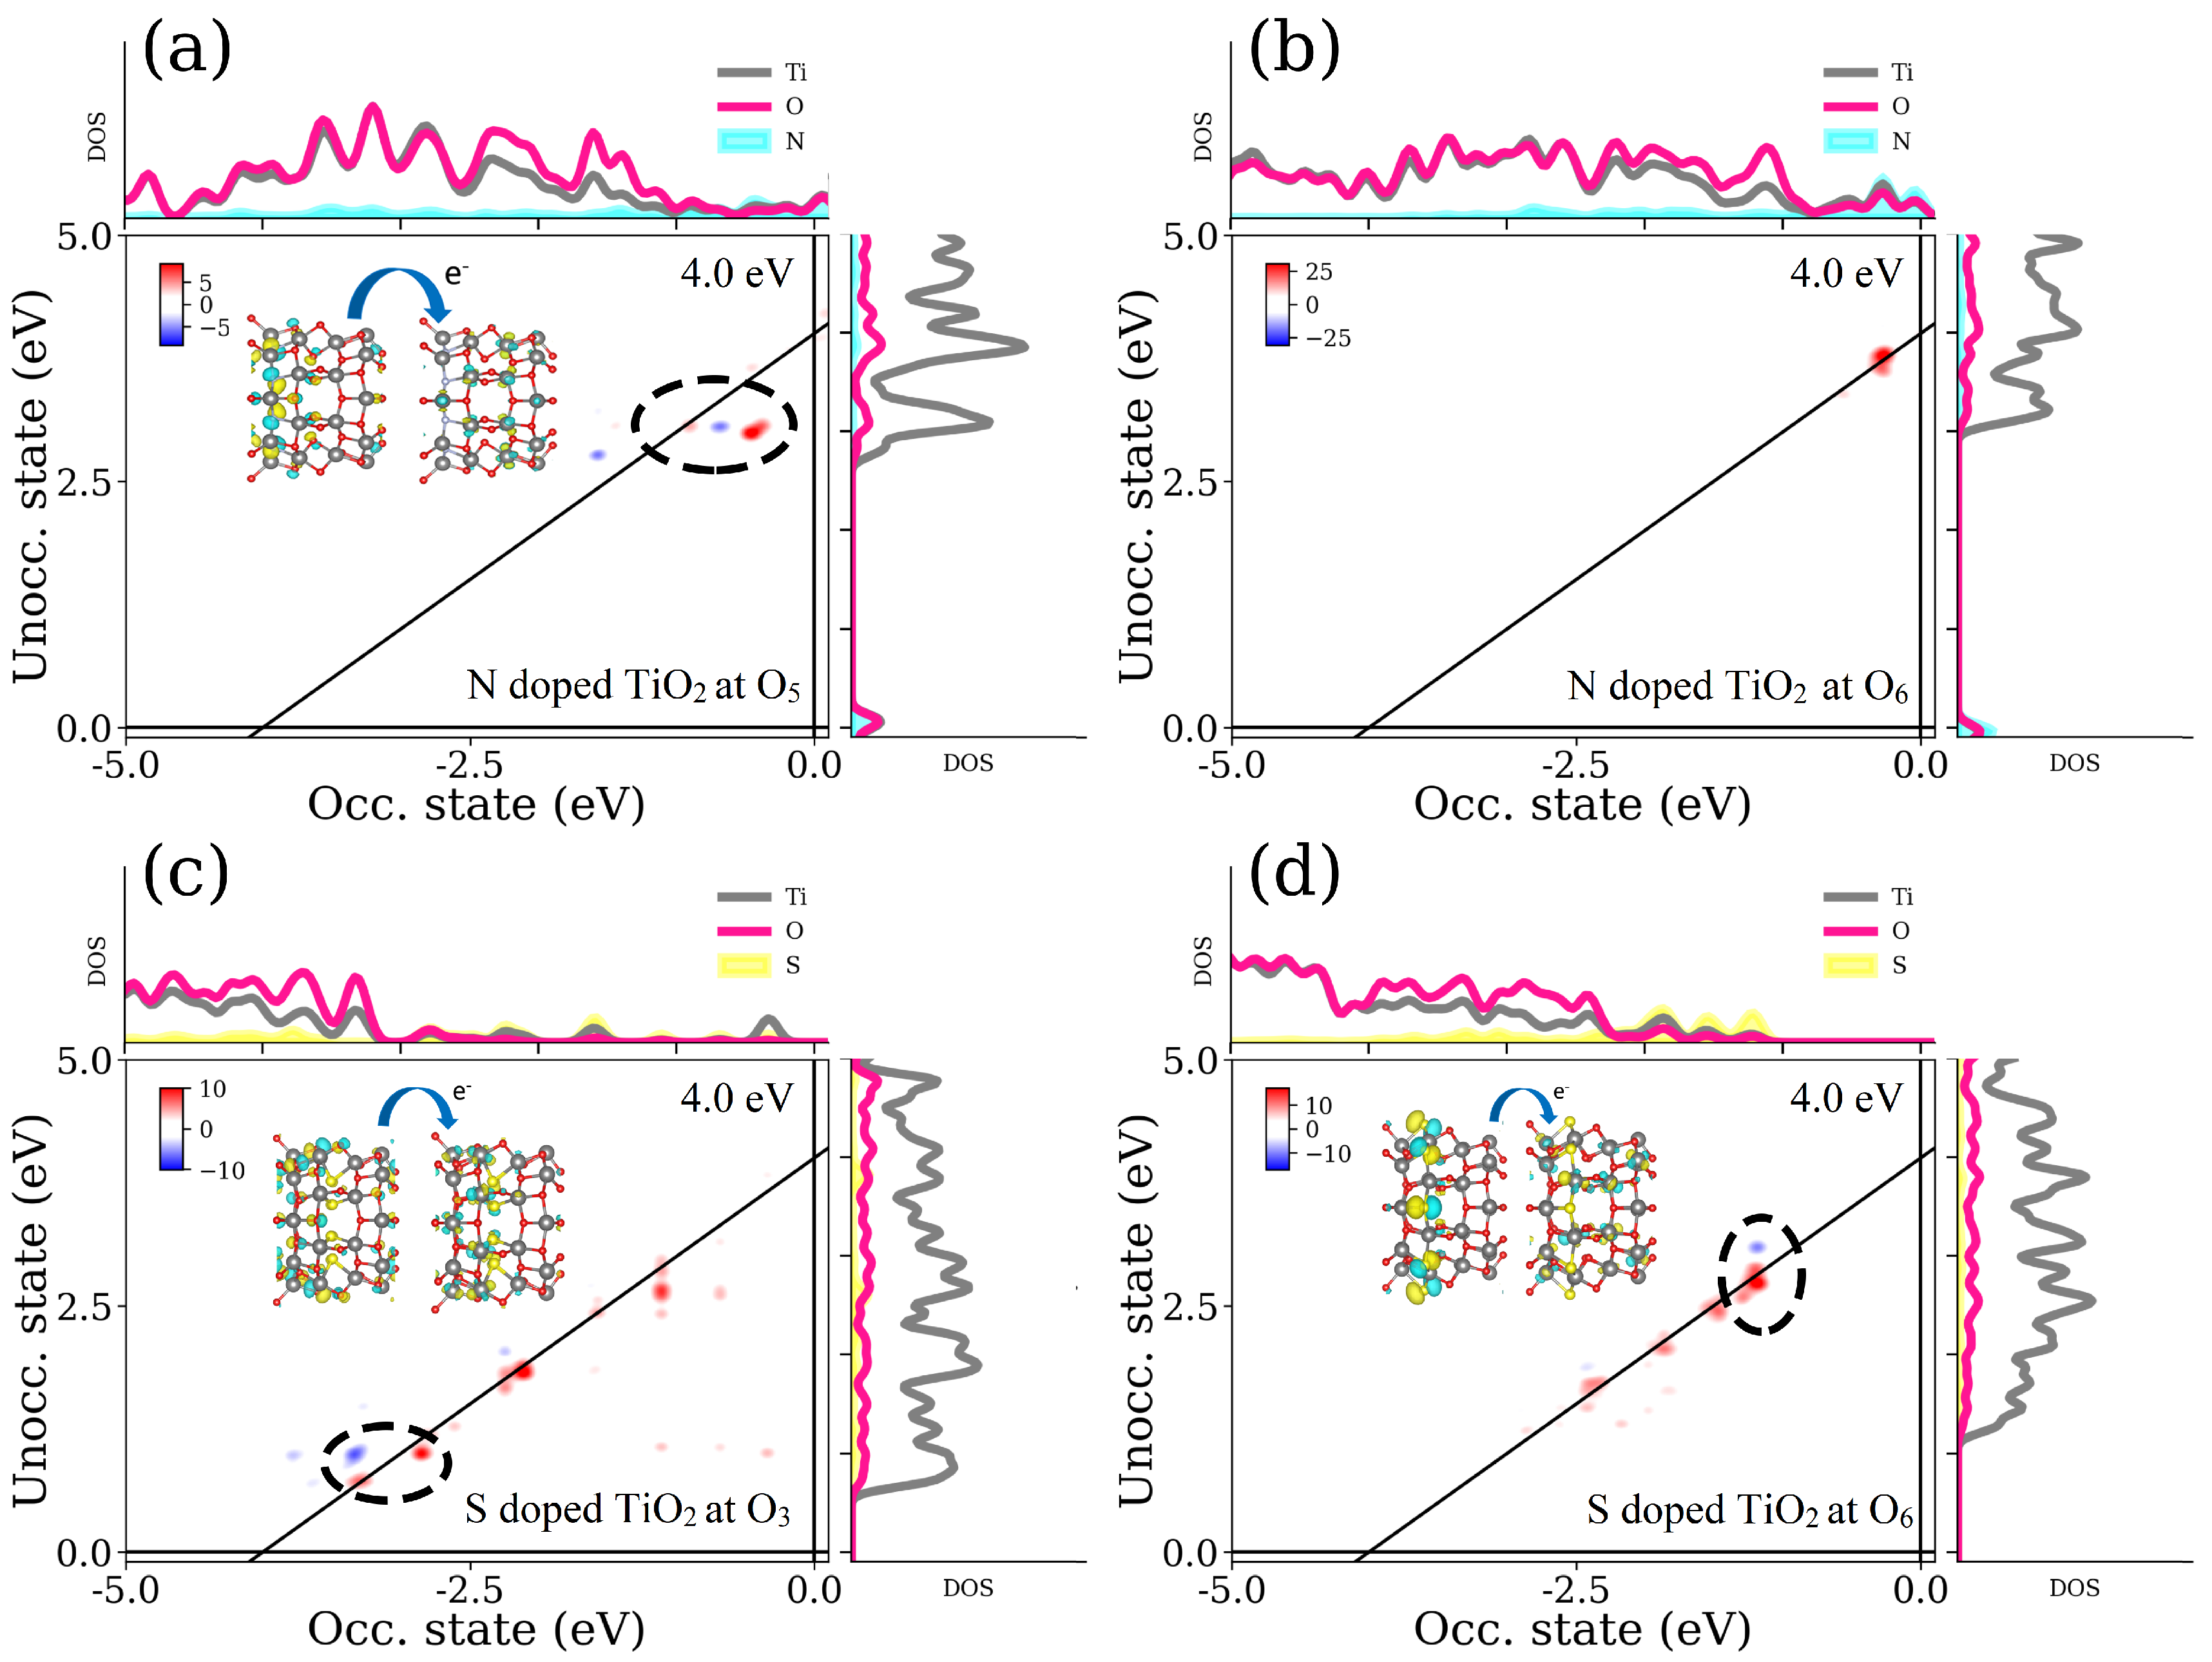
3.2.2. Optical Property
3.3. N+S-Codoped TiO NT
4. Conclusions
Author Contributions
Funding
Data Availability Statement
Conflicts of Interest
References
- Fujishima, A.; Honda, K. Electrochemical photolysis of water at a semiconductor electrode. Nature 1972, 238, 37–38. [Google Scholar] [CrossRef]
- Maeda, K. Photocatalytic Water Splitting Using Semiconductor Particles: History and Recent Developments. J. Photochem. Photobiol. C 2011, 12, 237–268. [Google Scholar] [CrossRef]
- Li, B.; Wu, S.; Gao, X. Theoretical calculation of a TiO2-based photocatalyst in the field of water splitting: A review. Nanotechnol. Rev. 2020, 9, 1080–1103. [Google Scholar] [CrossRef]
- Razek, S.; Popeil, M.; Wangoh, L.; Rana, J.; Suwandaratne, N.; Andrews, J.; Watson, D.; Banerjee, S.; Piper, L. Designing catalysts for water splitting based on electronic structure considerations. Electron. Struct. 2020, 2, 023001. [Google Scholar] [CrossRef]
- Catlow, C.R.A.; Guo, Z.X.; Miskufova, M.; Shevlin, S.A.; Smith, A.G.H.; Sokol, A.A.; Walsh, A.; Wilson, D.J.; Woodley, S.M. Advances in computational studies of energy materials. Philos. Trans. R. Soc. A Math. Phys. Eng. Sci. 2010, 368, 3379–3456. [Google Scholar] [CrossRef] [Green Version]
- Serga, V.; Burve, R.; Krumina, A.; Romanova, M.; Kotomin, E.A.; Popov, A.I. Extraction-Pyrolytic Method for TiO2 Polymorphs Production. Crystals 2021, 11, 431. [Google Scholar] [CrossRef]
- Tsebriienko, T.; Popov, A.I. Effect of Poly(Titanium Oxide) on the Viscoelastic and Thermophysical Properties of Interpenetrat ing Polymer Networks. Crystals 2021, 11, 794. [Google Scholar] [CrossRef]
- Serga, V.; Burve, R.; Krumina, A.; Pankratova, V.; Popov, A.I.; Pankratov, V. Study of phase composition, photocatalytic activity, and photoluminescence of TiO2 with Eu additive produced by the extraction-pyrolytic method. J. Mater. Res. Technol. 2021, 13, 2350–2360. [Google Scholar] [CrossRef]
- Dukenbayev, K.; Kozlovskiy, A.; Kenzhina, I.; Berguzinov, A.; Zdorovets, M. Study of the effect of irradiation with Fe7+ ions on the structural properties of thin TiO2 foils. Mater. Res. Express 2019, 6, 046309. [Google Scholar] [CrossRef]
- Kozlovskiy, A.; Shlimas, D.; Kenzhina, I.; Boretskiy, O.; Zdorovets, M. Study of the Effect of Low-Energy Irradiation with O2+ Ions on Radiation Hardening and Modification of the Properties of Thin TiO2 Films. J. Inorg. Organomet. Polym. Mater. 2021, 31, 790–801. [Google Scholar] [CrossRef]
- Osinkin, D.A.; Antonova, E.P.; Lesnichyova, A.S.; Tropin, E.S.; Chernov, M.E.; Chernov, E.I.; Farlenkov, A.S.; Khodimchuk, A.V.; Eremin, V.A.; Kovrova, A.I.; et al. Application of Promising Electrode Materials in Contact with a Thin-Layer ZrO2-Based Supporting Electrolyte for Solid Oxide Fuel Cells. Energies 2020, 13, 1190. [Google Scholar] [CrossRef] [Green Version]
- Osinkin, D.A.; Khodimchuk, A.V.; Porotnikova, N.M.; Bogdanovich, N.M.; Fetisov, A.V.; Ananyev, M.V. Rate-Determining Steps of Oxygen Surface Exchange Kinetics on Sr2Fe1.5Mo0.5O6-δ. Energies 2020, 13, 250. [Google Scholar] [CrossRef] [Green Version]
- Lisovski, O.; Piskunov, S.; Bocharov, D.; Kenmoe, S. 2D slab models of TiO2 nanotubes for simulation of water adsorption: Validation over a diameter range. Results Phys. 2020, 19, 103527. [Google Scholar] [CrossRef]
- Piskunov, S.; Lisovski, O.; Begens, J.; Bocharov, D.; Zhukovskii, Y.F.; Wessel, M.; Spohr, E. C-, N-, S-, and Fe-Doped TiO2 and SrTiO3 Nanotubes for Visible-Light-Driven Photocatalytic Water Splitting: Prediction from First Principles. J. Phys. Chem. C 2015, 119, 18686–18696. [Google Scholar] [CrossRef]
- Kenmoe, S.; Lisovski, O.; Piskunov, S.; Zhukovskii, Y.F.; Spohr, E. Electronic and optical properties of pristine, N- and S-doped water-covered TiO2 nanotube surfaces. J. Chem. Phys. 2019, 150, 041714. [Google Scholar] [CrossRef] [PubMed]
- Rossi, T.; Kuisma, M.; Puska, M.; Nieminen, R.; Erhart, P. Kohn-Sham decomposition in real-time time-dependent density-functional theory: An efficient tool for analyzing plasmonic excitations. J. Chem. Theory Comput. 2017, 13, 4779–4790. [Google Scholar] [CrossRef] [PubMed] [Green Version]
- Conley, K.; Nayyar, N.; Rossi, T.; Kuisma, M.; Turkowski, V.; Puska, M.; Rahman, T. Plasmon excitations in mixed metallic nanoarrays. ACS Nano 2019, 13, 5344–5355. [Google Scholar] [CrossRef] [Green Version]
- Rossi, T.; Shegai, T.; Erhart, P.; Antosiewicz, T. Strong plasmon-molecule coupling at the nanoscale revealed by first-principles modeling. Nat. Commun. 2019, 10, 3336. [Google Scholar] [CrossRef] [Green Version]
- Zhukovskii, Y.F.; Pugno, N.; Popov, A.I.; Balasubramanian, C.; Bellucci, S. Influence of F centres on structural and electronic properties of AlN single-walled nanotubes. J. Phys. Condens. Matter 2007, 19, 395021. [Google Scholar] [CrossRef] [Green Version]
- Bellucci, S.; Popov, A.I.; Balasubramanian, C.; Cinque, G.; Marcelli, A.; Karbovnyk, I.; Savchyn, V.; Krutyak, N. Luminescence, vibrational and XANES studies of AlN nanomaterials. Radiat. Meas. 2007, 42, 708–711. [Google Scholar] [CrossRef]
- Kamenov, V.; Hu, Y.; Shamonina, E.; Ringhofer, K.; Gayvoronsky, V.Y. Two-wave mixing in (111)-cut Bi12SiO20 and Bi12TiO20 crystals: Characterization and comparison with the general orientation. Phys. Rev. E 2000, 62, 2863. [Google Scholar] [CrossRef] [PubMed]
- Frejlich, J.; Freschi, A.; Garcia, P.; Shamonina, E.; Gayvoronsky, V.Y.; Ringhofer, K. Feedback-controlled running holograms in strongly absorbing photorefractive materials. JOSA B 2000, 17, 1517–1521. [Google Scholar] [CrossRef]
- Bellucci, S.; Balasubramanian, C.; Ivanov, A.; Popov, A.; Schober, H. Neutron characterization of aluminium nitride nanotubes. J. Neutron Res. 2006, 14, 287–291. [Google Scholar] [CrossRef]
- Karbovnyk, I.; Klym, H.; Piskunov, S.; Popov, A.; Chalyy, D.; Zhydenko, I.; Lukashevych, D. The impact of temperature on electrical properties of polymer-based nanocomposites. Low Temp. Phys. 2020, 46, 1231–1234. [Google Scholar] [CrossRef]
- Chuklina, N.; Piskunov, S.; Popov, N.; Mysovsky, A.; Popov, A. Comparative quantum chemistry study of the F-center in lanthanum trifluoride. Nucl. Instrum. Methods Phys. Res. B 2020, 474, 57–62. [Google Scholar] [CrossRef]
- Dovesi, R.; Erba, A.; Orlando, R.; Zicovich-Wilson, C.M.; Civalleri, B.; Maschio, L.; Rérat, M.; Casassa, S.; Baima, J.; Salustro, S.; et al. Quantum-mechanical condensed matter simulations with CRYSTAL. Wiley Interdiscip. Rev. Comput. Mol. Sci. 2018, 8, e1360. [Google Scholar] [CrossRef]
- Enkovaara, J.; Rostgaard, C.; Mortensen, J.J.; Chen, J.; Dulak, M.; Ferrighi, L.; Gavnholt, J.; Glinsvad, C.; Haikola, V.; Hansen, H.A.; et al. Electronic structure calculations with gpaw: A real-space implementation of the projector augmented-wave method. J. Phys. Condens. Matter 2010, 22, 253202:1–253202:24. [Google Scholar] [CrossRef]
- Walter, M.; Häkkinen, H.; Lehtovaara, L.; Puska, M.; Enkovaara, J.; Rostgaard, C.; Mortensen, J. Time-dependent density-functional theory in the projector augmented-wave method. J. Chem. Phys. 2008, 128, 244101. [Google Scholar] [CrossRef] [PubMed] [Green Version]
- Larsen, A.H.; Mortensen, J.J.; Blomqvist, J.; Castelli, I.E.; Christensen, R.; Dułak, M.; Friis, J.; Groves, M.N.; Hammer, B.; Hargus, C.; et al. The atomic simulation environment—A Python library for working with atoms. J. Phys. Condens. Matter 2017, 29, 273002. [Google Scholar] [CrossRef] [Green Version]
- Perdew, J.P.; Burke, K.; Ernzerhof, M. Generalized Gradient Approximation Made Simple. Phys. Rev. Lett. 1997, 77, 3865–3868. [Google Scholar] [CrossRef] [Green Version]
- Kuisma, M.; Ojanen, J.; Enkovaara, J.; Rantala, T.T. Kohn-Sham potential with discontinuity for band gap materials. Phys. Rev. B 2010, 82, 115106. [Google Scholar] [CrossRef] [Green Version]
- Haastrup, S.; Strange, M.; Pandey, M.; Deilmann, T.; Schmidt, P.S.; Hinsche, N.F.; Gjerding, M.N.; Torelli, D.; Larsen, P.M.; Riis-Jensen, A.C.; et al. The computational 2D materials database: High-throughput modeling and discovery of atomically thin crystals. 2D Mater. 2018, 5, 042002. [Google Scholar] [CrossRef]
- Larsen, A.H.; Vanin, M.; Mortensen, J.J.; Thygesen, K.S.; Jacobsen, K.W. Localized atomic basis set in the projector augmented wave method. Phys. Rev. B 2009, 80, 195112. [Google Scholar] [CrossRef] [Green Version]
- Kuisma, M.; Sakko, A.; Rossi, T.; Larsen, A.H.; Enkovaara, J.; Lehtovaara, L.; Rantala, T.T. Localized surface plasmon resonance in silver nanoparticles: Atomistic first-principles time-dependent density-functional theory calculations. Phys. Rev. B 2015, 91, 115431. [Google Scholar] [CrossRef] [Green Version]
- Mokkath, J.H. Strong Collectivity of Optical Transitions in Lead Halide Perovskite Quantum Dots. Plasmonics 2020, 15, 581–590. [Google Scholar] [CrossRef]
- Momma, K.; Izumi, F. VESTA 3 for three-dimensional visualization of crystal, volumetric and morphology data. J. Appl. Cryst. 2011, 44, 1272–1276. [Google Scholar] [CrossRef]
- Van der Walt, S.; Colbert, S.C.; Varoquaux, G. The numpy array: A structure for efficient numerical computation. Comput. Sci. Eng. 2011, 13, 22–30. [Google Scholar] [CrossRef] [Green Version]
- Hunter, J.D. Matplotlib: A 2D graphics environment. Comput. Sci. Eng. 2007, 9, 90–95. [Google Scholar] [CrossRef]
- Wang, W.; Wang, Z.; Liu, J.; Luo, Z.; Suib, S.L.; He, P.; Ding, G.; Zhang, Z.; Sun, L. Single step one-pot synthesis of TiOS nanosheets doped with sulfur on reduced graphene oxide with enhanced photocatalytic activity. Sci. Rep. 2017, 7, 446610. [Google Scholar]
- Xu, J.; Wang, F.; Liu, W.; Cao, W. Nanocrystalline n-doped TiO2 powders: Mild hydrothermal synthesis and photocatalytic degradation of phenol under visible light irradiation. Int. J. Photoenergy 2013, 2013, 616139. [Google Scholar]
- Seo, S.-H.; Kim, B.-I. Effect of Cu, Cr, S Doped TiO2 for Transparent Plastic Bar Reinforced Concrete. Appl. Sci. 2020, 10, 7334. [Google Scholar] [CrossRef]
- Wu, Y.; Mu, H.; Cao, X.; He, X. Polymer-supported graphene-TiO2 doped with nonmetallic elements with enhanced photocatalytic reaction under visible light. J. Mater. Sci. 2020, 55, 1577–1591. [Google Scholar] [CrossRef]
- Lisovski, O.; Piskunov, S.; Bocharov, D.; Kenmoe, S. 2D Slab Models of Nanotubes Based on Tetragonal TiO2 Structures: Validation over a Diameter Range. Nanomaterials 2021, 11, 1925. [Google Scholar] [CrossRef]


Publisher’s Note: MDPI stays neutral with regard to jurisdictional claims in published maps and institutional affiliations. |
© 2021 by the authors. Licensee MDPI, Basel, Switzerland. This article is an open access article distributed under the terms and conditions of the Creative Commons Attribution (CC BY) license (https://creativecommons.org/licenses/by/4.0/).
Share and Cite
Lin, Y.-P.; Isakoviča, I.; Gopejenko, A.; Ivanova, A.; Začinskis, A.; Eglitis, R.I.; D’yachkov, P.N.; Piskunov, S. Time-Dependent Density Functional Theory Calculations of N- and S-Doped TiO2 Nanotube for Water-Splitting Applications. Nanomaterials 2021, 11, 2900. https://0-doi-org.brum.beds.ac.uk/10.3390/nano11112900
Lin Y-P, Isakoviča I, Gopejenko A, Ivanova A, Začinskis A, Eglitis RI, D’yachkov PN, Piskunov S. Time-Dependent Density Functional Theory Calculations of N- and S-Doped TiO2 Nanotube for Water-Splitting Applications. Nanomaterials. 2021; 11(11):2900. https://0-doi-org.brum.beds.ac.uk/10.3390/nano11112900
Chicago/Turabian StyleLin, Yin-Pai, Inta Isakoviča, Aleksejs Gopejenko, Anna Ivanova, Aleksandrs Začinskis, Roberts I. Eglitis, Pavel N. D’yachkov, and Sergei Piskunov. 2021. "Time-Dependent Density Functional Theory Calculations of N- and S-Doped TiO2 Nanotube for Water-Splitting Applications" Nanomaterials 11, no. 11: 2900. https://0-doi-org.brum.beds.ac.uk/10.3390/nano11112900