
The Identification of Cu–O–C Bond in Cu/MWCNTs Hybrid Nanocomposite by XPS and NEXAFS Spectroscopy

 , , , ,
Abstract
:
1. Introduction
2. Materials and Methods
2.1. Materials
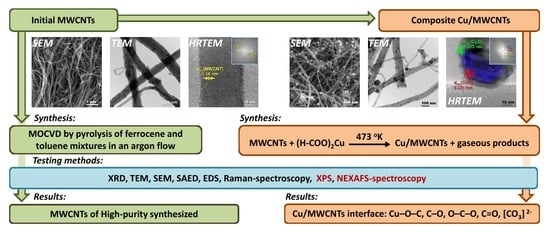
2.2. Synthesis
2.3. Characterization
2.3.1. XRD, TEM, SEM, and EDS
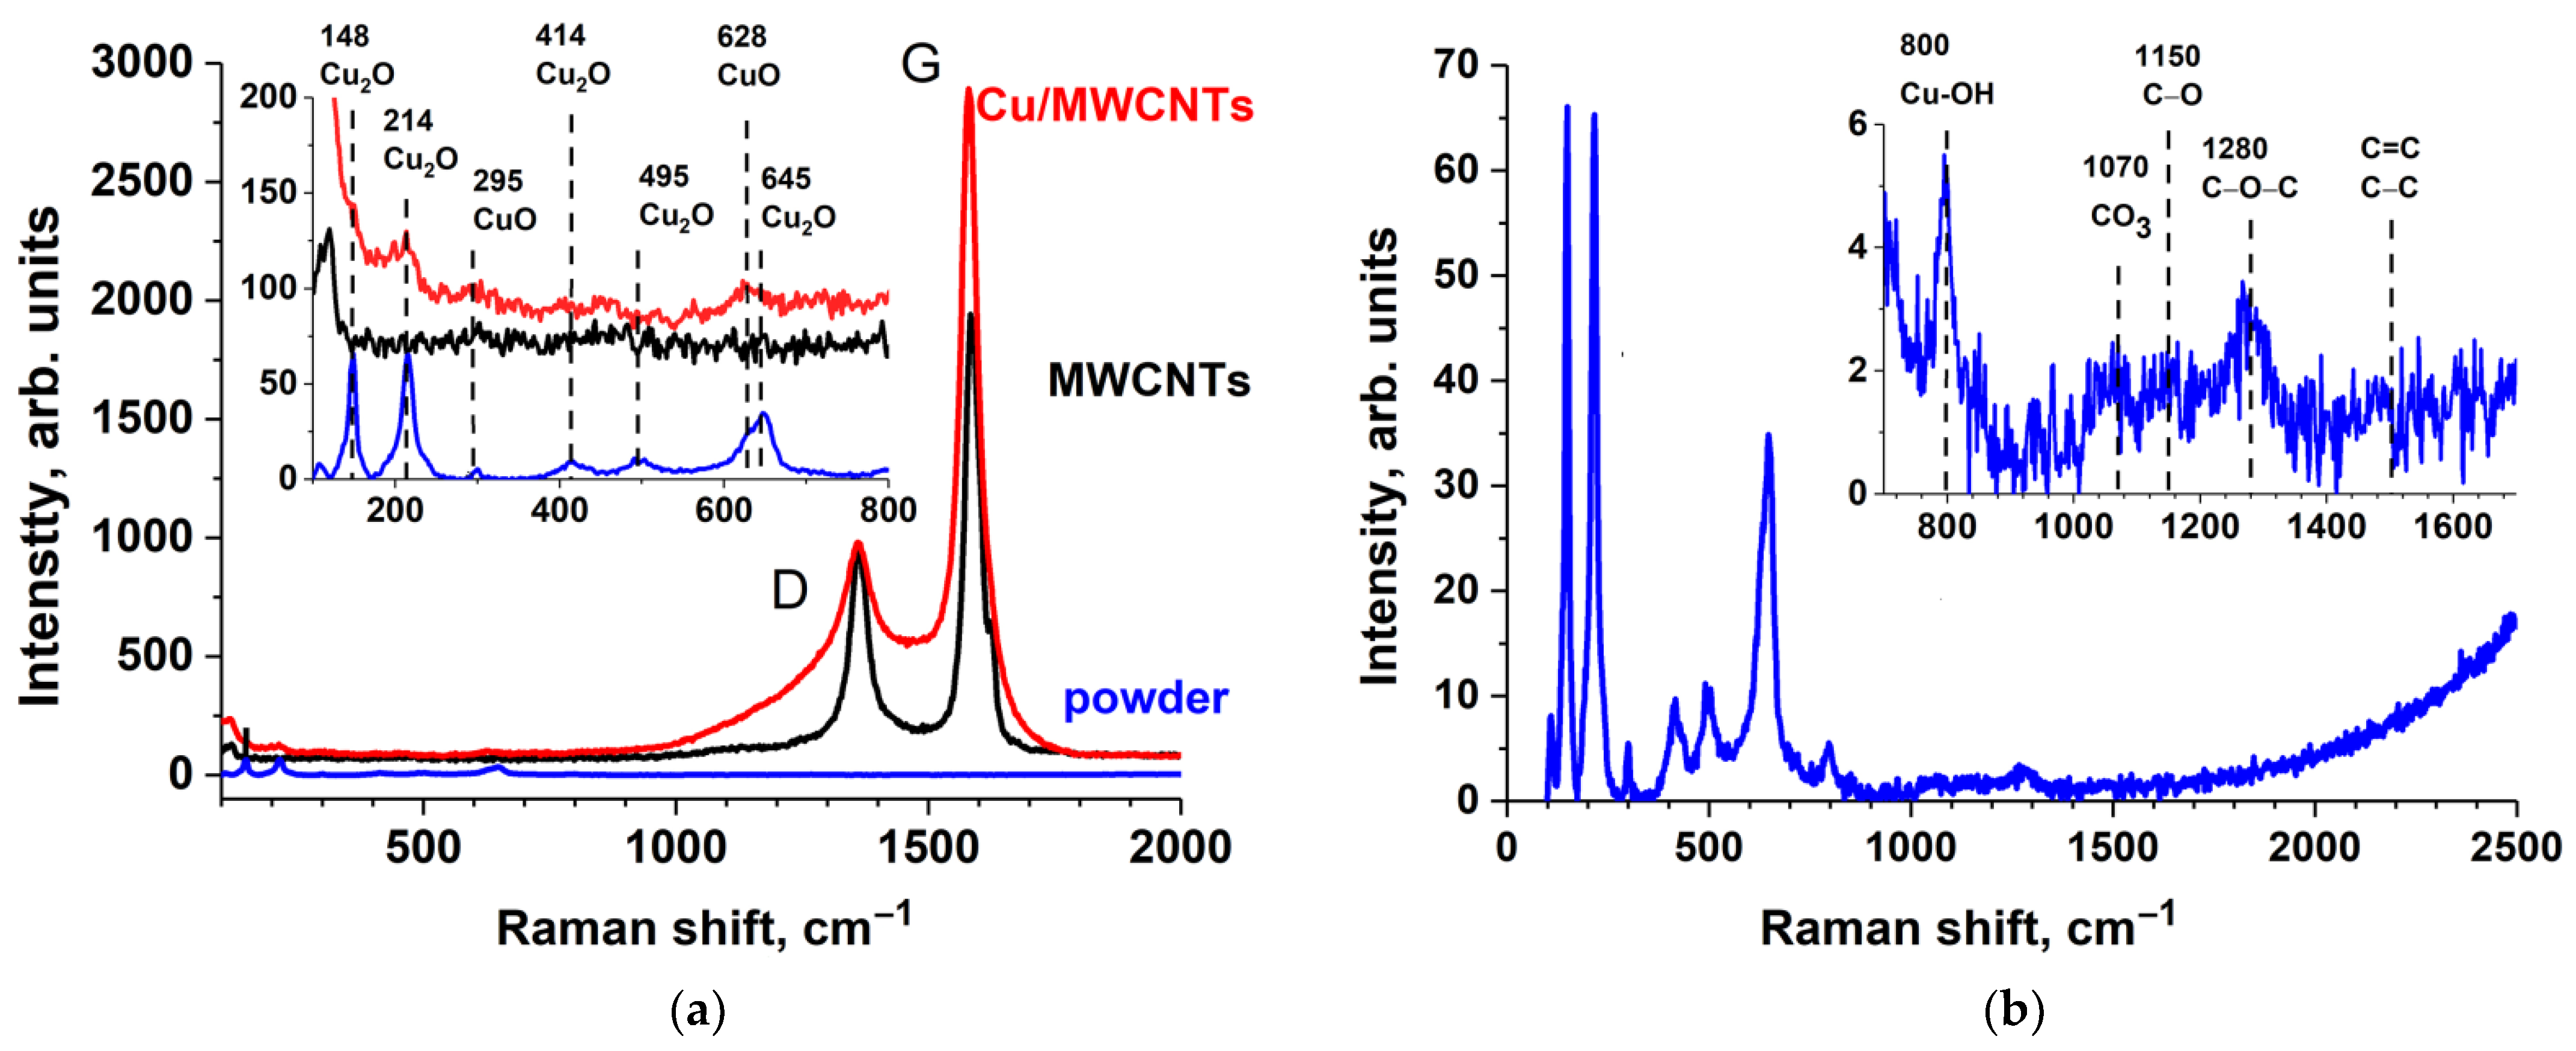
2.3.2. Raman Spectroscopy
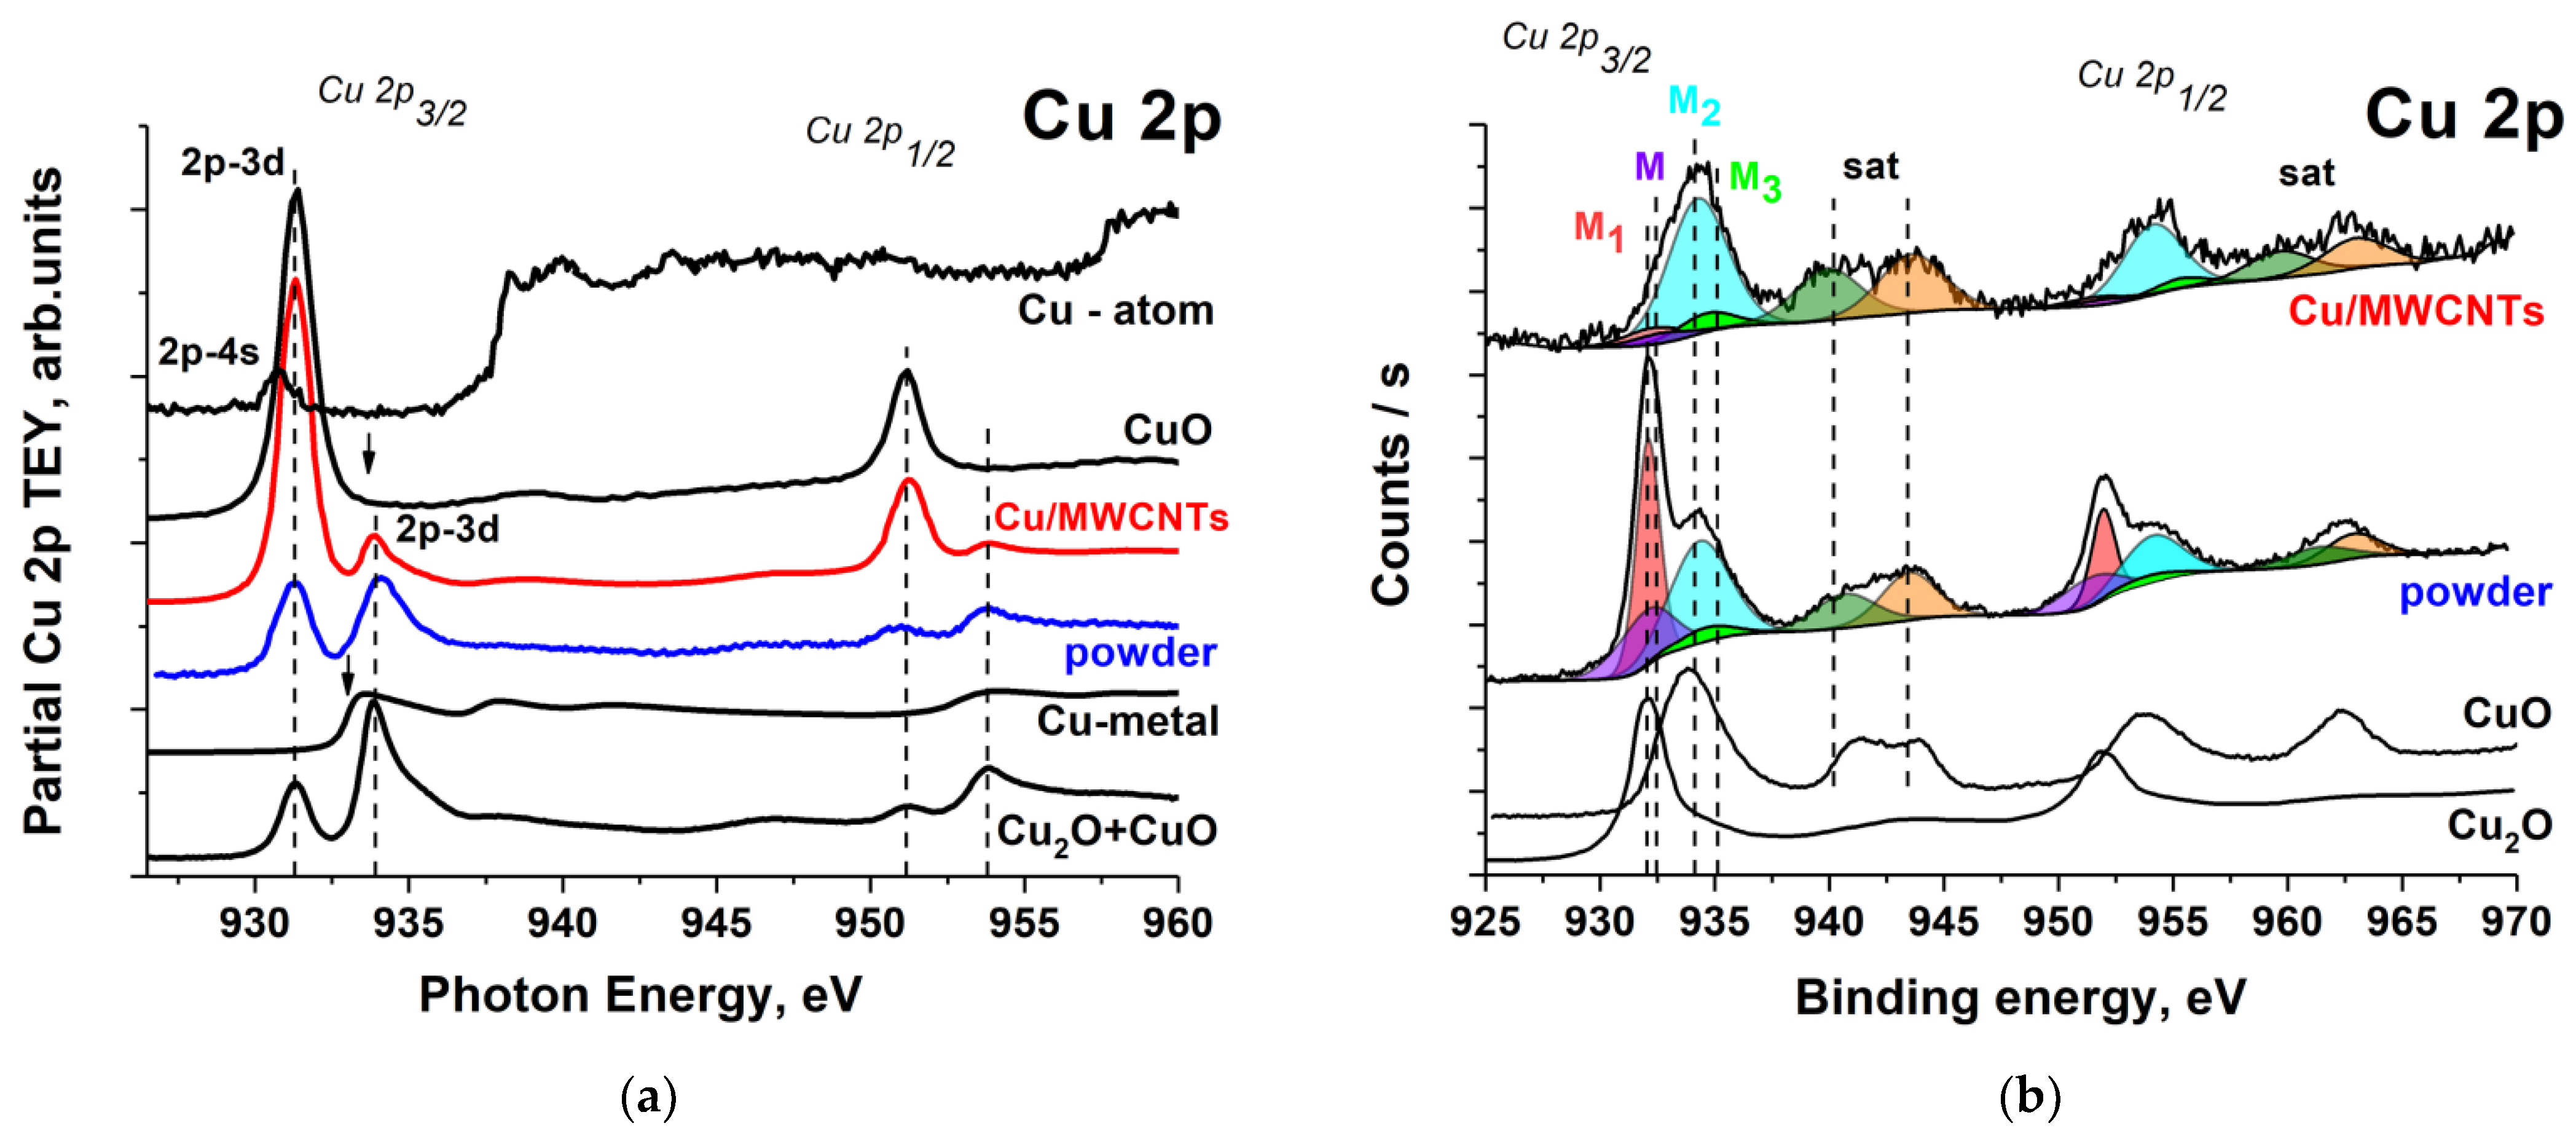
2.3.3. NEXAFS Spectroscopy
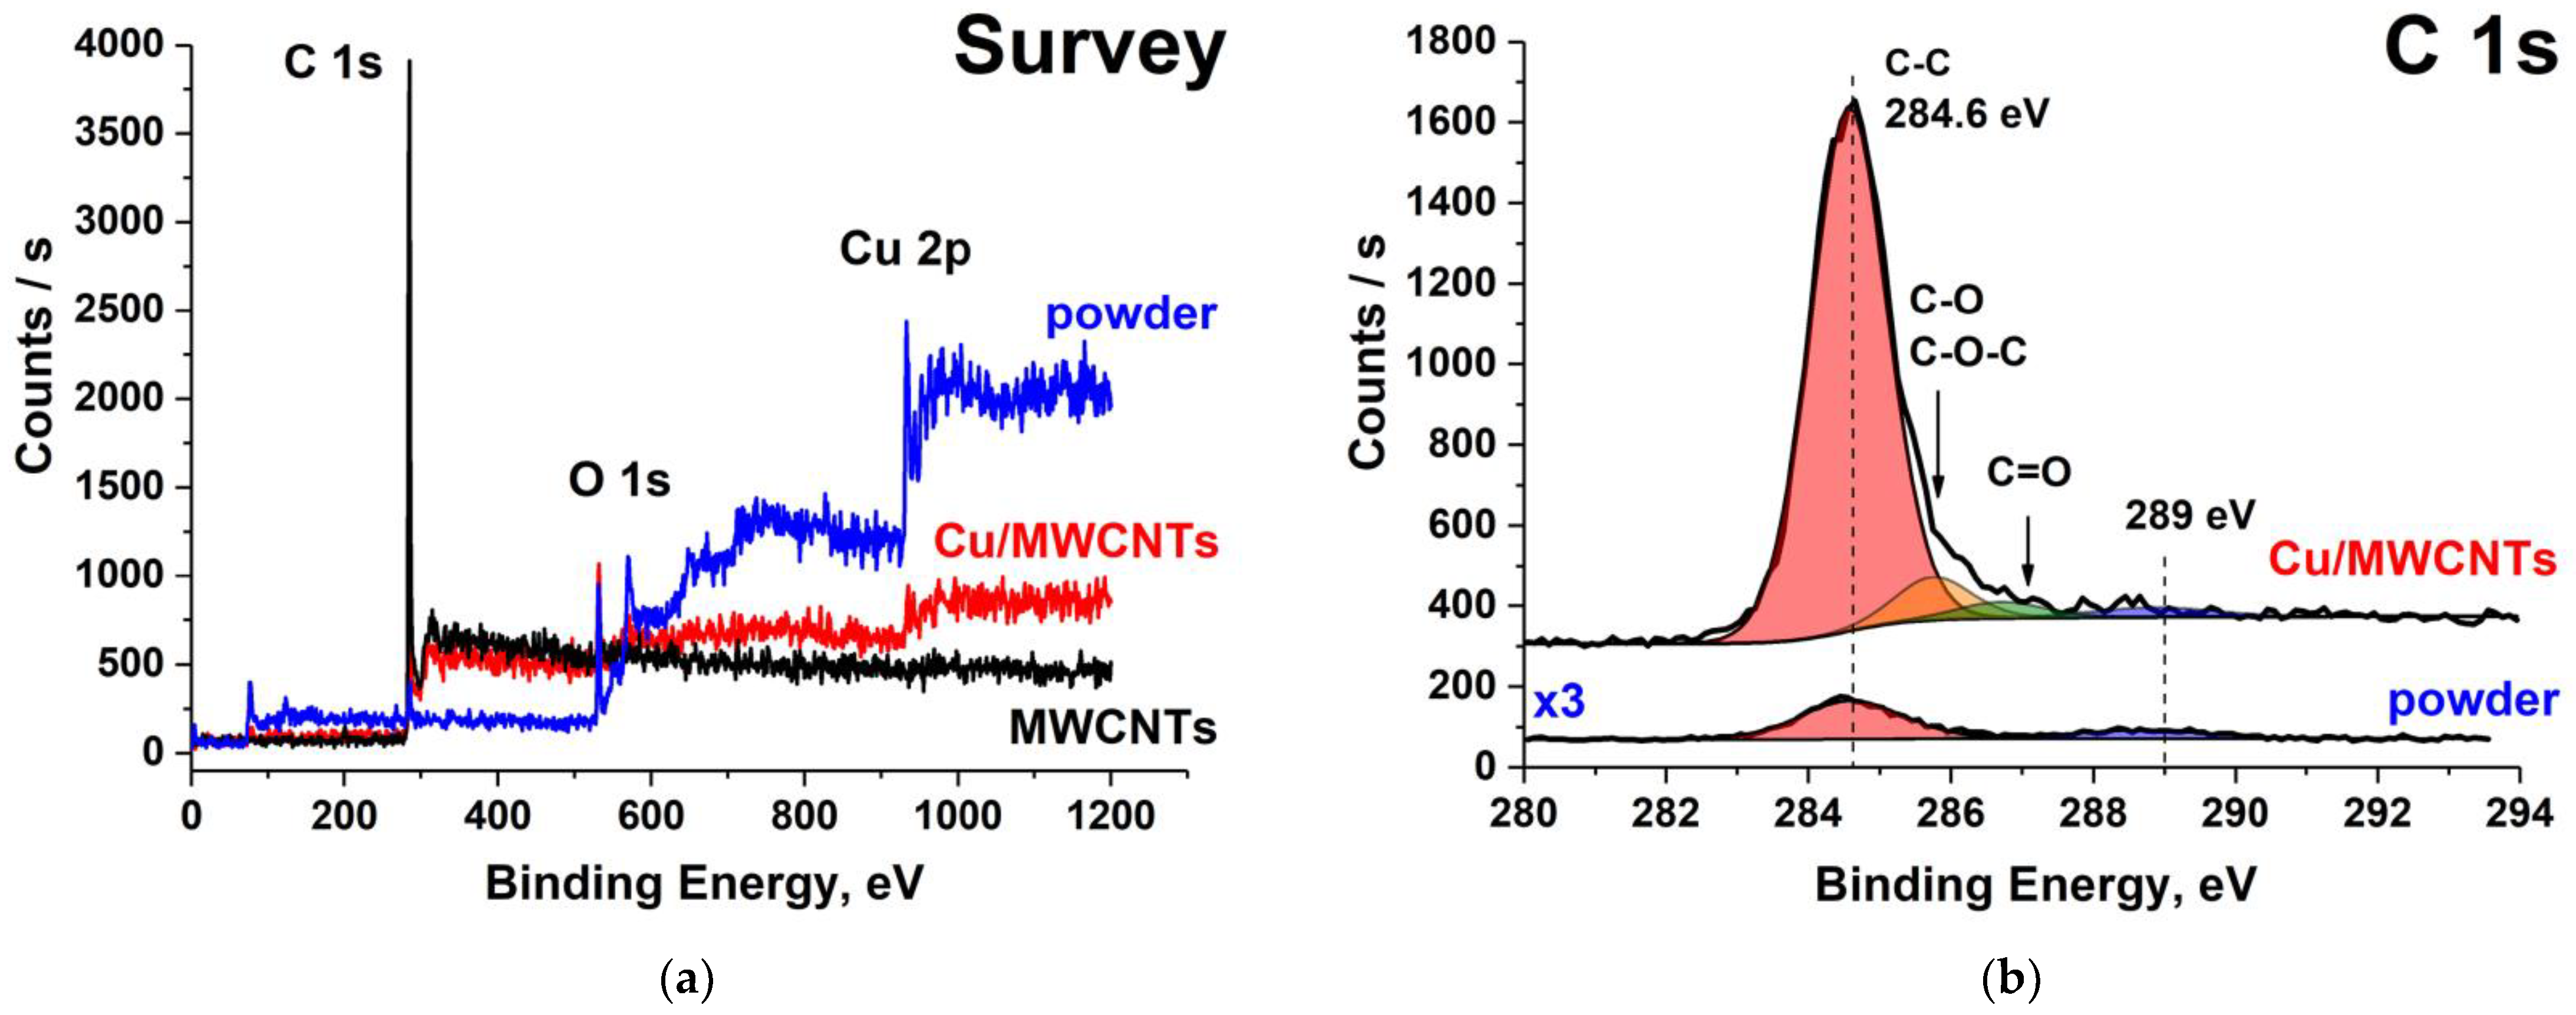
2.3.4. XPS
3. Results and Discussion
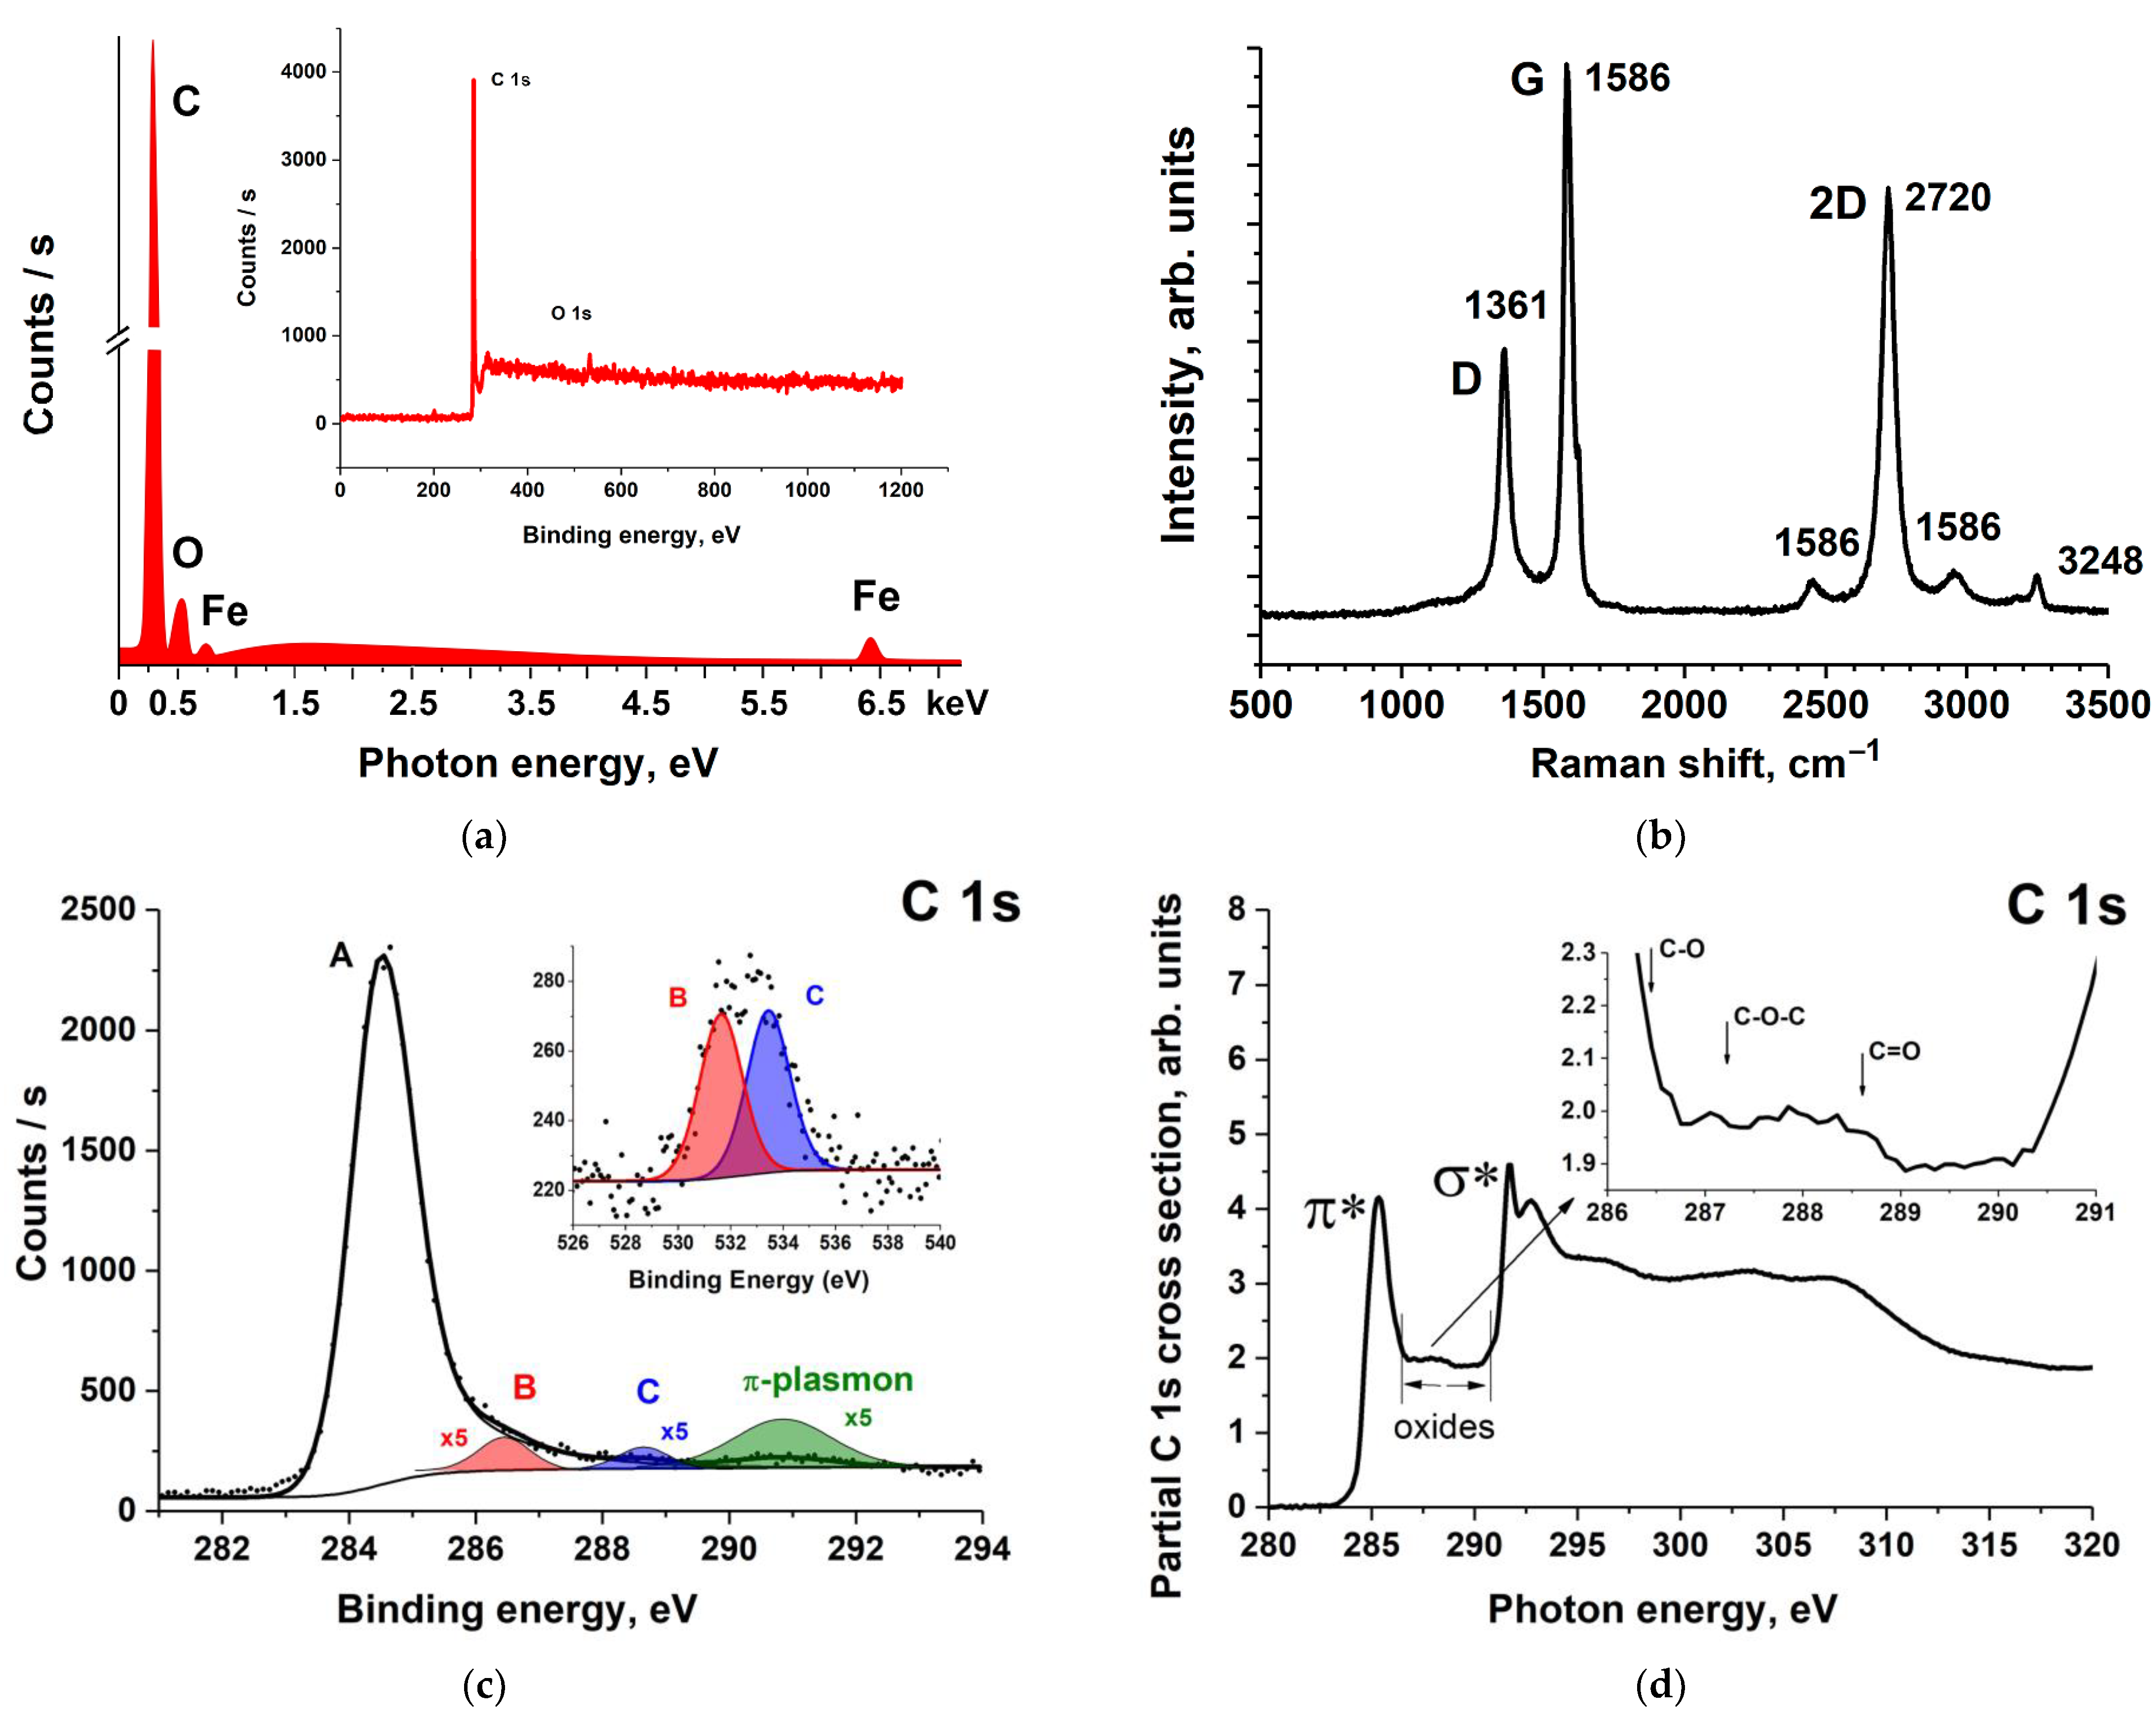
3.1. Initial MWCNT Research
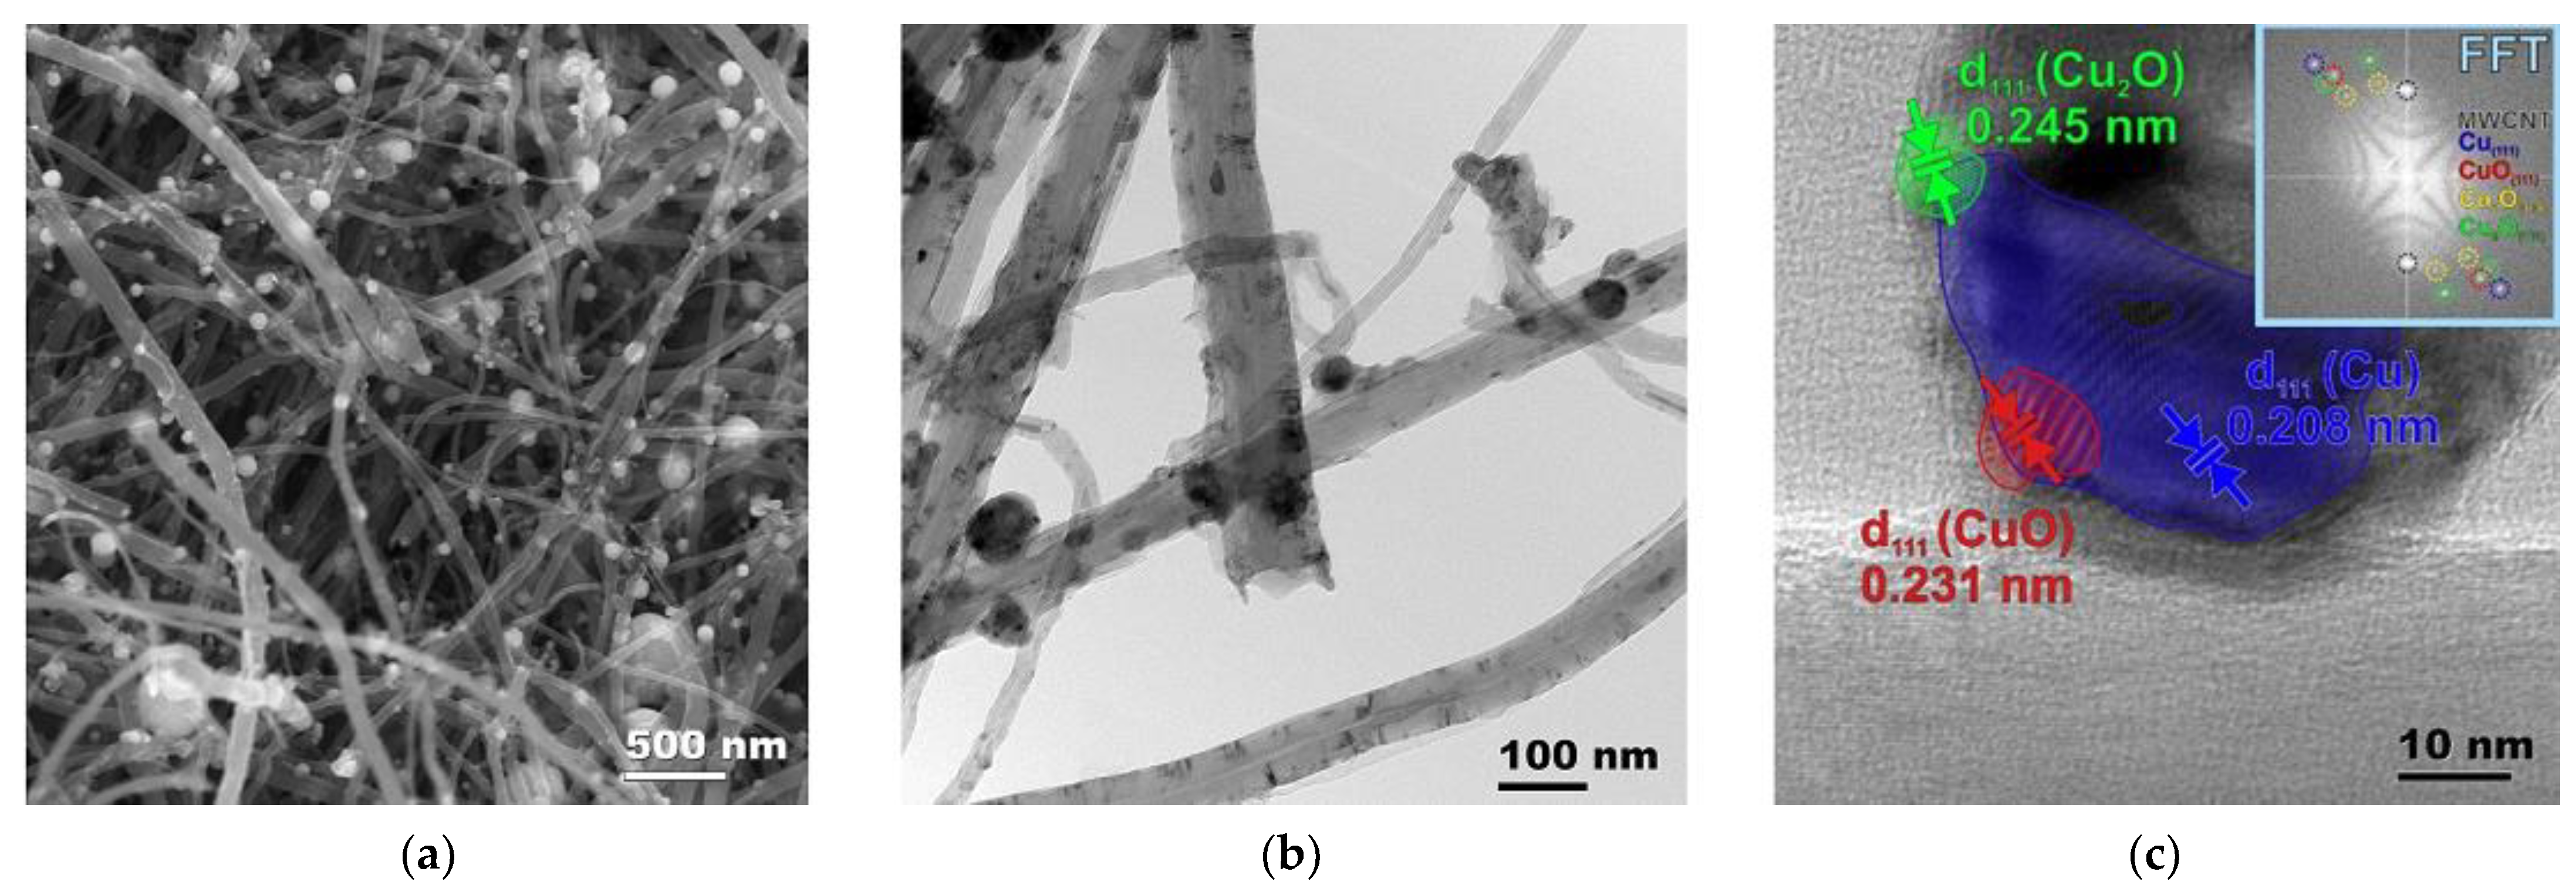
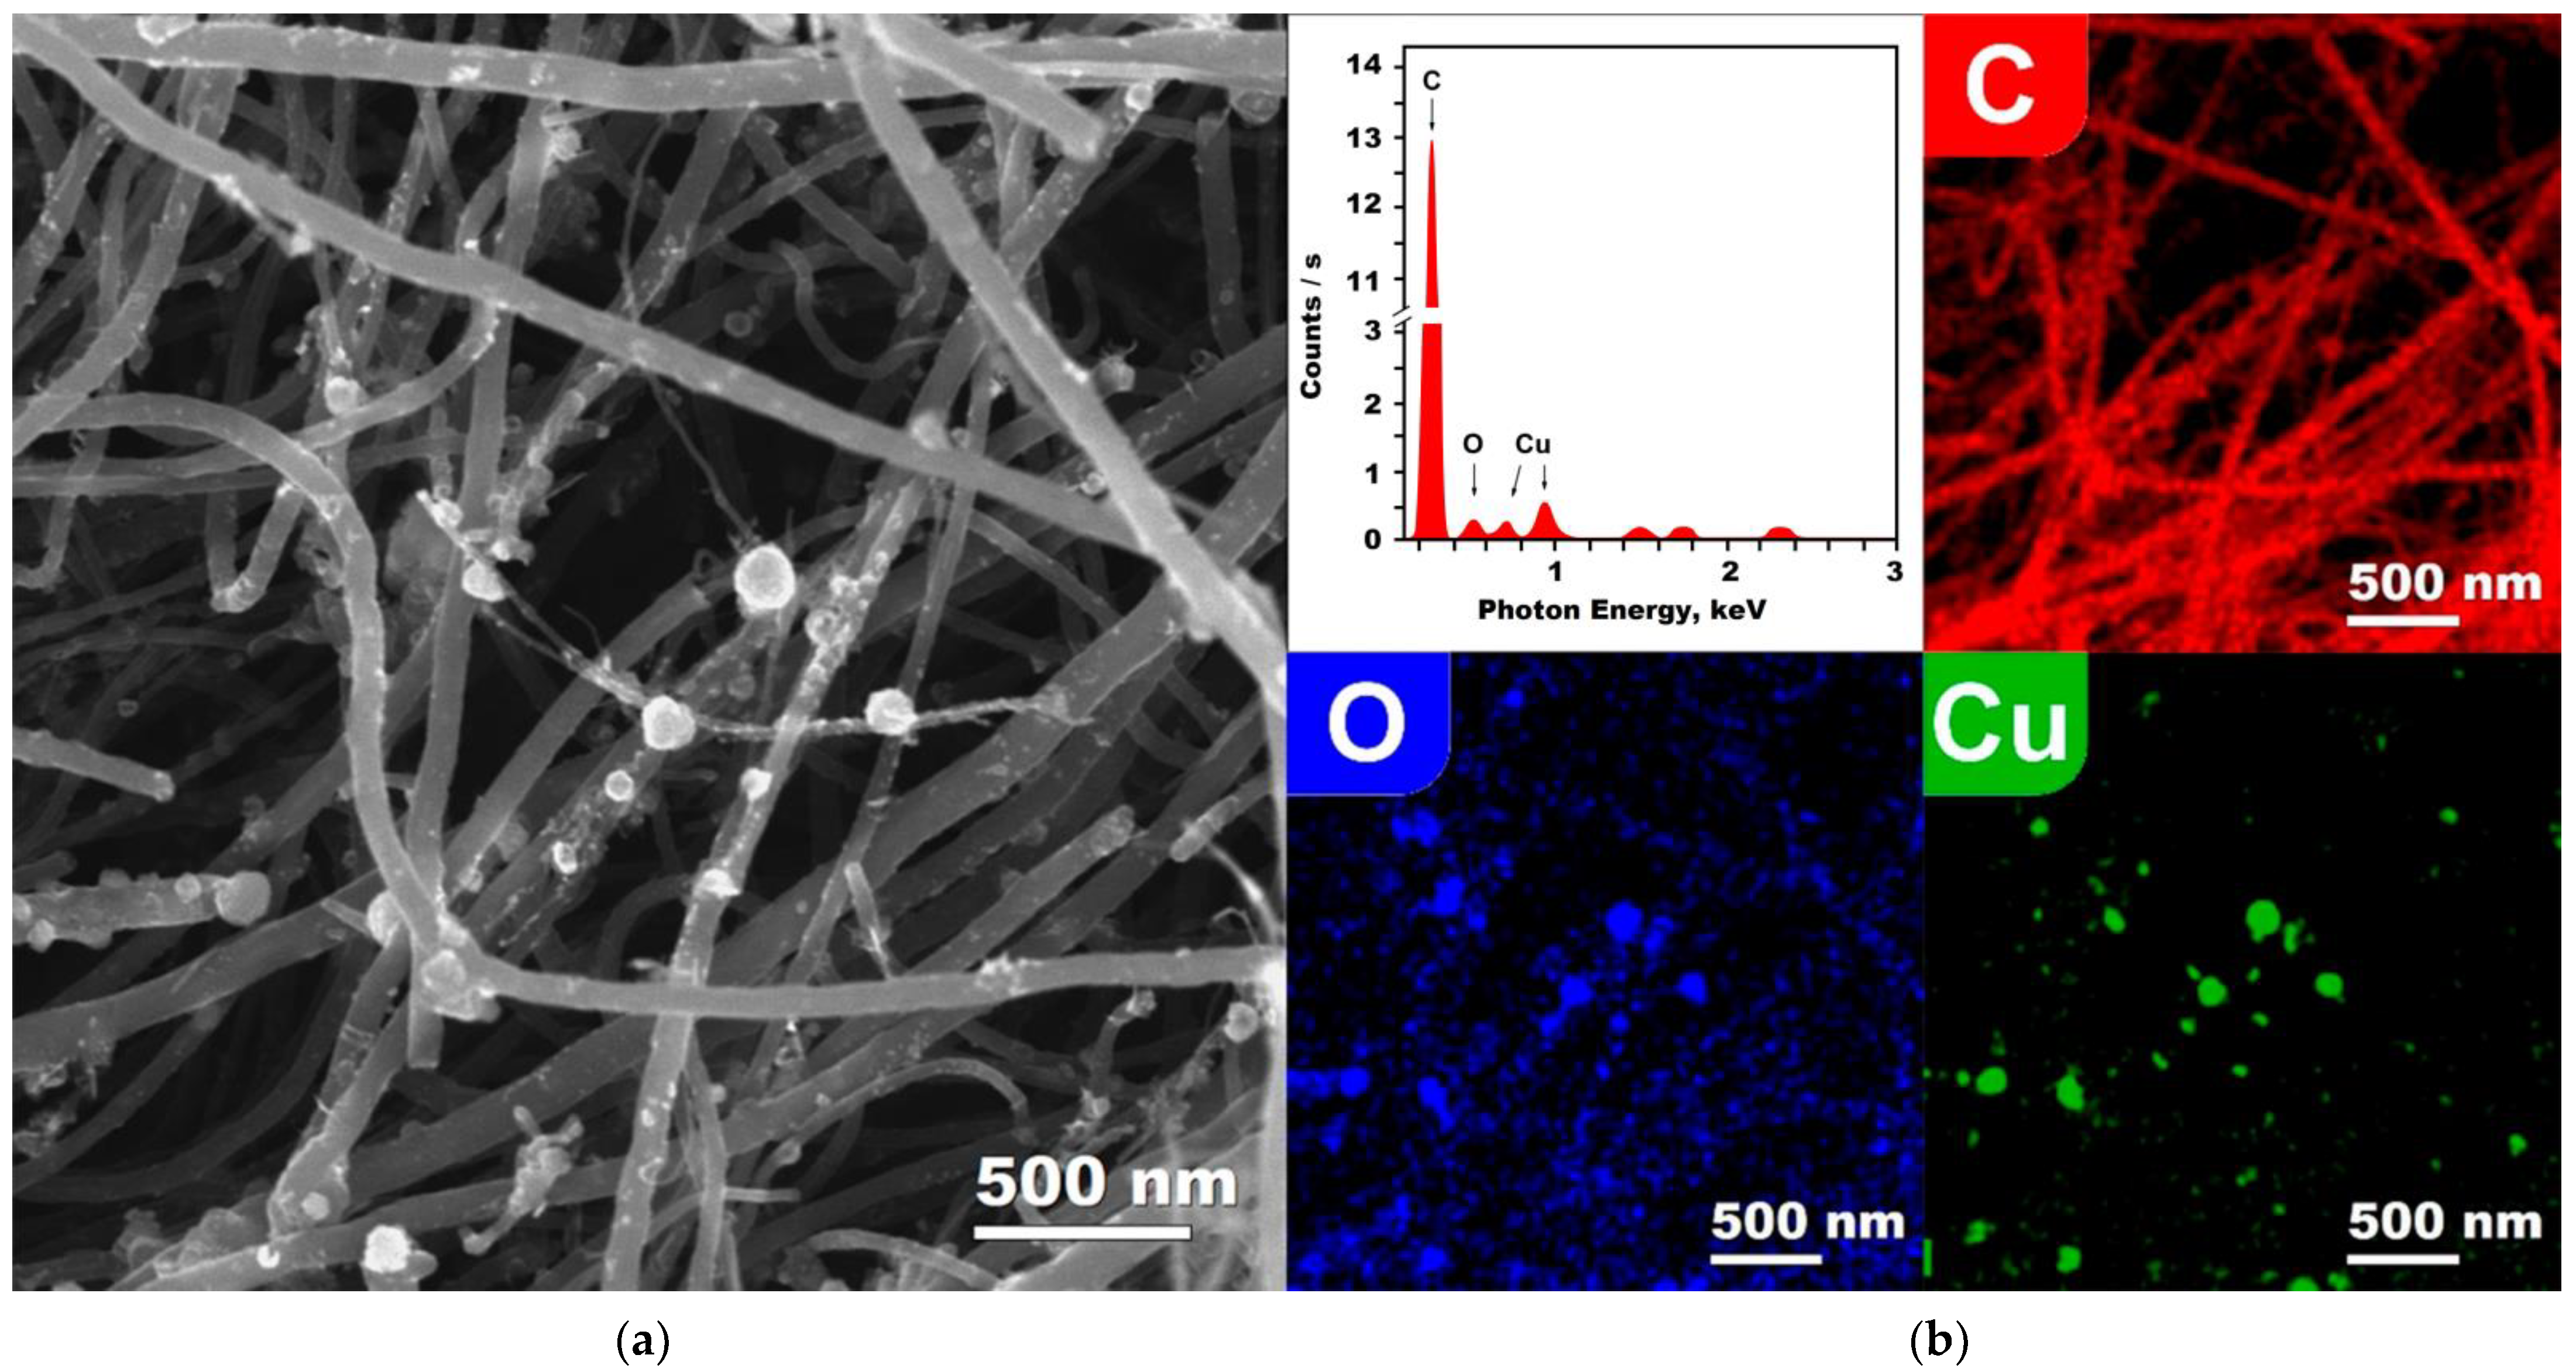
3.2. XRD, SEM, HRTEM, EDX, and Raman Characterization of Cu/MWCNTs
3.3. NEXAFS and XPS Study of Cu/MWCNTs
4. Conclusions
Supplementary Materials
Author Contributions
Funding
Acknowledgments
Conflicts of Interest
References
- Iijima, S. Helical Microtubules of Graphitic Carbon. Nature 1991, 354, 56–58. [Google Scholar] [CrossRef]
- Ebbesen, T.W.; Ajayan, P.M. Large-Scale Synthesis of Carbon Nanotubes. Nature 1992, 358, 220–222. [Google Scholar] [CrossRef]
- Tsang, S.C.; Harris, P.J.F.; Green, M.L.H. Thinning and Opening of Carbon Nanotubes by Oxidation Using Carbon Dioxide. Nature 1993, 362, 520–522. [Google Scholar] [CrossRef]
- José-Yacamán, M.; Miki-Yoshida, M.; Rendón, L.; Santiesteban, J.G. Catalytic Growth of Carbon Microtubules with Fullerene Structure. Appl. Phys. Lett. 1993, 62, 657–659. [Google Scholar] [CrossRef]
- Ball, P. The Perfect Nanotube. Nature 1996, 382, 207–208. [Google Scholar] [CrossRef]
- Hsu, W.K.; Terrones, M.; Hare, J.P.; Terrones, H.; Kroto, H.W.; Walton, D.R.M. Electrolytic Formation of Carbon Nanostructures. Chem. Phys. Lett. 1996, 262, 161–166. [Google Scholar] [CrossRef]
- Hsu, W.K.; Hare, J.P.; Terrones, M.; Kroto, H.W.; Walton, D.R.M.; Harris, P.J.F. Condensed-Phase Nanotubes. Nature 1995, 377, 687. [Google Scholar] [CrossRef]
- Rao, C.N.R.; Cheetham, A.K. Science and Technology of Nanomaterials: Current Status and Future Prospects. J. Mater. Chem. 2001, 11, 2887–2894. [Google Scholar] [CrossRef]
- Sivkov, V.N.; Petrova, O.V.; Nekipelov, S.V.; Obiedkov, A.M.; Kaverin, B.S.; Kirillov, A.I.; Semenov, N.M.; Domrachev, G.A.; Egorov, V.A.; Gusev, S.A.; et al. NEXAFS Study of the Composite Materials MWCNTs—Pyrolytic Metals by Synchrotron Radiation. Fuller. Nanotub. Carbon Nanostruct. 2015, 23, 17–19. [Google Scholar] [CrossRef]
- Sivkov, V.N.; Ob”edkov, A.M.; Petrova, O.V.; Nekipelov, S.V.; Kremlev, K.V.; Kaverin, B.S.; Semenov, N.M.; Gusev, S.A. X-ray and Synchrotron Investigations of Heterogeneous Systems Based on Multiwalled Carbon Nanotubes. Phys. Solid State 2015, 57, 197–204. [Google Scholar] [CrossRef]
- Petrova, O.V.; Nekipelov, S.V.; Mingaleva, A.E.; Sivkov, V.N.; Obiedkov, A.M.; Kaverin, B.S.; Kremlev, K.V.; Ketkov, S.Y.; Gusev, S.A.; Vyalikh, D.V.; et al. Study of Composite MWCNT/Pyrolytic Cr Interface by NEXAFS Spectroscopy. J. Phys. Conf. Ser. 2016, 741, 012038. [Google Scholar] [CrossRef] [Green Version]
- Sivkov, D.; Petrova, O.; Mingaleva, A.; Ob’’edkov, A.; Kaverin, B.; Gusev, S.; Vilkov, I.; Isaenko, S.; Bogachuk, D.; Skandakov, R.; et al. The Structure and Chemical Composition of the Cr and Fe Pyrolytic Coatings on the MWCNTs’ Surface According to NEXAFS and XPS Spectroscopy. Nanomaterials 2020, 10, 374. [Google Scholar] [CrossRef] [Green Version]
- Kremlev, K.V.; Ob”edkov, A.M.; Ketkov, S.Y.; Kaverin, B.S.; Semenov, N.M.; Gusev, S.A.; Tatarskii, D.A.; Yunin, P.A. Pyrolytic Deposition of Nanostructured Titanium Carbide Coatings on the Surface of Multiwalled Carbon Nanotubes. Tech. Phys. Lett. 2016, 42, 517–519. [Google Scholar] [CrossRef]
- Sivkov, D.; Nekipelov, S.; Petrova, O.; Vinogradov, A.; Mingaleva, A.; Isaenko, S.; Makarov, P.; Ob’’edkov, A.; Kaverin, B.; Gusev, S.; et al. Studies of Buried Layers and Interfaces of Tungsten Carbide Coatings on the MWCNT Surface by XPS and NEXAFS Spectroscopy. Appl. Sci. 2020, 10, 4736. [Google Scholar] [CrossRef]
- Kremlev, K.V.; Obiedkov, A.M.; Ketkov, S.Y.; Kaverin, B.S.; Semenov, N.M.; Domrachev, G.A.; Gusev, S.A.; Tatarskiy, D.A.; Yunin, P.A. New Hybrid Material Based on Multiwalled Carbon Nanotubes Decorated with Rhenium Nanoparticles. J. Synch. Investig. 2015, 9, 694–698. [Google Scholar] [CrossRef]
- Kremlev, K.V.; Obedkov, A.M.; Semenov, N.M.; Kaverin, B.S.; Ketkov, S.Y.; Gusev, S.A.; Yunin, P.A.; Elkin, A.I.; Aborkin, A.V. The Gas-Phase Synthesis of a New Functional Hybrid Material on the Basis of Multiwalled Carbon Nanotubes Decorated with Faceted Aluminum Nanocrystals. Tech. Phys. Lett. 2018, 44, 865–868. [Google Scholar] [CrossRef]
- Kaverin, B.S.; Obiedkov, A.M.; Ketkov, S.Y.; Kremlev, K.V.; Semenov, N.M.; Gusev, S.A.; Tatarskiy, D.A.; Yunin, P.A.; Vilkov, I.V.; Faddeev, M.A. New Hybrid Material Based on Multiwalled Carbon Nanotubes Decorated by Rhenium-Tungsten Nanodendrites. J. Synch. Investig. 2018, 12, 682–687. [Google Scholar] [CrossRef]
- Kadomtseva, A.V.; Vorotyntsev, A.V.; Vorotyntsev, V.M.; Petukhov, A.N.; Ob”edkov, A.M.; Kremlev, K.V.; Kaverin, B.S. Effect of the Catalytic System Based on Multi-Walled Carbon Nanotubes Modified with Copper Nanoparticles on the Kinetics of Catalytic Reduction of Germanium Tetrachloride by Hydrogen. Russ. J. Appl. Chem. 2015, 88, 595–602. [Google Scholar] [CrossRef]
- Zhou, J.; Song, H.; Ma, L.; Chen, X. Magnetite/Graphene Nanosheet Composites: Interfacial Interaction and Its Impact on the Durable High-Rate Performance in Lithium-Ion Batteries. RSC Adv. 2011, 1, 782. [Google Scholar] [CrossRef]
- Zhang, X.; Zhou, J.; Song, H.; Chen, X.; Fedoseeva, Y.V.; Okotrub, A.V.; Bulusheva, L.G. “Butterfly Effect” in CuO/Graphene Composite Nanosheets: A Small Interfacial Adjustment Triggers Big Changes in Electronic Structure and Li-Ion Storage Performance. ACS Appl. Mater. Interfaces 2014, 6, 17236–17244. [Google Scholar] [CrossRef]
- Zhou, G.; Wang, D.-W.; Yin, L.-C.; Li, N.; Li, F.; Cheng, H.-M. Oxygen Bridges between NiO Nanosheets and Graphene for Improvement of Lithium Storage. ACS Nano 2012, 6, 3214–3223. [Google Scholar] [CrossRef]
- Obiedkov, A.M.; Kaverin, B.S.; Egorov, V.A.; Semenov, N.M.; Ketkov, S.Y.; Domrachev, G.A.; Kremlev, K.V.; Gusev, S.A.; Perevezentsev, V.N.; Moskvichev, A.N.; et al. Macroscopic Cylinders on the Basis of Radial-Oriented Multi-Wall Car-Bon Nanotubes. LoM 2012, 2, 152–156. [Google Scholar] [CrossRef]
- Gorovikov, S.A.; Molodtsov, S.L.; Follath, R. Optical Design of the High-Energy Resolution Beamline at a Dipole Magnet of BESSY II. Nucl. Instrum. Methods Phys. Res. Sect. A Accel. Spectrometers Detect. Assoc. Equip. 1998, 411, 506–512. [Google Scholar] [CrossRef]
- Fedoseenko, S.I.; Vyalikh, D.V.; Iossifov, I.E.; Follath, R.; Gorovikov, S.A.; Püttner, R.; Schmidt, J.-S.; Molodtsov, S.L.; Adamchuk, V.K.; Gudat, W.; et al. Commissioning Results and Performance of the High-Resolution Russian–German Beamline at BESSY II. Nucl. Instrum. Methods Phys. Res. Sect. A Accel. Spectrometers Detect. Assoc. Equip. 2003, 505, 718–728. [Google Scholar] [CrossRef]
- Batson, P.E. Carbon 1 s near-Edge-Absorption Fine Structure in Graphite. Phys. Rev. B 1993, 48, 2608–2610. [Google Scholar] [CrossRef]
- Henke, B.L.; Gullikson, E.M.; Davis, J.C. X-ray Interactions: Photoabsorption, Scattering, Transmission, and Reflection at E = 50-30,000 EV, Z = 1-92. At. Data Nucl. Data Tables 1993, 54, 181–342. [Google Scholar] [CrossRef] [Green Version]
- Kummer, K.; Sivkov, V.N.; Vyalikh, D.V.; Maslyuk, V.V.; Blüher, A.; Nekipelov, S.V.; Bredow, T.; Mertig, I.; Mertig, M.; Molodtsov, S.L. Oscillator Strength of the Peptide Bond π* Resonances at All Relevant X-ray Absorption Edges. Phys. Rev. B 2009, 80, 155433. [Google Scholar] [CrossRef]
- Ferrari, A.C.; Robertson, J. Interpretation of Raman Spectra of Disordered and Amorphous Carbon. Phys. Rev. B 2000, 61, 14095–14107. [Google Scholar] [CrossRef] [Green Version]
- Kundu, S.; Wang, Y.; Xia, W.; Muhler, M. Thermal Stability and Reducibility of Oxygen-Containing Functional Groups on Multiwalled Carbon Nanotube Surfaces: A Quantitative High-Resolution XPS and TPD/TPR Study. J. Phys. Chem. C 2008, 112, 16869–16878. [Google Scholar] [CrossRef]
- Banerjee, S.; Hemraj-Benny, T.; Balasubramanian, M.; Fischer, D.A.; Misewich, J.A.; Wong, S.S. Surface Chemistry and Structure of Purified, Ozonized, Multiwalled Carbon Nanotubes Probed by NEXAFS and Vibrational Spectroscopies. ChemPhysChem 2004, 5, 1416–1422. [Google Scholar] [CrossRef] [PubMed]
- Banerjee, S.; Hemraj-Benny, T.; Sambasivan, S.; Fischer, D.A.; Misewich, J.A.; Wong, S.S. Near-Edge X-ray Absorption Fine Structure Investigations of Order in Carbon Nanotube-Based Systems. J. Phys. Chem. B 2005, 109, 8489–8495. [Google Scholar] [CrossRef] [PubMed]
- Tran, N.H.; Wilson, M.A.; Milev, A.S.; Bartlett, J.R.; Lamb, R.N.; Martin, D.; Kannangara, G.S.K. Photoemission and Absorption Spectroscopy of Carbon Nanotube Interfacial Interaction. Adv. Colloid Interface Sci. 2009, 145, 23–41. [Google Scholar] [CrossRef] [PubMed]
- Jeong, H.-K.; Noh, H.-J.; Kim, J.-Y.; Jin, M.H.; Park, C.Y.; Lee, Y.H. X-ray Absorption Spectroscopy of Graphite Oxide. Europhys. Lett. 2008, 82, 67004. [Google Scholar] [CrossRef] [Green Version]
- Kaznacheyev, K.; Osanna, A.; Jacobsen, C.; Plashkevych, O.; Vahtras, O.; Ågren, H.; Carravetta, V.; Hitchcock, A.P. Innershell Absorption Spectroscopy of Amino Acids. J. Phys. Chem. A 2002, 106, 3153–3168. [Google Scholar] [CrossRef]
- Gong, Y.S.; Lee, C.; Yang, C.K. Atomic Force Microscopy and Raman Spectroscopy Studies on the Oxidation of Cu Thin Films. J. Appl. Phys. 1995, 77, 5422–5425. [Google Scholar] [CrossRef]
- Xu, J.F.; Ji, W.; Shen, Z.X.; Li, W.S.; Tang, S.H.; Ye, X.R.; Jia, D.Z.; Xin, X.Q. Raman Spectra of CuO Nanocrystals. J. Raman Spectrosc. 1999, 30, 413–415. [Google Scholar] [CrossRef]
- Niaura, G. Surface-Enhanced Raman Spectroscopic Observation of Two Kinds of Adsorbed OH-Ions at Copper Electrode. Electrochim. Acta 2000, 45, 3507–3519. [Google Scholar] [CrossRef]
- Sahai, A.; Goswami, N.; Kaushik, S.D.; Tripathi, S. Cu/Cu2O/CuO Nanoparticles: Novel Synthesis by Exploding Wire Technique and Extensive Characterization. Appl. Surf. Sci. 2016, 390, 974–983. [Google Scholar] [CrossRef]
- Rividi, N.; van Zuilen, M.; Philippot, P.; Ménez, B.; Godard, G.; Poidatz, E. Calibration of Carbonate Composition Using Micro-Raman Analysis: Application to Planetary Surface Exploration. Astrobiology 2010, 10, 293–309. [Google Scholar] [CrossRef] [Green Version]
- Merad, L.; Cochez, M.; Margueron, S.; Jauchem, F.; Ferriol, M.; Benyoucef, B.; Bourson, P. In-Situ Monitoring of the Curing of Epoxy Resins by Raman Spectroscopy. Polym. Test. 2009, 28, 42–45. [Google Scholar] [CrossRef] [Green Version]
- Mabayoje, O.; Seredych, M.; Bandosz, T.J. Enhanced Reactive Adsorption of Hydrogen Sulfide on the Composites of Graphene/Graphite Oxide with Copper (Hydr)Oxychlorides. ACS Appl. Mater. Interfaces 2012, 4, 3316–3324. [Google Scholar] [CrossRef] [PubMed]
- Kuznetsova, A.; Popova, I.; Yates, J.T.; Bronikowski, M.J.; Huffman, C.B.; Liu, J.; Smalley, R.E.; Hwu, H.H.; Chen, J.G. Oxygen-Containing Functional Groups on Single-Wall Carbon Nanotubes: NEXAFS and Vibrational Spectroscopic Studies. J. Am. Chem. Soc. 2001, 123, 10699–10704. [Google Scholar] [CrossRef]
- Madix, R.J.; Solomon, J.L.; Stöhr, J. The Orientation of the Carbonate Anion on Ag(110). Surf. Sci. 1988, 197, L253–L259. [Google Scholar] [CrossRef]
- Ikeura-Sekiguchi, H.; Sekiguchi, T. Adsorption Structure of Formic Acid on Si(100) Studied by Surface NEXAFS. Surf. Sci. 1999, 433–435, 549–553. [Google Scholar] [CrossRef]
- Lehmann, J.; Solomon, D.; Brandes, J.; Fleckenstein, H.; Jacobson, C.; Thieme, J. Synchrotron-Based Near-Edge X-ray Spectroscopy of Natural Organic Matter in Soils and Sediments. In Biophysico-Chemical Processes Involving Natural Nonliving Organic Matter in Environmental Systems; Senesi, N., Xing, B., Huang, P.M., Eds.; John Wiley & Sons: Hoboken, NJ, USA, 2009; pp. 729–781. ISBN 978-0-470-49495-0. [Google Scholar]
- Ganguly, A.; Sharma, S.; Papakonstantinou, P.; Hamilton, J. Probing the Thermal Deoxygenation of Graphene Oxide Using High-Resolution In Situ X-ray-Based Spectroscopies. J. Phys. Chem. C 2011, 115, 17009–17019. [Google Scholar] [CrossRef] [Green Version]
- De Jesus, L.R.; Dennis, R.V.; Depner, S.W.; Jaye, C.; Fischer, D.A.; Banerjee, S. Inside and Outside: X-ray Absorption Spectroscopy Mapping of Chemical Domains in Graphene Oxide. J. Phys. Chem. Lett. 2013, 4, 3144–3151. [Google Scholar] [CrossRef] [PubMed]
- Seah, M.P.; Dench, W.A. Quantitative Electron Spectroscopy of Surfaces: A Standard Data Base for Electron Inelastic Mean Free Paths in Solids. Surf. Interface Anal. 1979, 1, 2–11. [Google Scholar] [CrossRef]
- Dhez, O.; Ade, H.; Urquhart, S.G. Calibrated NEXAFS Spectra of Some Common Polymers. J. Electron. Spectrosc. Relat. Phenom. 2003, 128, 85–96. [Google Scholar] [CrossRef]
- Rawat, P.S.; Srivastava, R.C.; Dixit, G.; Asokan, K. Structural, Functional and Magnetic Ordering Modifications in Graphene Oxide and Graphite by 100 MeV Gold Ion Irradiation. Vacuum 2020, 182, 109700. [Google Scholar] [CrossRef]
- Chen, J.G. NEXAFS Investigations of Transition Metal Oxides, Nitrides, Carbides, Sulfides and Other Interstitial Compounds. Surf. Sci. Rep. 1997, 30, 1–152. [Google Scholar] [CrossRef]
- Vasquez, R.P. CuCO 3 by XPS. Surf. Sci. Spectra 1998, 5, 273–278. [Google Scholar] [CrossRef]
- Chang, C.; Kim, Y.; Schrott, A.G. Adhesion Studies of Metals on Fluorocarbon Polymer Films. J. Vac. Sci. Technol. A Vac. Surf. Film. 1990, 8, 3304–3309. [Google Scholar] [CrossRef]
- Arp, U.; Iemura, K.; Kutluk, G.; Meyer, M.; Nagata, T.; Sacchi, M.; Sonntag, B.; Yagi, S.; Yagishita, A. 2p Absorption Spectra of Atomic Copper Using the Soft X-ray Absorption and Total Photoion Yield Methods. J. Phys. B At. Mol. Opt. Phys. 1994, 27, 3389–3398. [Google Scholar] [CrossRef]
- Karaziya, R.I. Excited Electron Orbit Collapse and Atomic Spectra. Sov. Phys. Usp. 1981, 24, 775–794. [Google Scholar] [CrossRef]
- Moulder, J.F.; Stickle, W.F.; Sobol, P.E.; Bomben, K.D. Handbook of X-ray Photoelectron Spectroscopy: A Reference Book of Standard Spectra for Identification and Interpretation of XPS Data; Physical Electronics Division: Eden Prairie, MN, USA, 1995. [Google Scholar]
- Barreca, D.; Gasparotto, A.; Tondello, E. CVD Cu 2 O and CuO Nanosystems Characterized by XPS. Surf. Sci. Spectra 2007, 14, 41–51. [Google Scholar] [CrossRef]
- Ebert, H.; Stöhr, J.; Parkin, S.S.P.; Samant, M.; Nilsson, A. L-Edge X-ray Absorption in Fcc and Bcc Cu Metal: Comparison of Experimental and First-Principles Theoretical Results. Phys. Rev. B 1996, 53, 16067–16073. [Google Scholar] [CrossRef] [PubMed]
- Grioni, M.; Goedkoop, J.B.; Schoorl, R.; de Groot, F.M.F.; Fuggle, J.C.; Schäfers, F.; Koch, E.E.; Rossi, G.; Esteva, J.-M.; Karnatak, R.C. Studies of Copper Valence States with Cu L3 X-ray-Absorption Spectroscopy. Phys. Rev. B 1989, 39, 1541–1545. [Google Scholar] [CrossRef]
- Biesinger, M.C. Advanced Analysis of Copper X-ray Photoelectron Spectra: Advanced Analysis of Copper X-ray Photoelectron Spectra. Surf. Interface Anal. 2017, 49, 1325–1334. [Google Scholar] [CrossRef]
- Grioni, M.; van Acker, J.F.; Czyžyk, M.T.; Fuggle, J.C. Unoccupied Electronic Structure and Core-Hole Effects in the x-Ray-Absorption Spectra of Cu2O. Phys. Rev. B 1992, 45, 3309–3318. [Google Scholar] [CrossRef] [PubMed]
- Platzman, I.; Brener, R.; Haick, H.; Tannenbaum, R. Oxidation of Polycrystalline Copper Thin Films at Ambient Conditions. J. Phys. Chem. C 2008, 112, 1101–1108. [Google Scholar] [CrossRef]
- Hurley, B.L.; McCreery, R.L. Covalent Bonding of Organic Molecules to Cu and Al Alloy 2024 T3 Surfaces via Diazonium Ion Reduction. J. Electrochem. Soc. 2004, 151, B252. [Google Scholar] [CrossRef] [Green Version]
- Lee, D.W.; De Los Santos, L.V.; Seo, J.W.; Felix, L.L.; Bustamante, D.A.; Cole, J.M.; Barnes, C.H.W. The Structure of Graphite Oxide: Investigation of Its Surface Chemical Groups. J. Phys. Chem. B 2010, 114, 5723–5728. [Google Scholar] [CrossRef] [PubMed] [Green Version]
- Liang, X.; Wang, Y.; Zheng, H.; Wu, Z. X-ray Absorption Spectroscopy Study on the Thermal and Hydrazine Reduction of Graphene Oxide. J. Electron. Spectrosc. Relat. Phenom. 2014, 196, 89–93. [Google Scholar] [CrossRef]
- Francis, J.T.; Hitchcock, A.P. Inner-Shell Spectroscopy of p-Benzoquinone, Hydroquinone, and Phenol: Distinguishing Quinoid and Benzenoid Structures. J. Phys. Chem. 1992, 96, 6598–6610. [Google Scholar] [CrossRef]
- Pacilé, D.; Meyer, J.C.; Fraile Rodríguez, A.; Papagno, M.; Gómez-Navarro, C.; Sundaram, R.S.; Burghard, M.; Kern, K.; Carbone, C.; Kaiser, U. Electronic Properties and Atomic Structure of Graphene Oxide Membranes. Carbon 2011, 49, 966–972. [Google Scholar] [CrossRef]
- Ghijsen, J.; Tjeng, L.H.; van Elp, J.; Eskes, H.; Westerink, J.; Sawatzky, G.A.; Czyzyk, M.T. Electronic Structure of Cu2O and CuO. Phys. Rev. B 1988, 38, 11322–11330. [Google Scholar] [CrossRef]
- Combellas, C.; Delamar, M.; Kanoufi, F.; Pinson, J.; Podvorica, F.I. Spontaneous Grafting of Iron Surfaces by Reduction of Aryldiazonium Salts in Acidic or Neutral Aqueous Solution. Application to the Protection of Iron against Corrosion. Chem. Mater. 2005, 17, 3968–3975. [Google Scholar] [CrossRef]


Publisher’s Note: MDPI stays neutral with regard to jurisdictional claims in published maps and institutional affiliations. |
© 2021 by the authors. Licensee MDPI, Basel, Switzerland. This article is an open access article distributed under the terms and conditions of the Creative Commons Attribution (CC BY) license (https://creativecommons.org/licenses/by/4.0/).
Share and Cite
Sivkov, D.V.; Petrova, O.V.; Nekipelov, S.V.; Vinogradov, A.S.; Skandakov, R.N.; Isaenko, S.I.; Ob’edkov, A.M.; Kaverin, B.S.; Vilkov, I.V.; Korolev, R.I.; et al. The Identification of Cu–O–C Bond in Cu/MWCNTs Hybrid Nanocomposite by XPS and NEXAFS Spectroscopy. Nanomaterials 2021, 11, 2993. https://0-doi-org.brum.beds.ac.uk/10.3390/nano11112993
Sivkov DV, Petrova OV, Nekipelov SV, Vinogradov AS, Skandakov RN, Isaenko SI, Ob’edkov AM, Kaverin BS, Vilkov IV, Korolev RI, et al. The Identification of Cu–O–C Bond in Cu/MWCNTs Hybrid Nanocomposite by XPS and NEXAFS Spectroscopy. Nanomaterials. 2021; 11(11):2993. https://0-doi-org.brum.beds.ac.uk/10.3390/nano11112993
Chicago/Turabian StyleSivkov, Danil V., Olga V. Petrova, Sergey V. Nekipelov, Alexander S. Vinogradov, Roman N. Skandakov, Sergey I. Isaenko, Anatoly M. Ob’edkov, Boris S. Kaverin, Ilya V. Vilkov, Roman I. Korolev, and et al. 2021. "The Identification of Cu–O–C Bond in Cu/MWCNTs Hybrid Nanocomposite by XPS and NEXAFS Spectroscopy" Nanomaterials 11, no. 11: 2993. https://0-doi-org.brum.beds.ac.uk/10.3390/nano11112993