
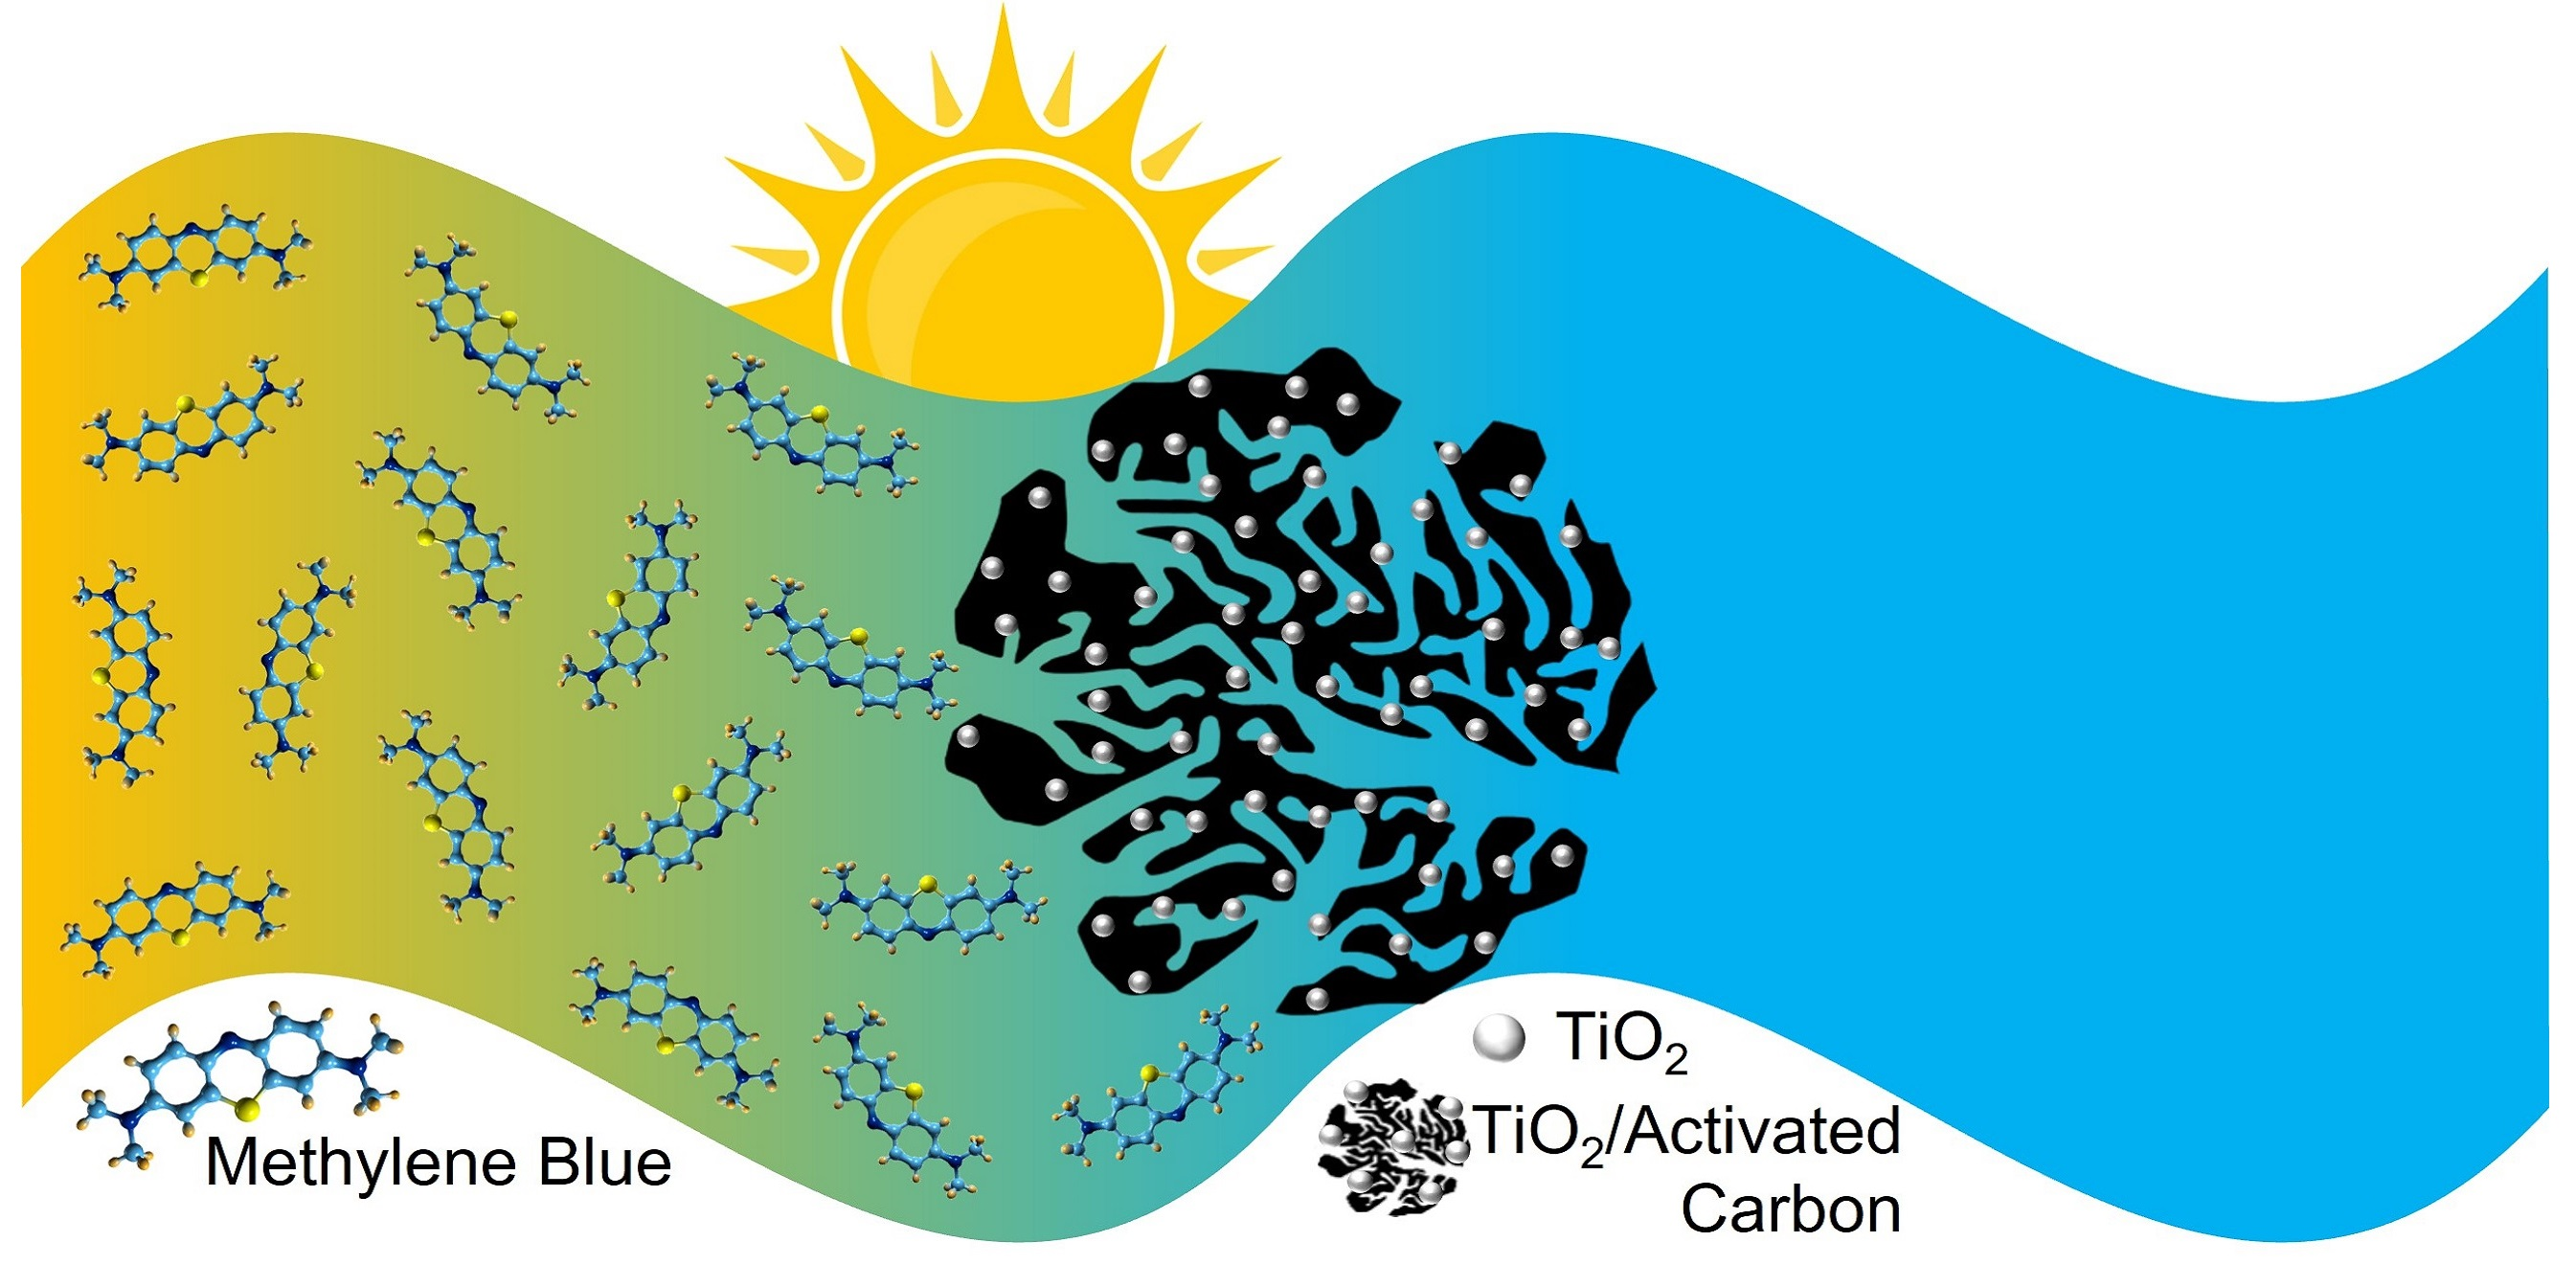
Solar Light-Induced Methylene Blue Removal over TiO2/AC Composites and Photocatalytic Regeneration


 , ,
, ,
Abstract
:
1. Introduction
2. Materials and Methods
2.1. Materials, Reagents and Solvents
2.2. Preparation of the Activated Carbon
2.3. Preparation of the TiO2 Nanoparticles
2.4. Preparation of TiO2/AC Catalysts
2.5. Methods
2.6. Adsorption and Photocatalytic Performance Tests
3. Results and Discussion
3.1. Characterization of Materials
3.2. Evaluation of Adsorption and Photocatalytic Activity of TiAC Composites over Simulated Solar Light
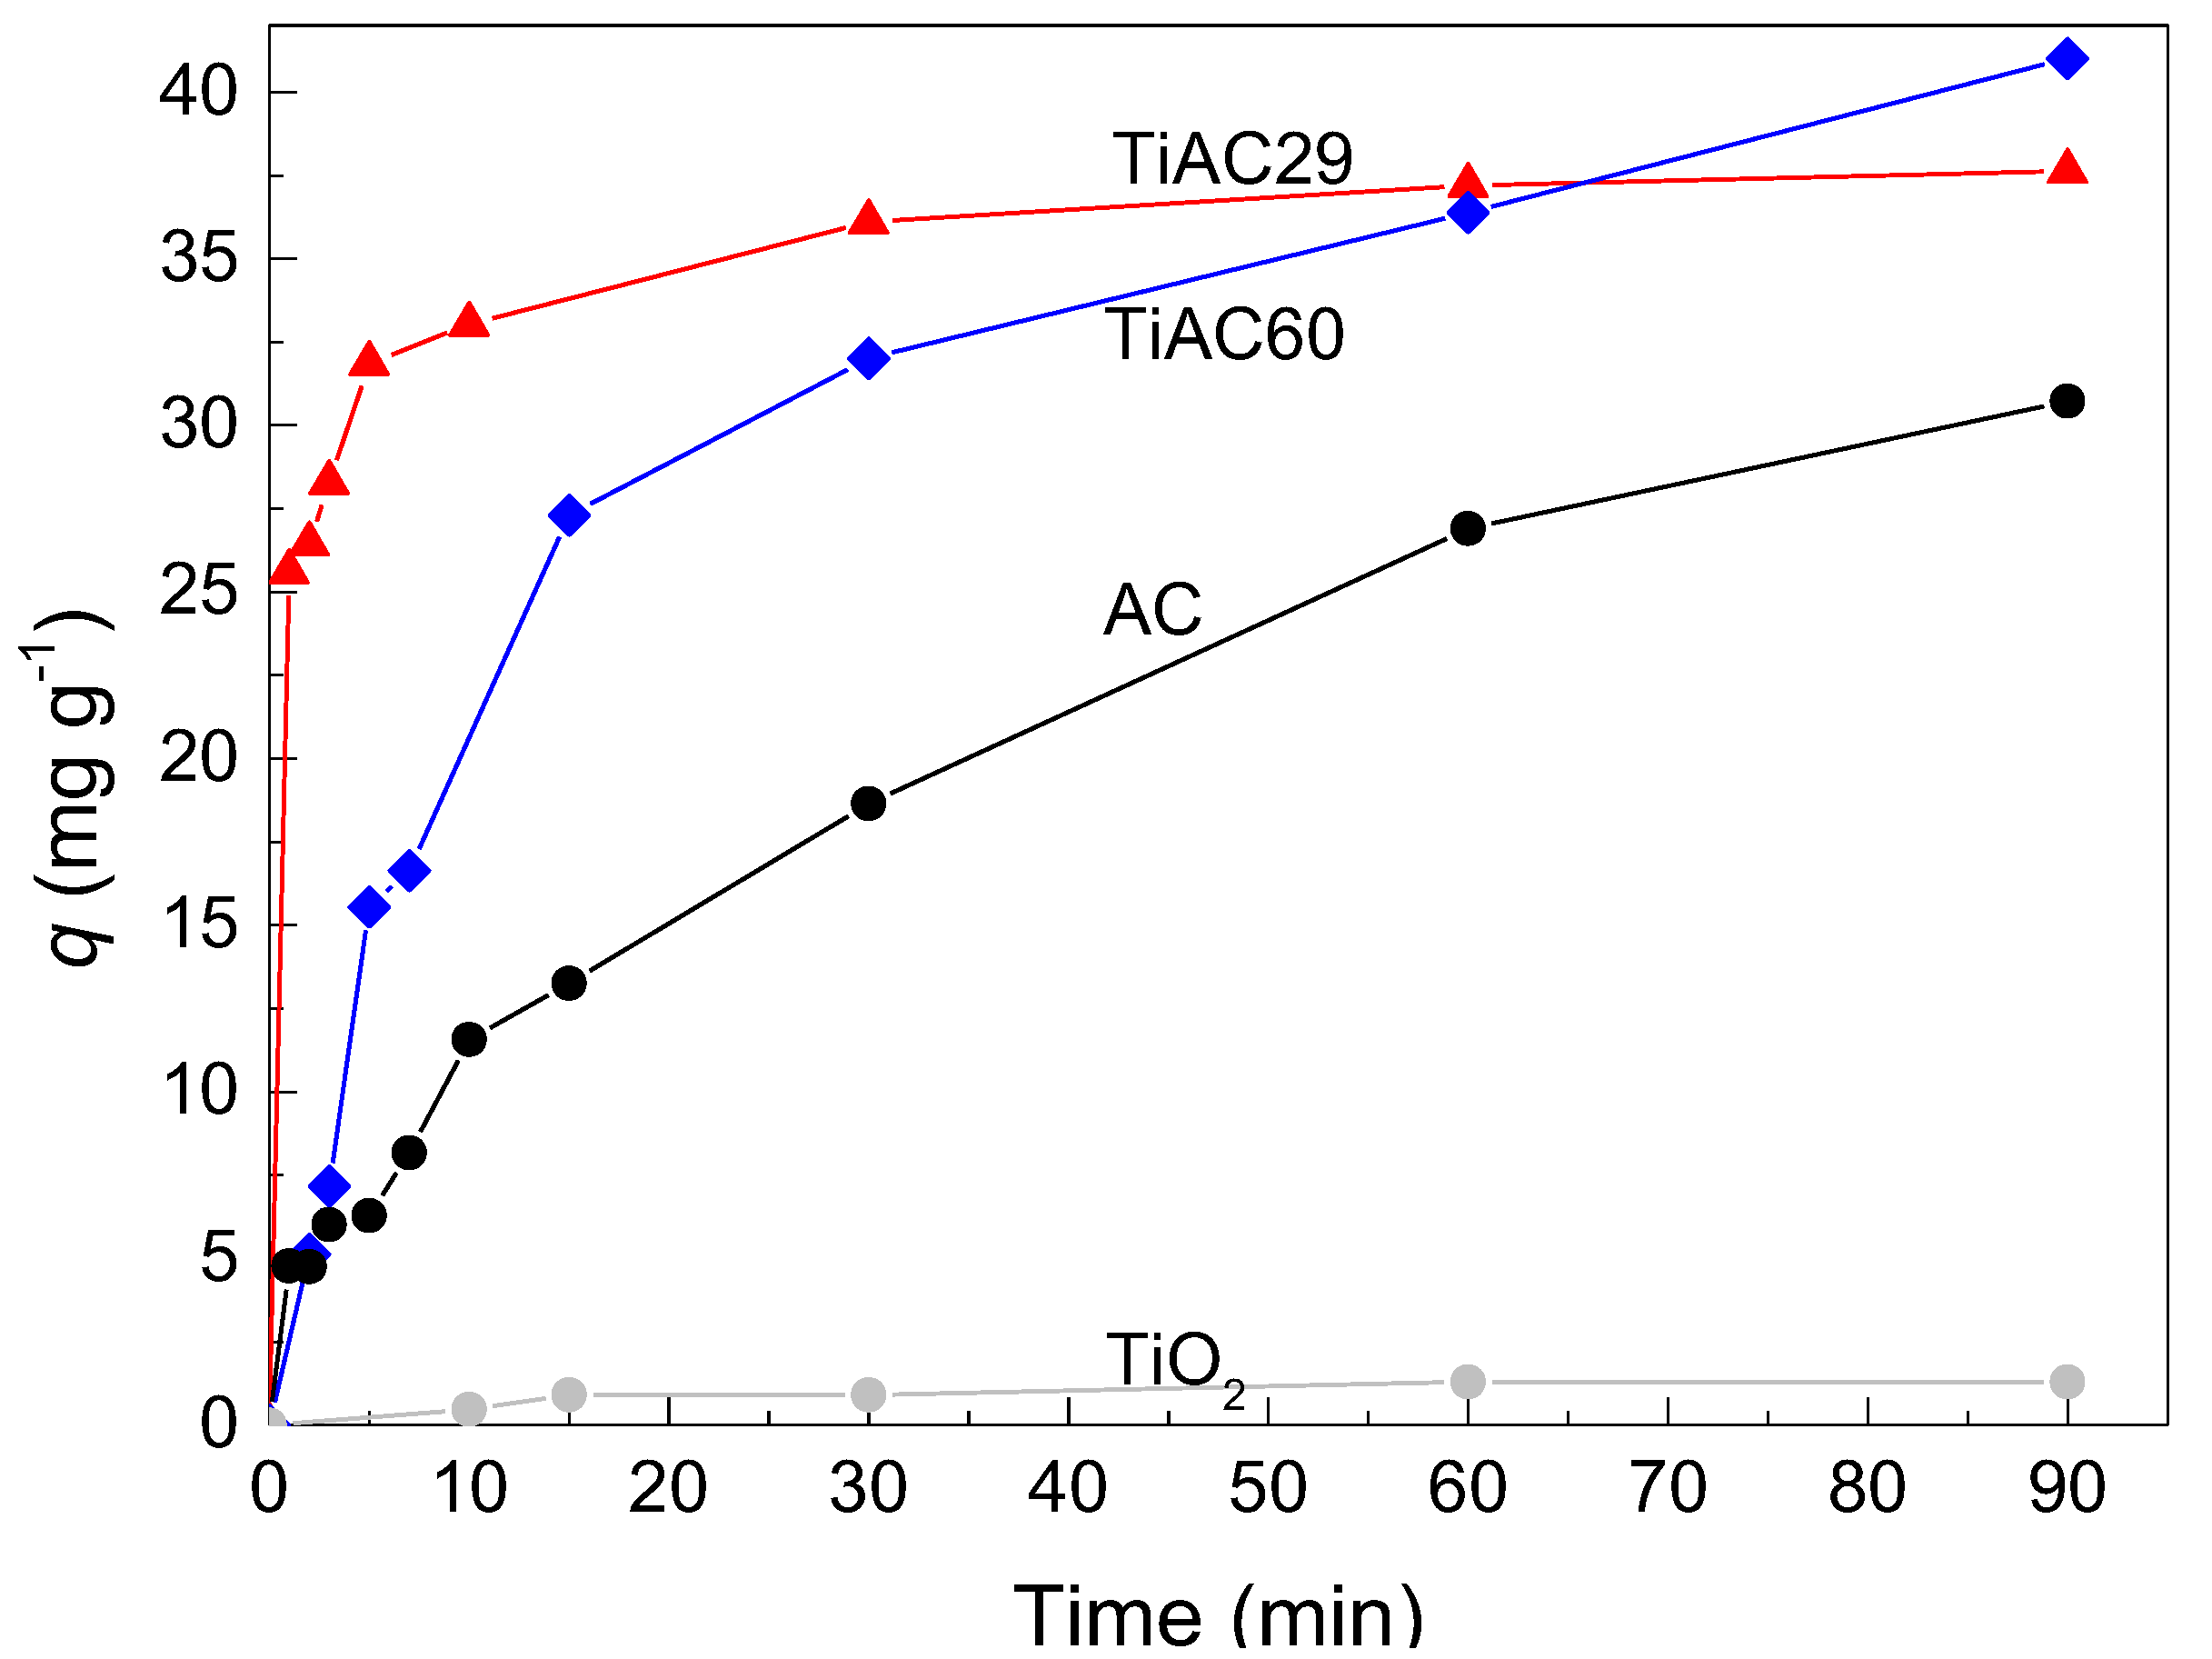
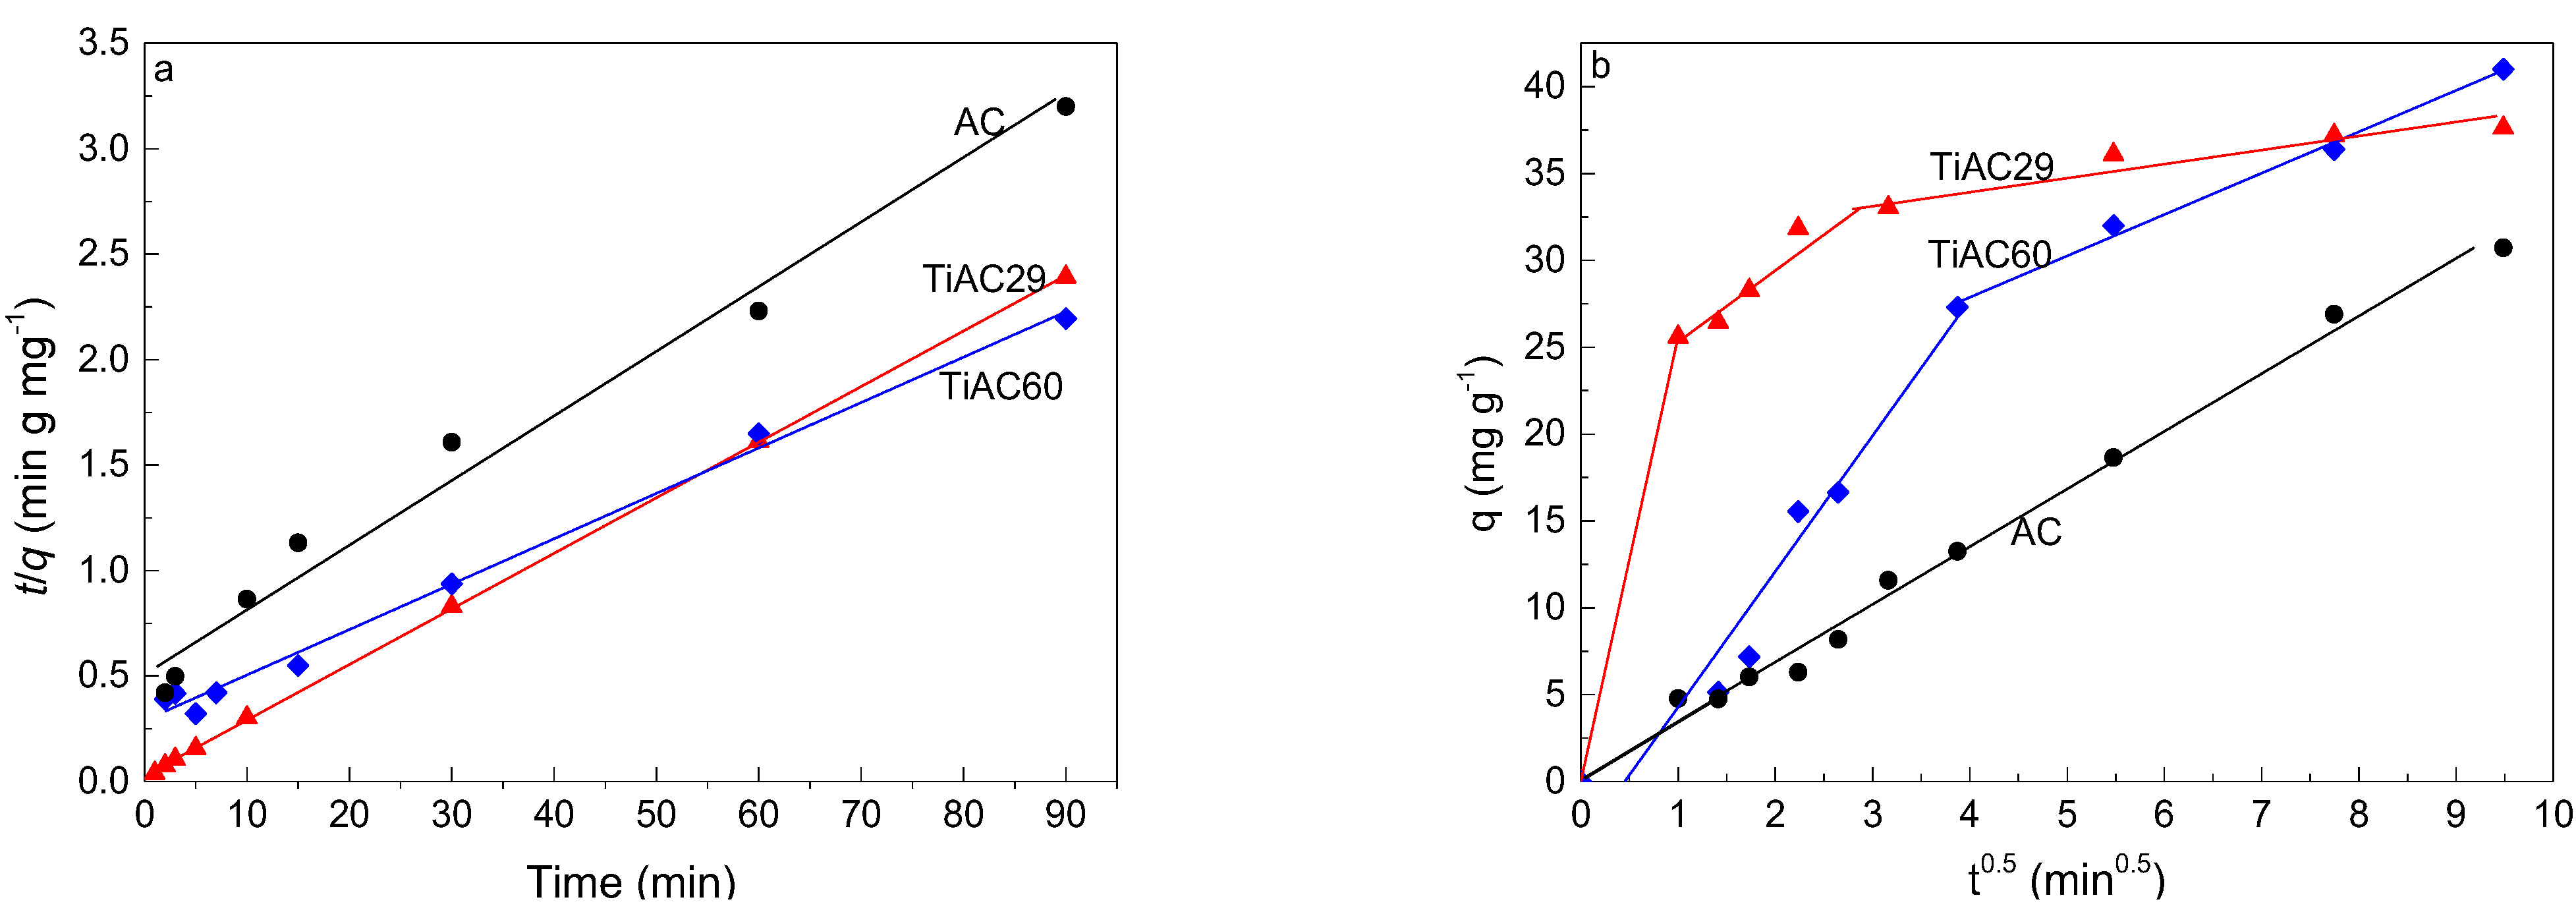
3.2.1. Adsorption Studies
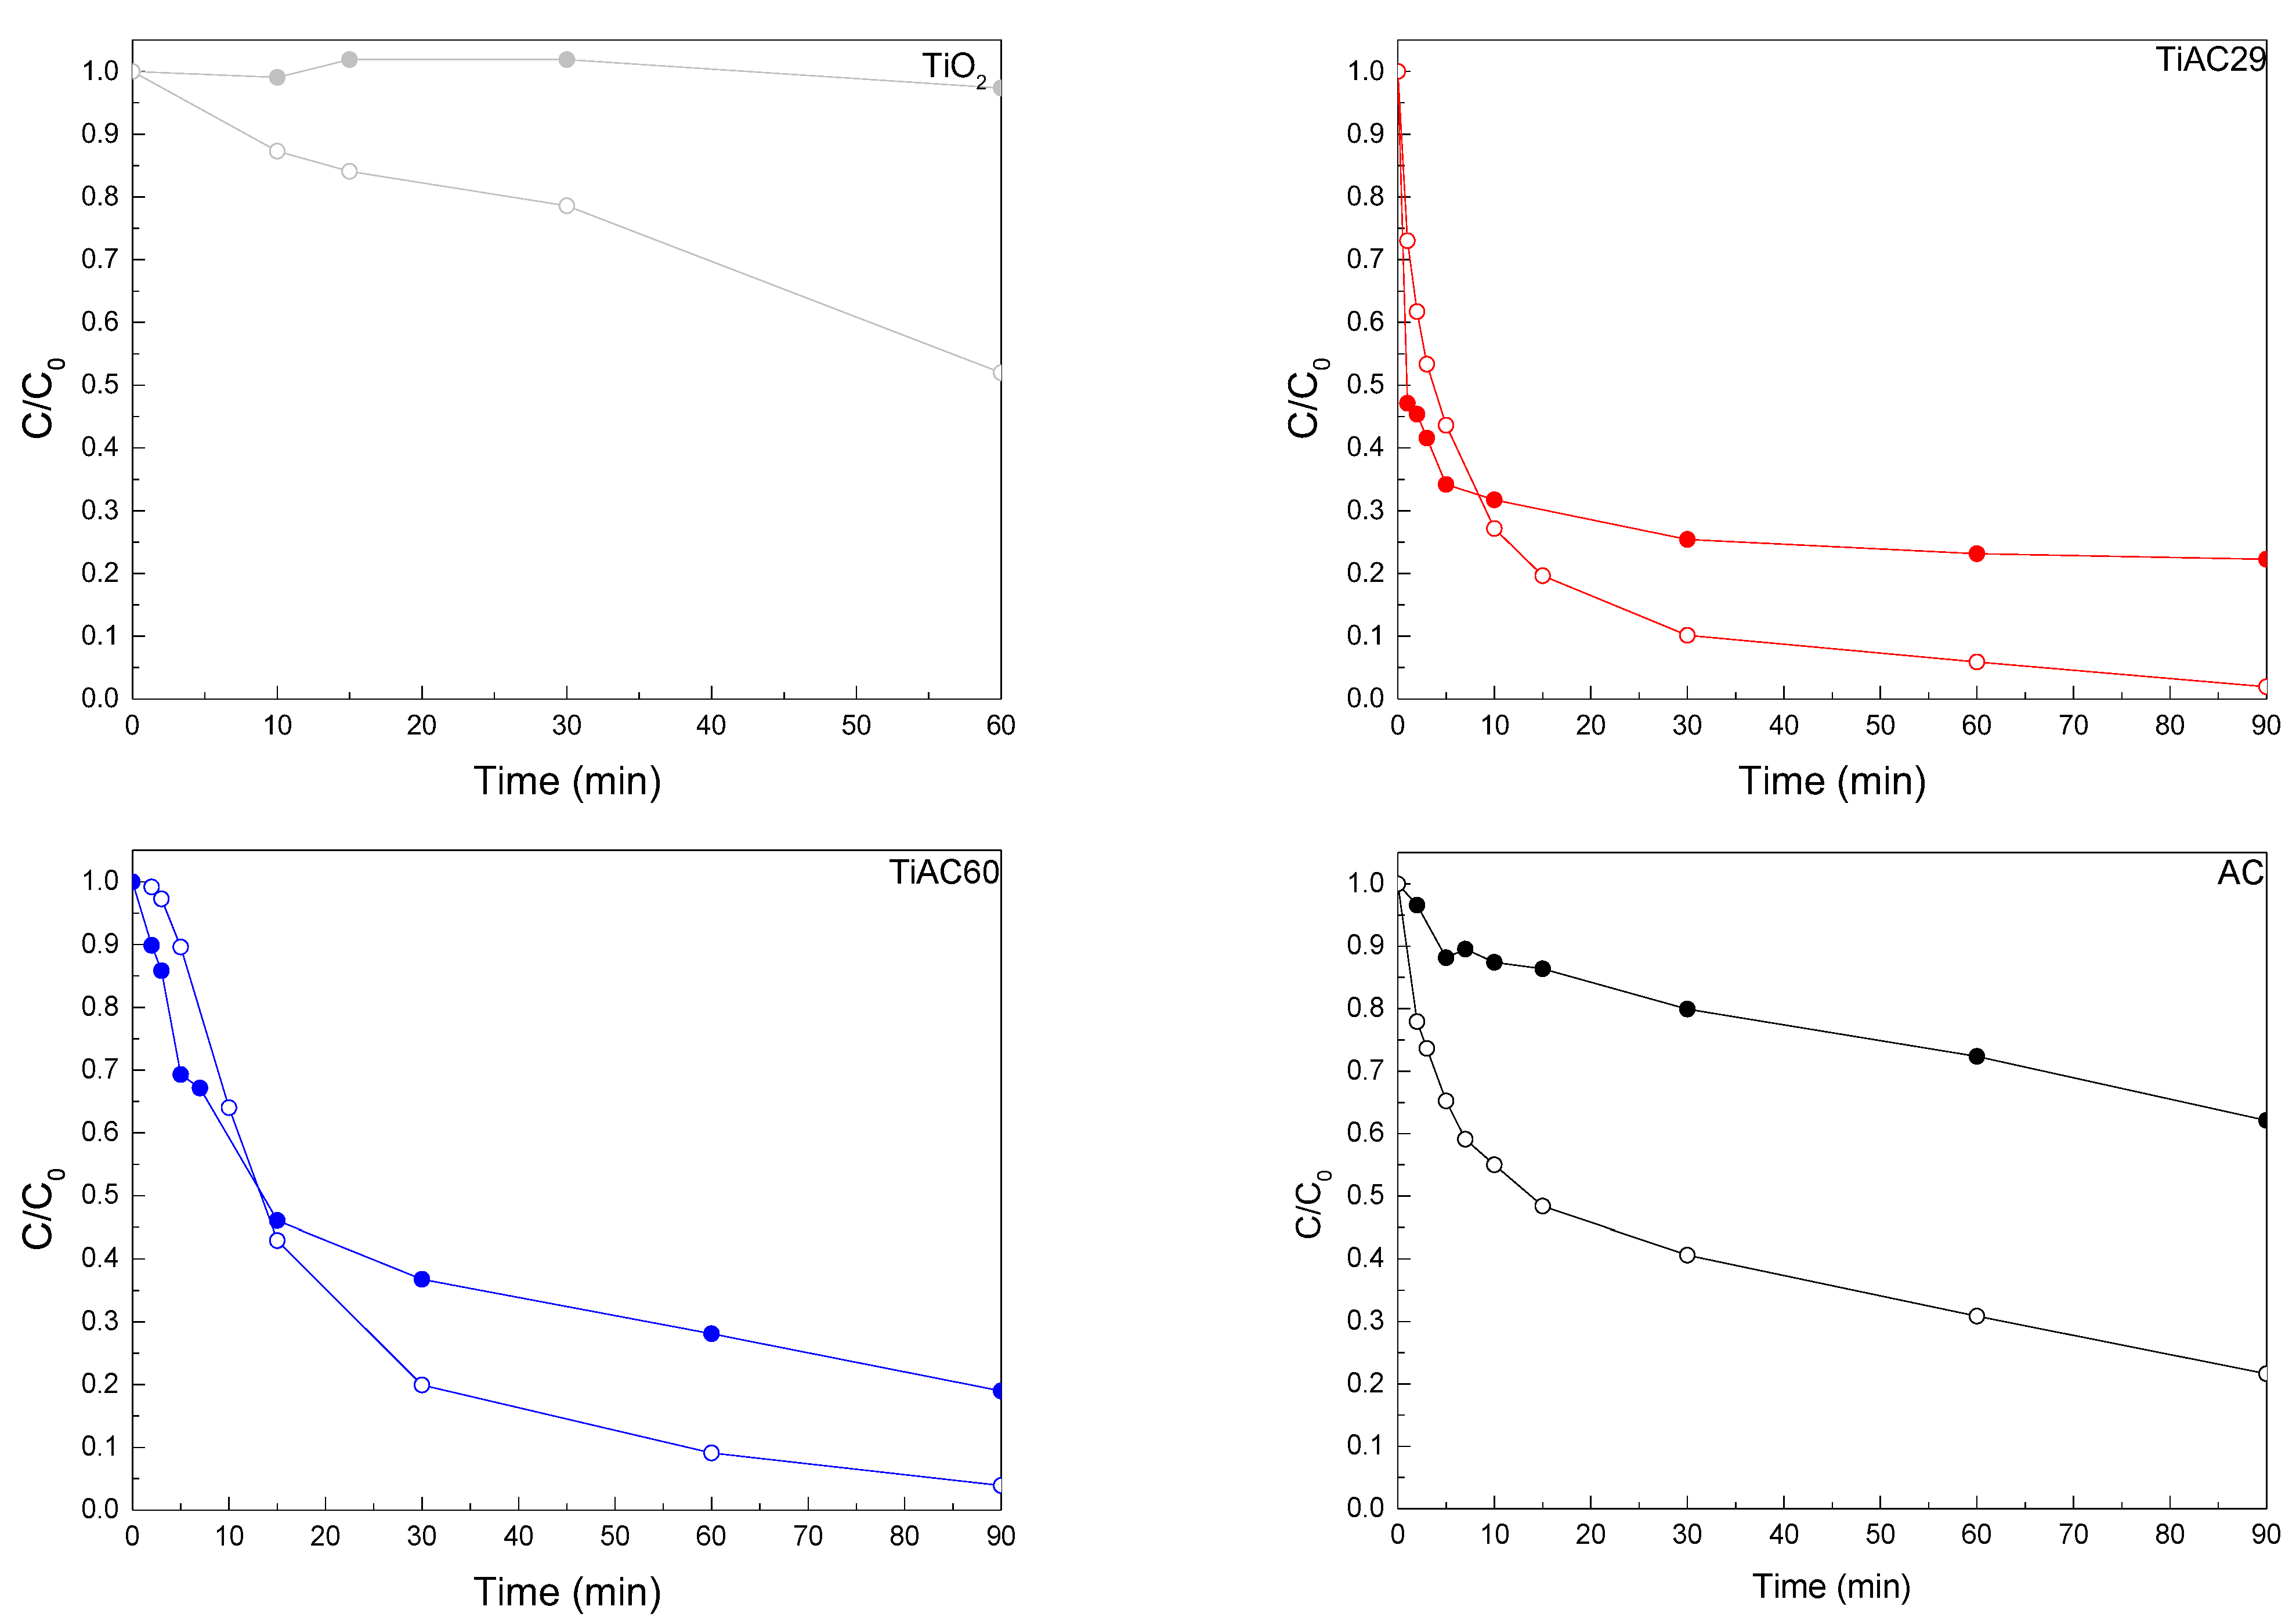
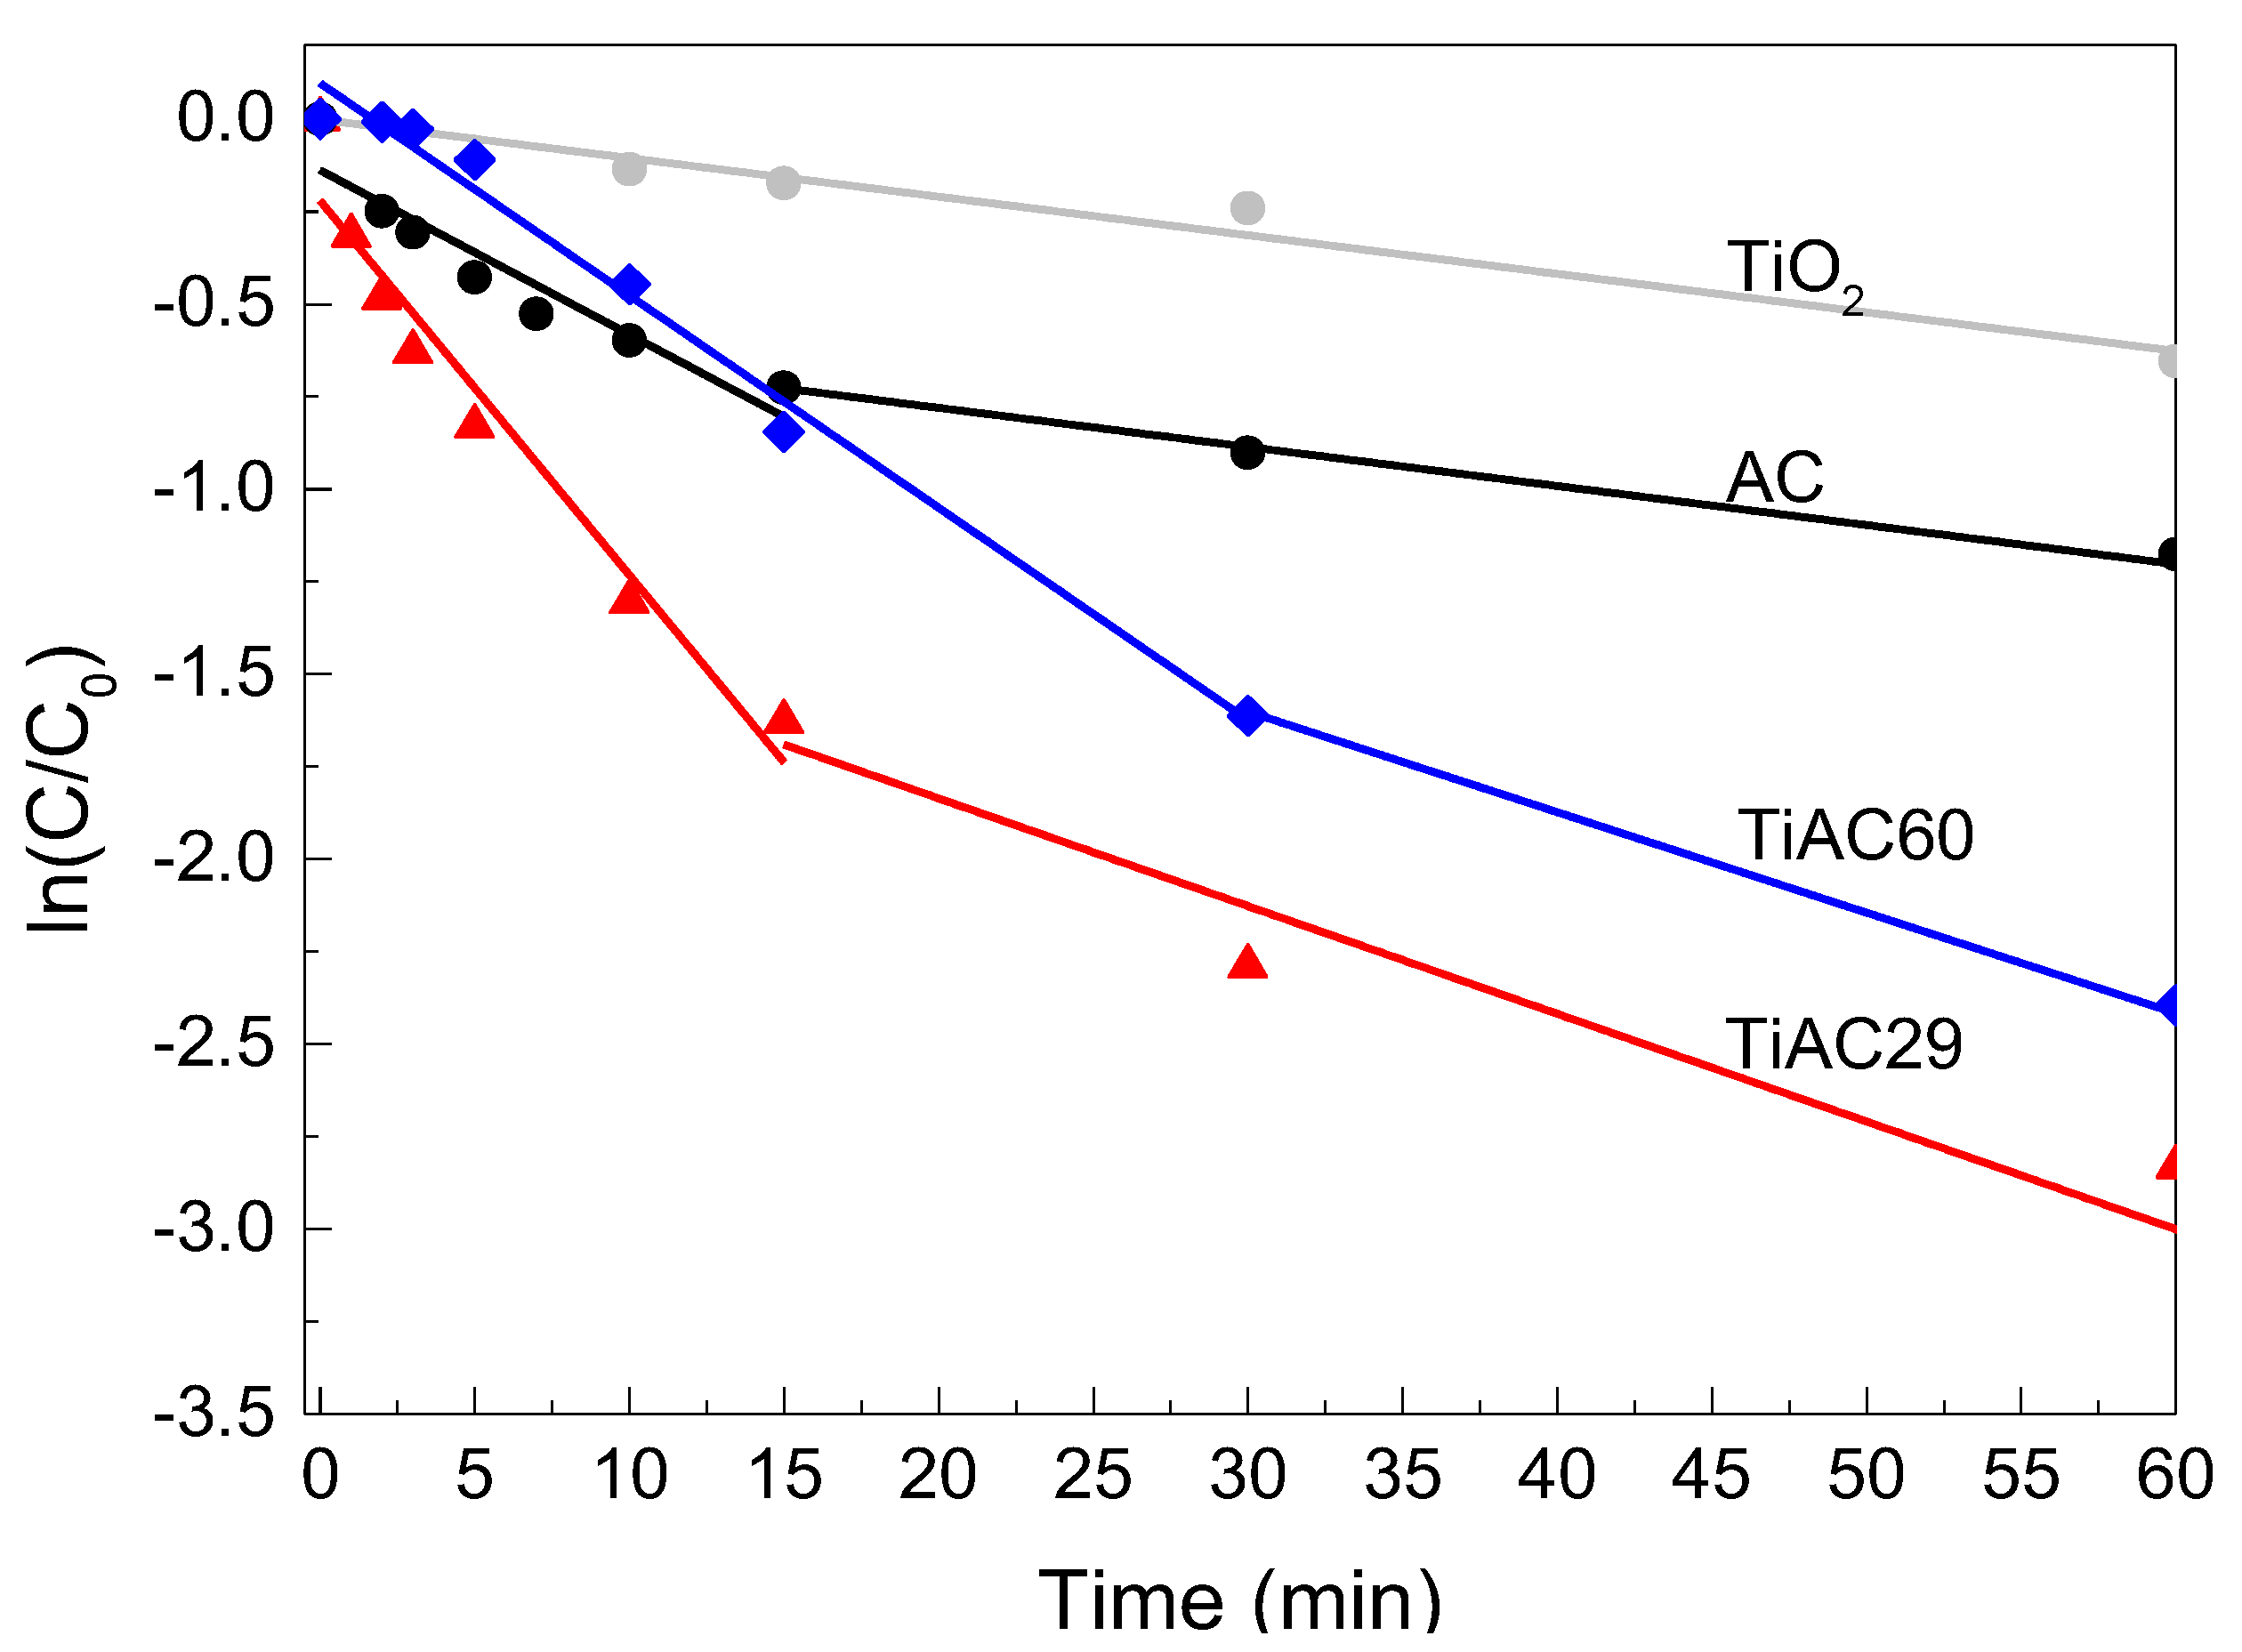
3.2.2. Combined Adsorption and Photocatalytic Process
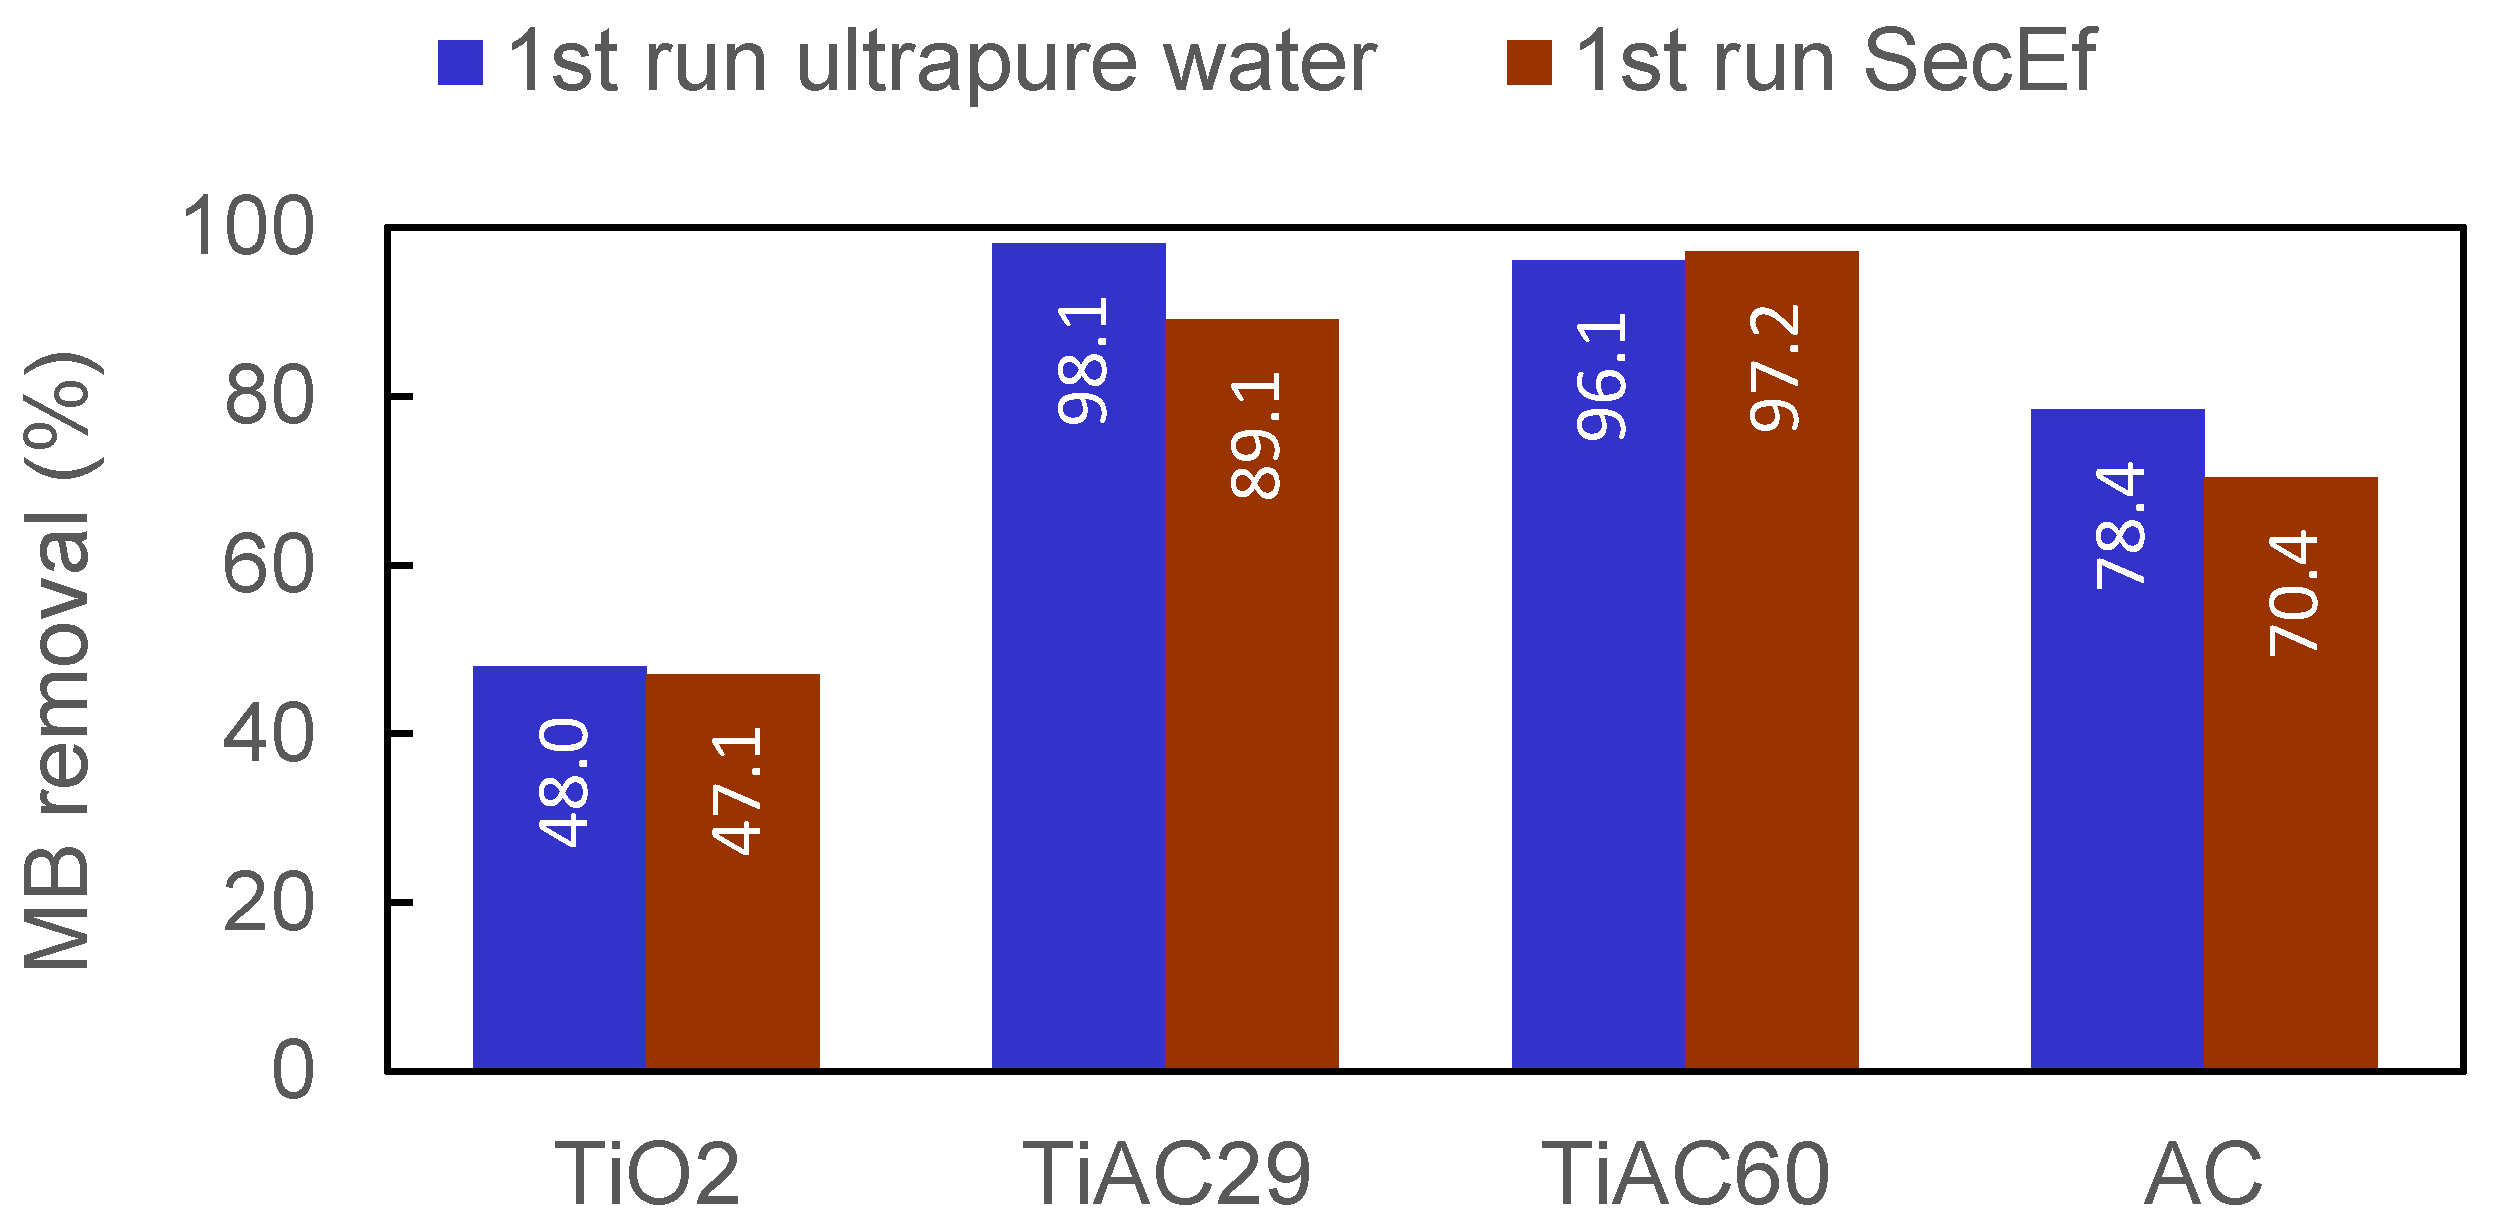
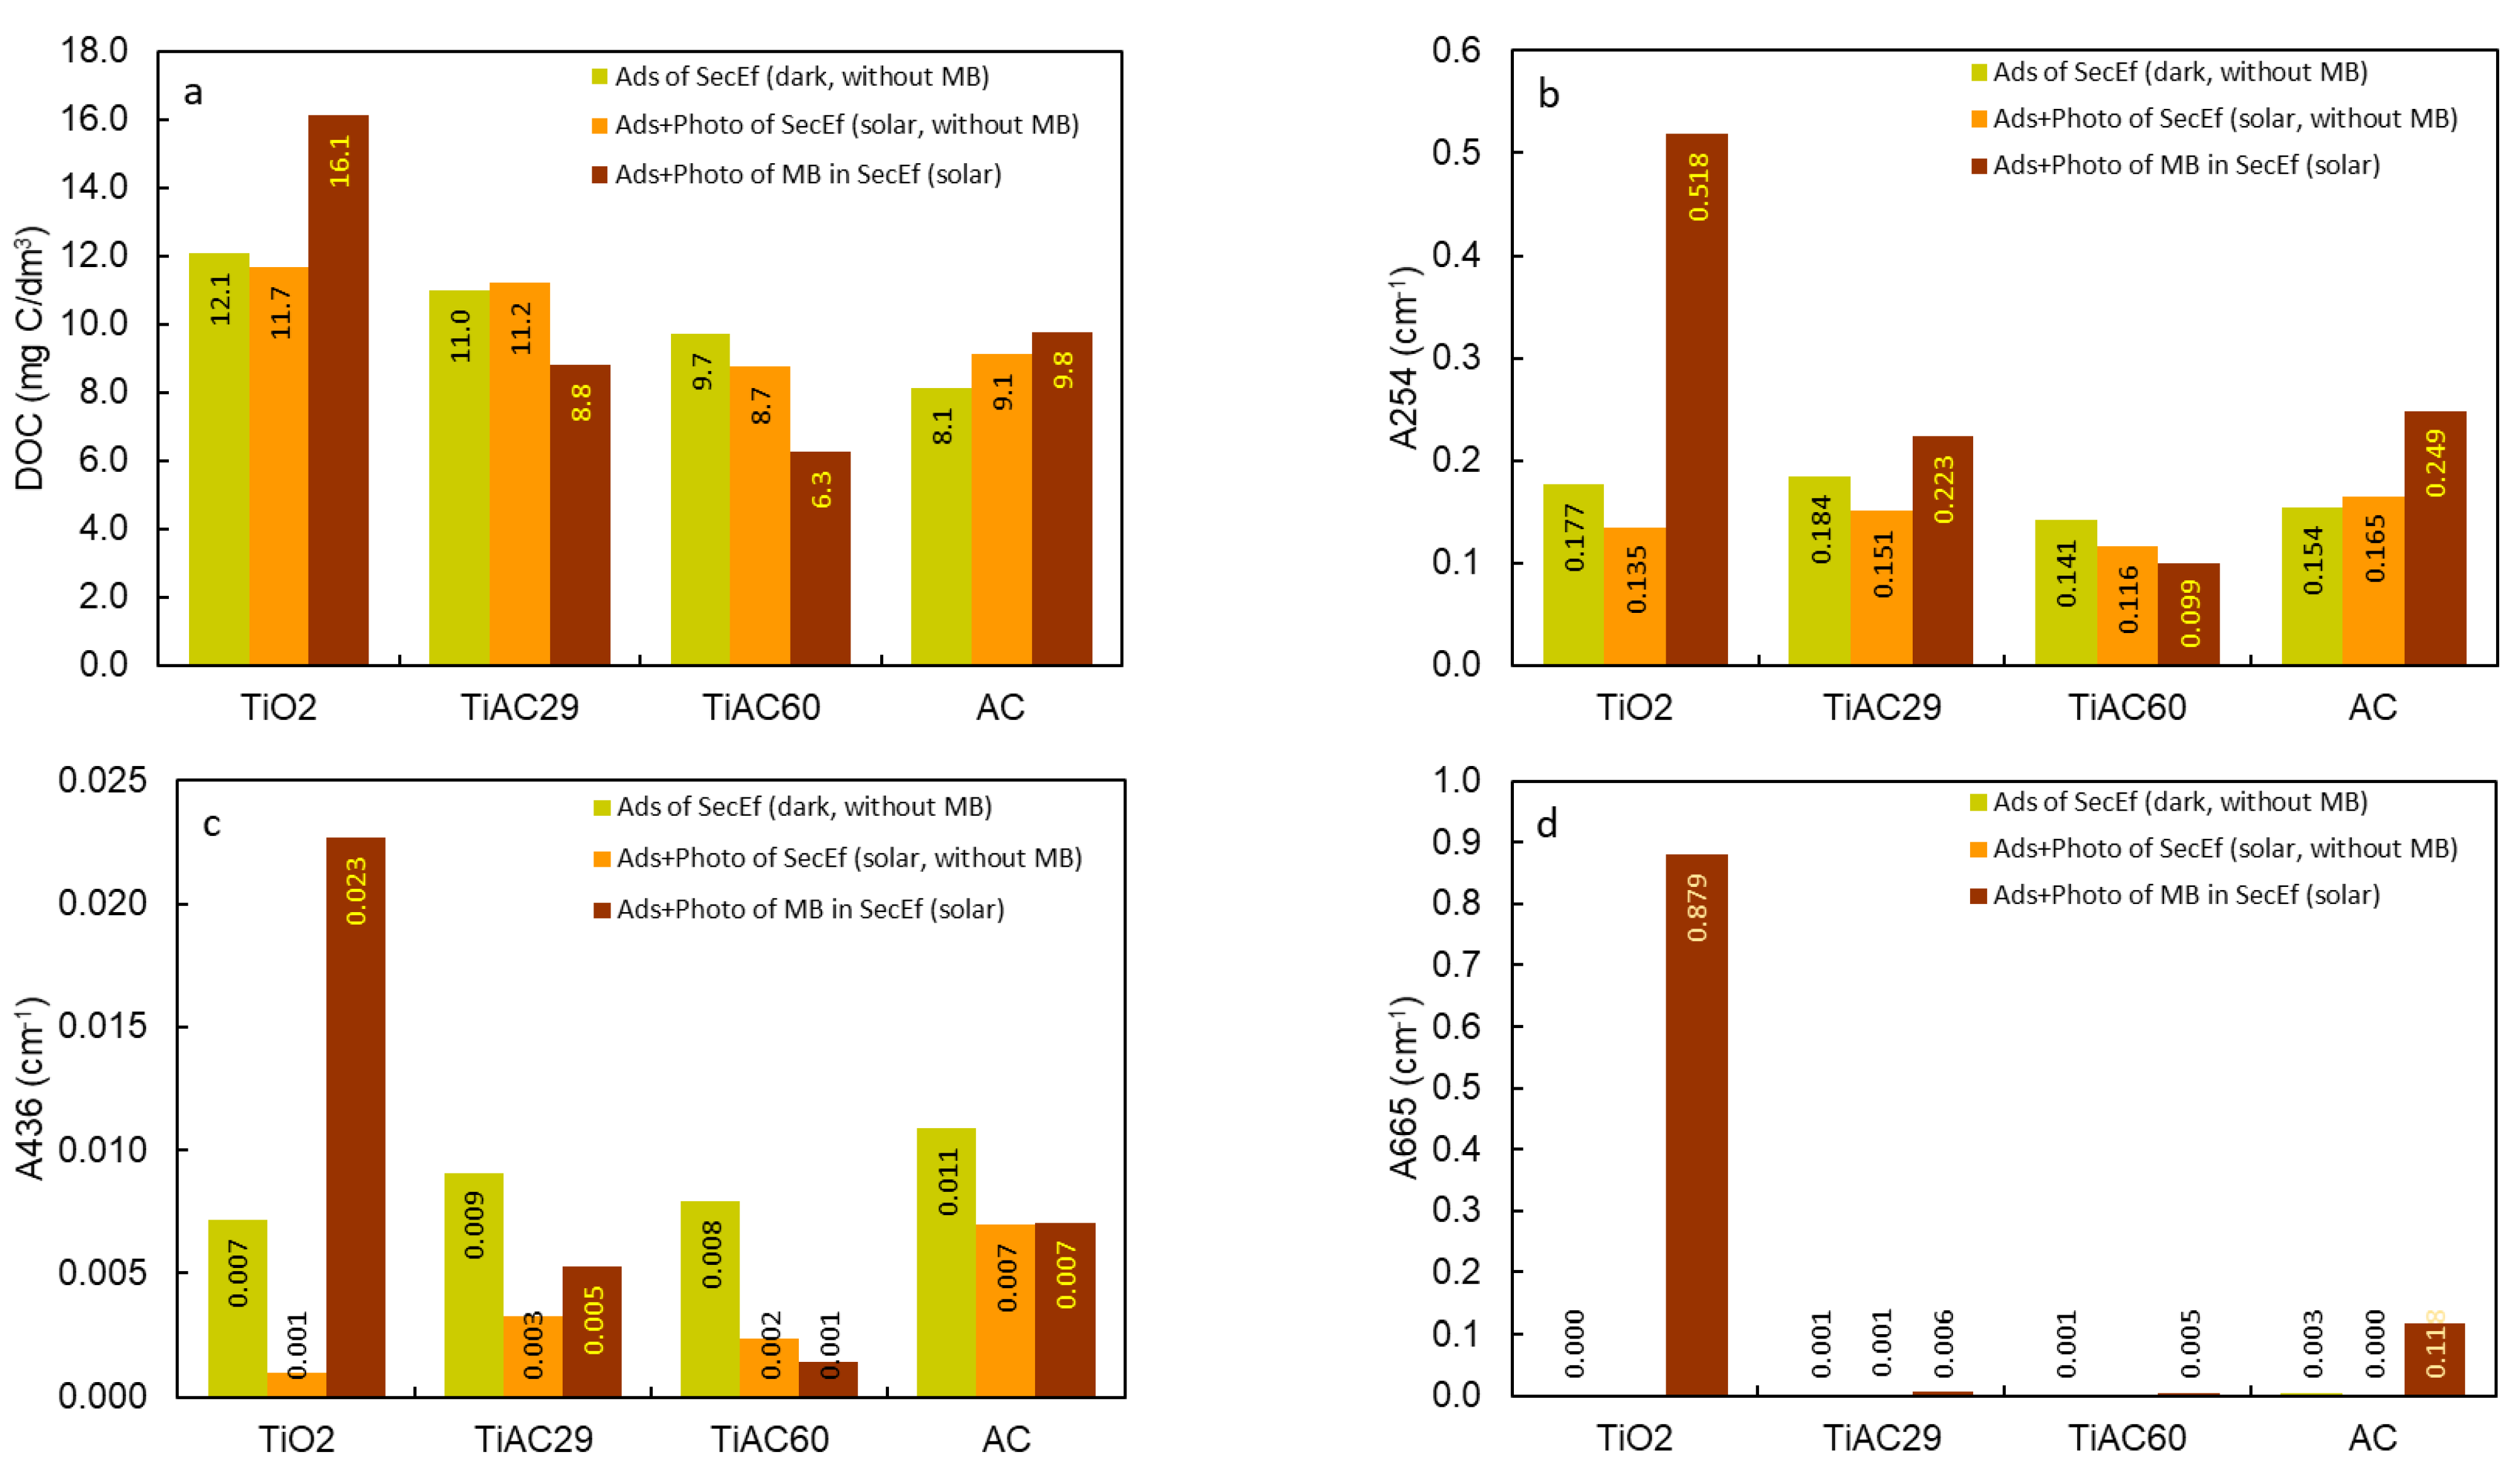
3.2.3. MB Removal in Real Wastewater Samples
4. Conclusions
Supplementary Materials
Author Contributions
Funding
Conflicts of Interest
References
- Demirbas, A. Agricultural based activated carbons for the removal of dyes from aqueous solutions: A review. J. Hazard. Mater. 2009, 167, 1–9. [Google Scholar] [CrossRef]
- Pardo, A.; Garcia, H.; Ramirez, P.; Carrillo-Alvarado, M.A.; Krishna, K.S.; Dominguez, N.; Islam, M.T.; Wang, H.; Noveron, J.C. Self-regenerating photocatalytic hydrogel for the adsorption and decomposition of methylene blue and antibiotics in water. Environ. Technol. Innov. 2018, 11, 321–327. [Google Scholar] [CrossRef]
- Rafatullah, M.; Sulaiman, O.; Hashim, R.; Ahmad, A. Adsorption of methylene blue on low-cost adsorbents: A review. J. Hazard. Mater. 2010, 177, 70–80. [Google Scholar] [CrossRef]
- Mashkoor, F.; Nasar, A. Magsorbents: Potential candidates in wastewater treatment technology—A review on the removal of methylene blue dye. J. Magn. Magn. Mater. 2020, 500, 166408. [Google Scholar] [CrossRef]
- Mills, A.; Davies, R.H.; Worsley, D. Water purification by semiconductor photocatalysis. Chem. Soc. Rev. 1993, 22, 417–425. [Google Scholar] [CrossRef]
- Carvalho, A.P.; Mestre, A.S.; Andrade, M.; Ania, C.O. Ibuprofen in the aquatic environment: Occurrence, ecotoxicity and water remediation technologies. In Ibuprofen: Clinical Pharmacology, Medical Uses and Adverse Effects; Nova Science Publishers Inc.: New York, NY, USA, 2013; pp. 1–84. [Google Scholar]
- Zhao, W.; Bai, Z.; Ren, A.; Guo, B.; Wu, C. Sunlight photocatalytic activity of CdS modified TiO2 loaded on activated carbon fibers. Appl. Surf. Sci. 2010, 256, 3493–3498. [Google Scholar] [CrossRef]
- Zhang, J.; Zhou, P.; Liu, J.; Yu, J. New understanding of the difference of photocatalytic activity among anatase, rutile and brookite TiO2. Phys. Chem. Chem. Phys. 2014, 16, 20382–20386. [Google Scholar] [CrossRef]
- Ragupathy, S.; Raghu, K.; Prabu, P. Synthesis and characterization of TiO2 loaded cashew nut shell activated carbon and photocatalytic activity on BG and MB dyes under sunlight radiation. Spectrochim. Acta Part A Mol. Biomol. Spectrosc. 2015, 138, 314–320. [Google Scholar] [CrossRef] [PubMed]
- Slimen, H.; Houas, A.; Nogier, J.P. Elaboration of stable anatase TiO2 through activated carbon addition with high photocatalytic activity under visible light. J. Photochem. Photobiol. A Chem. 2011, 221, 13–21. [Google Scholar] [CrossRef]
- Nakata, K.; Fujishima, A. TiO2 photocatalysis: Design and applications. J. Photochem. Photobiol. C Photochem. Rev. 2012, 13, 169–189. [Google Scholar] [CrossRef]
- Mestre, A.S.; Carvalho, A.P. Photocatalytic Degradation of Pharmaceuticals Carbamazepine, Diclofenac, and Sulfamethoxazole by Semiconductor and Carbon Materials: A Review. Molecules 2019, 24, 3702. [Google Scholar] [CrossRef] [Green Version]
- Bi, Y.-G.; Liu, D. Rapid synthesis of recyclable and reusable magnetic TiO2@Fe3O4 for degradation of organic pollutant. Appl. Phys. A 2019, 125, 77. [Google Scholar] [CrossRef]
- Byrne, H.E.; Mazyck, D.W. Removal of trace level aqueous mercury by adsorption and photocatalysis on silica–titania composites. J. Hazard. Mater. 2009, 170, 915–919. [Google Scholar] [CrossRef]
- Akly, C.; Chadik, P.A.; Mazyck, D.W. Photocatalysis of gas-phase toluene using silica–titania composites: Performance of a novel catalyst immobilization technique suitable for large-scale applications. Appl. Catal. B Environ. 2010, 99, 329–335. [Google Scholar] [CrossRef]
- Coutts, J.L.; Levine, L.H.; Richards, J.T.; Mazyck, D.W. The effect of photon source on heterogeneous photocatalytic oxidation of ethanol by a silica–titania composite. J. Photochem. Photobiol. A Chem. 2011, 225, 58–64. [Google Scholar] [CrossRef] [Green Version]
- Kanakaraju, D.; Kockler, J.; Motti, C.A.; Glass, B.D.; Oelgemöller, M. Titanium dioxide/zeolite integrated photocatalytic adsorbents for the degradation of amoxicillin. Appl. Catal. B Environ. 2015, 166–167, 45–55. [Google Scholar] [CrossRef]
- Leary, R.; Westwood, A. Carbonaceous nanomaterials for the enhancement of TiO2 photocatalysis. Carbon 2011, 49, 741–772. [Google Scholar] [CrossRef]
- Murgolo, S.; Petronella, F.; Ciannarella, R.; Comparelli, R.; Agostiano, A.; Curri, M.L.; Mascolo, G. UV and solar-based photocatalytic degradation of organic pollutants by nano-sized TiO2 grown on carbon nanotubes. Catal. Today 2015, 240, 114–124. [Google Scholar] [CrossRef]
- Mahmoodi, N.M.; Arami, M.; Zhang, J. Preparation and photocatalytic activity of immobilized composite photocatalyst (titania nanoparticle/activated carbon). J. Alloy. Compd. 2011, 509, 4754–4764. [Google Scholar] [CrossRef]
- Matos, J.; Laine, J.; Herrmann, J.-M. Synergy effect in the photocatalytic degradation of phenol on a suspended mixture of titania and activated carbon. Appl. Catal. B Environ. 1998, 18, 281–291. [Google Scholar] [CrossRef]
- Al Bahri, M.; Calvo, L.; Gilarranz, M.A.; Rodriguez, J.J. Activated carbon from grape seeds upon chemical activation with phosphoric acid: Application to the adsorption of diuron from water. Chem. Eng. J. 2012, 203, 348–356. [Google Scholar] [CrossRef] [Green Version]
- Angin, D. Production and characterization of activated carbon from sour cherry stones by zinc chloride. Fuel 2014, 115, 804–811. [Google Scholar] [CrossRef]
- Zyoud, A.; Nassar, H.N.I.; El-Hamouz, A.; Hilal, H.S. Solid olive waste in environmental cleanup: Enhanced nitrite ion removal by ZnCl2-activated carbon. J. Environ. Manag. 2015, 152, 27–35. [Google Scholar] [CrossRef] [PubMed]
- Kong, J.; Yue, Q.; Huang, L.; Gao, Y.; Sun, Y.; Gao, B.; Li, Q.; Wang, Y. Preparation, characterization and evaluation of adsorptive properties of leather waste based activated carbon via physical and chemical activation. Chem. Eng. J. 2013, 221, 62–71. [Google Scholar] [CrossRef]
- Mestre, A.S.; Pires, J.; Nogueira, J.M.F.; Carvalho, A.P. Activated carbons for the adsorption of ibuprofen. Carbon 2007, 45, 1979–1988. [Google Scholar] [CrossRef]
- Mestre, A.S.; Pires, R.A.; Aroso, I.; Fernandes, E.M.; Pinto, M.L.; Reis, R.L.; Andrade, M.A.; Pires, J.; Silva, S.P.; Carvalho, A.P. Activated carbons prepared from industrial pre-treated cork: Sustainable adsorbents for pharmaceutical compounds removal. Chem. Eng. J. 2014, 253, 408–417. [Google Scholar] [CrossRef]
- Mestre, A.S.; Bexiga, A.S.; Proença, M.; Andrade, M.; Pinto, M.L.; Matos, I.; Fonseca, I.M.; Carvalho, A.P. Activated carbons from sisal waste by chemical activation with K2CO3: Kinetics of paracetamol and ibuprofen removal from aqueous solution. Bioresour. Technol. 2011, 102, 8253–8260. [Google Scholar] [CrossRef] [PubMed]
- Mestre, A.S.; Hesse, F.; Freire, C.; Ania, C.O.; Carvalho, A.P. Chemically activated high grade nanoporous carbons from low density renewable biomass (Agave sisalana) for the removal of pharmaceuticals. J. Colloid Interface Sci. 2019, 536, 681–693. [Google Scholar] [CrossRef] [PubMed]
- Castro, C.S.; Abreu, A.L.; Silva, C.L.T.; Guerreiro, M.C. Phenol adsorption by activated carbon produced from spent coffee grounds. Water Sci. Technol. 2011, 64, 2059–2065. [Google Scholar] [CrossRef]
- Kante, K.; Nieto-Delgado, C.; Rangel-Mendez, J.R.; Bandosz, T.J. Spent coffee-based activated carbon: Specific surface features and their importance for H2S separation process. J. Hazard. Mater. 2012, 201–202, 141–147. [Google Scholar] [CrossRef]
- Zangeneh, H.; Zinatizadeh, A.A.L.; Habibi, M.; Akia, M.; Hasnain Isa, M. Photocatalytic oxidation of organic dyes and pollutants in wastewater using different modified titanium dioxides: A comparative review. J. Ind. Eng. Chem. 2015, 26, 1–36. [Google Scholar] [CrossRef]
- Andrade, M.A.; Mestre, A.S.; Carmona, R.J.; Carvalho, A.P.; Ania, C.O. Effect of the irradiation wavelength on the performance of nanoporous carbon as an additive to TiO2. Appl. Catal. A Gen. 2015, 507, 91–98. [Google Scholar] [CrossRef] [Green Version]
- Salvador, F.; Martin-Sanchez, N.; Sanchez-Hernandez, R.; Sanchez-Montero, M.J.; Izquierdo, C. Regeneration of carbonaceous adsorbents. Part II: Chemical, Microbiological and Vacuum Regeneration. Microporous Mesoporous Mater. 2015, 202, 277–296. [Google Scholar] [CrossRef]
- Viegas, R.M.C.; Mestre, A.S.; Mesquita, E.; Campinas, M.; Andrade, M.A.; Carvalho, A.P.; Rosa, M.J. Assessing the applicability of a new carob waste-derived powdered activated carbon to control pharmaceutical compounds in wastewater treatment. Sci. Total Environ. 2020, 743, 140791. [Google Scholar] [CrossRef]
- Viegas, R.M.C.; Mesquita, E.; Campinas, M.; Almeida, C.M.M.; Rosa, M.J. Designing a PAC/NF advanced process for controlling pharmaceutical compounds in reclaimed water. In Sanitation Approaches & Solutions and the Sustainable Development Goals; Matos, J.S., Rosa, M.J., Eds.; ERSAR, APESB, CERIS: Lisbon, Portugal; EWA: Hennef, Germany, 2018; pp. 97–108. ISBN 978-972-98996-8-3. [Google Scholar]
- Quiñones, D.H.; Rey, A.; Álvarez, P.M.; Beltrán, F.J.; Plucinski, P.K. Enhanced activity and reusability of TiO2 loaded magnetic activated carbon for solar photocatalytic ozonation. Appl. Catal. B Environ. 2014, 144, 96–106. [Google Scholar] [CrossRef]
- Rouquerol, F.; Rouquerol, J.; Sing, K. Adsorption by Powders and Porous Solids; Academic Press: London, UK, 1999. [Google Scholar]
- ISO9277. Determination of the Specific Surface Area of Solids by Gas Adsorption—BET Method, 2nd ed.; ISO–International Standardization Organization: Geneva, Switzerland, 2010. [Google Scholar]
- EN1484:1997. Water Analysis—Guidelines for the Determination of Total Organic Carbon (TOC) and Dissolved Organic Carbon (DOC); CEN-European Committee for Standardization: Brussels, Belgium, 1997. [Google Scholar]
- Clesceri, L.; Greenberg, A.; Eaton, A. Standard Methods for the Examination of Water and Wastewater, 20th ed.; American Public Health Association (APHA): Washington, DC, USA; American Water Works Association (AWWA): Denver, CO, USA; Water Environment Federation (WEF): Alexandria, VA, USA, 1998. [Google Scholar]
- Rezaee, M.; Mousavi Khoie, S.M.; Liu, K.H. The role of brookite in mechanical activation of anatase-to-rutile transformation of nanocrystalline TiO2: An XRD and Raman spectroscopy investigation. CrystEngComm 2011, 13, 5055–5061. [Google Scholar] [CrossRef] [Green Version]
- Weirich, T.E.; Winterer, M.; Seifried, S.; Hahn, H.; Fuess, H. Rietveld analysis of electron powder diffraction data from nanocrystalline anatase, TiO2. Ultramicroscopy 2000, 81, 263–270. [Google Scholar] [CrossRef]
- Meagher, E.P.; Lager, G.A. Polyhedral thermal expansion in the TiO2 polymorphs: Refinement of the crystal structures of rutile and brookite at high temperature. Can. Mineral. 1979, 17, 77–85. [Google Scholar]
- Reyes-Coronado, D.; Rodríguez-Gattorno, G.; Espinosa-Pesqueira, M.E.; Cab, C.; de Coss, R.; Oskam, G. Phase-pure TiO2 nanoparticles: Anatase, brookite and rutile. Nanotechnology 2008, 19, 145605. [Google Scholar] [CrossRef]
- Thommes, M.; Kaneko, K.; Neimark, A.V.; Olivier, J.P.; Rodriguez-Reinoso, F.; Rouquerol, J.; Sing, K.S. Physisorption of gases, with special reference to the evaluation of surface area and pore size distribution (IUPAC Technical Report). Pure Appl. Chem. 2015, 87, 1051–1069. [Google Scholar] [CrossRef] [Green Version]
- Figueiredo, J.L.; Pereira, M.F.R.; Freitas, M.M.A.; Órfão, J.J.M. Modification of the surface chemistry of activated carbons. Carbon 1999, 37, 1379–1389. [Google Scholar] [CrossRef]
- Figueiredo, J.L.; Pereira, M.F.R. The role of surface chemistry in catalysis with carbons. Catal. Today 2010, 150, 2–7. [Google Scholar] [CrossRef]
- Liu, Y.; Yang, S.; Hong, J.; Sun, C. Low-temperature preparation and microwave photocatalytic activity study of TiO2-mounted activated carbon. J. Hazard. Mater. 2007, 142, 208–215. [Google Scholar] [CrossRef]
- Perrin, F.X.; Nguyen, V.; Vernet, J.L. FT-IR Spectroscopy of Acid-Modified Titanium Alkoxides: Investigations on the Nature of Carboxylate Coordination and Degree of Complexation. J. Sol Gel Sci. Technol. 2003, 28, 205–215. [Google Scholar] [CrossRef]
- Biniak, S.; Szymanski, G.; Siedlewski, J.; Swiatkowski, A. The characterization of activated carbons with oxygen and nitrogen surface groups. Carbon 1997, 35, 1799–1810. [Google Scholar] [CrossRef]
- Fanning, P.E.; Vannice, M.A. A DRIFTS study of the formation of surface groups on carbon by oxidation. Carbon 1993, 31, 721–730. [Google Scholar] [CrossRef]
- Makuła, P.; Pacia, M.; Macyk, W. How to Correctly Determine the Band Gap Energy of Modified Semiconductor Photocatalysts Based on UV–Vis Spectra. J. Phys. Chem. Lett. 2018, 9, 6814–6817. [Google Scholar] [CrossRef] [PubMed] [Green Version]
- Gokce, Y.; Aktas, Z. Nitric acid modification of activated carbon produced from waste tea and adsorption of methylene blue and phenol. Appl. Surf. Sci. 2014, 313, 352–359. [Google Scholar] [CrossRef]
- Pereira, M.F.R.; Soares, S.F.; Órfão, J.J.M.; Figueiredo, J.L. Adsorption of dyes on activated carbons: Influence of surface chemical groups. Carbon 2003, 41, 811–821. [Google Scholar] [CrossRef]
- Lagergren, S. Handlingar. Band 1898, 24, 1–39. [Google Scholar]
- Ho, Y.S.; McKay, G. Pseudo-second order model for sorption processes. Process Biochem. 1999, 34, 451–465. [Google Scholar] [CrossRef]
- Cheung, W.H.; Szeto, Y.S.; McKay, G. Intraparticle diffusion processes during acid dye adsorption onto chitosan. Bioresour. Technol. 2007, 98, 2897–2904. [Google Scholar] [CrossRef]
- Juang, R.-S.; Chen, M.-L. Application of the Elovich Equation to the Kinetics of Metal Sorption with Solvent-Impregnated Resins. Ind. Eng. Chem. Res. 1997, 36, 813–820. [Google Scholar] [CrossRef]
- Zhang, J.; Stanforth, R. Slow Adsorption Reaction between Arsenic Species and Goethite (α-FeOOH): Diffusion or Heterogeneous Surface Reaction Control. Langmuir 2005, 21, 2895–2901. [Google Scholar] [CrossRef]
- Cazetta, A.L.; Vargas, A.M.M.; Nogami, E.M.; Kunita, M.H.; Guilherme, M.R.; Martins, A.C.; Silva, T.L.; Moraes, J.C.G.; Almeida, V.C. NaOH-activated carbon of high surface area produced from coconut shell: Kinetics and equilibrium studies from the methylene blue adsorption. Chem. Eng. J. 2011, 174, 117–125. [Google Scholar] [CrossRef]
- Karagöz, S.; Tay, T.; Ucar, S.; Erdem, M. Activated carbons from waste biomass by sulfuric acid activation and their use on methylene blue adsorption. Bioresour. Technol. 2008, 99, 6214–6222. [Google Scholar] [CrossRef]
- Shahryari, Z.; Goharrizi, A.S.; Azadi, M. Experimental study of methylene blue adsorption from aqueous solutions onto carbon nano tubes. Int. J. Water Resour. Environ. Eng. 2010, 2, 016–028. [Google Scholar]
- Heidarinejad, Z.; Rahmanian, O.; Fazlzadeh, M.; Heidari, M. Enhancement of methylene blue adsorption onto activated carbon prepared from Date Press Cake by low frequency ultrasound. J. Mol. Liq. 2018, 264, 591–599. [Google Scholar] [CrossRef]
- Ma, P.; Wang, S.; Wang, T.; Wu, J.; Xing, X.; Zhang, X. Effect of bifunctional acid on the porosity improvement of biomass-derived activated carbon for methylene blue adsorption. Environ. Sci. Pollut. Res. 2019, 26, 30119–30129. [Google Scholar] [CrossRef]
- Malash, G.F.; El-Khaiary, M.I. Piecewise linear regression: A statistical method for the analysis of experimental adsorption data by the intraparticle-diffusion models. Chem. Eng. J. 2010, 163, 256–263. [Google Scholar] [CrossRef]
- Hamdaoui, O.; Naffrechoux, E. Adsorption kinetics of 4-chlorophenol onto granular activated carbon in the presence of high frequency ultrasound. Ultrason. Sonochem. 2009, 16, 15–22. [Google Scholar] [CrossRef]
- Hameed, B.H.; Tan, I.A.W.; Ahmad, A.L. Adsorption isotherm, kinetic modeling and mechanism of 2,4,6-trichlorophenol on coconut husk-based activated carbon. Chem. Eng. J. 2008, 144, 235–244. [Google Scholar] [CrossRef]
- Wu, Z.; Yuan, X.; Zhong, H.; Wang, H.; Zeng, G.; Chen, X.; Wang, H.; Zhang, L.; Shao, J. Enhanced adsorptive removal of p-nitrophenol from water by aluminum metal–organic framework/reduced graphene oxide composite. Sci. Rep. 2016, 6, 25638. [Google Scholar] [CrossRef] [PubMed] [Green Version]
- Velasco, L.F.; Lima, J.C.; Ania, C. Visible-Light Photochemical Activity of Nanoporous Carbons under Monochromatic Light. Angew. Chem. Int. Ed. 2014, 53, 4146–4148. [Google Scholar] [CrossRef] [PubMed]
- Atout, H.; Bouguettoucha, A.; Chebli, D.; Gatica, J.M.; Vidal, H.; Yeste, M.P.; Amrane, A. Integration of Adsorption and Photocatalytic Degradation of Methylene Blue Using TiO2 Supported on Granular Activated Carbon. Arab. J. Sci. Eng. 2017, 42, 1475–1486. [Google Scholar]
- Ma, J.; Chen, C.; Yu, F. Self-regenerative and self-enhanced smart graphene/Ag3PO4 hydrogel adsorbent under visible light. New J. Chem. 2016, 40, 3208–3215. [Google Scholar] [CrossRef]
- He, X.; Male, K.B.; Nesterenko, P.N.; Brabazon, D.; Paull, B.; Luong, J.H.T. Adsorption and Desorption of Methylene Blue on Porous Carbon Monoliths and Nanocrystalline Cellulose. ACS Appl. Mater. Interfaces 2013, 5, 8796–8804. [Google Scholar] [CrossRef] [Green Version]
- Zhu, B.; Zou, L. Trapping and decomposing of color compounds from recycled water by TiO2 coated activated carbon. J. Environ. Manag. 2009, 90, 3217–3225. [Google Scholar] [CrossRef]
- Natarajan, T.S.; Bajaj, H.C.; Tayade, R.J. Preferential adsorption behavior of methylene blue dye onto surface hydroxyl group enriched TiO2 nanotube and its photocatalytic regeneration. J. Colloid Interface Sci. 2014, 433, 104–114. [Google Scholar] [CrossRef] [PubMed]
- Newcombe, G.; Drikas, M.; Hayes, R. Influence of characterised natural organic material on activated carbon adsorption: II. Effect on pore volume distribution and adsorption of 2-methylisoborneol. Water Res. 1997, 31, 1065–1073. [Google Scholar] [CrossRef]
- Zietzschmann, F.; Worch, E.; Altmann, J.; Ruhl, A.S.; Sperlich, A.; Meinel, F.; Jekel, M. Impact of EfOM size on competition in activated carbon adsorption of organic micro-pollutants from treated wastewater. Water Res. 2014, 65, 297–306. [Google Scholar] [CrossRef]
- Campinas, M.; Rosa, M.J. The ionic strength effect on microcystin and natural organic matter surrogate adsorption onto PAC. J. Colloid. Interface Sci. 2006, 299, 520–529. [Google Scholar] [CrossRef]


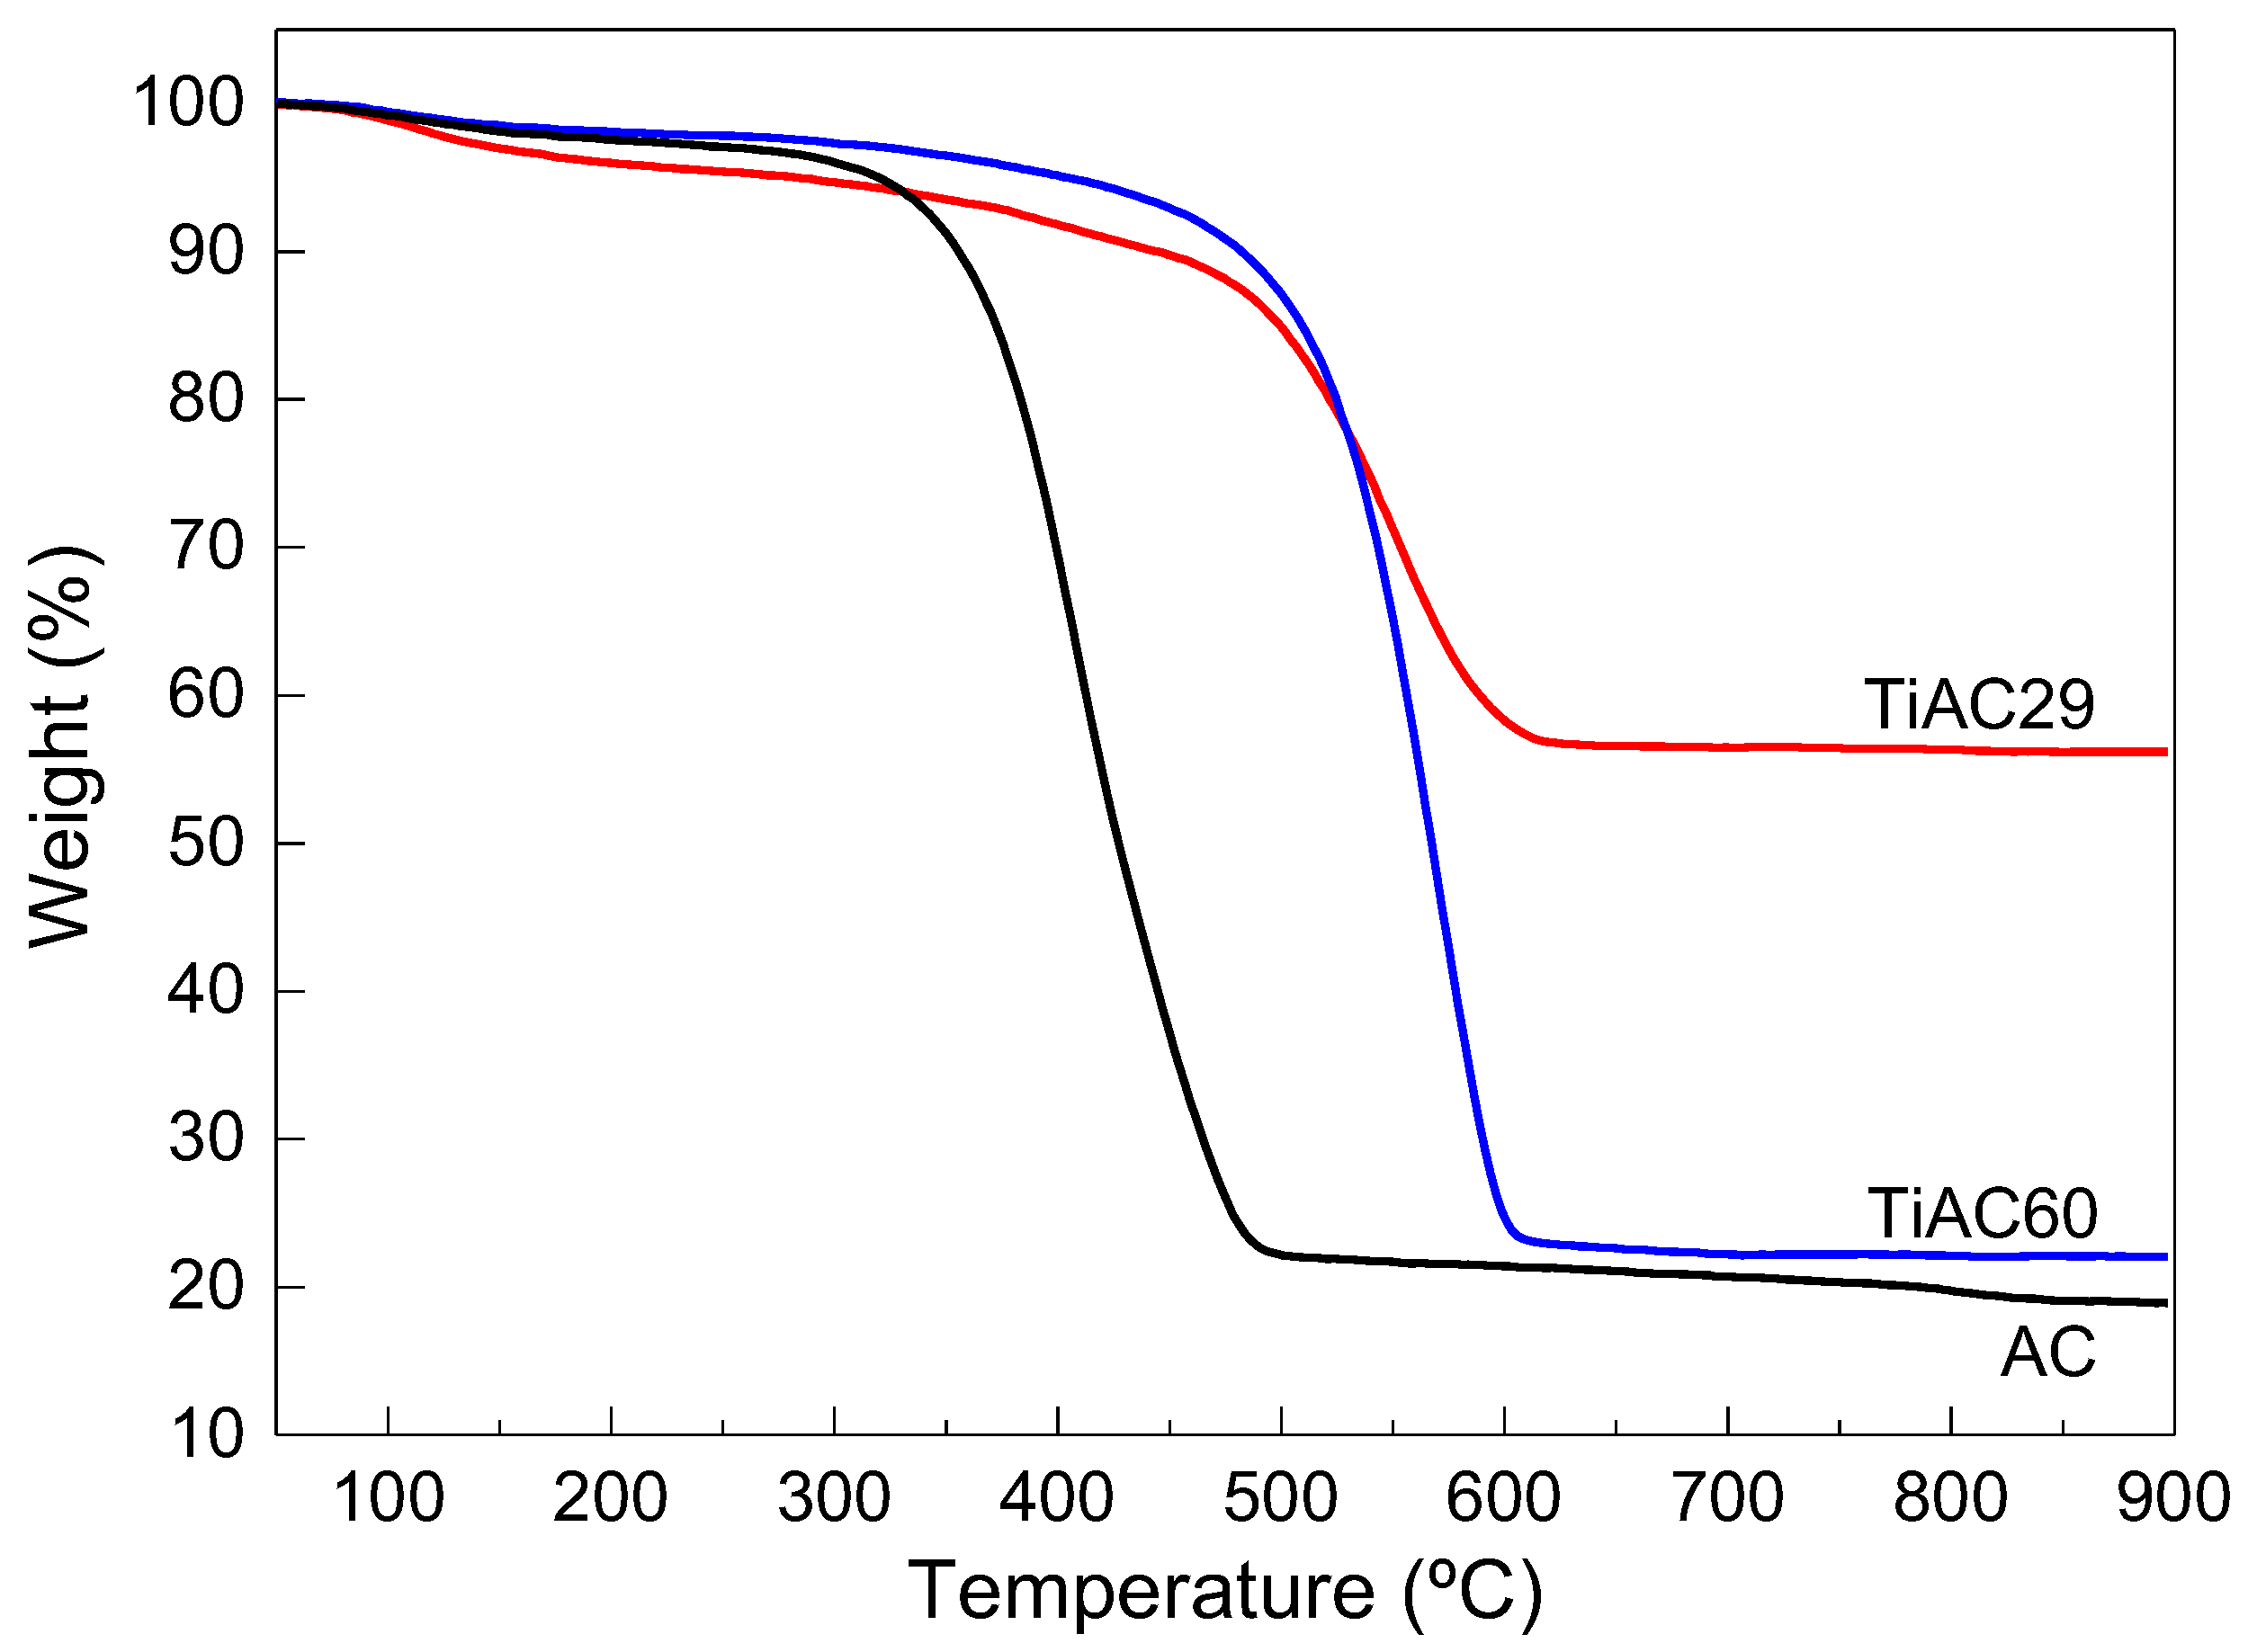
| Sample | %C | %N | %Ti |
|---|---|---|---|
| TiAC29 | 29.0 | 0.6 | 22.6 |
| TiAC60 | 60.2 | 1.4 | 5.6 |
| AC | 65.2 | 1.5 | - |
| Sample | ABET (m2 g−1) | Vtotal (a) (cm3 g−1) | Vmeso (b) (cm3 g−1) | Vmicro (c) (cm3 g−1) |
|---|---|---|---|---|
| TiO2 | 206 | 0.24 | 0.24 | 0.00 |
| AC | 599 | 0.27 | 0.04 | 0.23 |
| TiAC29 | 526 | 0.35 | 0.16 | 0.19 |
| TiAC60 | 623 | 0.31 | 0.07 | 0.24 |
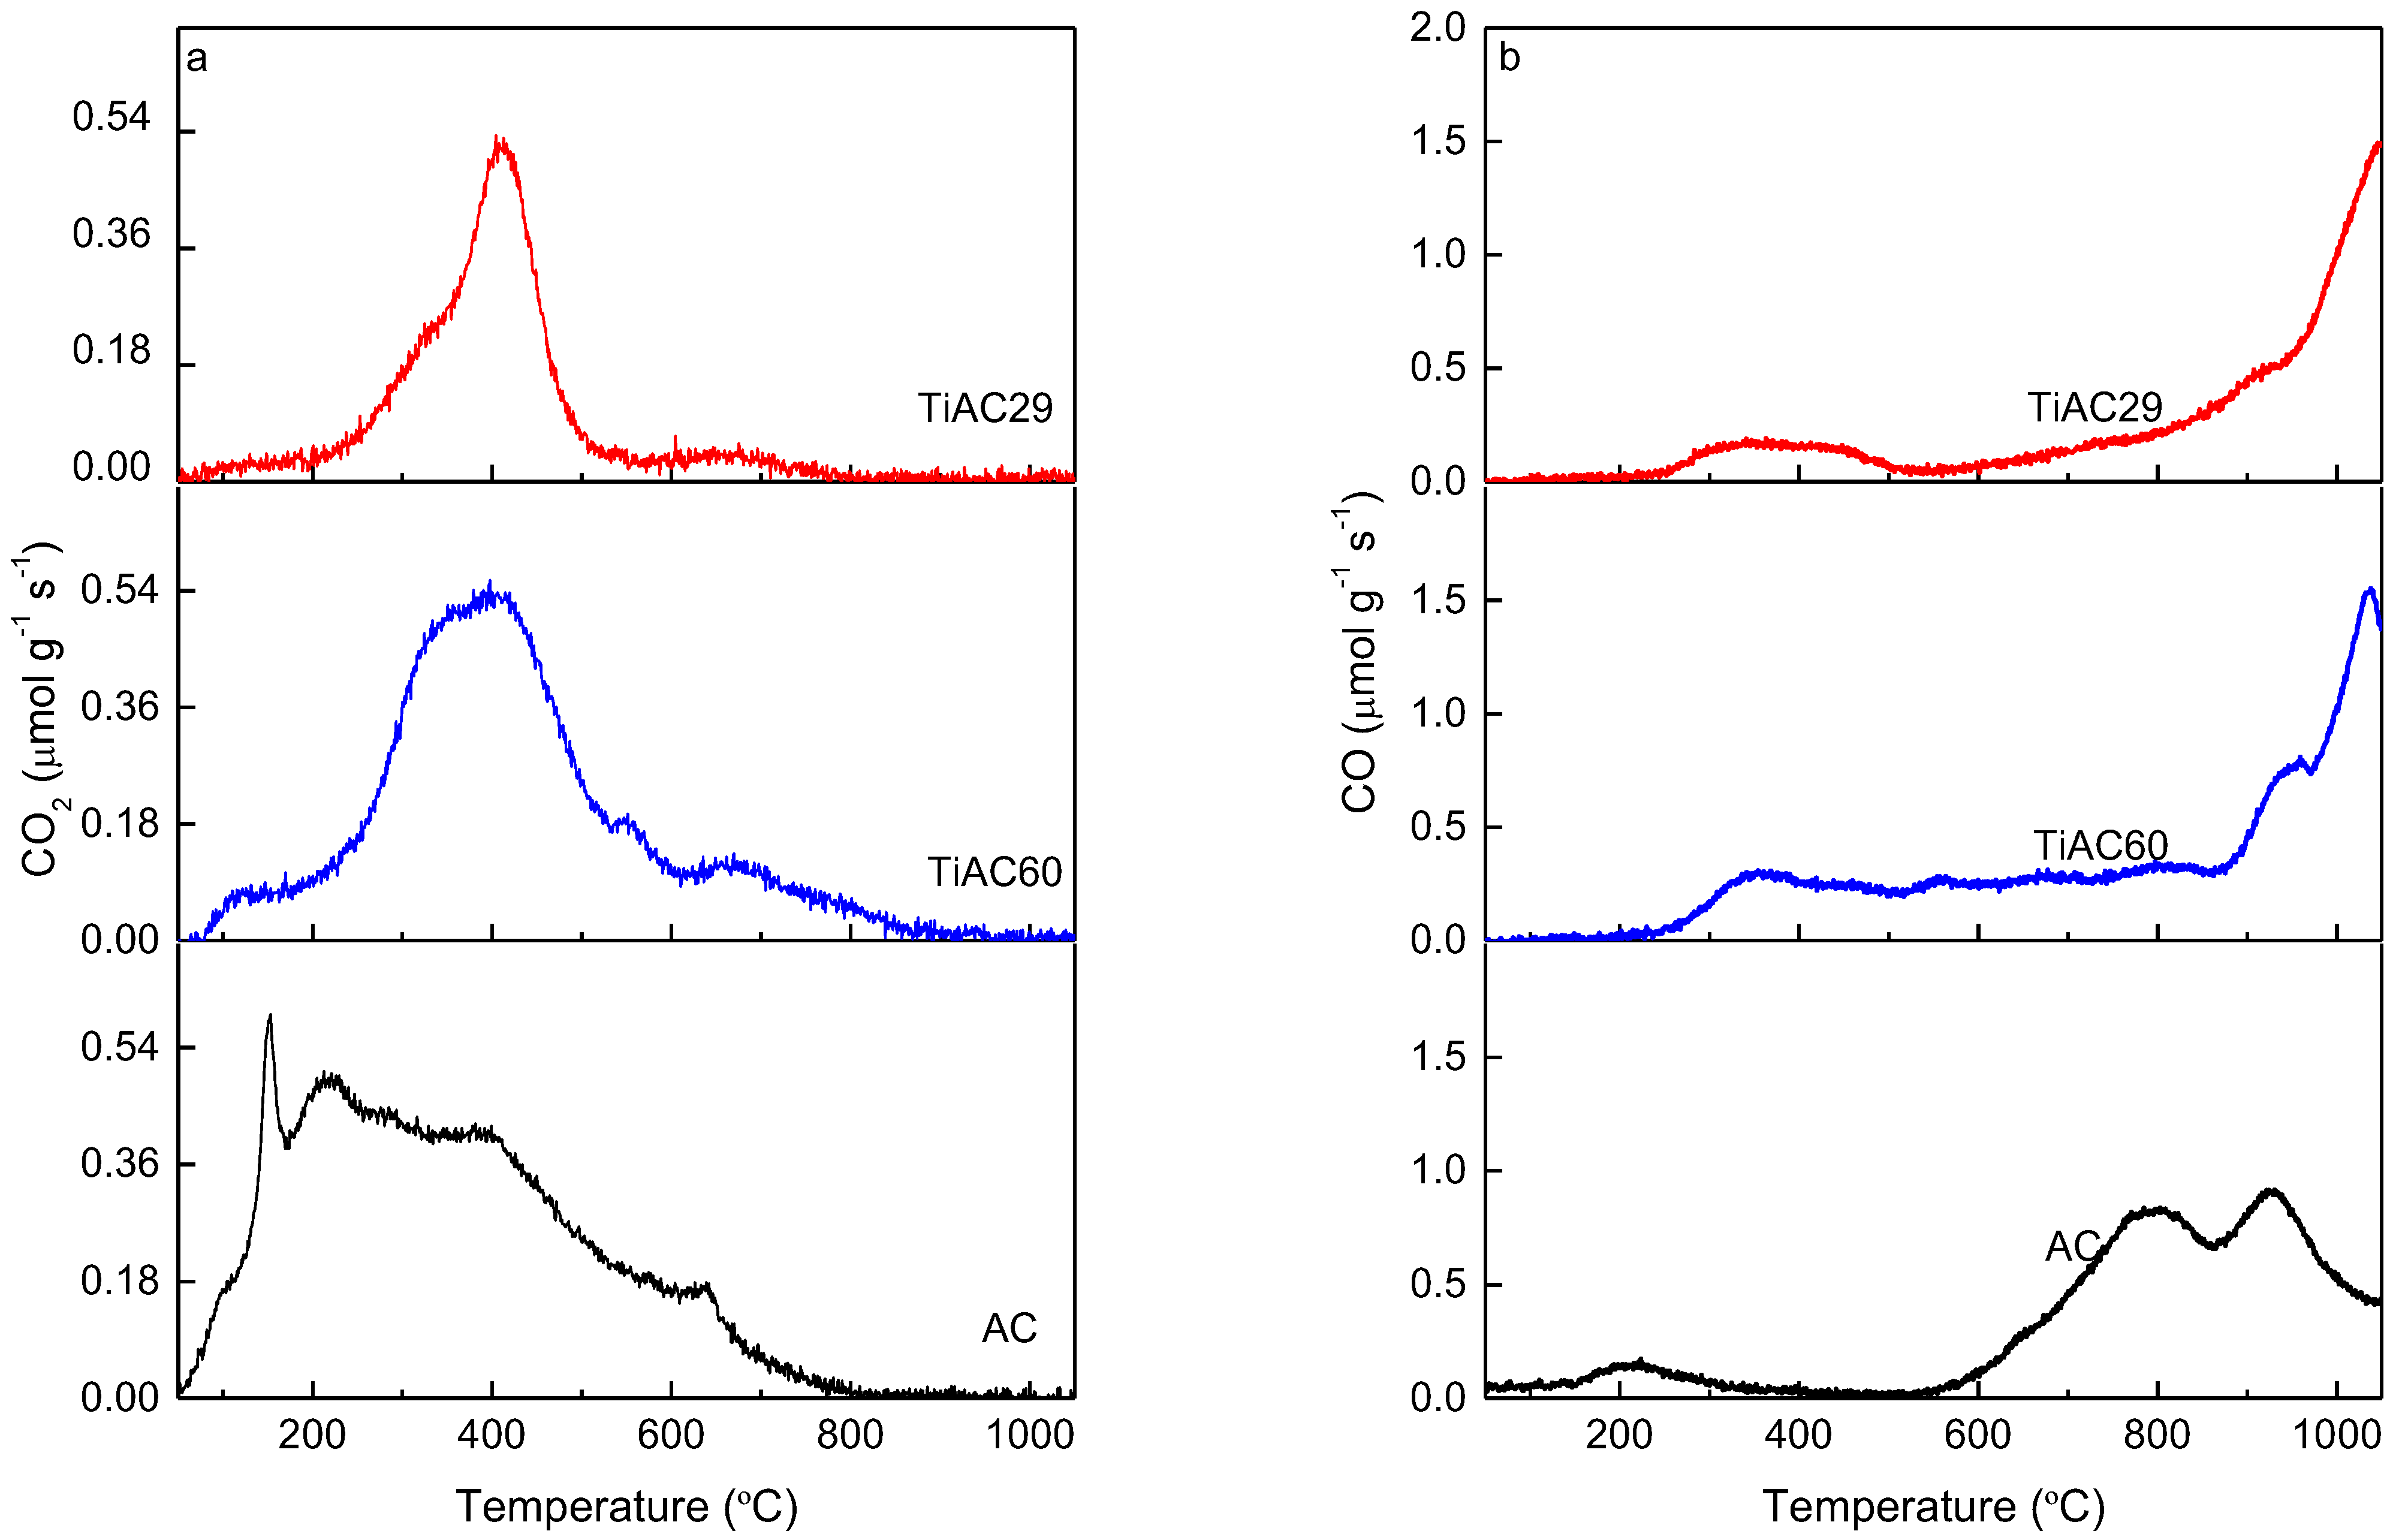
| Material | CO2 (µmol g−1) | CO (µmol g−1) | CO2/CO |
|---|---|---|---|
| TiAC29 | 972 | 2700 | 0.36 |
| TiAC60 | 1848 | 3720 | 0.50 |
| AC | 2340 | 3612 | 0.65 |
| 1st order | 2nd order | Intra-Particle | Elovich | ||||||||||
|---|---|---|---|---|---|---|---|---|---|---|---|---|---|
| Sample | qfexp (a) | K1 (b) | R2 (c) | qf1calc (a) | K2 (d) | R2 (c) | qf2calc (a) | Ki (e) | R2 (c) | Ci (f) | ae (g) | be (h) | R2 (c) |
| TiO2 | 1.29 | - | - | - | - | - | - | - | - | - | - | - | - |
| TiAC29 | 37.63 | 3.20 × 10⁻¹ | 0.80 | 24.78 | 2.56 × 10⁻² | 1.00 | 37.88 | 25.6 | 1.00 | 0.00 | 2.62 × 1032 | 0.35 | 0.92 |
| 5.00 × 10⁻² | 1.00 | 7.13 | 3.77 | 0.92 | 21.85 | ||||||||
| 0.71 | 0.89 | 31.39 | |||||||||||
| TiAC60 | 41.01 | 4.93 × 10⁻² | 0.94 | 35.41 | 1.60 × 10⁻³ | 0.99 | 46.51 | 7.36 | 0.94 | −2.64 | 4.77 × 10⁻⁵ | 0.10 | 0.99 |
| 2.23 × 10⁻² | 1.00 | 17.54 | 2.37 | 0.99 | 18.44 | ||||||||
| AC | 30.72 | 1.45 × 10⁻² | 0.99 | 35.93 | 1.84 × 10⁻³ | 0.96 | 32.57 | 3.31 | 0.99 | 0.27 | 3.42 × 10⁻¹ 0 | 0.14 | 0.94 |
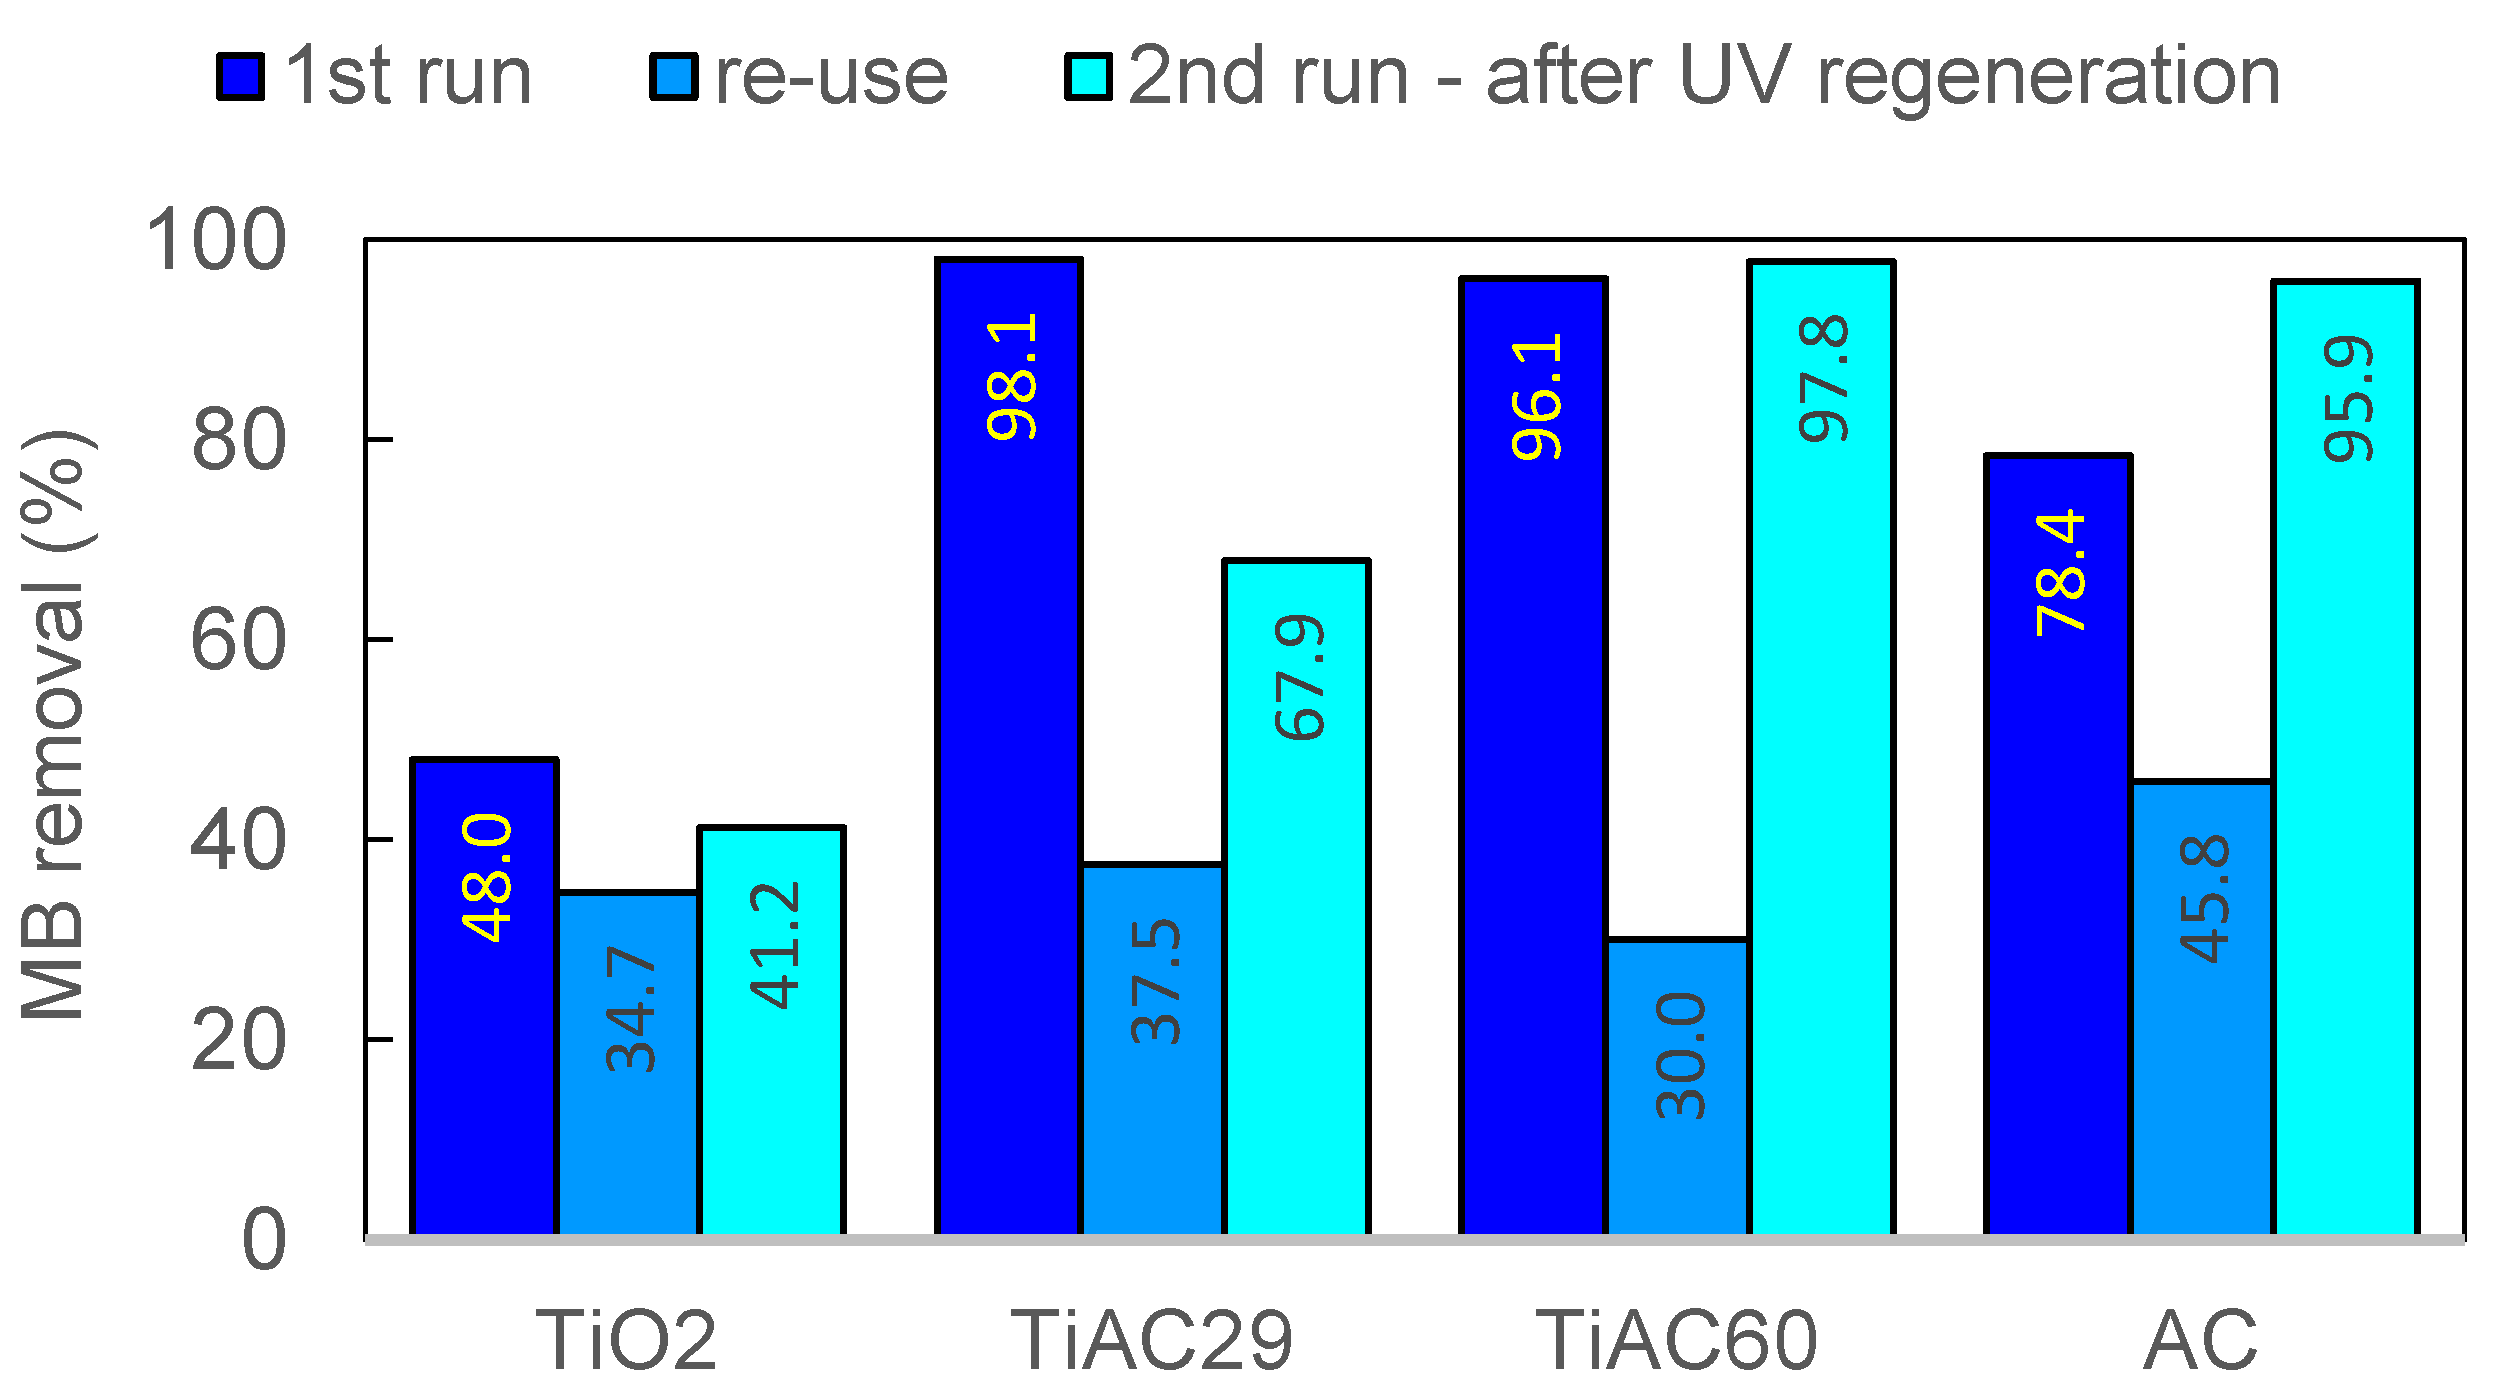
| Photocatalyst | Run | %R (b) | K11 (c) (min−1) | R2 (d) | K12 (c) (min−1) | R2 (d) |
|---|---|---|---|---|---|---|
| TiO2 | 1 | 48.0 | 1.0 × 10⁻² | 0.97 | ||
| 2 (e) | 34.7 | 2.3 × 10⁻³ | 0.89 | |||
| 2 (f) | 41.2 | 3.8 × 10⁻² | 0.82 | 2.3 × 10⁻³ | 0.99 | |
| TiAC29 | 1 | 98.1 | 1.0 × 10⁻¹ | 0.95 | 2.9 × 10⁻² | 0.98 |
| 2(e) | 37.5 | 1.2 × 10⁻² | 0.84 | 5.0 × 10⁻⁴ | 0.68 | |
| 2 (f) | 67.9 | 5.2 × 10⁻² | 1.00 | 3.7 × 10⁻³ | 0.97 | |
| TiAC60 | 1 | 96.1 | 5.7 × 10⁻² | 0.99 | 2.7 × 10⁻² | 0.99 |
| 2(e) | 30.0 | 1.4 × 10⁻² | 0.77 | 7.0 × 10⁻⁴ | 0.94 | |
| 2 (f) | 97.8 | 4.4 × 10⁻² | 0.94 | 1.4 × 10⁻³ | 0.99 | |
| AC | 1 | 78.4 | 4.4 × 10⁻² | 0.89 | 1.1 × 10⁻² | 1.00 |
| 2 (e) | 45.8 | 8.2 × 10⁻³ | 0.80 | 1.0 × 10⁻³ | 0.66 | |
| 2 (f) | 95.9 | 6.2 × 10⁻² | 0.87 | 6.0 × 10⁻⁴ | 0.93 |
Publisher’s Note: MDPI stays neutral with regard to jurisdictional claims in published maps and institutional affiliations. |
© 2021 by the authors. Licensee MDPI, Basel, Switzerland. This article is an open access article distributed under the terms and conditions of the Creative Commons Attribution (CC BY) license (https://creativecommons.org/licenses/by/4.0/).
Share and Cite
Dalto, F.; Kuźniarska-Biernacka, I.; Pereira, C.; Mesquita, E.; Soares, O.S.G.P.; Pereira, M.F.R.; Rosa, M.J.; Mestre, A.S.; Carvalho, A.P.; Freire, C. Solar Light-Induced Methylene Blue Removal over TiO2/AC Composites and Photocatalytic Regeneration. Nanomaterials 2021, 11, 3016. https://0-doi-org.brum.beds.ac.uk/10.3390/nano11113016
Dalto F, Kuźniarska-Biernacka I, Pereira C, Mesquita E, Soares OSGP, Pereira MFR, Rosa MJ, Mestre AS, Carvalho AP, Freire C. Solar Light-Induced Methylene Blue Removal over TiO2/AC Composites and Photocatalytic Regeneration. Nanomaterials. 2021; 11(11):3016. https://0-doi-org.brum.beds.ac.uk/10.3390/nano11113016
Chicago/Turabian StyleDalto, Fernanda, Iwona Kuźniarska-Biernacka, Clara Pereira, Elsa Mesquita, Olívia Salomé G. P. Soares, M. Fernando R. Pereira, Maria João Rosa, Ana S. Mestre, Ana P. Carvalho, and Cristina Freire. 2021. "Solar Light-Induced Methylene Blue Removal over TiO2/AC Composites and Photocatalytic Regeneration" Nanomaterials 11, no. 11: 3016. https://0-doi-org.brum.beds.ac.uk/10.3390/nano11113016