
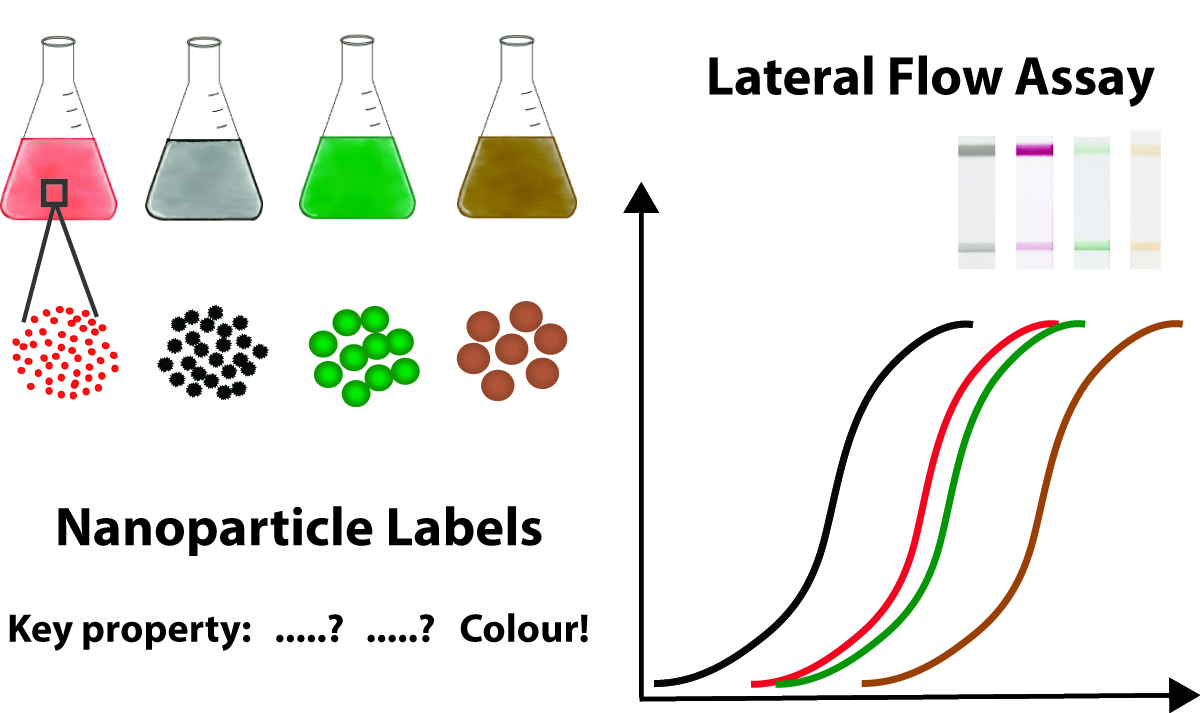
Comparative Study of Four Coloured Nanoparticle Labels in Lateral Flow Immunoassay

 ,
,  and
and
Abstract
: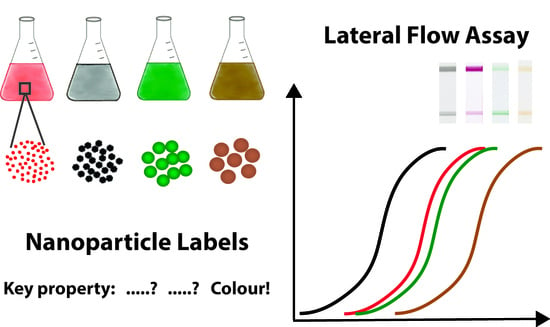
1. Introduction
2. Materials and Methods
2.1. Materials
2.2. Synthesis of Gold Nanoparticles
2.3. Synthesis of Au@Pt Nanoparticles
2.4. Synthesis of Au-Nanoparticles Conjugates with pAbs
2.5. Synthesis of Au@Pt Nanoparticles Conjugates with pAbs
2.6. Synthesis of Magnetic Nanoparticle Conjugates with pAbs
2.7. Synthesis of Latex Nanoparticle Conjugates with pAbs
2.8. Dynamic Light Scattering (DLS)
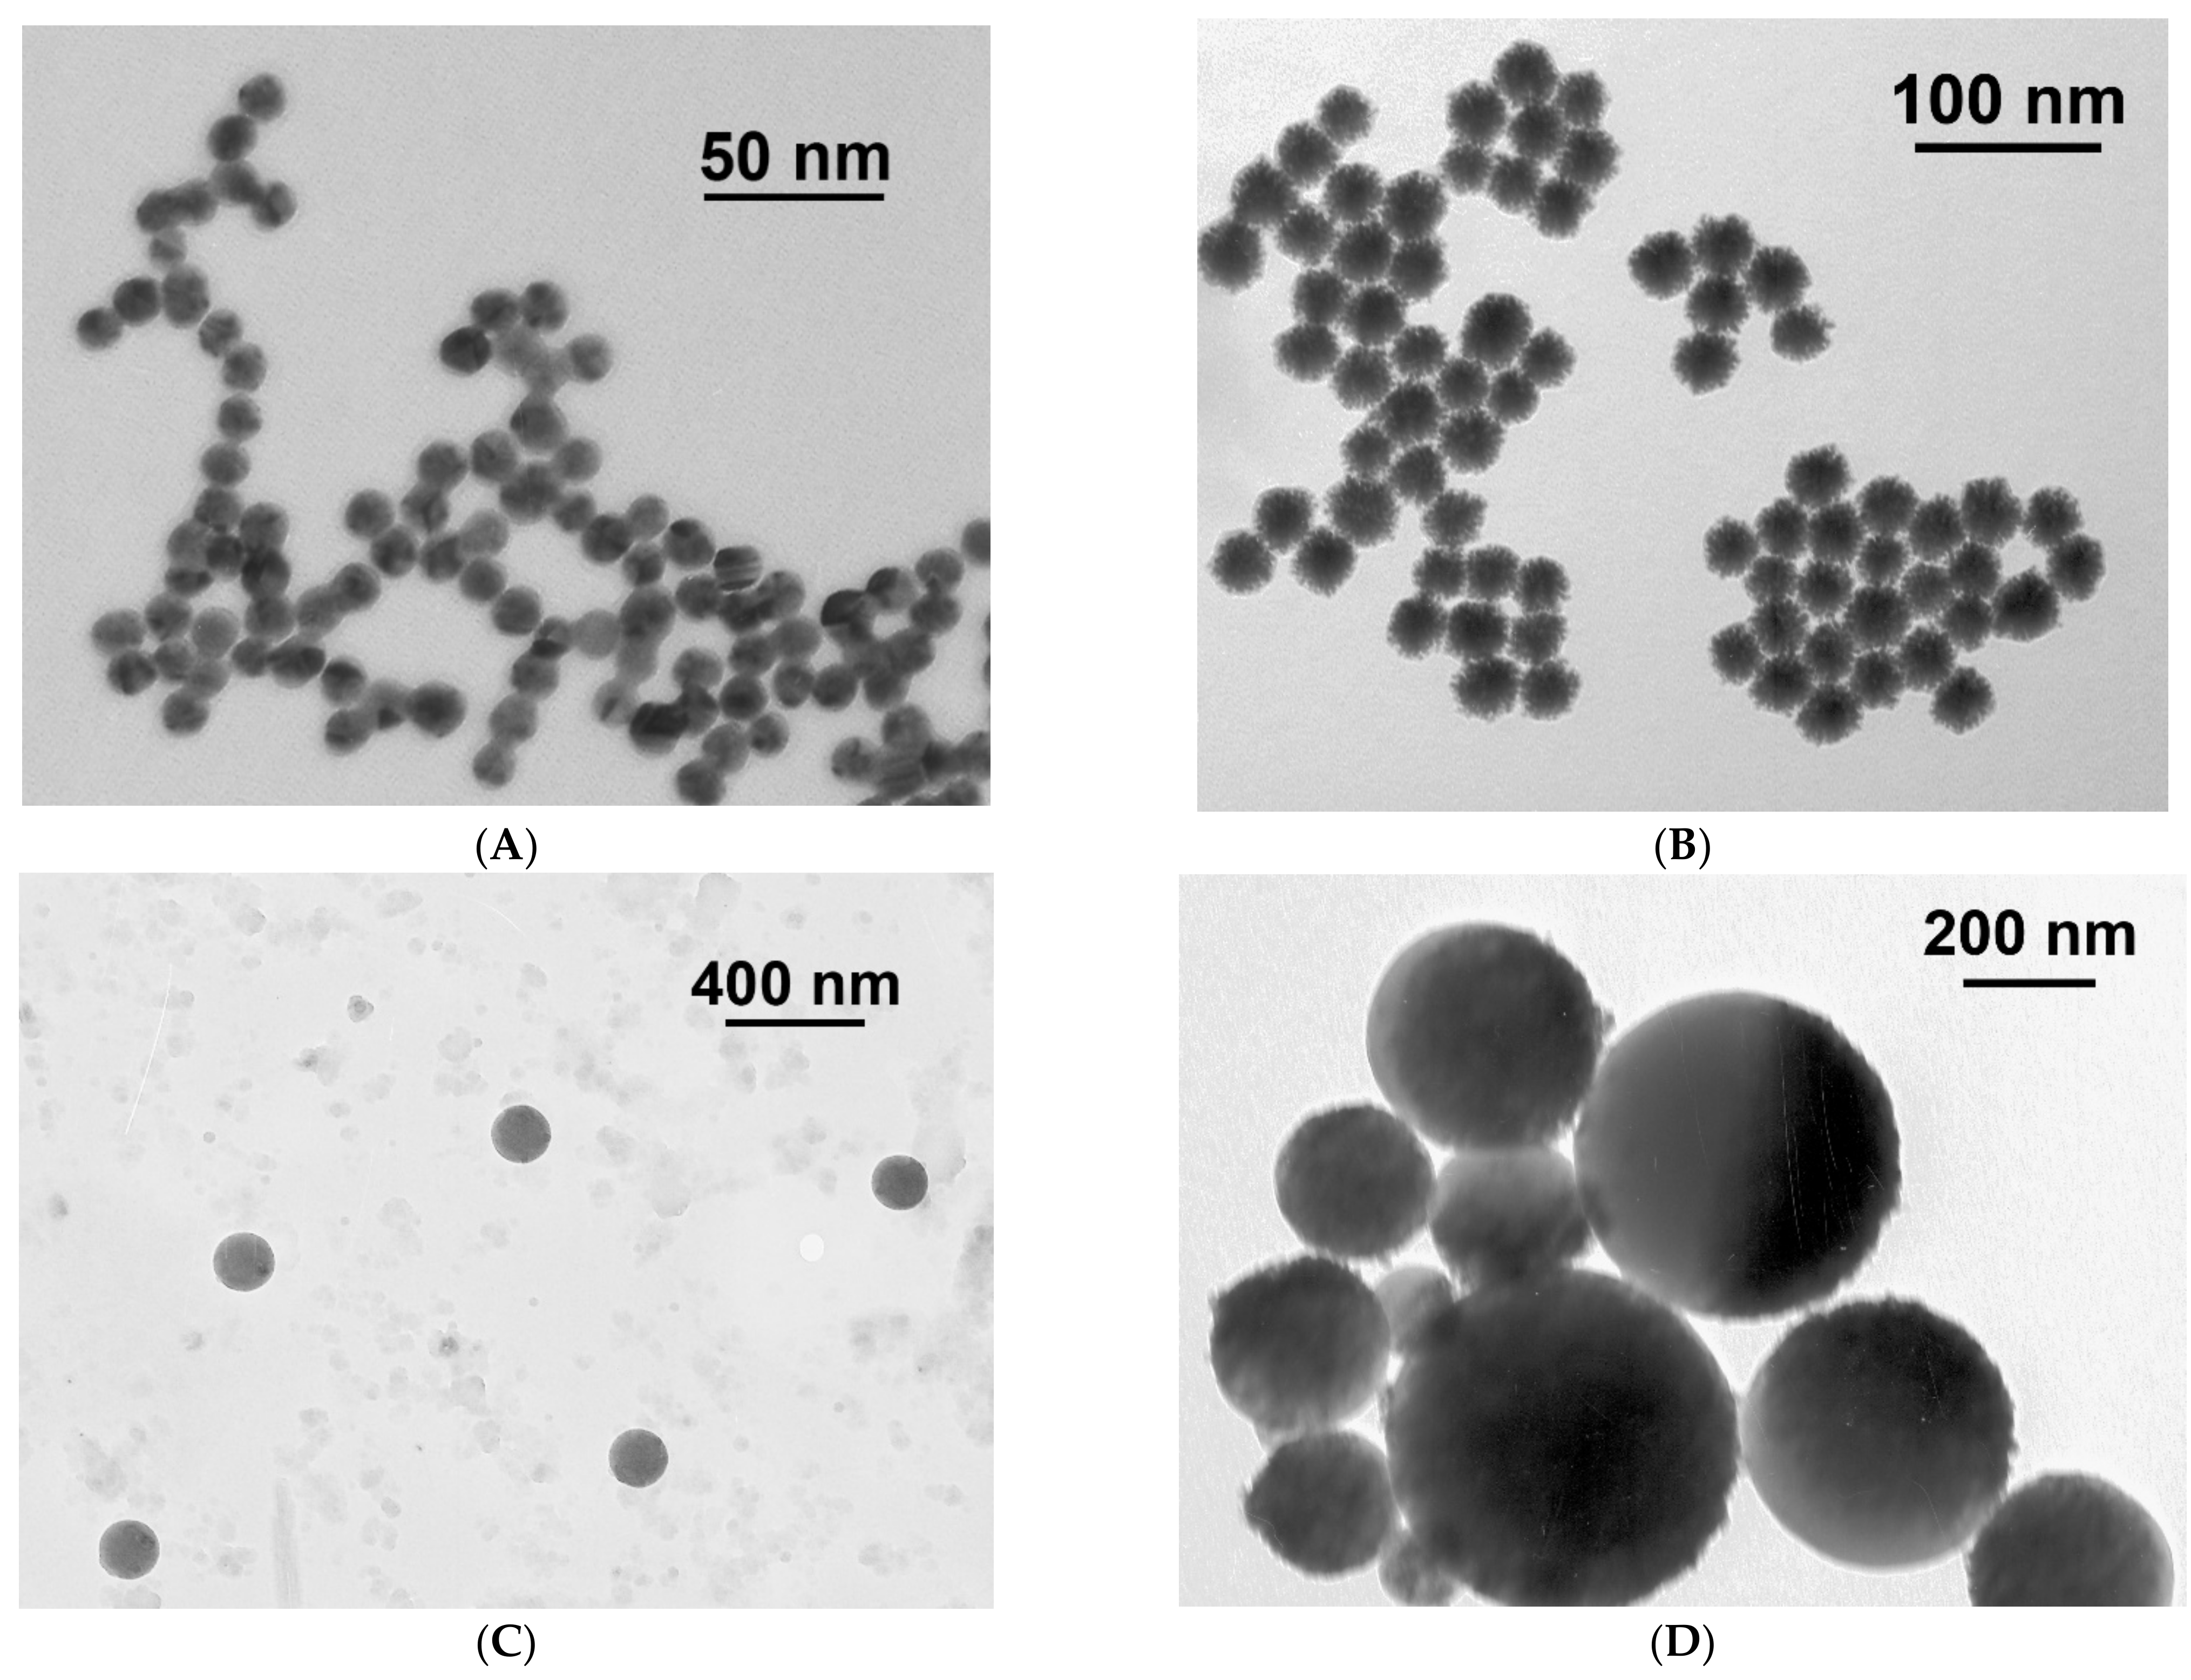
2.9. Transmission Electron Microscopy (TEM)
2.10. Preparation of Test Strips
2.11. Comparison of Nanoparticle Labels Using Enzyme-Linked Immunosorbent Assays (ELISA)
2.12. Comparison of Nanoparticle Labels Using Lateral Flow Immunoassay (LFIA)
3. Results and Discussion
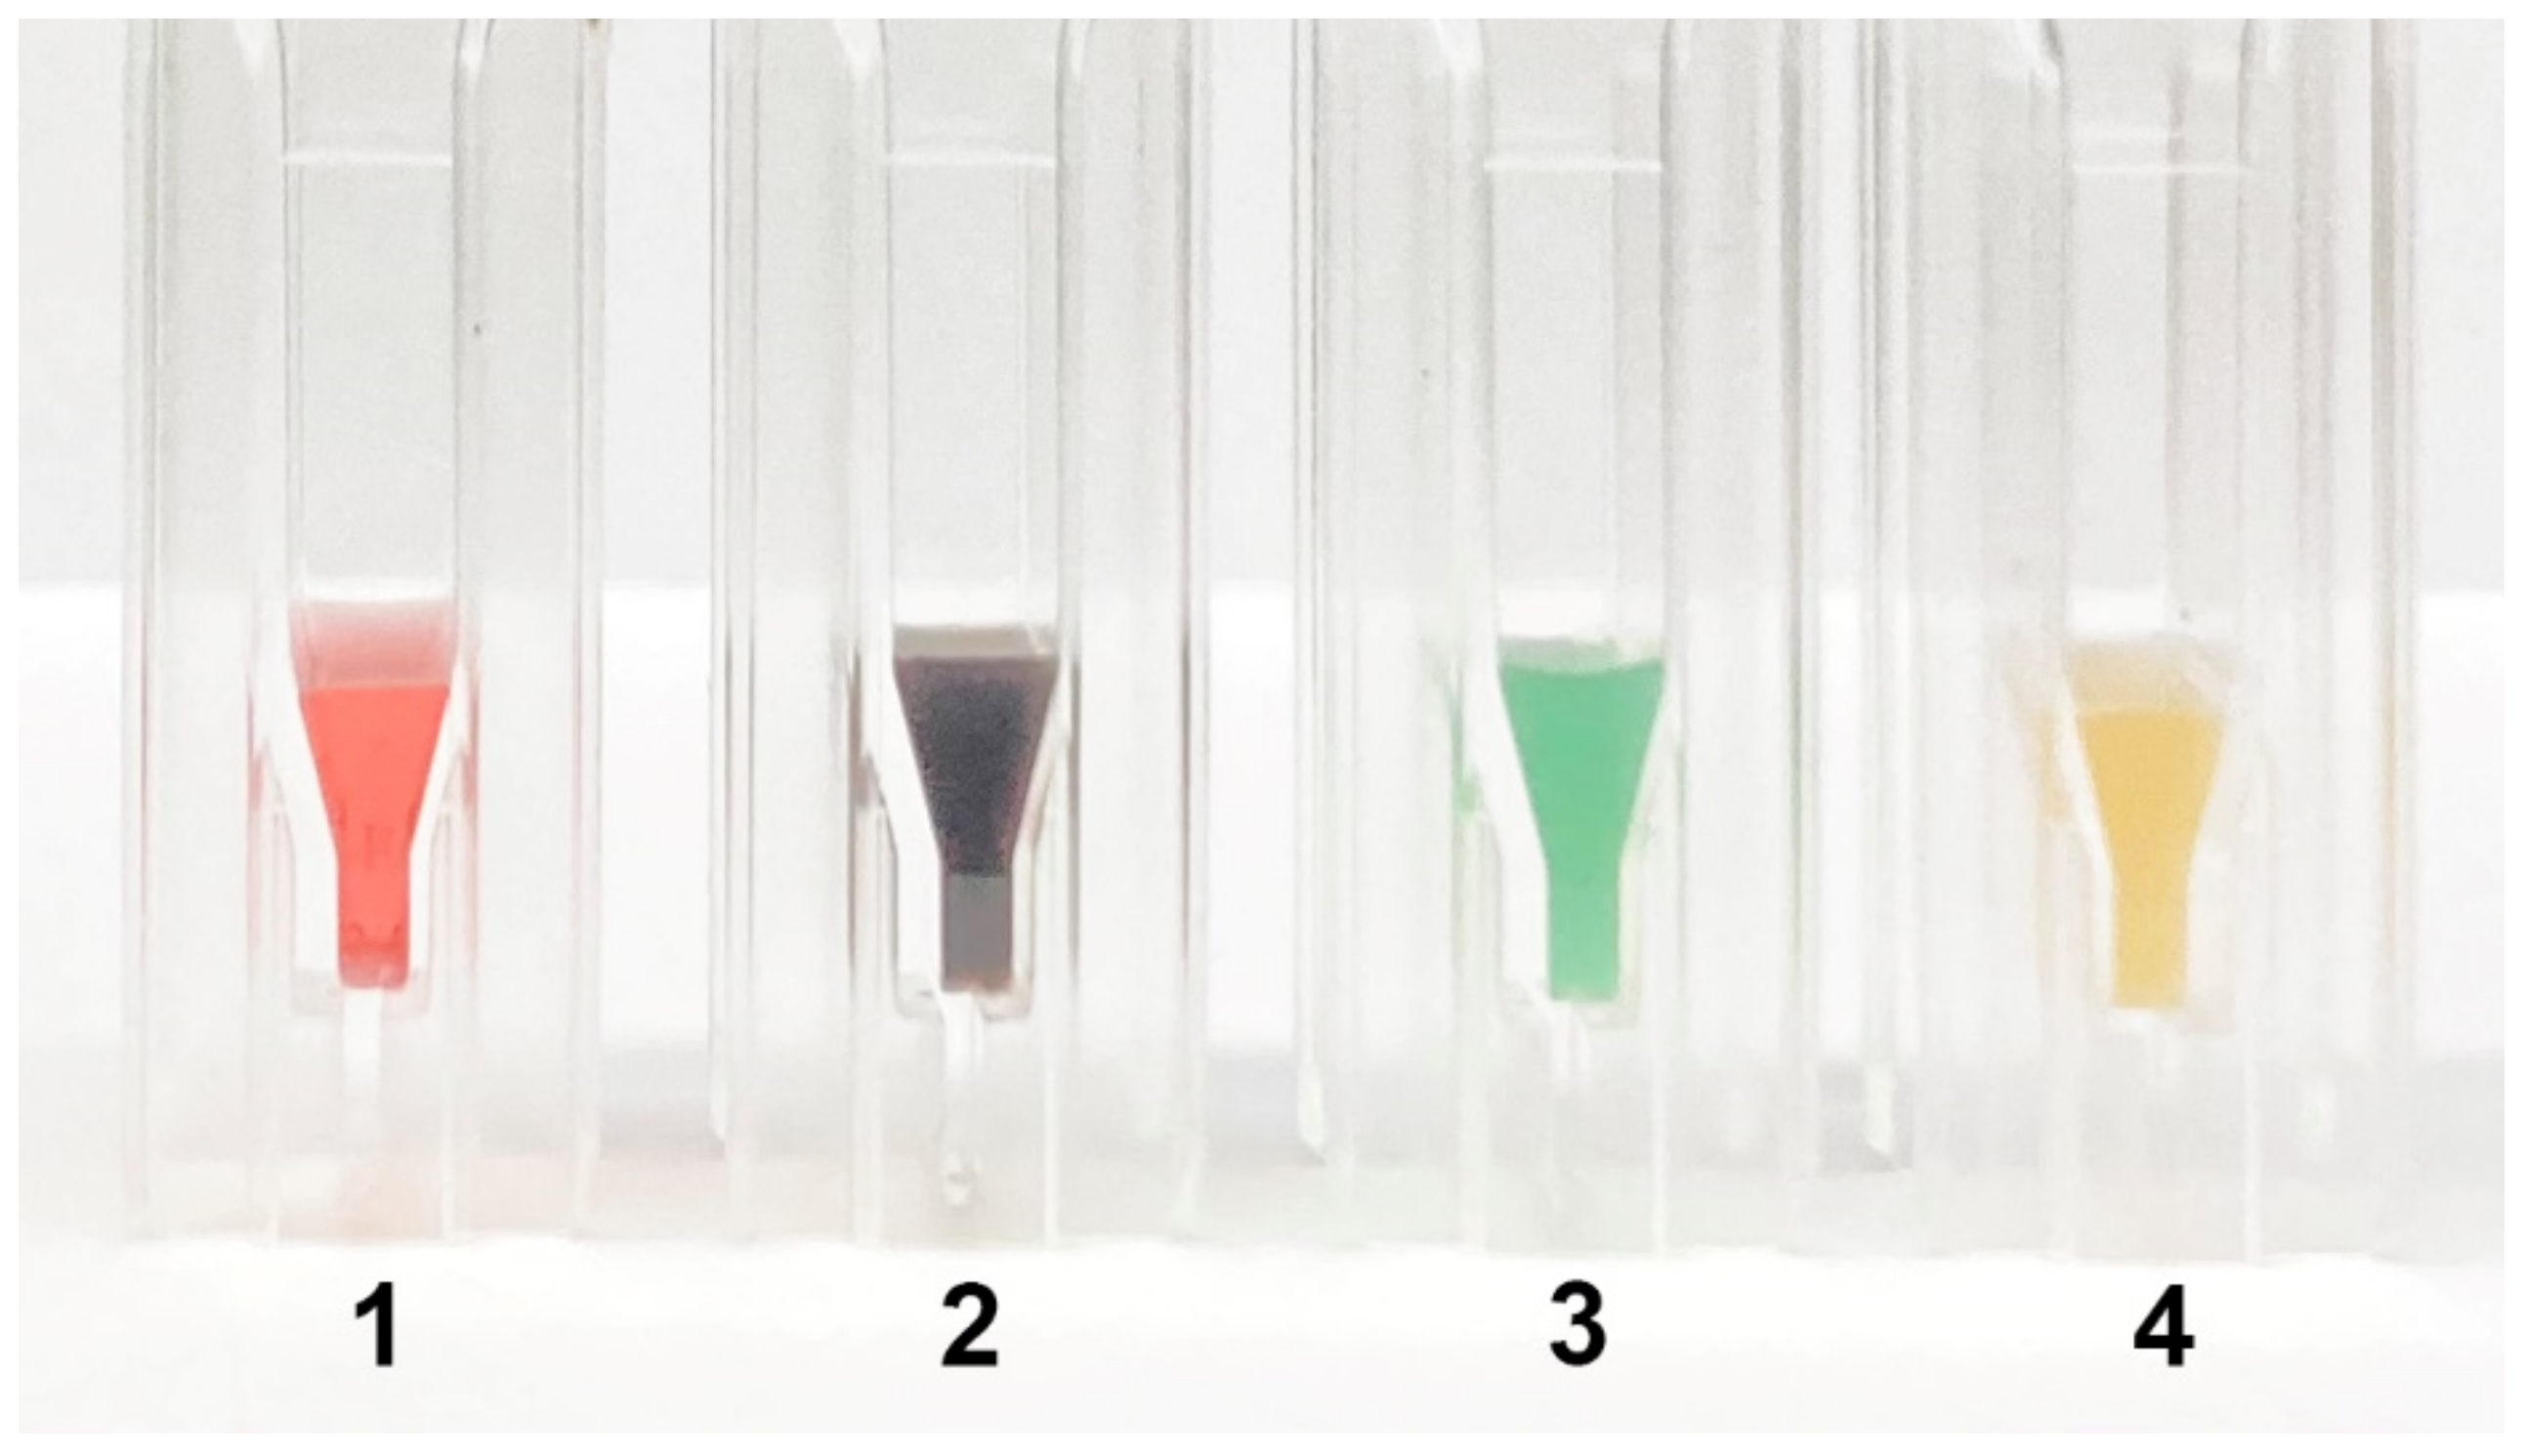
3.1. Synthesis and Characterization of Nanoparticle Labels and Their Conjugates
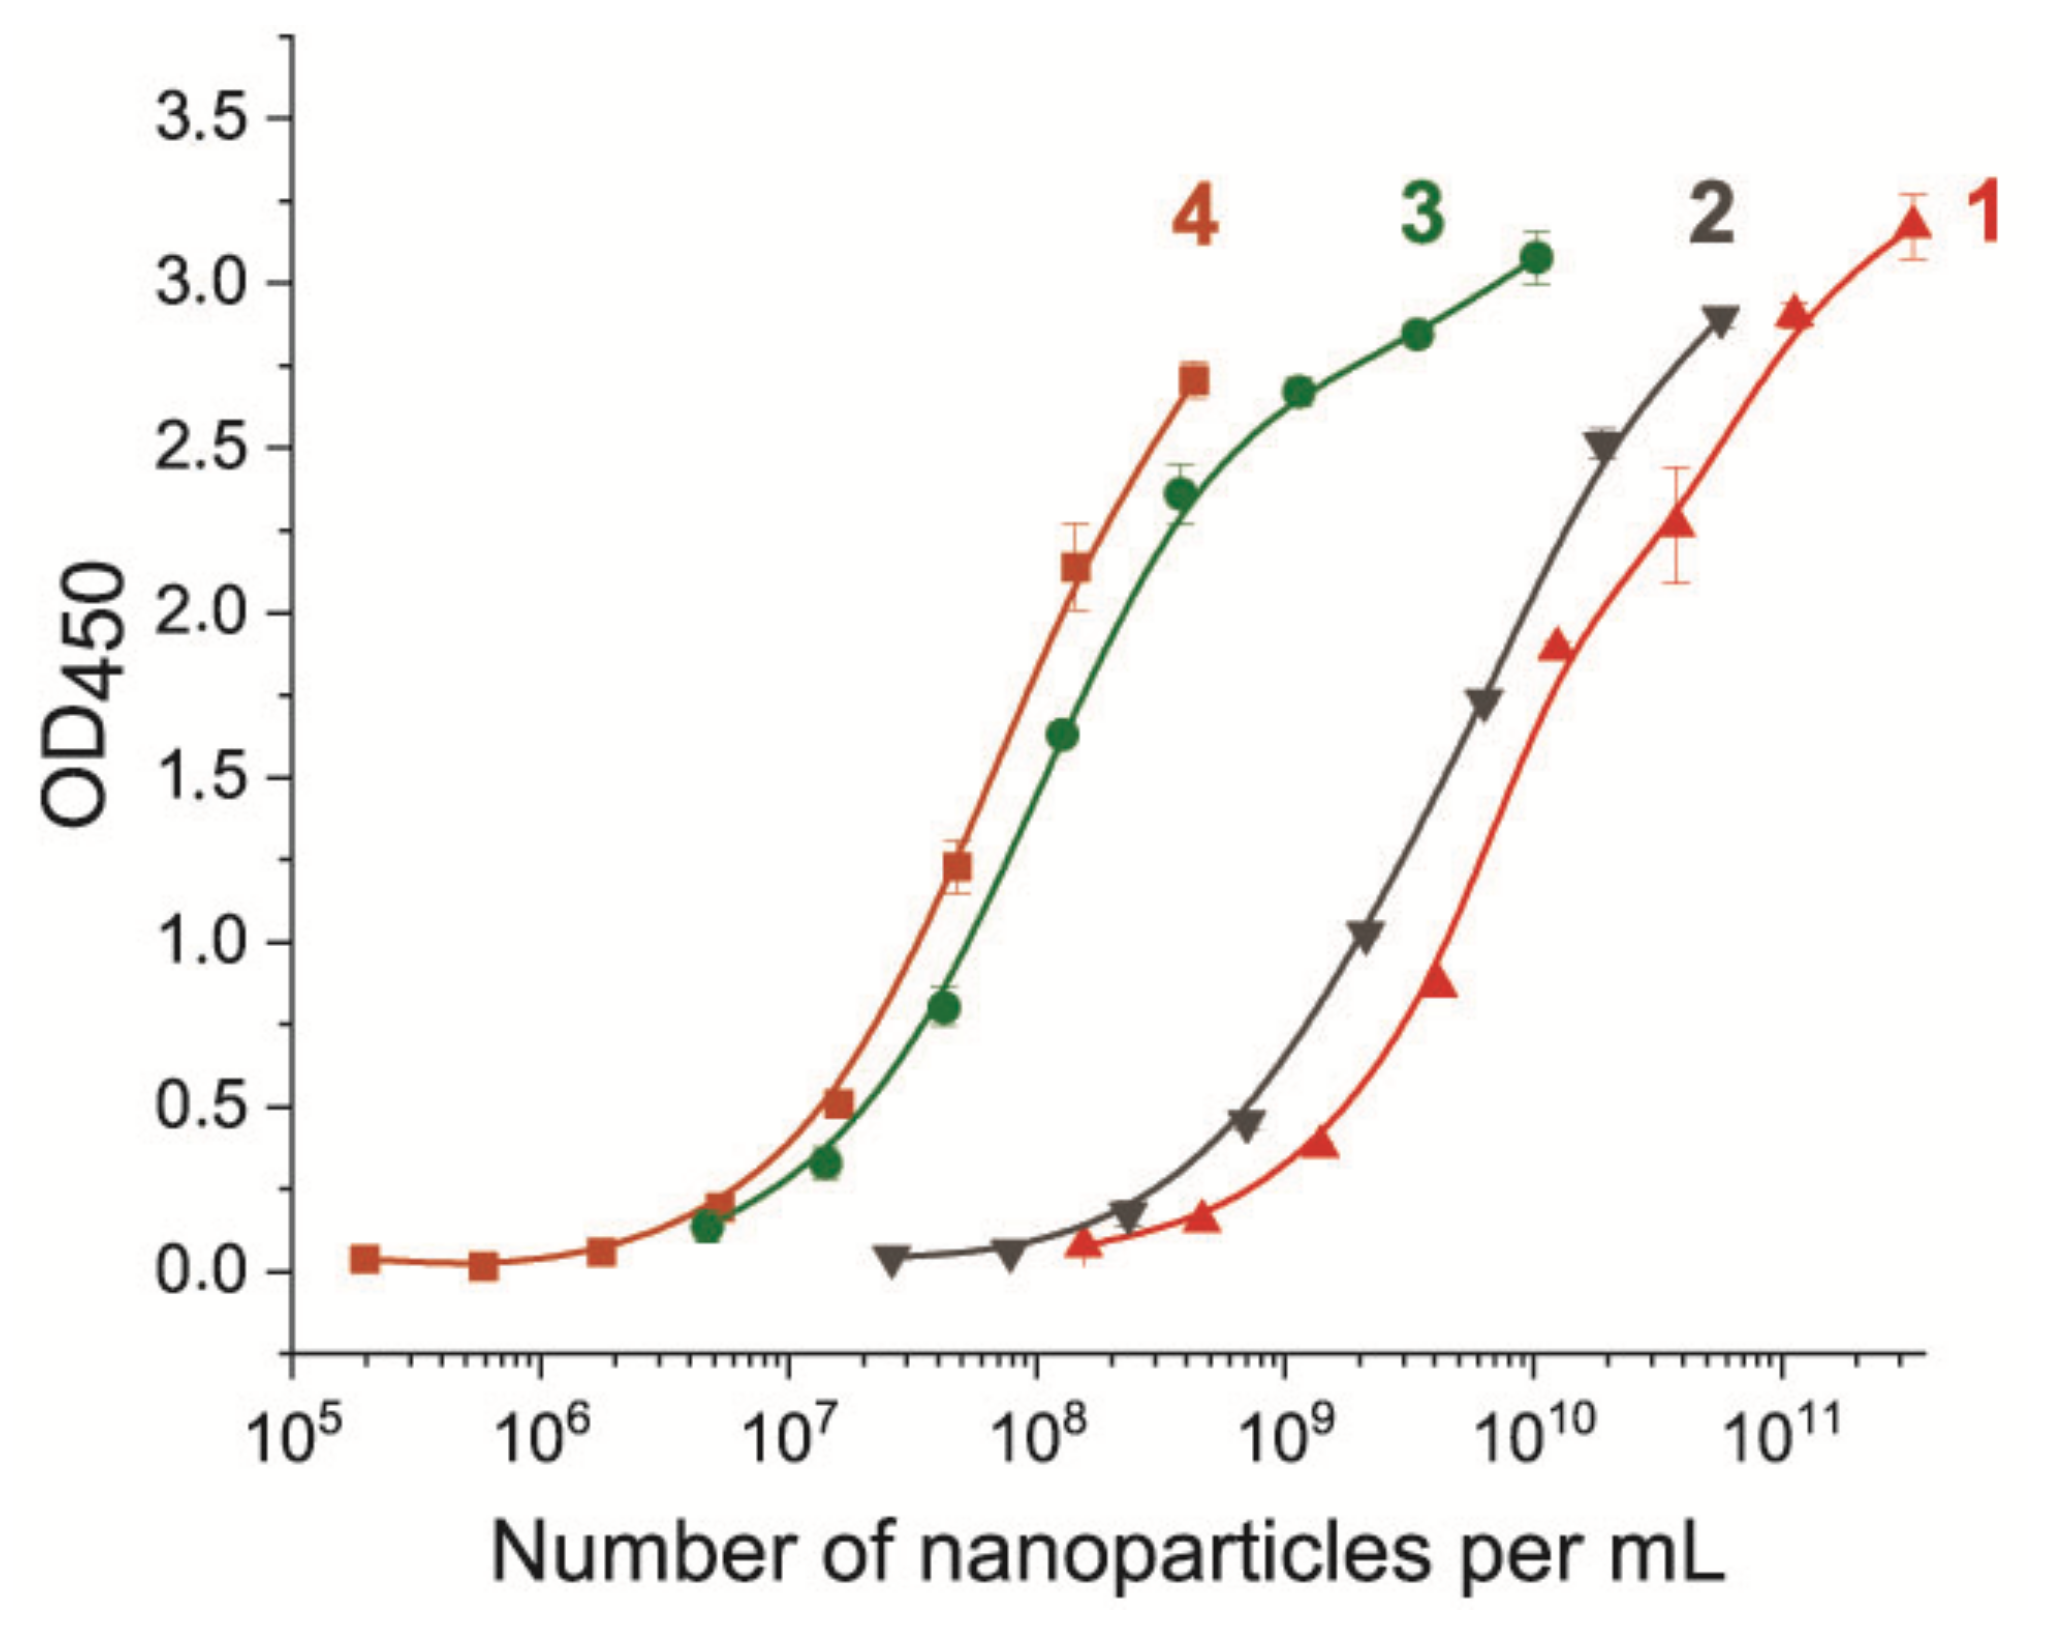
3.2. Comparison of Nanoparticle Labels Using ELISA
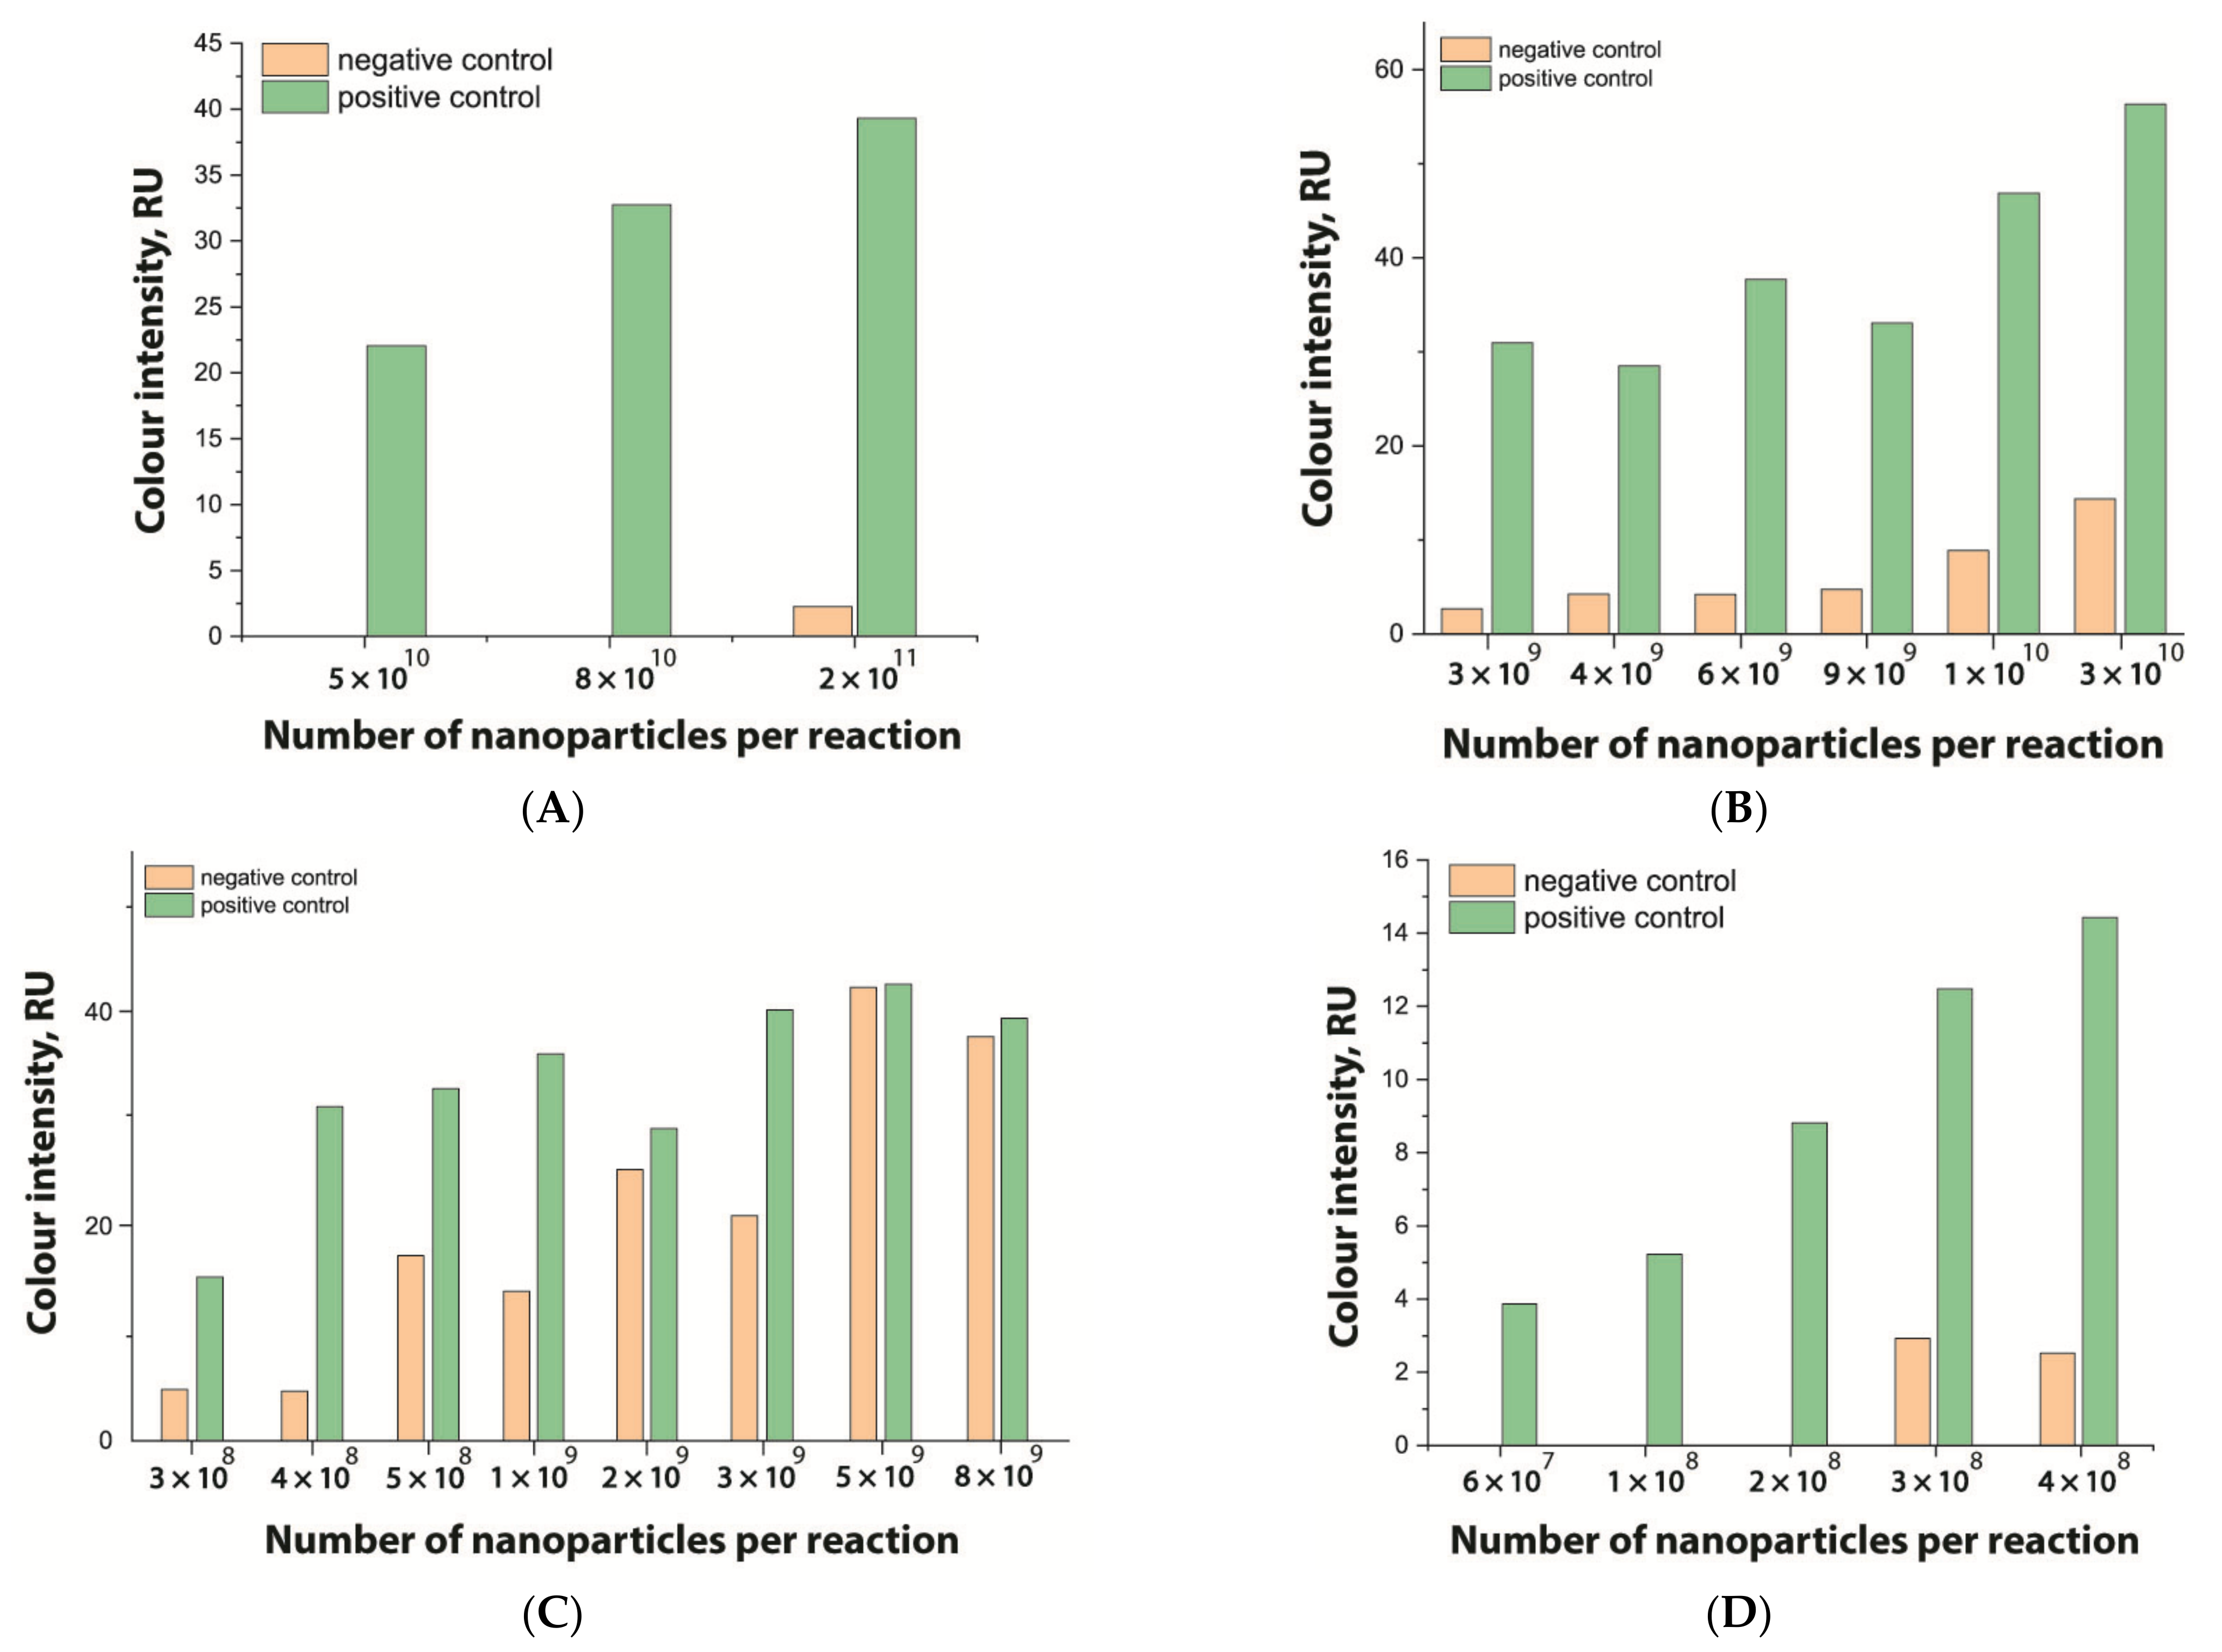
3.3. Comparison of Nanoparticle Labels Using LFIA
4. Conclusions
Supplementary Materials
Author Contributions
Funding
Institutional Review Board Statement
Informed Consent Statement
Data Availability Statement
Acknowledgments
Conflicts of Interest
References
- Soh, J.H.; Chan, H.-M.; Ying, J.Y. Strategies for developing sensitive and specific nanoparticle-based lateral flow assays as point-of-care diagnostic device. Nano Today 2020, 30, 100831. [Google Scholar] [CrossRef]
- Calucho, E.; Parolo, C.; Rivas, L.; Álvarez-Diduk, R.; Merkoçi, A. Chapter Ten—Nanoparticle-based lateral flow assays. In Comprehensive Analytical Chemistry; Merkoçi, A., Ed.; Elsevier: Amsterdam, The Netherlands, 2020; Volume 89, pp. 313–359. [Google Scholar]
- Parolo, C.; Sena-Torralba, A.; Bergua, J.F.; Calucho, E.; Fuentes-Chust, C.; Hu, L.; Rivas, L.; Álvarez-Diduk, R.; Nguyen, E.P.; Cinti, S.; et al. Tutorial: Design and fabrication of nanoparticle-based lateral-flow immunoassays. Nat. Protoc. 2020, 15, 3788–3816. [Google Scholar] [CrossRef] [PubMed]
- Usha, S.P.; Manoharan, H.; Deshmukh, R.; Álvarez-Diduk, R.; Calucho, E.; Sai, V.V.R.; Merkoçi, A. Attomolar analyte sensing techniques (AttoSens): A review on a decade of progress on chemical and biosensing nanoplatforms. Chem. Soc. Rev. 2021, 50, 13012–13089. [Google Scholar] [CrossRef]
- Deng, Y.; Jiang, H.; Li, X.; Lv, X. Recent advances in sensitivity enhancement for lateral flow assay. Microchim. Acta 2021, 188, 379. [Google Scholar] [CrossRef]
- Zherdev, A.V.; Dzantiev, B.B. Ways to reach lower detection limits of lateral flow immunoassays. In Rapid Test—Advances in Design, Format and Diagnostic Applications; IntechOpen Limited: London, UK, 2018; pp. 9–43. [Google Scholar]
- Zheng, C.; Wang, K.; Zheng, W.; Cheng, Y.; Li, T.; Ca, B.; Jin, Q.; Cui, D. Rapid developments in lateral flow immunoassay for nucleic acid detection. Analyst 2021, 146, 1514–1528. [Google Scholar] [CrossRef]
- Shirshahi, V.; Liu, G. Enhancing the analytical performance of paper lateral flow assays: From chemistry to engineering. TrAC Trends Anal. Chem. 2021, 136, 116200. [Google Scholar] [CrossRef]
- Panferov, V.G.; Safenkova, I.V.; Zherdev, A.V.; Dzantiev, B.B. Methods for increasing sensitivity of immunochromatographic test systems with colorimetric detection (Review). Appl. Biochem. Microbiol. 2021, 57, 143–151. [Google Scholar] [CrossRef]
- Zhou, Y.; Ding, L.; Wu, Y.; Huang, X.; Lai, W.; Xiong, Y. Emerging strategies to develop sensitive AuNP-based ICTS nanosensors. TrAC Trends Anal. Chem. 2019, 112, 147–160. [Google Scholar] [CrossRef]
- Guo, J.C.; Chen, S.Q.; Guo, J.H.; Ma, X. Nanomaterial labels in lateral flow immunoassays for point-of-care-testing. J. Mater. Sci. Technol. 2021, 60, 90–104. [Google Scholar] [CrossRef]
- Wang, Z.X.; Guo, L.L.; Liu, L.Q.; Kuang, H.; Xiao, J.; Xu, C.L. Development and comparison of two nanomaterial label-based lateral flow immunoassays for the detection of five antibacterial synergists. New J. Chem. 2020, 44, 16501–16510. [Google Scholar] [CrossRef]
- Taranova, N.A.; Berlina, A.N.; Semeykina, A.A.; Zherdev, A.V.; Dzantiev, B.B. Comparative characteristics of nanodisperse labels for immunochromatographic test systems. Nano Hybrid. Compos. 2017, 13, 32–38. [Google Scholar] [CrossRef]
- Panferov, V.G.; Safenkova, I.V.; Zherdev, A.V.; Dzantiev, B.B. Urchin peroxidase-mimicking Au@Pt nanoparticles as a label in lateral flow immunoassay: Impact of nanoparticle composition on detection limit of Clavibacter michiganensis. Microchim. Acta 2020, 187, 1–10. [Google Scholar] [CrossRef]
- Porras, J.C.; Bernuz, M.; Marfa, J.; Pallares-Rusinol, A.; Marti, M.; Pividori, M.I. Comparative study of gold and carbon nanoparticles in nucleic acid lateral flow assay. Nanomaterials 2021, 11, 741. [Google Scholar] [CrossRef] [PubMed]
- Li, X.M.; Wu, X.Z.; Wang, J.; Hua, Q.C.; Wu, J.X.; Shen, X.; Sun, Y.M.; Lei, H.T. Three lateral flow immunochromatographic assays based on different nanoparticle probes for on-site detection of tylosin and tilmicosin in milk and pork. Sens. Actuators B Chem. 2019, 301, 127059. [Google Scholar] [CrossRef]
- Li, S.J.; Sheng, W.; Wen, W.J.; Gu, Y.; Wang, J.P.; Wang, S. Three kinds of lateral flow immunochromatographic assays based on the use of nanoparticle labels for fluorometric determination of zearalenone. Microchim. Acta 2018, 185, 238. [Google Scholar] [CrossRef]
- Safenkova, I.; Zherdev, A.; Dzantiev, B. Factors influencing the detection limit of the lateral-flow sandwich immunoassay: A case study with potato virus X. Anal. Bioanal. Chem. 2012, 403, 1595–1605. [Google Scholar] [CrossRef]
- Wu, M.; Wu, Y.; Liu, C.; Tian, Y.; Fang, S.; Yang, H.; Li, B.; Liu, Q. Development and comparison of immunochromatographic strips with four nanomaterial labels: Colloidal gold, new colloidal gold, multi-branched gold nanoflowers and Luminol-reduced Au nanoparticles for visual detection of Vibrio parahaemolyticus in seafood. Aquaculture 2021, 539, 736563. [Google Scholar] [CrossRef]
- Banerjee, R.; Jaiswal, A. Recent advances in nanoparticle-based lateral flow immunoassay as a point-of-care diagnostic tool for infectious agents and diseases. Analyst 2018, 143, 1970–1996. [Google Scholar] [CrossRef] [PubMed]
- Wang, X.; Niessner, R.; Tang, D.P.; Knopp, D. Nanoparticle-based immunosensors and immunoassays for aflatoxins. Anal. Chim. Acta 2016, 912, 10–23. [Google Scholar] [CrossRef]
- Xue, Z.H.; Zhang, Y.X.; Yu, W.C.; Zhang, J.C.; Wang, J.Y.; Wan, F.; Kim, Y.; Liu, Y.D.; Kou, X.H. Recent advances in aflatoxin B1 detection based on nanotechnology and nanomaterials—A review. Anal. Chim. Acta 2019, 1069, 1–27. [Google Scholar] [CrossRef]
- Liu, L.; Jiang, H.; Wang, X. Functionalized gold nanomaterials as biomimetic nanozymes and biosensing actuators. TrAC Trends Anal. Chem. 2021, 143, 116376. [Google Scholar] [CrossRef]
- Chen, H.; Zhou, K.; Zhao, G.H. Gold nanoparticles: From synthesis, properties to their potential application as colorimetric sensors in food safety screening. Trends Food Sci. Technol. 2018, 78, 83–94. [Google Scholar] [CrossRef]
- Panferov, V.G.; Safenkova, I.V.; Zherdev, A.V.; Dzantiev, B.B. The steadfast Au@Pt soldier: Peroxide-tolerant nanozyme for signal enhancement in lateral flow immunoassay of peroxidase-containing samples. Talanta 2021, 225, 121961. [Google Scholar] [CrossRef]
- De Puig, H.; Tam, J.O.; Yen, C.-W.; Gehrke, L.; Hamad-Schifferli, K. Extinction coefficient of gold nanostars. J. Phys. Chem. C 2015, 119, 17408–17415. [Google Scholar] [CrossRef] [Green Version]
- Liu, X.; Atwater, M.; Wang, J.; Huo, Q. Extinction coefficient of gold nanoparticles with different sizes and different capping ligands. Colloids Surf. B Biointerfaces 2007, 58, 3–7. [Google Scholar] [CrossRef]
- Cui, X.; Huang, Y.; Wang, J.; Zhang, L.; Rong, Y.; Lai, W.; Chen, T. A remarkable sensitivity enhancement in a gold nanoparticle-based lateral flow immunoassay for the detection of Escherichia coli O157:H7. RSC Adv. 2015, 5, 45092–45097. [Google Scholar] [CrossRef]
- Garcia, V.S.; Guerrero, S.A.; Gugliotta, L.M.; Gonzalez, V.D. A lateral flow immunoassay based on colored latex particles for detection of canine visceral leishmaniasis. Acta Trop. 2020, 212, 105643. [Google Scholar] [CrossRef] [PubMed]
- Moyano, A.; Serrano-Pertierra, E.; Salvador, M.; Martínez-García, J.C.; Rivas, M.; Blanco-López, M.C. Magnetic lateral flow immunoassays. Diagnostics 2020, 10, 288. [Google Scholar] [CrossRef]
- Norelli, J.L.; Jones, A.L.; Aldwinckle, H.S. Fire blight management in the twenty-first century: Using new technologies that enhance host resistance in apple. Plant Dis. 2003, 87, 756–765. [Google Scholar] [CrossRef] [PubMed] [Green Version]
- Razo, S.C.; Safenkova, I.V.; Drenova, N.V.; Kharchenko, A.A.; Tsymbal, Y.S.; Varitsev, Y.A.; Zherdev, A.V.; Pakina, E.N.; Dzantiev, B.B. New lateral flow immunoassay for on-site detection of Erwinia amylovora and its application on various organs of infected plants. Physiol. Mol. Plant Pathol. 2021, 114, 101637. [Google Scholar] [CrossRef]
- Frens, G. Controlled nucleation for the regulation of the particle size in monodisperse gold suspensions. Nat. Phys. Sci. 1973, 241, 20–22. [Google Scholar] [CrossRef]
- Razo, S.C.; Panferov, V.G.; Safenkova, I.V.; Varitsev, Y.A.; Zherdev, A.V.; Pakina, E.N.; Dzantiev, B.B. How to improve sensitivity of sandwich lateral flow immunoassay for corpuscular antigens on the example of potato virus Y? Sensors 2018, 18, 3975. [Google Scholar] [CrossRef] [PubMed] [Green Version]
- Razo, S.C.; Panferov, V.G.; Safenkova, I.V.; Varitsev, Y.A.; Zherdev, A.V.; Dzantiev, B.B. Double-enhanced lateral flow immunoassay for potato virus X based on a combination of magnetic and gold nanoparticles. Anal. Chim. Acta 2018, 1007, 50–60. [Google Scholar] [CrossRef]
- Amini, M.; Pourmand, M.R.; Faridi-Majidi, R.; Heiat, M.; Mohammad Nezhady, M.A.; Safari, M.; Noorbakhsh, F.; Baharifar, H. Optimising effective parameters to improve performance quality in lateral flow immunoassay for detection of PBP2a in methicillin-resistant Staphylococcus aureus (MRSA). J. Exp. Nanosci. 2020, 15, 266–279. [Google Scholar] [CrossRef]
- AZoM. Common Terms Used in Dynamic Light Scattering; Malvern Panalytical: Manchester, UK, 2019; Available online: https://www.azom.com/article.aspx?ArticleID=9924 (accessed on 16 November 2021).
- Iqbal, M.; Usanase, G.; Oulmi, K.; Aberkane, F.; Bendaikha, T.; Fessi, H.; Zine, N.; Agusti, G.; Errachid, E.S.; Elaissari, A. Preparation of gold nanoparticles and determination of their particles size via different methods. Mater. Res. Bull. 2016, 79, 97–104. [Google Scholar] [CrossRef]
- Khlebtsov, N.G. Determination of Size and Concentration of Gold Nanoparticles from Extinction Spectra. Anal. Chem. 2008, 80, 6620–6625. [Google Scholar] [CrossRef]
- Jazayeri, M.H.; Amani, H.; Pourfatollah, A.A.; Pazoki-Toroudi, H.; Sedighimoghaddam, B. Various methods of gold nanoparticles (GNPs) conjugation to antibodies. Sens. Bio-Sens. Res. 2016, 9, 17–22. [Google Scholar] [CrossRef] [Green Version]
- Di Nardo, F.; Cavalera, S.; Baggiani, C.; Giovannoli, C.; Anfossi, L. Direct vs Mediated Coupling of Antibodies to Gold Nanoparticles: The Case of Salivary Cortisol Detection by Lateral Flow Immunoassay. ACS Appl. Mater. Interfaces 2019, 11, 32758–32768. [Google Scholar] [CrossRef]
- Carl, P.; Ramos, I.I.; Segundo, M.A.; Schneider, R.J. Antibody conjugation to carboxyl-modified microspheres through N-hydroxysuccinimide chemistry for automated immunoassay applications: A general procedure. PLoS ONE 2019, 14, e0218686. [Google Scholar] [CrossRef] [PubMed]
- Worsley, G.J.; Kumarswami, N.; Minelli, C.; Noble, J.E. Characterisation of antibody conjugated particles and their influence on diagnostic assay response. Anal. Methods 2015, 7, 9596–9603. [Google Scholar] [CrossRef]
- Posthuma-Trumpie, G.A.; Wichers, J.H.; Koets, M.; Berendsen, L.B.J.M.; van Amerongen, A. Amorphous carbon nanoparticles: A versatile label for rapid diagnostic (immuno)assays. Anal. Bioanal. Chem. 2012, 402, 593–600. [Google Scholar] [CrossRef] [Green Version]
- Manmana, Y.; Kubo, T.; Otsuka, K. Recent developments of point-of-care (POC) testing platform for biomolecules. TrAC Trends Anal. Chem. 2021, 135, 116160. [Google Scholar] [CrossRef]


| Test Strip Appearance | Dependencies of Colour Intensity in the Test Zone of LFIA from a Dilution of the Sample Spiked with E. amylovora | ||
|---|---|---|---|
| Au NPs | CN-95 |  |  |
| CN-140 |  | ||
| CN-180 |  | ||
| Au@Pt NPs | CN-95 |  |  |
| CN-140 |  | ||
| CN-180 |  | ||
| LPs | CN-95 |  |  |
| CN-140 |  | ||
| CN-180 |  | ||
| MNPs | CN-95 |  |  |
| CN-140 |  | ||
| CN-180 | N/A | ||
Publisher’s Note: MDPI stays neutral with regard to jurisdictional claims in published maps and institutional affiliations. |
© 2021 by the authors. Licensee MDPI, Basel, Switzerland. This article is an open access article distributed under the terms and conditions of the Creative Commons Attribution (CC BY) license (https://creativecommons.org/licenses/by/4.0/).
Share and Cite
Razo, S.C.; Elovenkova, A.I.; Safenkova, I.V.; Drenova, N.V.; Varitsev, Y.A.; Zherdev, A.V.; Dzantiev, B.B. Comparative Study of Four Coloured Nanoparticle Labels in Lateral Flow Immunoassay. Nanomaterials 2021, 11, 3277. https://0-doi-org.brum.beds.ac.uk/10.3390/nano11123277
Razo SC, Elovenkova AI, Safenkova IV, Drenova NV, Varitsev YA, Zherdev AV, Dzantiev BB. Comparative Study of Four Coloured Nanoparticle Labels in Lateral Flow Immunoassay. Nanomaterials. 2021; 11(12):3277. https://0-doi-org.brum.beds.ac.uk/10.3390/nano11123277
Chicago/Turabian StyleRazo, Shyatesa C., Anastasiya I. Elovenkova, Irina V. Safenkova, Natalia V. Drenova, Yuri A. Varitsev, Anatoly V. Zherdev, and Boris B. Dzantiev. 2021. "Comparative Study of Four Coloured Nanoparticle Labels in Lateral Flow Immunoassay" Nanomaterials 11, no. 12: 3277. https://0-doi-org.brum.beds.ac.uk/10.3390/nano11123277