
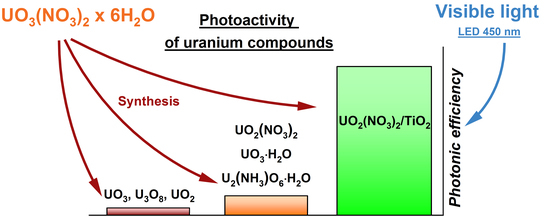
Synthesis, Characterization and Visible-Light Photocatalytic Activity of Solid and TiO2-Supported Uranium Oxycompounds

 ,
, 
 ,
,  ,
, 
Abstract
:
1. Introduction
2. Materials and Methods
2.1. Materials
2.2. Characterization Techniques
2.3. Photocatalytic Experiments
3. Results and Discussion
3.1. Synthesis and Characterization Data
3.2. Photocatalytic Activity
3.2.1. Solid Uranium Oxycompounds
3.2.2. TiO2-Supported Materials
4. Conclusions
Supplementary Materials
Author Contributions
Funding
Data Availability Statement
Acknowledgments
Conflicts of Interest
References
- Yang, X.; Wang, D. Photocatalysis: From Fundamental Principles to Materials and Applications. ACS Appl. Energy Mater. 2018, 1, 6657–6693. [Google Scholar] [CrossRef]
- Nayak, P.K.; Mahesh, S.; Snaith, H.J.; Cahen, D. Photovoltaic solar cell technologies: Analysing the state of the art. Nat. Rev. Mater. 2019, 4, 269–285. [Google Scholar] [CrossRef]
- Burschka, J.; Pellet, N.; Moon, S.-J.; Humphry-Baker, R.; Gao, P.; Nazeeruddin, M.K.; Grätzel, M. Sequential deposition as a route to high-performance perovskite-sensitized solar cells. Nature 2013, 499, 316–319. [Google Scholar] [CrossRef] [PubMed]
- Kudo, A.; Miseki, Y. Heterogeneous photocatalyst materials for water splitting. Chem. Soc. Rev. 2009, 38, 253–278. [Google Scholar] [CrossRef]
- Chen, X.; Shen, S.; Guo, L.; Mao, S.S. Semiconductor-based Photocatalytic Hydrogen Generation. Chem. Rev. 2010, 110, 6503–6570. [Google Scholar] [CrossRef] [PubMed]
- Cao, S.; Piao, L.; Chen, X. Emerging photocatalysts forhydrogen evolution. Trends Chem. 2020, 2, 57–70. [Google Scholar] [CrossRef]
- Ros, C.; Andreu, T.; Morante, J.R. Photoelectrochemical water splitting: A road from stable metal oxides to protected thin film solar cells. J. Mater. Chem. A 2020, 8, 10625–10669. [Google Scholar] [CrossRef]
- Anpo, M. Photocatalytic reduction of CO2 with H2O on highly dispersed Ti-oxide catalysts as a model of artificial photosynthesis. J. CO2 Util. 2013, 1, 8–17. [Google Scholar]
- Karamian, E.; Sharifnia, S. On the general mechanism of photocatalytic reduction of CO2. J. CO2 Util. 2016, 16, 194–203. [Google Scholar] [CrossRef]
- Pawar, A.U.; Kim, C.W.; Nguyen-Le, M.-T.; Kang, Y.S. General Review on the Components and Parameters of Photoelectrochemical System for CO2 Reduction with in Situ Analysis. ACS Sustain. Chem. Eng. 2019, 7, 7431–7455. [Google Scholar] [CrossRef]
- Kobielusz, M.; Mikrut, P. Photocatalytic Synthesis of Chemicals. Adv. Inorg. Chem. 2018, 72, 93–144. [Google Scholar]
- Sayama, K. Production of High-Value-Added Chemicals on Oxide Semiconductor Photoanodes under Visible Light for Solar Chemical-Conversion Processes. ACS Energy Lett. 2018, 3, 1093–1101. [Google Scholar] [CrossRef]
- Zhong, L.; Haghighat, F. Photocatalytic air cleaners and materials technologies—Abilities and limitations. Build. Environ. 2015, 91, 191–203. [Google Scholar] [CrossRef]
- Byrne, C.; Subramanian, G.; Pillai, S.C. Recent advances in photocatalysis for environmental applications. J. Environ. Chem. Eng. 2018, 6, 3531–3555. [Google Scholar] [CrossRef]
- Bhatkhande, D.S.; Pangarkar, V.G.; Beenackers, A.A. Photocatalytic degradation for environmental applications—A review. J. Chem. Technol. Biotechnol. 2002, 77, 102–116. [Google Scholar] [CrossRef]
- Hajkova, P.; Spatenka, P.; Horsky, J.; Horska, I.; Kolouch, A. Photocatalytic Effect of TiO2 Films on Viruses and Bacteria. Plasma Process. Polym. 2007, 4, S397–S401. [Google Scholar] [CrossRef]
- Weon, S.; He, F.; Choi, W. Status and challenges in photocatalytic nanotechnology for cleaning air polluted with volatile organic compounds: Visible light utilization and catalyst deactivation. Environ. Sci. Nano 2019, 6, 3185–3214. [Google Scholar] [CrossRef]
- Gaya, U.I.; Abdullah, A.H. Heterogeneous photocatalytic degradation of organic contaminants over titanium dioxide: A review of fundamentals, progress and problems. J. Photochem. Photobiol. C Photochem. Rev. 2008, 9, 1–12. [Google Scholar] [CrossRef]
- Friedmann, D.; Mendive, C.; Bahnemann, D. TiO2 for water treatment: Parameters affecting the kinetics and mechanisms of photocatalysis. Appl. Catal. B Environ. 2010, 99, 398–406. [Google Scholar] [CrossRef]
- Paz, Y. Application of TiO2 photocatalysis for air treatment: Patents’ overview. Appl. Catal. B Environ. 2010, 99, 448–460. [Google Scholar] [CrossRef]
- Nakata, K.; Fujishima, A. TiO2 photocatalysis: Design and applications. J. Photochem. Photobiol. C Photochem. Rev. 2012, 13, 169–189. [Google Scholar] [CrossRef]
- Lyulyukin, M.N.; Kolinko, P.A.; Selishchev, D.S.; Kozlov, D.V. Hygienic aspects of TiO2-mediated photocatalytic oxidation of volatile organic compounds: Air purification analysis using a total hazard index. Appl. Catal. B Environ. 2018, 220, 386–396. [Google Scholar] [CrossRef]
- Kavan, L.; Grätzel, M.; Gilbert, S.E.; Klemenz, C.; Scheel, H.J. Electrochemical and Photoelectrochemical Investigation of Single-Crystal Anatase. J. Am. Chem. Soc. 1996, 118, 6716–6723. [Google Scholar] [CrossRef]
- Mills, A.; Lee, S.-K.; Lepre, A.; Parkin, I.P.; O’Neill, S.A. Spectral and photocatalytic characteristics of TiO2 CVD films on quartz. Photochem. Photobiol. Sci. 2002, 1, 865–868. [Google Scholar] [CrossRef] [PubMed]
- Hagfeldt, A.; Grätzel, M. Light-Induced Redox Reactions in Nanocrystalline Systems. Chem. Rev. 1995, 95, 49–68. [Google Scholar] [CrossRef]
- American Society for Testing and Materials. ASTM G-173-03 (2012). Available online: http://rredc.nrel.gov/solar/spectra/am1.5/ (accessed on 20 March 2021).
- Etacheri, V.; Di Valentin, C.; Schneider, J.; Bahnemann, D.; Pillai, S.C. Visible-light activation of TiO2 photocatalysts: Advances in theory and experiments. J. Photochem. Photobiol. C Photochem. Rev. 2015, 25, 1–29. [Google Scholar] [CrossRef] [Green Version]
- Kolinko, P.A.; Filippov, T.N.; Kozlov, D.V.; Parmon, V.N. Ethanol vapor photocatalytic oxidation with uranyl modified titania under visible light: Comparison with silica and alumina. J. Photochem. Photobiol. A Chem. 2012, 250, 72–77. [Google Scholar] [CrossRef]
- Filippov, T.N.; Svintsitskiy, D.A.; Chetyrin, I.A.; Prosvirin, I.P.; Selishchev, D.S.; Kozlov, D.V. Photocatalytic and photochemical processes on the surface of uranyl-modified oxides: An in situ XPS study. Appl. Catal. A Gen. 2018, 558, 81–90. [Google Scholar] [CrossRef]
- Selishchev, D.S.; Filippov, T.N.; Lyulyukin, M.N.; Kozlov, D.V. Uranyl-modified TiO2 for complete photocatalytic oxidation of volatile organic compounds under UV and visible light. Chem. Eng. J. 2019, 370, 1440–1449. [Google Scholar] [CrossRef]
- Hill, R.J.; Kemp, T.J.; Allen, D.M.; Cox, A. Absorption spectrum, lifetime and photoreactivity towards alcohols of the excited state of the aqueous uranyl ion (UO22+). J. Chem. Soc. Faraday Trans. 1 Phys. Chem. Condens. Phases 1974, 70, 847. [Google Scholar]
- Sarakha, M.; Bolte, M.; Burrows, H.D. Electron-Transfer Oxidation of Chlorophenols by Uranyl Ion Excited State in Aqueous Solution. Steady-State and Nanosecond Flash Photolysis Studies. J. Phys. Chem. A 2000, 104, 3142–3149. [Google Scholar] [CrossRef] [Green Version]
- Benson, P.; Cox, A.; Kemp, T.J.; Sultana, Q. Concentration and temperature quenching of the excited state of the uranyl ion in aqueous solution by laser flash photolysis. Chem. Phys. Lett. 1975, 35, 195–197. [Google Scholar] [CrossRef]
- Azenha, M.E.D.G.; Burrows, H.D.; Formosinho, S.J.; Miguel, M.G.M.; Daramanyan, A.P.; Khudyakov, I.V. On the uranyl ion luminescence in aqueous solutions. J. Lumin. 1991, 48–49, 522–526. [Google Scholar] [CrossRef]
- Burrows, H.D.; Kemp, T.J. The photochemistry of the uranyl ion. Chem. Soc. Rev. 1974, 3, 139–165. [Google Scholar] [CrossRef]
- Wang, W.-D.; Bakac, A.; Espenson, J.H. Uranium(VI)-Catalyzed Photooxidation of Hydrocarbons with Molecular Oxygen. Inorg. Chem. 1995, 34, 6034–6039. [Google Scholar] [CrossRef]
- Suib, S.L.; Kostapapas, A.; Psaras, D. Photoassisted Catalytic Oxidation of Isopropyl Alcohol by Uranyl-Exchanged Zeolites. J. Am. Chem. Soc. 1984, 106, 1614–1620. [Google Scholar] [CrossRef]
- Suib, S.L.; Tanguay, J.F.; Occelli, M.L. Comparison of the photochemical and photophysical properties of clays, pillared clays, and zeolites. J. Am. Chem. Soc. 1986, 108, 6972–6977. [Google Scholar] [CrossRef]
- Vidya, K.; Kamble, V.S.; Gupta, N.M.; Selvam, P. An in situ FT-IR study of photo-oxidation of alcohols over uranyl-anchored MCM-41: Possible reaction pathways. J. Catal. 2007, 247, 1–19. [Google Scholar] [CrossRef]
- Vidya, K.; Kamble, V.S.; Selvam, P.; Gupta, N.M. Uranyl-anchored MCM-41 as a highly efficient photocatalyst for the complete oxidation of methanol under sunlight. Appl. Catal. B Environ. 2004, 54, 145–154. [Google Scholar] [CrossRef]
- He, H.; Andersson, D.A.; Allred, D.D.; Rector, K.D. Determination of the insulation gap of uranium oxides by spectroscopic ellipsometry and density functional theory. J. Phys. Chem. C 2013, 117, 16540–16551. [Google Scholar] [CrossRef]
- Jain, V.; Biesinger, M.C.; Linford, M.R. The Gaussian-Lorentzian Sum, Product, and Convolution (Voigt) functions in the context of peak fitting X-ray photoelectron spectroscopy (XPS) narrow scans. Appl. Surf. Sci. 2018, 447, 548–553. [Google Scholar] [CrossRef]
- Kovalevskiy, N.S.; Selishcheva, S.A.; Solovyeva, M.I.; Selishchev, D.S. In situ IR spectroscopy data and effect of the operational parameters on the photocatalytic activity of N-doped TiO2. Data Br. 2019, 24, 103917. [Google Scholar] [CrossRef]
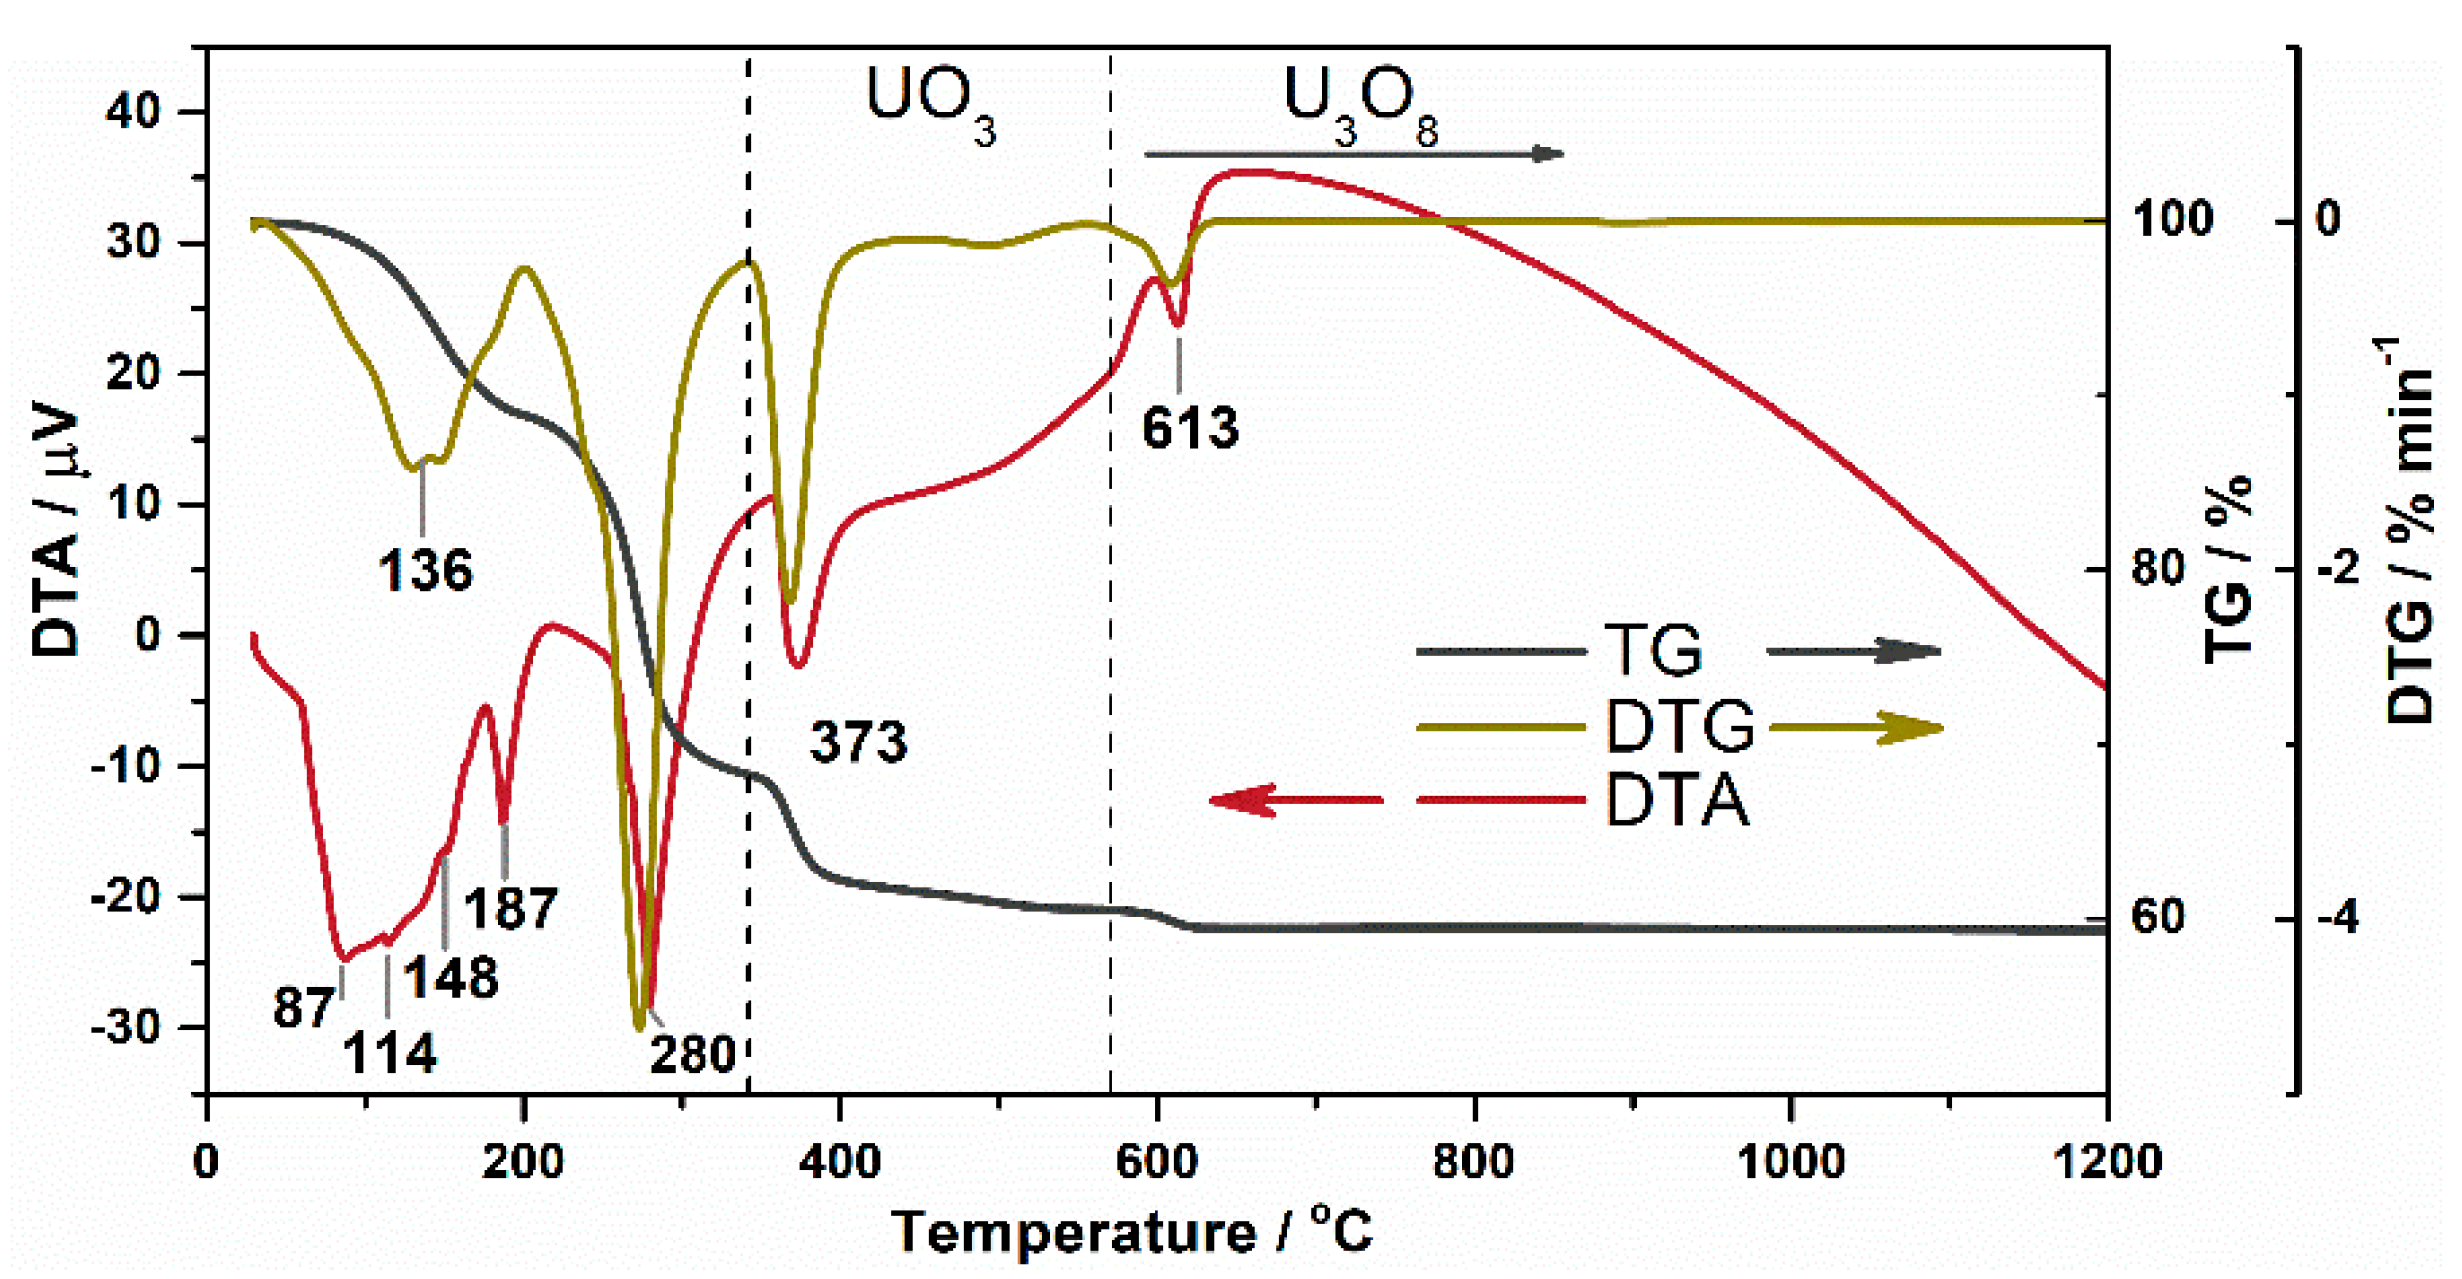
- Kozlova, R.D.; Matyukha, V.A.; Dedov, N.V. Mechanism and kinetics of thermal decomposition of uranyl nitrate hexahydrate under the nonisothermal conditions. Radiochemistry 2007, 49, 130–134. [Google Scholar] [CrossRef]
- Evans, W.J.; Hanusa, T.P. (Eds.) The Heaviest Metals: Science and Technology of the Actinides and Beyond; John Wiley & Sons: Hoboken, NJ, USA, 2019; ISBN 978-1-119-30409-8. [Google Scholar]
- Meyer, G.; Morss, L.R. (Eds.) Synthesis of Lanthanide and Actinide Compounds; Springer: Berlin/Heidelberg, Germany, 1991; ISBN 978-0792310181. [Google Scholar]
- Garrido, F.; Hannon, A.C.; Ibberson, R.M.; Nowicki, L.; Willis, B.T.M. Neutron Diffraction Studies of U4O9: Comparison with EXAFS Results. Inorg. Chem. 2006, 45, 8408–8413. [Google Scholar] [CrossRef] [PubMed]
- Desgranges, L.; Baldinozzi, G.; Rousseau, G.; Nièpce, J.-C.; Calvarin, G. Neutron Diffraction Study of the in Situ Oxidation of UO2. Inorg. Chem. 2009, 48, 7585–7592. [Google Scholar] [CrossRef] [PubMed]
- Brincat, N.A.; Parker, S.C.; Molinari, M.; Allen, G.C.; Storr, M.T. Density functional theory investigation of the layered uranium oxides U3O8 and U2O5. Dalt. Trans. 2015, 44, 2613–2622. [Google Scholar] [CrossRef]
- Gouder, T.; Eloirdi, R.; Caciuffo, R. Direct observation of pure pentavalent uranium in U2O5 thin films by high resolution photoemission spectroscopy. Sci. Rep. 2018, 8, 1–7. [Google Scholar] [CrossRef] [PubMed] [Green Version]
- Liu, Y.; Becker, B.; Burdine, B.; Sigmon, G.E.; Burns, P.C. Photocatalytic decomposition of Rhodamine B on uranium-doped mesoporous titanium dioxide. RSC Adv. 2017, 7, 21273–21280. [Google Scholar] [CrossRef] [Green Version]
- Ohwada, K. Infrared Spectoscopic Studies of Some Uranyl Nitrate Complexes. J. Coord. Chem. 1976, 6, 75–80. [Google Scholar] [CrossRef]
- Sweet, L.E.; Blake, T.A.; Henager, C.H.; Hu, S.; Johnson, T.J.; Meier, D.E.; Peper, S.M.; Schwantes, J.M. Investigation of the polymorphs and hydrolysis of uranium trioxide. J. Radioanal. Nucl. Chem. 2013, 296, 105–110. [Google Scholar] [CrossRef]
- Dines, T.J.; Rochester, C.H.; Ward, A.M. Infrared and Raman Study of the Adsorption of NH3, Pyridine, NO and NO2 on Anatase. J. Chem. Soc. Faraday Trans. 1991, 87, 643–651. [Google Scholar] [CrossRef]
- Khilla, M.A.; El-Fekey, S.A.; Yahia, M.E.M.; Inorg, N.R.C. Electrical conductivity of some uranium oxides in the composition range UO3-U3O8. Radiochim. Acta 1981, 28, 115–117. [Google Scholar] [CrossRef]
- Hanafi, Z.M.; Ismail, F.M.; Khilla, M.A.; Rofail, N.H. The Electrical Conductivity of the Different Uranium Trioxide “UO3” Phases. Radiochim. Acta 1990, 49, 35–38. [Google Scholar] [CrossRef]
- Pillai, C.G.S.; Dua, A.K.; Raj, P. Thermal conductivity of U3O8 from 300 to 1100 K. J. Nucl. Mater. 2001, 288, 87–91. [Google Scholar] [CrossRef]
- Weisensee, P.B.; Feser, J.P.; Cahill, D.G. Effect of ion irradiation on the thermal conductivity of UO2 and U3O8 epitaxial layers. J. Nucl. Mater. 2013, 443, 212–217. [Google Scholar] [CrossRef]
- Idriss, H. Surface reactions of uranium oxide powder, thin films and single crystals. Surf. Sci. Rep. 2010, 65, 67–109. [Google Scholar] [CrossRef]
- Kim, Y.-H.H.; Irie, H.; Hashimoto, K. A visible light-sensitive tungsten carbide/tungsten trioxde composite photocatalyst. Appl. Phys. Lett. 2008, 92, 2006–2009. [Google Scholar] [CrossRef]
- Maruyama, Y.; Irie, H.; Hashimoto, K. Visible Light Sensitive Photocatalyst, Delafossite Structured α-AgGaO2. J. Phys. Chem. B 2006, 110, 23274–23278. [Google Scholar] [CrossRef] [PubMed]
- Muñoz-Batista, M.J.; Kubacka, A.; Fernández-García, M. Effect of g-C3N4 loading on TiO2-based photocatalysts: UV and visible degradation of toluene. Catal. Sci. Technol. 2014, 4, 2006. [Google Scholar] [CrossRef]


| Sample | Synthesis | Crystal Phase 1 | Uranium States at Surface 2 | as,BET, m2 g–1 |
|---|---|---|---|---|
| UO2(NO3)2 | Commercial UO2(NO3)2·6H2O | UO2(NO3)2·6H2O | U6+ (100%) [29] | 2.5 ± 0.3 |
| UO3 | Calcination of UO2(NO3)2·6H2O at 400 °C for 3 h | β-UO3 | U6+ (100%) | 0.6 ± 0.1 |
| U3O8-T600 | Calcination of UO2(NO3)2·6H2O at 600 °C for 3 h | U3O8 | 5.3 ± 0.1 | |
| U3O8-T900 | Calcination of UO2(NO3)2·6H2O at 900 °C for 3 h | U3O8 | U6+ (63%) U4+ (37%) [29] | 1.5 ± 0.1 |
| UO2+x | Hydrothermal treatment of uranyl nitrate in water solution with an excess of ethylenediamine at 160 °C for 72 h | U2.12 | U5+ (79%) U4+ (21%) | <0.5 3 |
| U2(NH3)O6·3H2O | Hydrothermal treatment of uranyl nitrate in water solution with an excess of ethanol and ammonia at 160 °C for 72 h | U2(NH3)O6·3H2O | U6+ (65%) U5+ (35%) | 19.1 ± 0.2 |
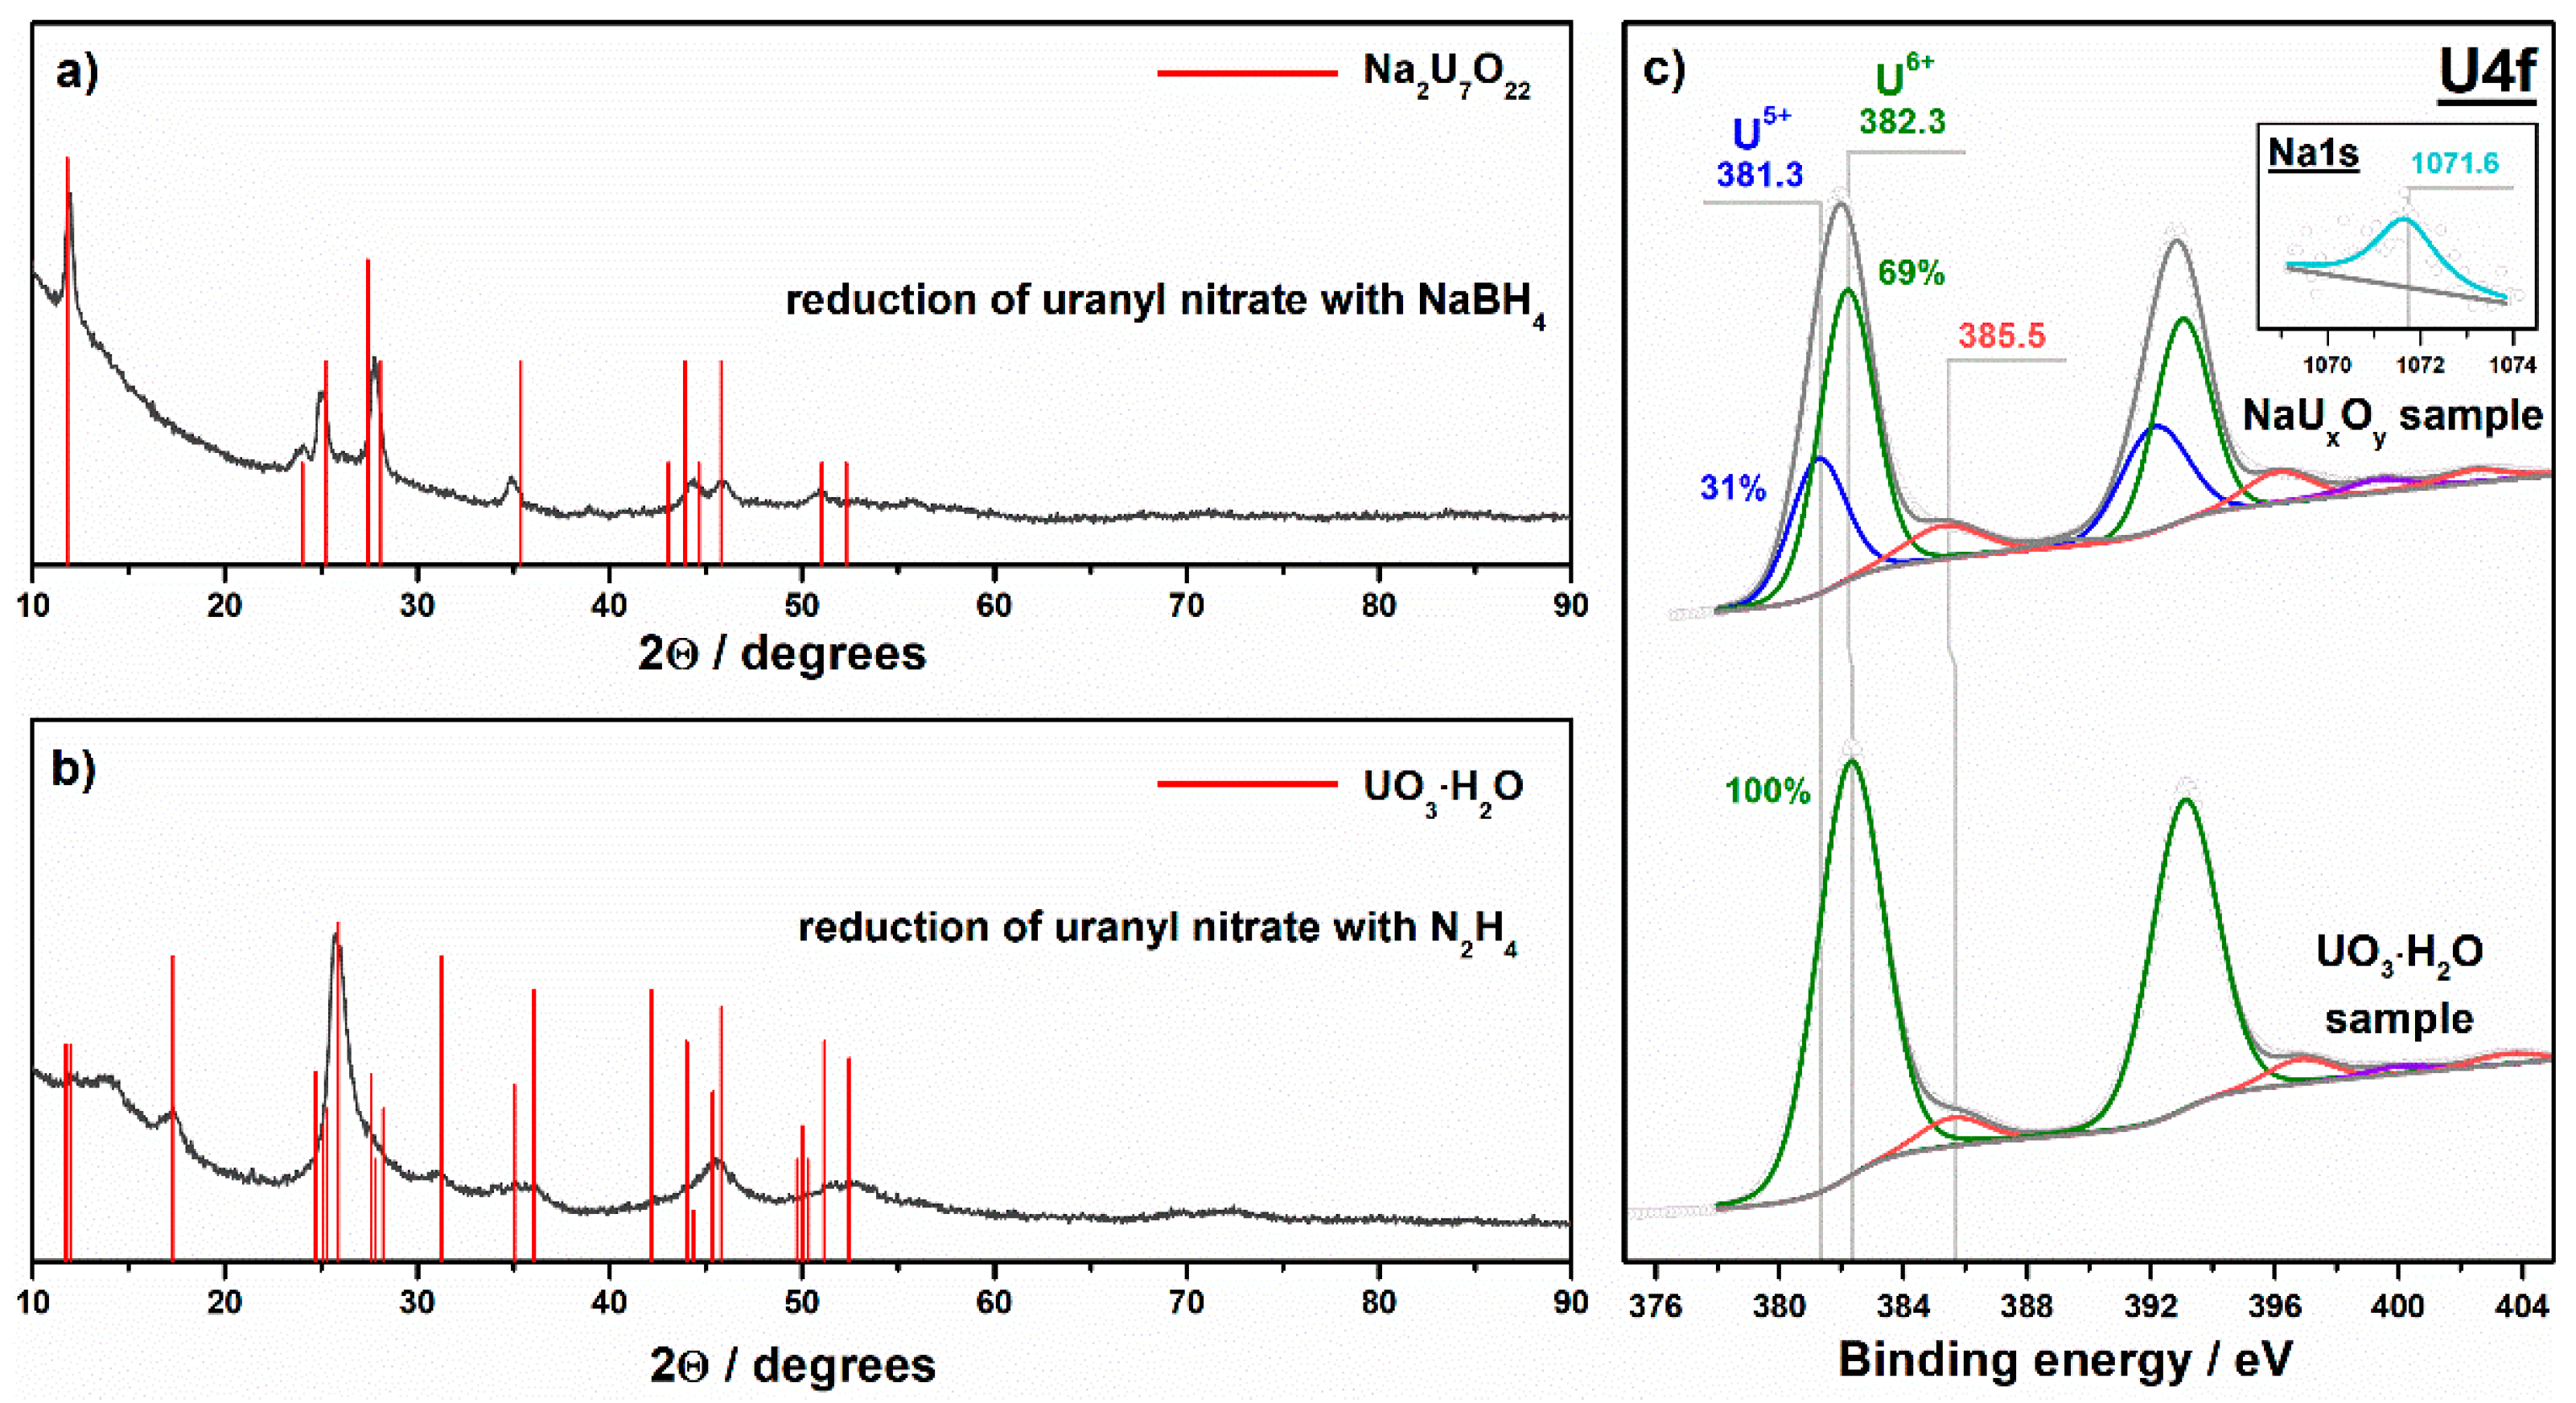
| NaUxOy | Chemical reduction of uranyl nitrate with sodium borohydride | Na2U7O22 | U6+ (69%) U5+ (31%) | <2.3 3 |
| UO3·H2O | Chemical reduction of uranyl nitrate with hydrazine | UO3·H2O | U6+ (100%) | 16.4 ± 0.4 |
| TiO2 | Commercial TiO2 Hombifine N | Anatase | 327 | |
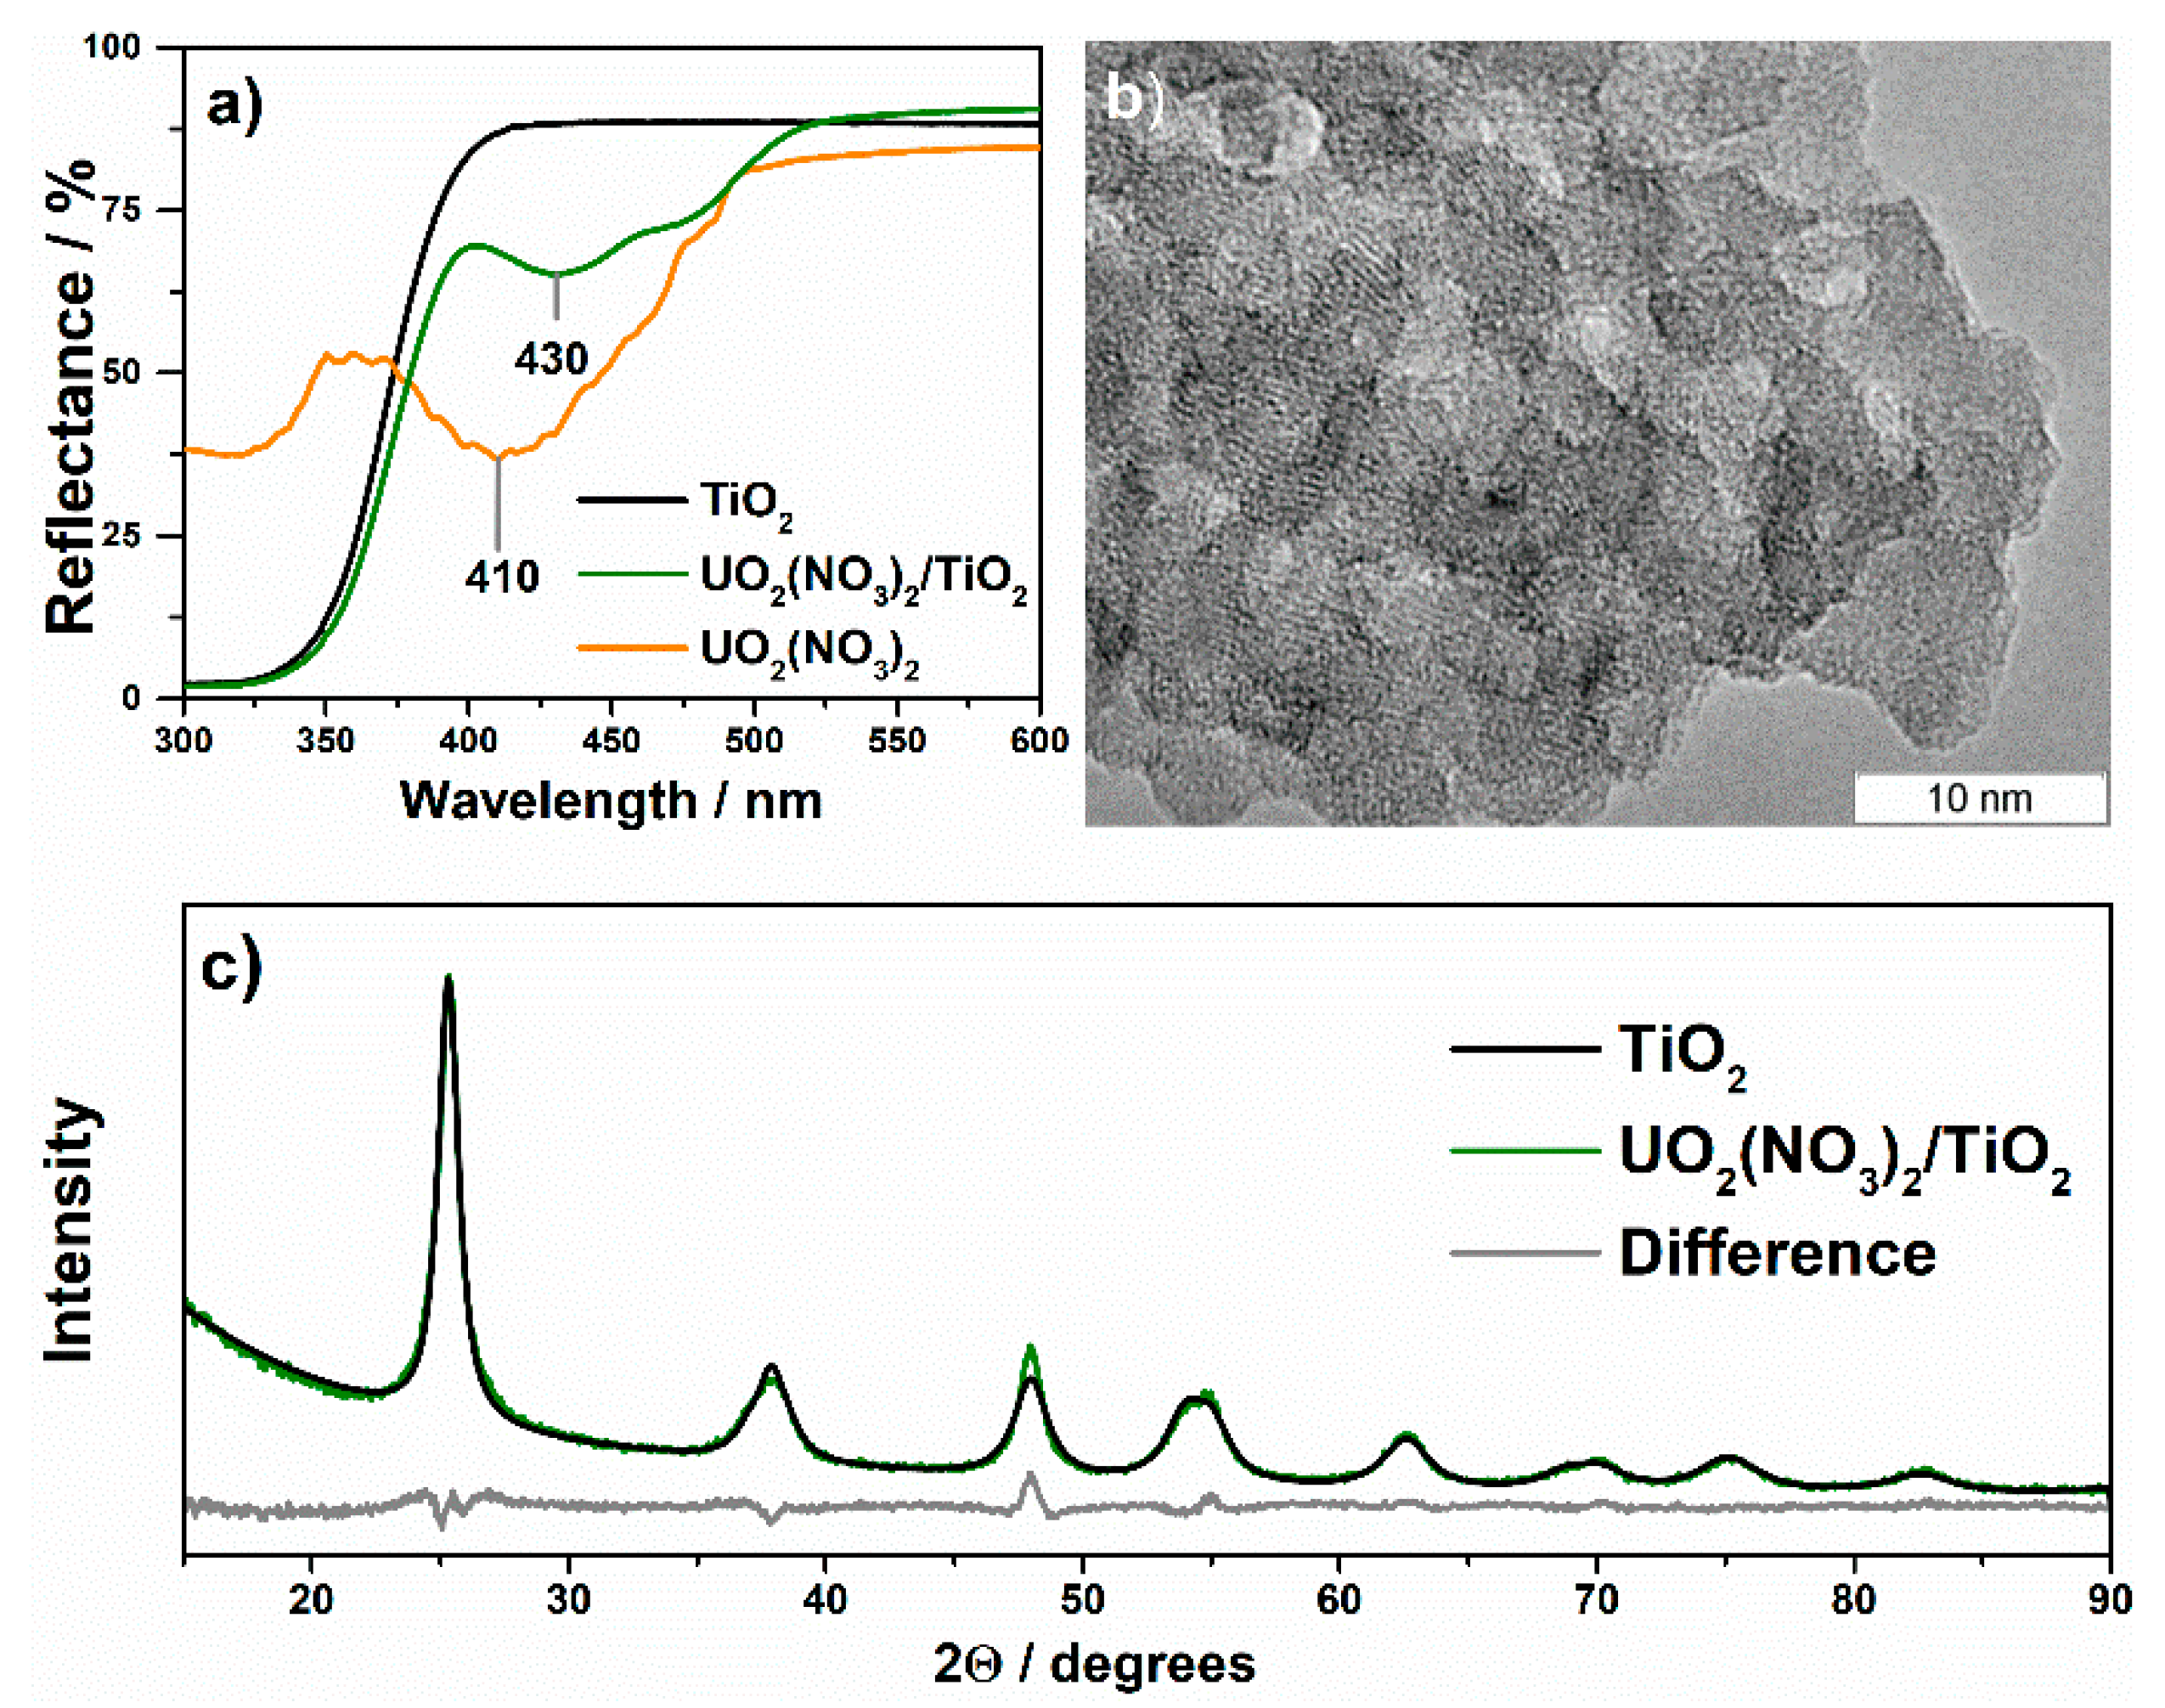
| UO2(NO3)2/ TiO2 | Impregnation of TiO2 with water solution of uranyl nitrate followed by drying at 160 °C | n.d. 4/anatase | U6+ (100%) 5 | 298 |
| UO2(NO3)2/ TiO2-HT | Hydrothermal treatment of UO2(NO3)2/TiO2 in water suspension with an excess of ethanol at 160 °C for 48 h | n.d./anatase | U6+ (24%) U5+ (25%) U4+ (51%) | 84 |
| UO2(NO3)2/ TiO2-T500 | Calcination of UO2(NO3)2/TiO2 at 500 °C for 3 h | n.d./anatase | U4+ (100%) | 103 |
| VLP7000 | Commercial TiO2 KRONOS® vlp 7000 | Anatase | 250 |
Publisher’s Note: MDPI stays neutral with regard to jurisdictional claims in published maps and institutional affiliations. |
© 2021 by the authors. Licensee MDPI, Basel, Switzerland. This article is an open access article distributed under the terms and conditions of the Creative Commons Attribution (CC BY) license (https://creativecommons.org/licenses/by/4.0/).
Share and Cite
Lyulyukin, M.; Filippov, T.; Cherepanova, S.; Solovyeva, M.; Prosvirin, I.; Bukhtiyarov, A.; Kozlov, D.; Selishchev, D. Synthesis, Characterization and Visible-Light Photocatalytic Activity of Solid and TiO2-Supported Uranium Oxycompounds. Nanomaterials 2021, 11, 1036. https://0-doi-org.brum.beds.ac.uk/10.3390/nano11041036
Lyulyukin M, Filippov T, Cherepanova S, Solovyeva M, Prosvirin I, Bukhtiyarov A, Kozlov D, Selishchev D. Synthesis, Characterization and Visible-Light Photocatalytic Activity of Solid and TiO2-Supported Uranium Oxycompounds. Nanomaterials. 2021; 11(4):1036. https://0-doi-org.brum.beds.ac.uk/10.3390/nano11041036
Chicago/Turabian StyleLyulyukin, Mikhail, Tikhon Filippov, Svetlana Cherepanova, Maria Solovyeva, Igor Prosvirin, Andrey Bukhtiyarov, Denis Kozlov, and Dmitry Selishchev. 2021. "Synthesis, Characterization and Visible-Light Photocatalytic Activity of Solid and TiO2-Supported Uranium Oxycompounds" Nanomaterials 11, no. 4: 1036. https://0-doi-org.brum.beds.ac.uk/10.3390/nano11041036