
Synthesis of Polystyrene-Based Cationic Nanomaterials with Pro-Oxidant Cytotoxic Activity on Etoposide-Resistant Neuroblastoma Cells


Abstract
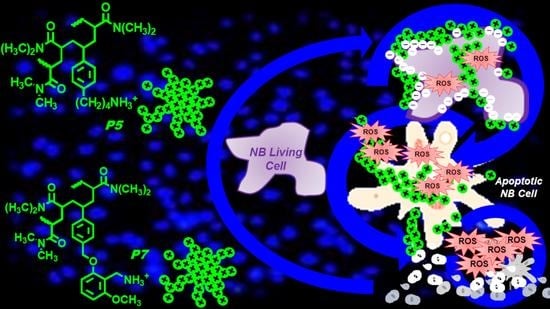
:
1. Introduction
2. Materials and Methods
2.1. Chemicals and Instruments
2.2. 2-Methoxy-6-[(4-vinyl)benzyloxy]benzylamine Hydrochloride M7 (7)
2.2.1. Chloromethylmethylether (1)
- Fraction 1. Bp. = 53 °C, 1.05 g, which was discarded.
- Fraction 2. Bp. = 59–63 °C, 6.96 g, compound 1 polluted of the undecomposed intermediate acid chloride.
- Fraction 3. Bp. = 72–75 °C, 13.73 g, undecomposed intermediate acid chloride.
2.2.2. 3-Methoxymethoxyanysole (2)
2.2.3. 2-Methoxy-6-methoxymethoxybenzaldehyde (3)
2.2.4. 2-Methoxy-6-methoxymethoxybenzaldoxime (4)
2.2.5. 2-Methoxy-6-methoxymethoxybenzylamine (5)
2.2.6. 2-Hydroxy-6-methoxymethoxybenzylamine Hydrochloride (6)
2.2.7. 2-Methoxy-6-[(4-vinyl)benzyloxy]benzylamine Hydrochloride M7 (7)
2.3. Preparation of Nanoparticulate Copolymer P7 by Radical Copolymerization in Solution
2.3.1. Fractioning of P7
2.4. Average Molecular Mass (Mn) Determination of Copolymer P7
2.4.1. Calibration Phase
2.4.2. Measurements Phase
2.5. Determination of NH2 Equivalents Contained in P7
2.6. Potentiometric Titration of P5 and P7
2.7. Z-Potential (ζ-p) and Dynamic Light Scattering (DLS) Analysis of P7
2.8. In Vitro Evaluation of Cytotoxicity of P5 and P7 against Human Neuroblastoma (NB) Cells
2.8.1. Cell Culture Conditions and Treatments
2.8.2. Cell Viability Assay
2.8.3. Detection of Reactive Oxygen Species (ROS) Production
2.9. Statistical Analyses
3. Results
3.1. Synthesis and Spectrophotometric Characterization of 2-Methoxy-6-[(4-vinyl)benzyloxy]benzylamine Hydrochloride M7 (7)
3.2. Preparation of Copolymer P7 by Radical Copolymerizations in Solution and Spectroscopic Characterizations
3.3. Average Molecular Mass (Mn) Determination of Copolymer P7
3.3.1. The Technique
3.3.2. Calibration
3.4. Determinations of NH2 Equivalents Contained in P7
3.5. Particle Size, ζ-p and PDI of P7
3.6. Potentiometric Titration of P5 and P7
3.7. Cytotoxic Effect of P5 and P7 on Two Human NB Cell Lines
3.7.1. Dose-Dependent Effects of P5 on NB Cell Viability
3.7.2. Dose-Dependent Effects of P7 on NB Cell Viability
3.8. Dose Dependent ROS Production in HTLA and ER Cells
4. Conclusions
Supplementary Materials
Author Contributions
Funding
Acknowledgments
Conflicts of Interest
References
- Alfei, S.; Marengo, B.; Zuccari, G.; Turrini, F.; Domenicotti, C. Dendrimer Nanodevices and Gallic Acid as Novel Strategies to Fight Chemoresistance in Neuroblastoma Cells. Nanomaterials 2020, 10, 1243. [Google Scholar] [CrossRef] [PubMed]
- Eliassen, L.T.; Berge, G.; Leknessund, A.; Wikman, M.; Lindin, I.; Løkke, C.; Ponthan, F.; Johnsen, J.I.; Sveinbjørnsson, B.; Kogner, P.; et al. The antimicrobial peptide, Lactoferricin B, is cytotoxic to neuroblastoma cells in vitro and inhibits xenograft growth in vivo. Int. J. Cancer 2006, 119, 493–500. [Google Scholar] [CrossRef] [Green Version]
- Alfei, S.; Schito, A.M. Positively Charged Polymers as Promising Devices against Multidrug Resistant Gram-Negative Bacteria: A Review. Polymers 2020, 12, 1195. [Google Scholar] [CrossRef]
- Alfei, S.; Piatti, G.; Caviglia, D.; Schito, A.M. Synthesis, Characterization and Bactericidal Activity of a 4-Ammoniumbuthylstyrene-Based Random Copolymer. Polymers 2021, 13, 1140. [Google Scholar] [CrossRef]
- Alfei, S.; Schito, A.M. From Nanobiotechnology, Positively Charged Biomimetic Dendrimers as Novel Antibacterial Agents: A Review. Nanomaterials 2020, 10, 2022. [Google Scholar] [CrossRef]
- Gelman, M.A.; Weisblum, B.; Lynn, D.M.; Gellman, S.H. Biocidal activity of polystyrenes that are cationic by virtue of protonation. Org. Lett. 2004, 6, 557–560. [Google Scholar] [CrossRef]
- Palermo, E.; Kuroda, K. Chemical structure of cationic groups in amphiphilic polymethacrylates modulates the antimicrobial and hemolytic activities. Biomacromolecules 2009, 10, 1416–1428. [Google Scholar] [CrossRef] [PubMed]
- Schito, A.M.; Alfei, S. Antibacterial Activity of Non-Cytotoxic, Amino Acid-Modified Polycationic Dendrimers against Pseudomonas aeruginosa and Other Non-Fermenting Gram-Negative Bacteria. Polymers 2020, 12, 1818. [Google Scholar] [CrossRef] [PubMed]
- Schito, A.M.; Schito, G.C.; Alfei, S. Synthesis and Antibacterial Activity of Cationic Amino Acid-Conjugated Dendrimers Loaded with a Mixture of Two Triterpenoid Acids. Polymers 2021, 13, 521. [Google Scholar] [CrossRef]
- Lee, J.-Y.; Park, Y.K.; Chung, E.S.; Na, I.Y.; Ko, K.S. Evolved Resistance to Colistin and Its Loss Due to Genetic Reversion in Pseudomonas Aeruginosa. Sci. Rep. 2016, 6, 25543. [Google Scholar] [CrossRef]
- Ganewatta, M.S.; Tang, C. Controlling macromolecular structures towards effective antimicrobial polymers. Polymer 2015, 63, A1–A29. [Google Scholar] [CrossRef]
- Matsuzaki, K. Control of cell selectivity of antimicrobial peptides. Biochim. Biophys. Acta 2009, 1788, 1687–1692. [Google Scholar] [CrossRef] [PubMed] [Green Version]
- Gabriel, G.J.; Som, A.; Madkour, A.E.; Eren, T.; Tew, G.N. Infectious disease: Connecting innate immunity to biocidal polymers. Mater. Sci. Eng. R Rep. 2007, 57, 28–64. [Google Scholar] [CrossRef] [PubMed] [Green Version]
- Leuschner, C.; Hansel, W. Membrane disrupting lytic peptides for cancer treatments. Curr. Pharm. Des. 2004, 10, 2299–2310. [Google Scholar] [CrossRef]
- Papo, N.; Shai, Y. Host defense peptides as new weapons in cancer treatment. Cell. Mol. Life Sci. 2005, 62, 784–790. [Google Scholar] [CrossRef] [PubMed]
- Tan, J.; Tay, J.; Hedrick, J.; Yang, Y.Y. Synthetic macromolecules as therapeutics that overcome resistance in cancer and microbial infection. Biomaterials 2020, 252, 120078. [Google Scholar] [CrossRef]
- Li, J.; Anraku, Y.; Kataoka, K. Self-Boosting Catalytic Nanoreactors Integrated with Triggerable Crosslinking Membrane Networks for Initiation of Immunogenic Cell Death by Pyroptosis. Angew. Chem. Int. Ed. 2020, 59, 13526–13530. [Google Scholar] [CrossRef] [PubMed]
- Li, J.; Dirisala, A.; Ge, Z.; Wang, Y.; Yin, W.; Ke, W.; Toh, K.; Xie, J.; Matsumoto, Y.; Anraku, Y.; et al. Therapeutic Vesicular Nanoreactors with Tumor-Specific Activation and Self-Destruction for Synergistic Tumor Ablation. Angew. Chem. Int. Ed. 2017, 56, 14025–14030. [Google Scholar] [CrossRef] [PubMed]
- Bertini, V.; Alfei, S.; Pocci, M.; Lucchesini, F.; Picci, N.; Iemma, F. Monomers containing substrate or inhibitor residues for copper amine oxidases and their hydrophilic beaded resins designed for enzyme interaction studies. Tetrahedron 2004, 60, 11407–11414. [Google Scholar] [CrossRef]
- Pocci, M.; Bertini, V.; Lucchesini, F.; De Munno, A.; Picci, N.; Iemma, F.; Alfei, S. Unexpected behavior of the methoxymethoxy group in the metalation/formylation reactions of 3-methoxymethoxyanisole. Tetrahedron Lett. 2001, 42, 1351–1354. [Google Scholar] [CrossRef]
- Alfei, S.; Marengo, B.; Domenicotti, C. Polyester-Based Dendrimer Nanoparticles Combined with Etoposide Have an Improved Cytotoxic and Pro-Oxidant Effect on Human Neuroblastoma Cells. Antioxidants 2020, 9, 50. [Google Scholar] [CrossRef] [PubMed] [Green Version]
- Stadlwieser, J. Notiz zur Herstellung von Chloromethylmethylether aus Methoxyessigsäure. Sytnthesis 1985, 5, 490. [Google Scholar] [CrossRef]
- Winkle, M.R.; Ronald, R.C. Regioselective metalation reactions of some substituted (methoxymethoxy) arenes. J. Org. Chem. 1982, 47, 2101–2108. [Google Scholar] [CrossRef]
- Narasimhan, N.S.; Mali, R.S.; Barve, M.V. Synthetic Application of Lithiation Reactions; Part XIII. Synthesis of 3-Phenylcoumarins and Their Benzo Derivatives. Synthesis 1979, 11, 906. [Google Scholar] [CrossRef]
- Alfei, S.; Castellaro, S. Synthesis and Characterization of Polyester-Based Dendrimers Containing Peripheral Arginine or Mixed Amino Acids as Potential Vectors for Gene and Drug Delivery. Macromol. Res. 2017, 25, 1172–1186. [Google Scholar] [CrossRef]
- Benns, J.M.; Choi, J.S.; Mahato, R.I.; Park, J.S.; Kim, S.W. pH-sensitive cationic polymer gene delivery vehicle: N-Ac-poly(L-histidine)-graft-poly(L-lysine) comb shaped polymer. Bioconjug. Chem. 2000, 11, 637–645. [Google Scholar] [CrossRef]
- Koromilas, N.D.; Lainioti, G.C.; Oikonomou, E.K.; Joannis, G.B.; Kallitsis, K. Synthesis and self-association in dilute aqueous solutionof hydrophobically modified polycations and polyampholytesbased on 4-vinylbenzyl chloride. Eur. Polym. J. 2014, 54, 39–51. [Google Scholar] [CrossRef]
- Colla, R.; Izzotti, A.; De Ciucis, C.; Fenoglio, D.; Ravera, S.; Speciale, A.; Ricciarelli, R.; Furfaro, A.L.; Pulliero, A.; Passalacqua, M.; et al. Glutathione-mediated antioxidant response and aerobic metabolism: Two crucial factors involved in determining the multi-drug resistance of high-risk neuroblastoma. Oncotarget 2016, 7, 70715–70737. [Google Scholar] [CrossRef] [Green Version]
- Negre-Salvayre, A.; Augé, N.; Duval, C.; Robbesyn, F.; Thiers, J.C.; Nazzal, D.; Benoist, H.; Salvayre, R. Detection of intracellular reactive oxygen species in cultured cells using fluorescent probes. Methods Enzymol. 2002, 352, 62–71. [Google Scholar] [PubMed]
- Borman, S. Polymers with Safe Amounts of Copper. Chem. N. Eng. 2006, 84, 40–41. [Google Scholar] [CrossRef]
- Siegwart, D.; Oh Kwan, J.; Matyjaszewski, K. ATRP in the design of functional materials for biomedical applications. Prog. Polym. Sci. 2012, 37, 18–37. [Google Scholar] [CrossRef] [PubMed] [Green Version]
- Moad, G.; Rizzardo, E.; Thang, S.E. Living Radical Polymerization by the RAFT Process—A Second Update. Aust. J. Chem. 2009, 62, 1402–1472. [Google Scholar] [CrossRef]
- Arshady, R.; Atherton, E.; Clive, D.L.J.; Sheppard, R.C. Peptide synthesis. Part 1. Preparation and use of polar supports based on poly(dimethylacrylamide). J. Chem. Soc. Perkin Trans. 1981, 1, 529–537. [Google Scholar] [CrossRef]
- Bersted, B.A. Molecular Weight Determination of High Polymers by Means of Vapor Pressure Osmometry and the Solute Dependence of the Constant of Calibration. J. App. Polym. Sci. 1973, 17, 1415–1430. [Google Scholar] [CrossRef]
- Chalmers, J.M.; Meier, R.J. Molecular Characterization and Analysis of Polymers. In Wilson & Wilson’s Comprehensive Analytical Chemistry; Barcelo, D., Ed.; Elsevier Science: Oxford, UK, 2008; Volume 53, pp. 1–763. [Google Scholar]
- Wen, Q.; Xu, L.; Xiao, X.; Wang, Z. Preparation, characterization, and antibacterial activity of cationic nanopolystyrenes. J. App. Polym. Sci. 2019, 137, 48405. [Google Scholar] [CrossRef]
- Alfei, S.; Castellaro, S.; Taptue, G.B. Synthesis and NMR characterization of dendrimers based on 2,2-bis-(hydroxymethyl)-propanoic acid (bis-HMPA) containing peripheral amino acid residues for gene transfection. Org. Commun. 2017, 10, 144–177. [Google Scholar] [CrossRef]
- Von Seel, F. Grundlagen der Analytischen Chemie, 5th ed.; Geier, G., Ed.; Verlag Chemie: Weinheim, Germany, 1970; Volume 82, p. 962. [Google Scholar]
- Aravindan, L.; Bicknell, K.A.; Brooks, G.; Khutoryanskiya, V.V.; Williams, A.C. Effect of acyl chain length on transfection efficiency and toxicity of polyethylenimine. Int. J. Pharm. 2009, 378, 201–210. [Google Scholar] [CrossRef]
- Fukai, T.; Sakagami, H.; Toguchi, M.; Takayama, F.; Iwakura, I.; Atsumi, T.; Ueha, T.; Nakashima, H.; Nomura, T. Cytotoxic activity of low molecular weight polyphenols against human oral tumor cell lines. Anticancer Res. 2000, 20, 2525–2536. [Google Scholar]


| Cationic Monomer (mg, mmol, % 1) | DMAA (mg, mmol) | Solvent (mL) | AIBN (mg, % 2) | Time (h) | Copolymers (g, % 3) |
|---|---|---|---|---|---|
| M7 734.9, 2.68, 47.7 | 560.0, 5.63 | MeOH 19 | 13.4, 1.7 | 72 | P7 1.10, 85 |
| M5 [4] 697.7, 3.30, 42.8 | 765.9, 7.7 | DMF 6.5 | 15.3, 1.0 | 7 | P5 [4] 0.6677, 46 |
| Copolymer | Calibration | Measurements | ||
|---|---|---|---|---|
| P7 | c (mol/kg)PEO | MV/c (kg/mol)PEO | c (g/kg)P7 | Mn (g/mol) |
| 0.0048410 | 856 | 13.8525 | 13,719 | |
| 0.0058304 | 930 | 23.9796 | ||
| 0.0068966 | 1007 | 30.5577 | ||
| Kcal (kg/mol) = 501 | Kmeas (kg/g) = 0.0365 | |||
| P5 [4] | c (mol/kg)PEO | MV/c (kg/mol)PEO | c (g/kg)P5 | Mn (g/mol) |
| 0.0048410 | 856 | 2.1949 | 5100 | |
| 0.0058304 | 930 | 5.6195 | ||
| 0.0068966 | 1007 | 7.7859 | ||
| Kcal (kg/mol) = 501 | Kmeas (kg/g) = 0.0982 | |||
| Copolymer | mg (mmol) | HClO4 0.1612 N (mL) | NH2 (mmol) | µequiv.NH2/g | µequiv.NH2/µmol |
|---|---|---|---|---|---|
| P7 (13,719) 1 | 350.1 (0.0255) | 0.66 | 0.1067 | 305 | 4.2 |
| P5 [4] (5100) 2 | 300.5 (0.0589) | 1.67 | 0.2686 | 894 | 4.6 |
| mg/mL | Z-AVE Size (nm) | ζ-p (mV) | PDI | ||
| P7 (13,719) 1 | 3 | 220 ± 18 | +49.8 ± 5.8 | 0.809 ± 0.004 | |
| P5 [4] (5100) 2 | 3 | 334 ± 27 | +57.6 ± 1.7 | 1.012 ± 0.007 | |
| mL HCl 0.1 N | pH (P5) | pH (P7) | dpH/dV (P5) | dpH/dV (P7) |
|---|---|---|---|---|
| 0.0 | 9.34 | 9.54 | ||
| 0.2 | 9.20 | 9.30 | 0.7 | 1.2 |
| 0.4 | 9.00 | 9.00 | 1 | 1.5 |
| 0.6 | 8.80 | 6.85 | 1 | 10.75 |
| 0.8 | 7.20 | 6.15 | 8 | 3.5 |
| 1.0 | 7.00 | 5.60 | 1 | 2.75 |
| 1.2 | 4.60 | 4.80 | 12 | 4 |
| 1.4 | 4.50 | 4.65 | 0.5 | 0.75 |
| 1.6 | 4.40 | 4.50 | 0.5 | 0.75 |
| 1.8 | 4.30 | 4.45 | 0.5 | 0.25 |
| 2.0 | 4.30 | 4.40 | 0 | 0.25 |
| 2.2 | 4.30 | 4.35 | 0 | 0.25 |
| 2.4 | 4.30 | 4.30 | 0 | 025 |
| 2.6 | 4.30 | 4.30 | 0 | 0 |
| 2.8 | 4.30 | 4.20 | 0 | 0.5 |
| 3.0 | 4.30 | 4.15 | 0 | 0.25 |
| P5 | P7 | |||
| Max dpH/dV | 12 | 4.5 | 10.75 | 4 |
| HCl (mL) | 0.8 | 1.2 | 0.6 | 1.2 |
| pH | 6.40 | 5.20 | 6.85 | 4.80 |
| Entry | β (pH Value) | βave * (mL/pH) |
|---|---|---|
| P5 | 0.667 (6.10) | 0.2305 ± 0.1354 |
| P7 | 1.33 (4.65) 1.40 (6.15) | 0.3500 ± 0.2293 |
| PEI-b | 0.08261 (7.33) 0.0760 (6.81) | 0.517 ± 0.2541 |
| M5 | P5 | M7 | P7 | |
|---|---|---|---|---|
| LD50 (µM) | LD50 (µM) | LD50 (µM) | LD50 (µM) | |
| HTLA | 250 | 4.3 | 100 | 5.1 |
| ER | 250 | 2.2 | 100 | 4.1 |
Publisher’s Note: MDPI stays neutral with regard to jurisdictional claims in published maps and institutional affiliations. |
© 2021 by the authors. Licensee MDPI, Basel, Switzerland. This article is an open access article distributed under the terms and conditions of the Creative Commons Attribution (CC BY) license (https://creativecommons.org/licenses/by/4.0/).
Share and Cite
Alfei, S.; Marengo, B.; Valenti, G.E.; Domenicotti, C. Synthesis of Polystyrene-Based Cationic Nanomaterials with Pro-Oxidant Cytotoxic Activity on Etoposide-Resistant Neuroblastoma Cells. Nanomaterials 2021, 11, 977. https://0-doi-org.brum.beds.ac.uk/10.3390/nano11040977
Alfei S, Marengo B, Valenti GE, Domenicotti C. Synthesis of Polystyrene-Based Cationic Nanomaterials with Pro-Oxidant Cytotoxic Activity on Etoposide-Resistant Neuroblastoma Cells. Nanomaterials. 2021; 11(4):977. https://0-doi-org.brum.beds.ac.uk/10.3390/nano11040977
Chicago/Turabian StyleAlfei, Silvana, Barbara Marengo, Giulia Elda Valenti, and Cinzia Domenicotti. 2021. "Synthesis of Polystyrene-Based Cationic Nanomaterials with Pro-Oxidant Cytotoxic Activity on Etoposide-Resistant Neuroblastoma Cells" Nanomaterials 11, no. 4: 977. https://0-doi-org.brum.beds.ac.uk/10.3390/nano11040977