Article

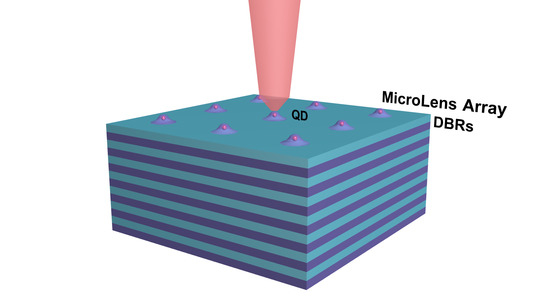
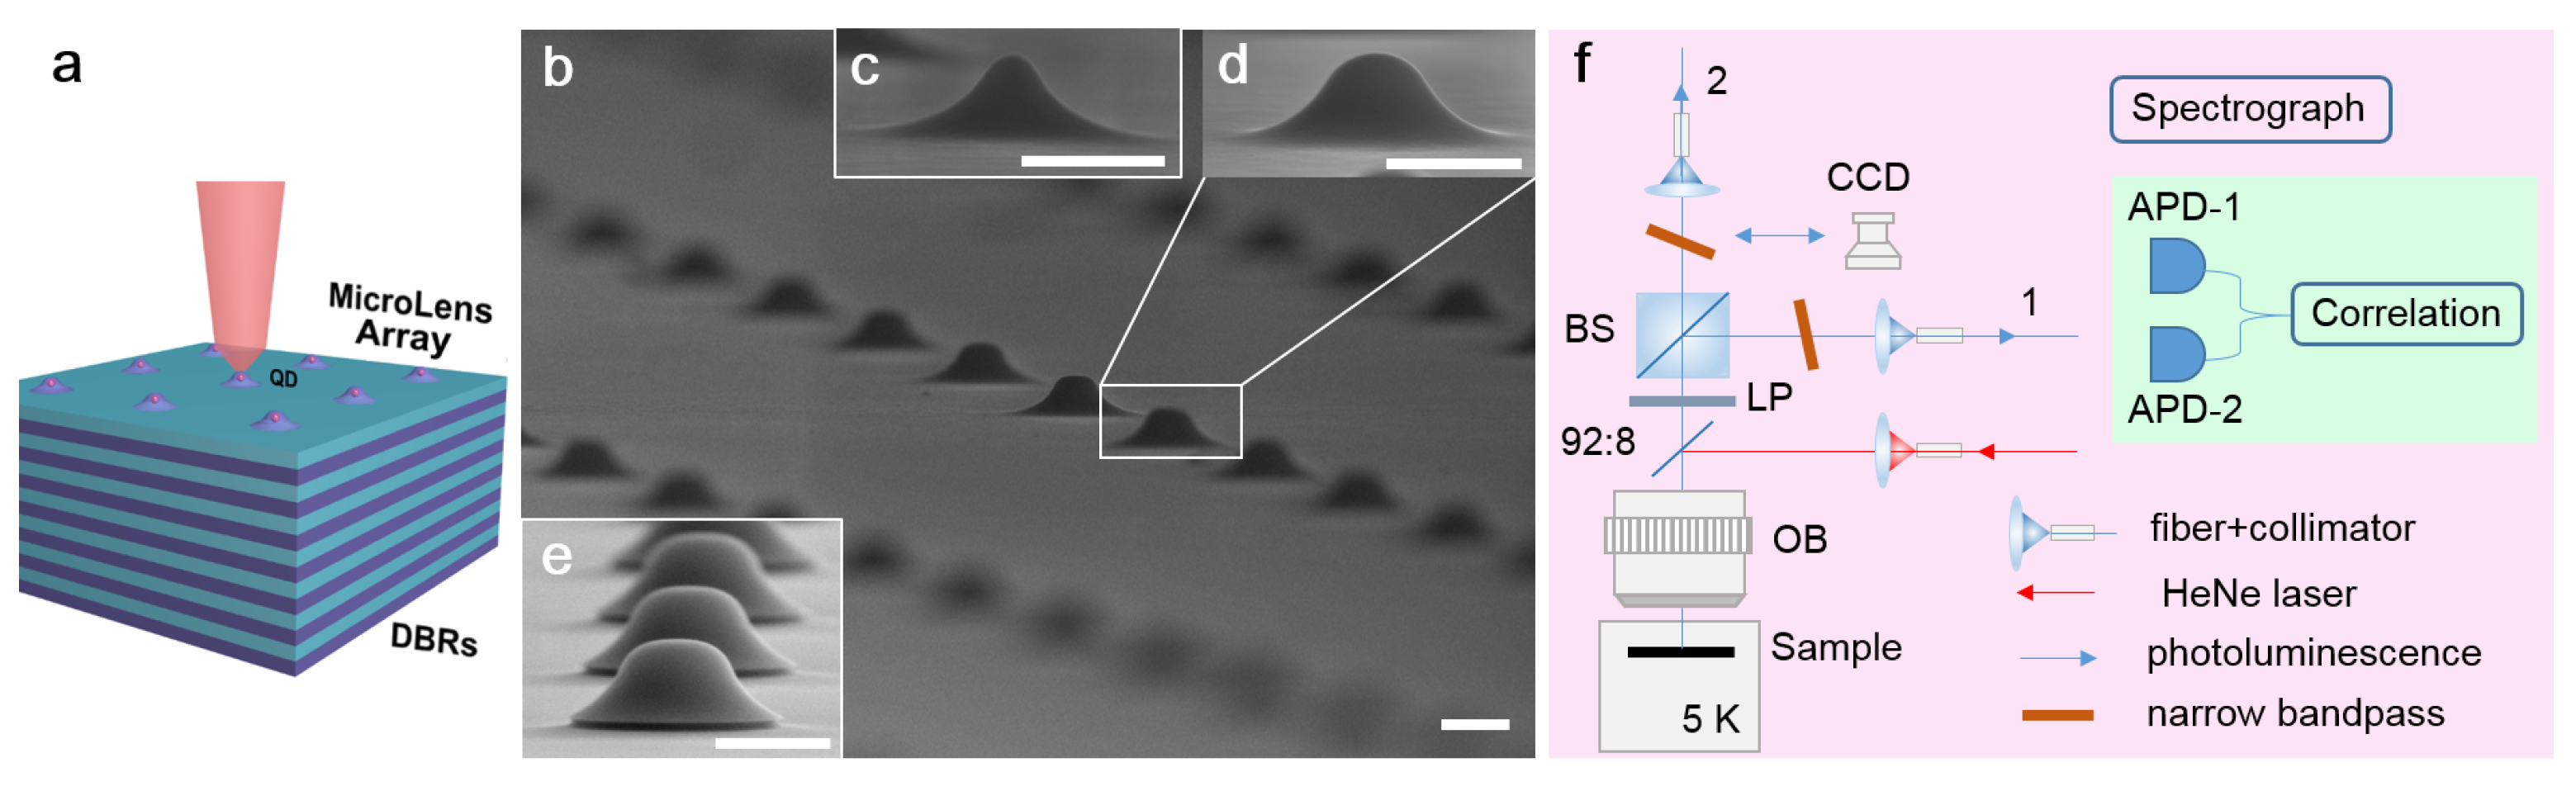
Wet-Etched Microlens Array for 200 nm Spatial Isolation of Epitaxial Single QDs and 80 nm Broadband Enhancement of Their Quantum Light Extraction

1
State Key Laboratory for Superlattice and Microstructures, Institute of Semiconductors, Chinese Academy of Sciences, Beijing 100083, China
2
Center of Materials Science and Optoelectronics Engineering, University of Chinese Academy of Sciences, Beijing 100049, China
3
Beijing Academy of Quantum Information Sciences, Beijing 100193, China
4
Institute of Photonics and Photonic Technology, Northwest University, Xi’an 710127, China
*
Authors to whom correspondence should be addressed.
Submission received: 4 April 2021 / Revised: 23 April 2021 / Accepted: 26 April 2021 / Published: 27 April 2021

Abstract

:
Uniform arrays of three shapes ( g a u s s , h a t , and p e a k ) of GaAs microlenses (MLs) by wet-etching are demonstrated, ∼200 nm spatial isolation of epitaxial single QDs embedded ( λ : 890–990 nm) and broadband ( Δ λ 80 nm) enhancement of their quantum light extraction are obtained, which is also suitable for telecom-band epitaxial QDs. Combined with the bottom distributed Bragg reflector, the h a t -shaped ML forms a cavity and achieves the best enhancement: extraction efficiency of 26%, Purcell factor of 2 and single-photon count rate of 7 × 10 6 counts per second at the first lens; while the g a u s s -shaped ML shows a broader band (e.g., longer λ ) enhancement. In the MLs, single QDs with featured exciton emissions are observed, whose time correlations prove single-photon emission with multi-photon probability g ( 2 ) ( 0 ) = 0.02 ; some QDs show both biexciton X X and exciton X emissions and exhibit a perfect cascade feature. This work could pave a step towards a scalable array of QD single-photon sources and the application of QD photon-pair emission for entanglement experiments.

Graphical Abstract

1. Introduction

Quantum light source is an essential device in quantum communication systems and other applications in quantum technology [1,2,3] such as quantum-enhanced sensing [4] or imaging [5]. Semiconductor quantum dots (QDs) is a promising candidate for realization of on-demand quantum light source with high photon extraction efficiency, strong suppression of multi-photons and high indistinguishability of the emitted photons [6]. However, unlike colloidal QDs in solution which can be diluted easily, low-density epitaxial QDs needs a well control of the deposition amount during epitaxy, and their density is usually correlated with the QD size. Epitaxial low-density (∼1–2 μ m 2 ) InAs/GaAs QDs usually show exciton emission at the wavelength ( λ ) of 900–930 nm, quite smaller than ensembled QDs with λ at ∼1300 nm. A well spatial isolation by etching might create longer- λ single QD regions for quantum application. Moreover, to overcome a large total reflection (98%) at the semiconductor/air interface and improve the light extraction efficiency ( η ) of a QD in it, the common solution is coupling the QD with dielectric antenna [7], solid-immersed lens [8], micro-cavity such as micropillars [9], microdisk [10], and photonic-crystal cavity [11], or waveguide [12]. For photon-pair entanglement application, both biexciton X X and exciton X emissions separated in λ of 2–3 nm must be enhanced that cannot be achieved by a high-Q cavity with a narrow-linewidth cavity mode; hence, several broadband-enhanced photonic structures such as circular Bragg grating cavity [13,14,15,16], metallic nanorings [17], photonic trumpet [18], microlens (ML) [19,20,21] and solid-immersed lens (SIL) [22] have been developed.
In this work, we fabricate GaAs MLs in three shapes ( p e a k , g a u s s , and h a t ) by wet-etching method. Compared to the previously reported MLs fabricated by electron beam lithography) [19,20], the wet-etched MLs in this work are excellent on surface roughness (∼0.5 nm), convenient and low-cost for scalable uniform fabrication, small size for ∼200 nm spatial isolation of single QDs embedded ( λ : 890–990 nm, suitable for telecom-band QDs too), broadband ( Δ λ 80 nm) enhancement of their quantum light extraction, and reveal a Purcell enhancement effect. The η of single QD in the ML reaches 26% at highest (15 times enhancement with respect to the flat sample, η = 1.7 % ); combining with the bottom distributed Bragg reflector (DBR), the h a t -shaped ML forms a cavity and achieves a Purcell enhancement factor of ∼2 (with the QD at the center) and a total single-photon extraction rate at the first lens of 7 × 10 6 counts per second (cps). Furthermore, the wet-etched MLs are compatible for the deterministic fabrication on proper QDs by a convenient low-temperature in situ photolithography technique [23,24,25] and suitable for the opto-electronic device applications such as light emitting diodes [26,27] and photon detectors [28].

2. Materials and Methods

The sample is grown by a solid-source molecular beam epitaxy system on semi-insulating (100) GaAs substrate. The epitaxial structure consists of a 500 nm-thick GaAs buffer layer, 15.5 pairs of lattice-matched Al 0.9 Ga 0.1 As/GaAs DBRs with a designed λ of 920 nm, and a 700 nm-thick top GaAs layer for ML fabrication. Active InAs QDs are inserted in the top GaAs layer at a distance of 396 nm (∼3 λ /2n) from the top AlGaAs DBR layer. To obtain low-density (∼1–2 μ m 2 ) QDs, a sacrificed QD layer is first deposited to monitor the critical indium coverage ( θ c ) for 2D to 3D transition with reflection high-energy electron diffraction [29] and then the formal QD layer is grown with a gradient indium flux (growth rate: 0.005 monolayer/s) and a subcritical deposition amount (1.80 monolayers) [30,31].
GaAs microlens arrays are fabricated as follows: (1) negative-glue photolithography is performed to prepare circular holes array (diameter: 3 μ m, period: 10 μ m) and a 150 nm-thick SiO 2 Ion Beam sputtering and then the liftoff process is used to fabricate SiO 2 hard mask array; (2) a buffered oxide etching (BOE) process is implemented to reduce the SiO 2 mask diameter to 1.5–2.0 μ m; (3) isotropic wet-etching of GaAs bulk at the edge of the mask is performed by H 2 SO 4 : H 2 O : H 2 O 2 solution [21] and a hillock-like ML is formed under the SiO 2 mask as the etching time increases. The H 2 O 2 concentration is key for the etching rate and the final ML height (H) and base distance from the top AlGaAs DBR layer (W). By precisely controlling the mask diameter, the etching time and the H 2 O 2 concentration, uniform arrays of MLs in three shapes with smooth surface are realized, as shown in Figure 1: (c) p e a k ; (d) g a u s s ; (e) h a t -shaped MLs array and the detailed shape parameters is given by Table 1. The ML waist ( F W H M ) is 0.59 μ m ( p e a k ), 0.61 μ m ( g a u s s ) and 1.04 μ m ( h a t ) with a spatial isolation of single QDs of 200 nm at most as shown in Figure 2a.
To evaluate the enhancement of the light extraction from a QD embedded in the ML, we perform micro-photoluminescence ( μ PL) spectroscopy through the experimental setup shown in Figure 1f. The sample is cooled to the temperature (T) ∼5 K in a helium-flow cryostat and excited by a continuous-wave HeNe laser ( λ = 632.8 nm) under saturated conditions. The confocal microscope setup uses an objective (OB, numerical aperture = 0.7) to focus the laser spot in a diameter of 2 μ m (assisted by CCD imaging) to excite the QDs and collect their photoluminescence (blue) after a 92% transmission/8% reflection (92:8) beamsplitter and a longpass (LP) with collimators and multi-mode fibers. The spectrograph is performed with a monochromator equipped with a liquid-nitrogen-cooled Si CCD detector. To characterize the quantum light emission (e.g., single-photon count rate, purity and cascade behavior), photon correlation is measured by an integrated Hanbury Brown-Twiss (HBT) setup: a 50:50 beamsplitter (BS) divides the photoluminescence equally; a narrow-linewidth interference bandpass ( Δ λ = 0.4 nm) is inserted in each beam to filter a spectral line before fiber collection [32]; each fiber output connects a Si avalanched single-photon counter (APD-1, 2, time resolution: 350 ps) for detection; time correlation is analyzed by a time-to-digital converter with multi-channel buffer; the whole instrument response function (IRF) time is T I R F ∼ 600 ps that is used for the deconvolution of the measured correlation data [33] to reflect the real one. Concerning the Si APD single-photon counter quantum efficiency (33% at λ 900 nm) and the confocal setup efficiency (∼40%, i.e., a product of the collimator and multi-mode fiber coupling efficiency 67%, the filter-set transmission efficiency 70% and the objective collection efficiency 85%), the whole collection efficiency at the two APDs is 13.2%, higher than that of the traditional setup (2–3%) with a grating as a filter which has multi-order diffraction. The whole collection efficiency is used to estimate the net single-photon count rate at the first lens. Numerical simulations are performed through the finite time difference domain (FDTD) method to discuss the microlens enhancement of QD light extraction. In the simulation model, the ML surface topography is extracted from the SEM images in Figure 1 and the QD is simplified as a continuous-wave dipole emitter; the light extraction efficiency η is estimated through a time monitor above the ML with a collection numerical aperture of 0.7, divided by the light output in all space.

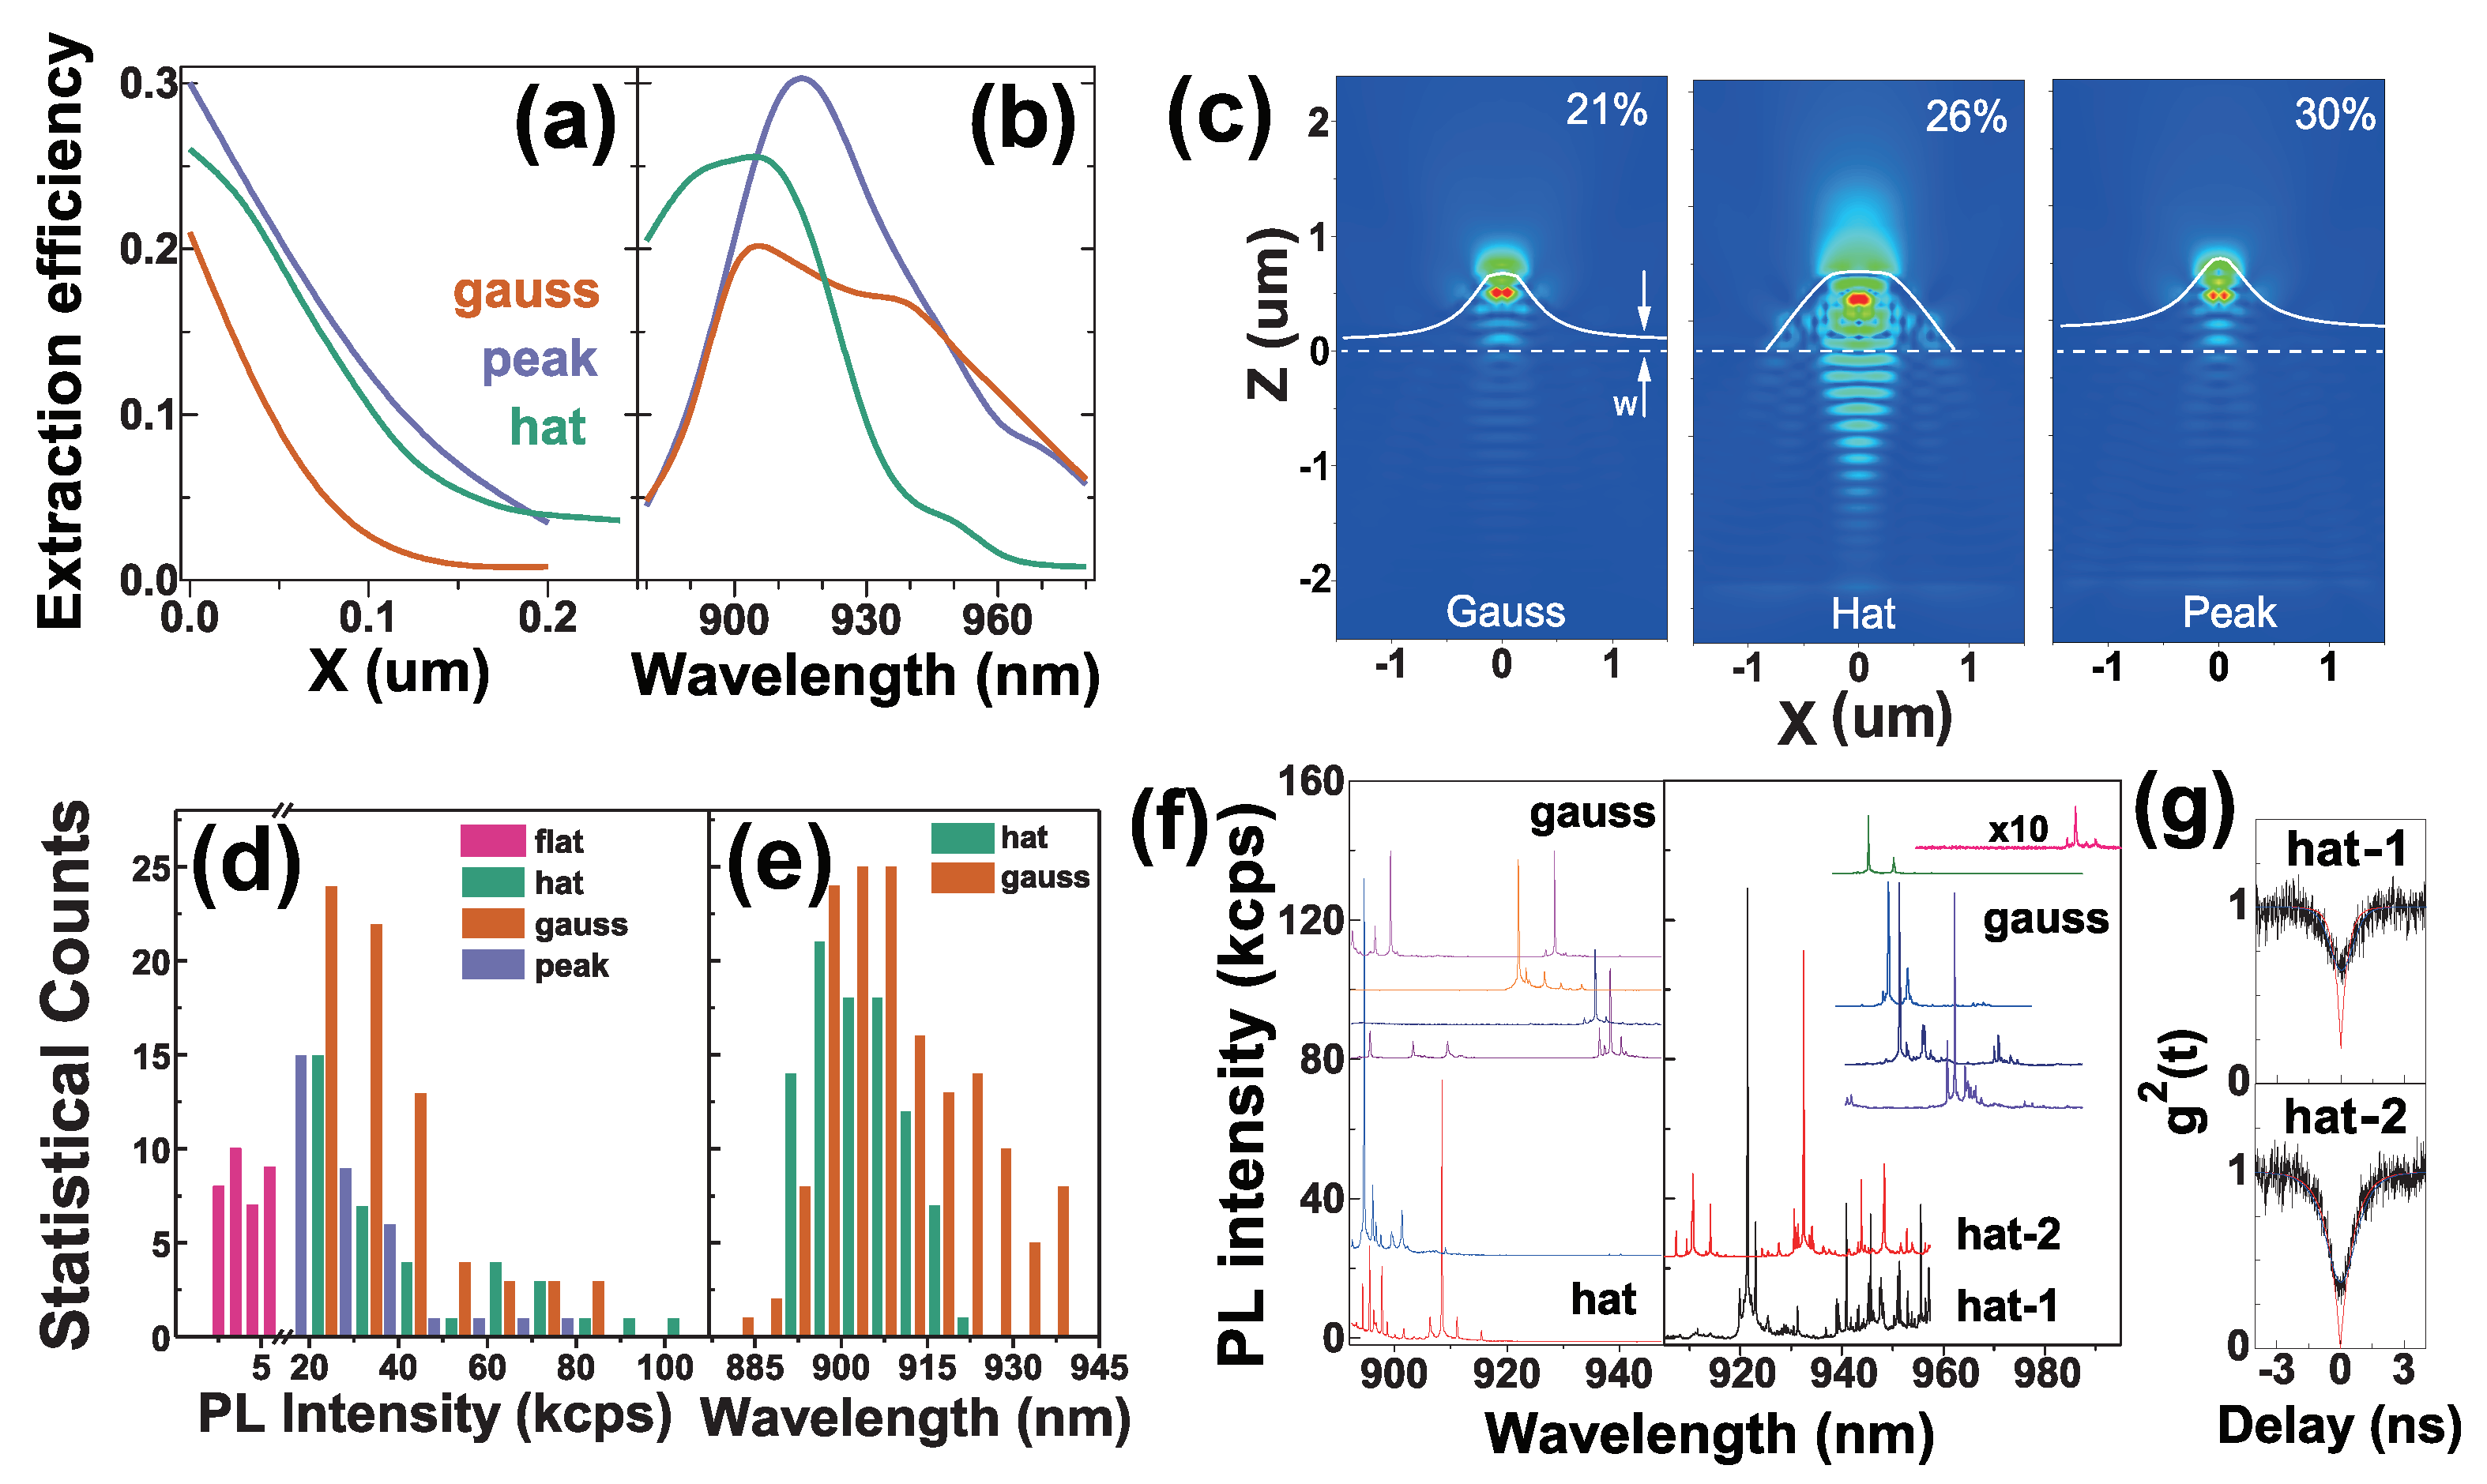
3. Results and Discussion

Figure 2 presents the simulation of the light extraction efficiency η as a function of QD horizontal position X concerning the ML center and QD emission wavelength, the typical μ PL spectra of QDs, and the statistics on QD exciton emission spectral lines. Figure 2d is statistics on PL peak intensity. The intensity of QDs in the flat sample varies from 2 kcps to 5.5 kcps with the average I f l a t of 4 kcps, while the intensity of QDs in the MLs varies from 20 kcps to 110 kcps at maximum ( h a t -shaped). Its statistical distribution is a good reflection of the QD X-position variation from the ML center as the simulation in Figure 2a reflects: the maximal intensity corresponds to a QD in the ML center that has very few statistical counts, while the minimal intensity (∼20 kcps) with many statistical counts corresponds to a QD away from the ML center that is popular. For the optimal QD position (x = 0, z = 0.396 μ m), Figure 2c presents the simulated typical electric field distribution in a ML, with the η of 21%, 26% and 30% in g a u s s -, h a t - and p e a k -shaped MLs, respectively. The enhancement factor F is defined as the ratio of the maximal PL intensity in a ML (i.e., QD at the ML center) and the average PL intensity in the flat samples F = I M L / I f l a t . The h a t -shaped MLs achieve a greater F = 110 / 4 = 28 at maximum while the g a u s s -shaped ones achieve an F = 55 / 4 = 14 at maximum (corresponding to the optimal η = 14 × 1.7 % = 24 % ). Figure 2f presents the typical μ PL spectra of QDs in the h a t - and g a u s s -shaped MLs fabricated in the dilute QD region (left) where single QD is observed in a ML and in the multi-QD region (right) where multi-QDs are observed, especially in a h a t -shaped ML. In both regions, the g a u s s -shaped MLs show single QDs with longer λ of 930–970 nm and even reach 990 nm, reflecting well spatial isolation of single epitaxial QDs. As the simulation results in Figure 2a shows, the QD X-variation from the ML center plays a significant role on the η , therefore, the MLs offer ∼200 nm spatial isolate of single QDs (i.e., FWHM ∼200 nm of the η as a function of the QD X-position) as the clean μ PL spectra of single QDs in Figure 2f reflects. The spatial isolation of these MLs can also be used in telecom-band epitaxial QDs [31]. As Figure 2f shows, the h a t -shaped MLs mainly enhance QD emission at shorter λ with a greater F = 28, while the g a u s s -shaped MLs enhance QD emission at longer λ with F = 14. The ultra-high F in the h a t -shaped ML is due to a cavity Purcell enhancement, as the simulated light field distribution in Figure 2c indicates, the h a t -shaped ML combined with the bottom DBR shows a normal-directional light field distribution and extraction like a DBR cavity and the internal light field is focused at the ML center (i.e., QD location) for a high Purcell enhancement with Purcell factor of ∼2 that leads to the ultra-high F (i.e., 14 × 2 = 28), in contrast with the divergent light field extraction from the g a u s s - and p e a k -shaped MLs. The Purcell enhancement effect is also reflected from the radiative lifetime extracted from photon autocorrelation, which is 0.3 ns in a h a t -shaped ML ( h a t -1) with a maximal PL intensity (130 kcps at peak) while 0.6 ns in another h a t -shaped ML ( h a t -2) with a lower intensity (80 kcps at peak), as shown in Figure 2f,g. Figure 2e is the statistics on QD emission wavelength, in agreement with the simulation results of the wavelength dependence of the η in Figure 2b. A broadband ( Δ λ 80 nm) enhancement is reflected; the h a t -shaped MLs mainly enhance QD light extraction in a shorter λ : 900–930 nm while the g a u s s -shaped MLs enhance it in a wider range, 890–970 nm, also confirmed by the typical μ PL spectra in Figure 2f. The net single-photon count rate of the QD-in-MLs is estimated by the total APD photon count rate divided by the whole collection efficiency in the HBT setup (13.2%). For the h a t -shaped ML ( h a t -1 in Figure 2f with PL peak intensity beyond 130 kcps), its total photon count rate at the two APD detectors is 0.9 × 10 6 cps and the net single-photon count rate is 7 × 10 6 cps at the first objective lens, with extraction efficiency η of 26% and a Purcell factor ∼2. The extraction efficiency can be further improved if the bottom DBR is replaced with a gold mirror via substrate removing processing [19].
To confirm single-photon emission from the QDs in the MLs, we select representative µPL spectra of each type of MLs to measure second-order photon correlation function g ( 2 ) ( τ ) via the HBT setup. The results are shown in Figure 3. Exciton spectral peaks are attributed relying on their excitation power dependences and spectral features that nearly keep the same for different QDs [34]. Under saturated excitation, biexciton X X emission is dominant for QDs in the h a t - ( h a t ) and g a u s s -shaped MLs ( g a u s s -1), their different radiative lifetimes from photon autocorrelation, τ X X = 0.25 ns and 0.4 ns, respectively, smaller than the typical X X radiative lifetime 0.5 ns, together with the ultra-high maximal PL intensity in the h a t -shaped MLs in Figure 2f, reflect a cavity Purcell enhancement factor of ∼2. The cavity effect in the h a t -shaped MLs also induces a strong X X repopulation and a high multi-photon probability g ( 2 ) ( 0 ) , 0.12 in the h a t ML in Figure 3 and 0.2 in the h a t -1 ML in Figure 2 (radiative lifetime τ = 0.3 ns) after deconvolution. The charged exciton X + emission dominates in a p e a k -shaped ML ( p e a k ) and another g a u s s -shaped ML ( g a u s s -2) with radiative lifetime of 0.7 ns and 1.1 ns in the same level with no cavity effect and exhibits the best single-photon purity g ( 2 ) ( 0 ) = 0.02 with no background subtraction correction. For the two g a u s s -shaped MLs, consistent with a normal situation [35], the X X radiative lifetime is nearly one-half of the X (or X + ) radiative lifetime and the X + emission is brighter than X, since the electron-hole recombination rate of the biexciton X X with two pairs of electrons and holes is twice as much as that of a single exciton (X or X + ) with only one pair of electrons and holes, as the transition schemes in the inserted figures exhibited.
Figure 3c presents the typical cross-correlations of the X X -X cascade emission in QDs in the h a t - and g a u s s -shaped MLs. Concerning the h a t -shaped ML with intense X X emission but weak X emission due to a strong X X repopulation before X emission, the QD in g a u s s -1 ML shows comparable X X and X emission intensity which exhibit a good cascade feature, with the bunching g ( 2 ) ( 0 ) peak as high as 3.3 and the antibunching g ( 2 ) ( 0 ) dip as low as 0 after deconvolution, quite suitable for photon-pair entanglement application [32]. The asymmetric cross-correlation of the X X -X cascade in Figure 3c can be theoretical explained as follows: in the positive time delay (i.e., X is subsequent to X X ), the clear bunching peak reflects a cascade X exciton emission after the biexciton X X emission that transits to the exciton state | X ; in the negative time delay (i.e., X is ahead of X X ), the antibunching dip is due to the repopulation of the biexciton state | X X from the ground state | G (i.e., vacuum of electron and hole in QD) after X exciton emission. For the exciton state | X , apart from a direct electron-hole recombination to emit an X photon, there is also a considerable probability of repopulation of the biexciton state | X X via carrier capture and in this case the biexciton X X emission is dominant among the multi-exciton emissions, as the case in Figure 3a, the h a t and g a u s s -1 shaped MLs, reflect. The characteristic time of the bunching peak T 2 (reflecting cascade emission rate) is only 0.25 ns, smaller than that in the h a t -shaped ML ( τ X = 0.5 ns), while the characteristic time of the antibunching dip T 1 (i.e., carrier population rate for X X ) is 1.1 ns, larger than the T 1 in h a t -shaped ML, 0.9 ns, reflecting a well X X -X cascade emission instead of a dominant X X repopulation.

4. Conclusions

In conclusion, we demonstrate uniform arrays of GaAs microlenses (MLs) in three shapes ( p e a k , g a u s s , and h a t ) by wet-chemical etching. The MLs with epitaxial InAs QDs embedded prove a light extraction efficiency η as high as 26% (i.e., 15 times enhancement concerning the flat sample η = 1.7%) in a broad spectral band 890–970 nm. The MLs enable a ∼200 nm spatial isolation of epitaxial single QDs (suitable for telecom-band epitaxial QDs too) and a high single-photon purity ( g ( 2 ) ( 0 ) = 0.02). The h a t -shaped MLs combining with the bottom DBR achieve a total single-photon extraction rate at the first lens of 7 × 10 6 cps ( X + ) with a Purcell factor of ∼2 and light extraction efficiency of 26% which can be further improved by replacing the bottom DBR with a gold mirror. The MLs enhance both X X and X exciton emissions in some QDs and their cross-correlations prove a cascade emission for further entanglement application. This work paves a step towards a scalable array of QD single-photon sources and the application of QD photon-pair emission for entanglement.

Author Contributions

S.L. grew the samples, fabricated the ML arrays and took part in the optical measurements and wrote the manuscript. X.S. (Xianjung Shang) carried out the optical measurements and the numerical simulations as well as the discussion and interpretation of the results. Y.C. and X.S. (Xiangbin Su) took part in the epitaxial growth of the samples. H.H., H.L. participated in the fabrication process of the microlens array. Y.Z., H.N. and Z.N. participated in the discussions and supervised the writing of the manuscript. All authors have read and agreed to the published version of the manuscript.

Funding

This research was funded by the Key-Area Research and Development Program of Guangdong Province (Grant No. 2018B030329001), the National Key Technologies R&D Program of China (Grant No. 2018YFA0306100), the National Natural Science Foundation of China (Grant Nos. 62035017, 61505196), the Scientific instrument developing project of the Chinese Academy of Science, (Grant No. YJKYYQ20170032), and Program of Beijing Academy of Quantum Information Sciences (Grant No. Y18G01).

Institutional Review Board Statement

Not applicable.

Informed Consent Statement

Not applicable.

Data Availability Statement

The data that support the findings of this study are available from the corresponding author upon reasonable request.

Conflicts of Interest

The authors declare no conflict of interest.

References

  1. Gisin, N.; Thew, R. Quantum communication. Nat. Photonics 2007, 1, 165–171. [Google Scholar] [CrossRef] [Green Version]
  2. Sangouard, N.; Simon, C.; Minář, J.; Zbinden, H.; De Riedmatten, H.; Gisin, N. Long-distance entanglement distribution with single-photon sources. Phys. Rev. A 2007, 76, 050301. [Google Scholar] [CrossRef] [Green Version]
  3. Kimble, H.J. The quantum internet. Nature 2008, 453, 1023–1030. [Google Scholar] [CrossRef] [PubMed]
  4. Giovannetti, V.; Lloyd, S.; Maccone, L. Quantum-enhanced measurements: Beating the standard quantum limit. Science 2004, 306, 1330. [Google Scholar] [CrossRef] [PubMed] [Green Version]
  5. Lemos, G.B.; Borish, V.; Cole, G.D.; Ramelow, S.; Lapkiewicz, R.; Zeilinger, A. Quantum imaging with undetected photons. Nature 2014, 512, 409–412. [Google Scholar] [CrossRef] [PubMed] [Green Version]
  6. Michler, P. Quantum Dots for Quantum Information Technologies; Springer: Berlin/Heidelberg, Germany, 2017. [Google Scholar]
  7. Lee, K.G.; Chen, X.W.; Eghlidi, H.; Kukura, P.; Lettow, R.; Renn, A.; Sandoghdar, V.; Götzinger, S. A planar dielectric antenna for directional single-photon emission and near-unity collection efficiency. Nat. Photonics 2011, 5, 166–169. [Google Scholar] [CrossRef]
  8. Chen, X.-W.; Götzinger, S.; Sandoghdar, V. 99% efficiency in collecting photons from a single emitter. Opt. Lett. 2011, 36, 3545–3547. [Google Scholar] [CrossRef] [Green Version]
  9. Ding, X.; He, Y.; Duan, Z.C.; Gregersen, N.; Chen, M.C.; Unsleber, S.; Maier, S.; Schneider, C.; Kamp, M.; Höfling, S. On-demand single photons with high extraction efficiency and near-unity indistinguishability from a resonantly driven quantum dot in a micropillar. Phys. Rev. Lett. 2016, 116, 020401. [Google Scholar] [CrossRef] [Green Version]
  10. Srinivasan, K.; Painter, O. Linear and nonlinear optical spectroscopy of a strongly coupled microdisk-quantum dot system. Nature 2007, 450, 862. [Google Scholar] [CrossRef] [Green Version]
  11. Chang, W.H.; Chen, W.Y.; Chang, H.S.; Hsieh, T.P.; Chyi, J.I.; Hsu, T.M. Efficient single-photon sources based on low-density quantum dots in photonic-crystal nanocavities. Phys. Rev. Lett. 2006, 96, 117401. [Google Scholar] [CrossRef]
  12. Claudon, J.; Bleuse, J.; Singh, N.; Maela, M.; Périne, B. A highly efficient single-photon source based on a quantum dot in a photonic nanowire. Nat. Photonics 2010, 4, 174–177. [Google Scholar] [CrossRef]
  13. Li, L.; Chen, E.H.; Zheng, J.; Mouradian, S.L.; Dolde, F.; Schröder, T.; Karaveli, S.; Markham, M.L.; Twitchen, D.J.; Englund, D. Efficient Photon Collection from a Nitrogen Vacancy Center in a Circular Bullseye Grating. Nano Lett. 2015, 15, 1493–1497. [Google Scholar] [CrossRef] [Green Version]
  14. Davango, M.; Rakher, M.T.; Schuh, D.; Badolato, A.; Srinivasan, K. A circular dielectric grating for vertical extraction of single quantum dot emission. Appl. Phys. Lett. 2011, 99, 215. [Google Scholar]
  15. Sapienza, L.; Marcelo Davanço, A.B.; Srinivasan, K. Nanoscale optical positioning of single quantum dots for bright and pure single-photon emission. Nat. Commun. 2015, 6, 7833. [Google Scholar] [CrossRef] [PubMed]
  16. Wang, H.; Hu, H.; Chung, T.H.; Qin, J.; Yang, X.; Li, J.P.; Liu, R.Z.; Zhong, H.S.; He, Y.M.; Ding, X. On-demand semiconductor source of entangled photons which simultaneously has high fidelity, efficiency, and indistinguishability. Phys. Rev. Lett. 2019, 122, 113602.1–113602.6. [Google Scholar] [CrossRef] [PubMed] [Green Version]
  17. Trojak, O.J.; Park, S.I.; Song, J.D.; Sapienza, L. Metallic nanorings for broadband, enhanced extraction of light from solid-state emitters. Appl. Phys. Lett. 2017, 111, 1650. [Google Scholar] [CrossRef] [Green Version]
  18. Munsch, M.; Malik, N.S.; Dupuy, E.; Delga, A.; Bleuse, J.; Gerard, J.M.; Claudon, J.; Gregersen, N.; Mørk, J. Dielectric GaAs Antenna Ensuring an Efficient Broadband Coupling between an InAs Quantum Dot and a Gaussian Optical Beam. Phys. Rev. Lett. 2013, 110, 177402. [Google Scholar] [CrossRef] [PubMed] [Green Version]
  19. Gschrey, M.; Thoma, A.; Schnauber, P.; Seifried, M.; Schmidt, R.; Wohlfeil, B.; Krüger, L.; Schulze, J.H.; Heindel, T.; Burger, S.; et al. Highly indistinguishable photons from deterministic quantum-dot microlenses utilizing three-dimensional in situ electron-beam lithography. Nat. Commun. 2015, 6, 7662. [Google Scholar] [CrossRef] [PubMed]
  20. Heindel, T.; Thoma, A.; von Helversen, M.; Schmidt, M.; Schlehahn, A.; Gschrey, M.; Schnauber, P.; Schulze, J.H.; Strittmatter, A.; Beyer, J.; et al. A bright triggered twin-photon source in the solid state. Nat. Commun. 2017, 8, 7. [Google Scholar] [CrossRef] [PubMed]
  21. Marc, S.; Lena, E.; Sascha, K.; Fabian, O.; Cornelius, N.; Stefan, H.; Michael, J.; Peter, M.; Luca, P.S. Deterministic integration and optical characterization of telecom O-band quantum dots embedded into wet-chemically etched Gaussian-shaped microlenses. Appl. Phys. Lett. 2018, 113, 032103. [Google Scholar]
  22. Sartison, M.; Portalupi, S.L.; Gissibl, T.; Jetter, M.; Giessen, H.; Michler, P. Combining in-situ lithography with 3D printed solid immersion lenses for single quantum dot spectroscopy. Sci. Rep. 2017, 7, 39916. [Google Scholar] [CrossRef] [PubMed]
  23. Fischbach, S.; Schlehahn, A.; Thoma, A.; Srocka, N.; Gissibl, T.; Ristok, S.; Thiele, S.; Kaganskiy, A.; Strittmatter, A.; Heindel, T.; et al. Single Quantum Dot with Microlens and 3D-Printed Micro-objective as Integrated Bright Single-Photon Source. ACS Photonics 2017, 4, 1327–1332. [Google Scholar] [CrossRef] [PubMed] [Green Version]
  24. Kaganskiy, A.; Fischbach, S.; Strittmatter, A.; Rodt, S.; Heindel, T.; Reitzenstein, S. Enhancing the photon-extraction efficiency of site-controlled quantum dots by deterministically fabricated microlenses. Opt. Commun. 2018, 413, 162–166. [Google Scholar] [CrossRef] [Green Version]
  25. Dousse, A.; Suffczyński, J.; Beveratos, A.; Krebs, O.; Lemaître, A.; Sagnes, I.; Bloch, J.; Voisin, P.; Senellart, P. Ultrabright source of entangled photon pairs. Nature 2010, 466, 217–220. [Google Scholar] [CrossRef] [PubMed]
  26. Wu, M.L.; Lee, Y.C.; Yang, S.P.; Lee, P.S.; Chang, J.Y. Azimuthally isotropic irradiance of GaN-based light-emitting diodes with GaN microlens arrays. Opt. Express 2009, 17, 6148–6155. [Google Scholar] [CrossRef] [PubMed]
  27. Li, X.H.; Song, R.; Ee, Y.K.; Kumnorkaew, P.; Gilchrist, J.F.; Tansu, N. Light Extraction Efficiency and Radiation Patterns of III-Nitride Light-Emitting Diodes With Colloidal Microlens Arrays With Various Aspect Ratios. IEEE Photonics J. 2011, 3, 489–499. [Google Scholar]
  28. Soibel, A.; Keo, S.A.; Fisher, A.; Hill, C.J.; Luong, E.; Ting, D.Z.; Gunapala, S.D.; Lubyshev, D.; Qiu, Y.; Fastenau, J.M.; et al. High operating temperature nBn detector with monolithically integrated microlens. Appl. Phys. Lett. 2018, 112, 041105. [Google Scholar] [CrossRef]
  29. Li, M.F.; Yu, Y.; He, J.F.; Wang, L.; Zhu, Y.; Shang, X.; Ni, H.; Niu, Z. In situ accurate control of 2D-3D transition parameters for growth of low-density InAs/GaAs self-assembled quantum dots. Nanoscale Res. Lett. 2013, 8, 1–6. [Google Scholar] [CrossRef] [Green Version]
  30. Shang, X.J.; Xu, J.X.; Ma, B.; Chen, Z.S.; Wei, S.H.; Li, M.F.; Zha, G.W.; Zhang, L.C.; Yu, Y.; Ni, H.Q.A. Proper In deposition amount for on-demand epitaxy of InAs/GaAs single quantum dots. Chin. Phys. B 2016, 25, 452–458. [Google Scholar] [CrossRef]
  31. Chen, Z.S.; Ma, B.; Shang, X.J.; He, Y.; Zhang, L.C.; Ni, H.Q.; Wang, J.L.; Niu, Z.C. Telecommunication Wavelength-Band Single-Photon Emission from Single Large InAs Quantum Dots Nucleated on Low-Density Seed Quantum Dots. Nanoscale Res. Lett. 2016, 11, 382. [Google Scholar] [CrossRef] [Green Version]
  32. Shang, X.; Ma, B.; Ni, H.; Chen, Z.; Li, S.; Chen, Y.; He, X.; Su, X.; Shi, Y.; Niu, Z. C2v and D3h symmetric InAs quantum dots on GaAs (001) substrate: Exciton emission and a defect field influence. AIP Adv. 2020, 10, 085126. [Google Scholar] [CrossRef]
  33. Ulrich, S.; Gies, C.; Ateş, S.; Wiersig, J.; Reitzenstein, S.; Hofmann, C.; Löffler, A.; Forchel, A.; Jahnke, F.; Michler, P. Photon Statistics of Semiconductor Microcavity Lasers. Phys. Rev. Lett. 2007, 98, 043906. [Google Scholar] [CrossRef] [PubMed]
  34. Igarashi, Y.; Shirane, M.; Ota, Y.; Nomura, M.; Kumagai, N.; Ohkouchi, S.; Kirihara, A.; Ishida, S.; Iwamoto, S.; Yorozu, S.; et al. Spin dynamics of excited trion states in a single InAs quantum dot. Phys. Rev. B 2010, 81, 245304. [Google Scholar] [CrossRef]
  35. Wu, X.F.; Dou, X.M.; Ding, K.; Zhou, P.Y.; Ni, H.Q.; Niu, Z.C.; Zhu, H.J.; Jiang, D.S.; Zhao, C.L.; Sun, B.Q. Second-Order Correlation Function for Asymmetric-to-Symmetric Transitions due to Spectrally Indistinguishable Biexciton Cascade Emission. Chin. Phys. Lett. 2015, 32, 124204. [Google Scholar] [CrossRef] [Green Version]
Figure 1. (a) Schematic of ML-DBR hybrid structure; (be) Scanning electron microscope (SEM) images of MLs in different shapes: (b) bird-view of ML array; (c) p e a k ; (d) g a u s s ; and (e) h a t . Scale bars: 1 μ m. (f) Confocal and HBT setups for μ PL spectroscopy and photon correlation measurement.
Nanomaterials 11 01136 g001
Figure 2. Simulation of light extraction efficiency η of a QD (at Z = 0.396 μ m) in a ML, as a function of QD horizontal position X (a) and wavelength (b); (c) typical YZ-cut profile electric field distribution in a ML ( η is given), W: the ML vertical position from the top AlGaAs DBR, the optimal W is 0.116 μ m ( g a u s s ), 0.012 μ m ( h a t ) and 0.080 μ m ( p e a k ); statistics on QD exciton emission peak intensity (d) and wavelength (e) in a total of 176 spectral lines, 34 in the flat sample and 142 in different shaped MLs; (f) typical μ PL spectra of QDs in the h a t - and g a u s s -shaped ML, offset vertically for clarity: MLs are fabricated in the dilute QD region (left) or the multi-QD region (right); (g) auto-correlations of the dominant peaks in the h a t -shaped MLs h a t -1 and h a t -2, with radiative lifetimes extracted from their photon autocorrelation, 0.3 ns for h a t -1 and 0.6 ns for h a t -2, red: deconvolution fitting, blue: convolution fitting.
Nanomaterials 11 01136 g002
Figure 3. Typical μ PL spectra (a) and secondorder autocorrelation function g ( 2 ) ( τ ) (b) of QDs in the three types of MLs, red: deconvolution fitting, blue: convolution fitting. (c) X X X cross-correlation function g ( 2 ) ( τ ) of QDs in the g a u s s -1 and h a t MLs. Inset: theoretical schemes of QD biexciton ( X X ) and charged exciton ( X + ) transition.
Nanomaterials 11 01136 g003
Table 1. Detailed fabrication parameters and shape parameters of the three shapes of MLs.
ML Shape SiO 2 Mask DiameterEtching TimeHWFWHM
p e a k 1.9 μ m90 min0.59 μ m0.05 μ m0.59 μ m
g a u s s 2.2 μ m90 min0.53 μ m0.08 μ m0.61 μ m
h a t 2.5 μ m90 min0.68 μ m0.01 μ m1.04 μ m
Publisher’s Note: MDPI stays neutral with regard to jurisdictional claims in published maps and institutional affiliations.

