1. Introduction
Noble metal nanoparticles find diverse applications in many emerging scientific areas. More recently it was observed that the addition of nanoparticles as integrated element in composite materials can provide a significant improvement of their characteristics [
1,
2,
3,
4,
5,
6]. Indeed, the operation of these new materials relies on the peculiar properties of metal nanoparticles, such as mechanical, electronic, and optical ones [
7,
8,
9,
10,
11].
Among all metal nanoparticles, Ag nanoparticles have attracted the attention of researchers for their numerous biological activities [
12,
13,
14,
15]. For their characterization, the analytical technique of X-ray photoemission spectroscopy (XPS) results to be a tool with peculiar properties capable to provide information on surface chemical composition.
By using the analytical technique of X-ray photoemission spectroscopy, it is possible to obtain not only the information on the surface chemical composition, but also to identify the oxidation state of the elements from the chemical shift of their photoemission peaks. However, in some cases it is difficult or even impossible to determine the oxidation state due to the very small value of chemical shift. This phenomenon is characteristic for some metals, also including silver [
16]. The noticeable shift of photoemission peaks could be also caused by the reduced size of NPs, as it has been demonstrated for Ag and Au [
17,
18,
19,
20,
21,
22]. This shift, which is called size-shift, occurs when the metallic nanoparticles are of the dimension less than ≈5 nm and has been also predicted in previous theoretical works [
23,
24].
The material synthesized and characterized in this work consists of different composites of silver and hydroxyapatite (HA) functionalized calcium carbonate (FCC) [
25,
26]. These composites combine the unique properties of noble metal nanoparticles with the antibacterial action of silver [
27,
28] and biocompatibility of HA-FCC, consequently they could be very promising for application in biomedical and pharmaceutical fields.
The composite samples were prepared by blending HA-FCC with silver acetate (adsorption or mixing in wet conditions) followed by the physical (exposure to high-dose visible light) or chemical (calcination or high power ultrasound assisted reduction with NaBH4 or citrate) treatments to boost silver reduction and nanodispersion.
In the investigated composite, the diameter of Ag NPs was higher than 5 nm, hence the size-shift of XPS peaks was not expected. Therefore, the spectrum of spin-orbit doublet Ag 3d in metallic NPs should be identical to bulk Ag. However, for the identification of Ag oxidation state in NPs it is possible to acquire the main Auger signal of Ag MNN transition and to determine the Auger parameter α’ [
29], which is calculated by adding the binding energy (BE) of Ag 3d
5/2 peak to the kinetic energy (KE) of Ag MNN one.
The novelty of the present work lies on the use of X-ray photoelectron spectroscopy and reflected electron energy loss spectroscopy to investigate hybrid nanostructured materials with a quite copious and complex chemical and structural compositions, to obtain fundamental information on the Ag oxidation state in different samples. The detailed and challenging analysis to determine the Auger parameters enables to determine the sensitivity of the XPS-measurements even in hybrid samples and to establish these spectroscopies as a valuable tool to examine materials, which are relevant in many application fields.
For the comparison of results obtained for the samples prepared by the different methods, the data for all the samples were summarized in a classical Wagner plot.
2. Materials and Methods
2.1. Preparation of Ag and HA-FCC Composites
The material Omyapharm 500-OG, which was kindly provided by Omya Italia (Carrara, MS, Italy), was used as HA-FCC. Silver acetate was purchased from Alfa Aesar (Karlsruhe, Germany). Deionized water was obtained by reverse osmosis process in a MilliQ system (Millipore, Rome, Italy). Other reagents and solvents were of reagent grade and were used without further purification.
Ag and HA-FCC composites were obtained by three different methods:
HA-FCC (1g) was equilibrated with an almost saturated solution of silver acetate (100 mg) in deionized water (10 mL) and the composite was recovered by filtration to obtain the sample 1. Afterwards, the sample 1 was either irradiated with a Hg lamp equipped with a long pass filter to enable exposure to 430–800 nm radiation for 120 min (obtaining sample 2) or it was calcined at 300 °C to produce the sample 5;
A dispersion of HA-FCC (1 g) was mixed with an aqueous almost saturated solution of silver acetate, then it was heated at 37 °C until dryness (sample 3) and then irradiated as for sample 2 in order to obtain the sample 4;
For the synthesis of samples 6–9, a solution of reducing agent (NaBH4, or trisodium citrate) was dropped, under high power ultrasound irradiation for 45 min at 50% of amplitude and at 25 °C, to an aqueous dispersion of silver acetate (50 mg) and HA-FCC (1 g). The solid material was recovered by centrifugation. Two different amounts of silver acetate (50 mg and 100 mg) were used to obtain four different composites: the samples 6 and 7, when trisodium citrate was used; the samples 8 and 9, when the reducing agent was NaBH4). The high-power ultrasound irradiation was performed by using an Ultrasonic processor VCX750 (Sonics & Materials, Inc., Newtown, CT, USA), 20 kHz, with a diameter tip of 13 mm.
The samples preparation is summarized in a scheme shown in
Figure 1.
2.2. Characterization
X-ray powder diffraction (XRPD) patterns were taken by a Philips X’PERT PRO MPD diffractometer (Malvern Panalytical Ltd., Malvern, UK) operating at 40 kV and 40 mA, with a step size of 0.0170 2θ degree, and step scan of 20 s, using Cu Kα radiation and an X’Celerator detector (Malvern Panalytical Ltd., Malvern, UK).
Transmission electron microscopy (TEM) images were collected by a Philips 208 transmission electron microscope (FEI, Hillsboro, OR, USA). The samples were prepared by the deposition of a small drop of the aqueous dispersion of the solids on a copper grid precoated with a Formvar film and then evaporated in air at room temperature.
XPS analyses were carried out by using an electronic spectrometer Escalab MkII (VG Scientific Ltd., East Grinstead, UK). The samples, deposited on pure Au foil (99.99%) and mounted on the sample holder, were introduced into the analysis chamber, where the base pressure was maintained at ~2 × 10⁻⁹ mbar. All the spectra were excited with a standard unmonochromatized Al Kα source and registered by a 5-channeltron detection system. To acquire the spectral regions with high energy resolution, the analyzer was set to constant pass energy of 40 eV. To increase the signal-to-noise ratio, the Auger spectra were collected at the pass energy of 100 eV. The input slits of the analyzer have been set to large-area mode A1 × 22, providing the diameter of analyzed area of about 10 mm. The REELS experiments on the HA-FCC reference sample were carried out in an Escalab 250Xi spectrometer (Thermo Fisher Scientific Ltd., East Grinstead, UK) equipped with an in-lens electron source operating in the energy range of 100–1000 eV.
All experimental data were acquired and processed by using the Avantage v.5 software (Thermo Fisher Scientific Ltd., East Grinstead, UK). The “smart” background and mixed Lorentzian/Gaussian peak shape (30%) was used for the peak fitting routine. Scofield’s relative sensitive factors with energy compensation coefficient of KE0.6 were applied for the elemental quantification.
Preliminary Discussions
The photoemission and Auger spectra acquired for each composite contain not only the peaks of Ag NPs, but also the ones of constituent elements of HA. As it is known from the previous XPS studies on hydroxyapatite, in the spectra of O 1s are present two strong shake-up satellites at higher BE referred to the excitations from O 2s and Ca 3p levels to unoccupied P-O and Ca-O orbitals in the valence band [
30,
31]. It is logical to suppose that the same satellites could be also present in the spectra of Ca 2p and P 2p, moreover, these satellites of Ca 2p would overlap with the spectrum of Ag 3d. To identify all possible energy losses in photoemission spectra of composite, the measurements of reflected electron energy loss spectroscopy (REELS) were carried out for the reference sample of HA-FCC without Ag NPs. These results permitted to identify not only shake-up satellites, but also all plasmonic energy losses in HA and/or HA-FCC. Afterwards, by subtraction of Ca 2p satellites from Ag 3d spectra were obtained the photoemission signals from Ag NPs.
Before the identification of Ag oxidation state in different composite samples, the values of Auger parameter were determined for the reference compounds of Ag3PO4, Ag2O, and AgCH3COO.
3. Results and Discussion
3.1. XRD and TEM Results
Figure 2a shows the XRD pattern of HA-FCC compared with that of the sample 1. The CaCO
3 and HA phases in the HA-FCC composite are clearly detected, whereas the treatment with silver acetate induces the formation of a new phase identified as Ag
3PO
4 by comparison with the reference spectra of cubic silver phosphate (PDF#01-084-0192). The diameter of Ag
3PO
4 particles calculated by the Debye-Scherrer equation was of 79 nm, which is in good agreement with average dimension of 70 ± 36 nm determined for 50 particles of Ag
3PO
4 visible in the TEM image reported in
Figure 2b. Conversely, the treatment of HA-FCC with silver acetate in the presence of NaBH
4 gives preferentially Ag nanoparticles as highlighted by the reflections of (
111) and (
200) crystalline planes of the cubic metallic Ag (PDF#87-597) in the XRD pattern of the sample 8 (
Figure 2c). TEM images in
Figure 2d show dark nanoparticles with a diameter of about 20 nm ascribable to Ag.
3.2. XPS Results
3.2.1. HA-FCC Reference Sample
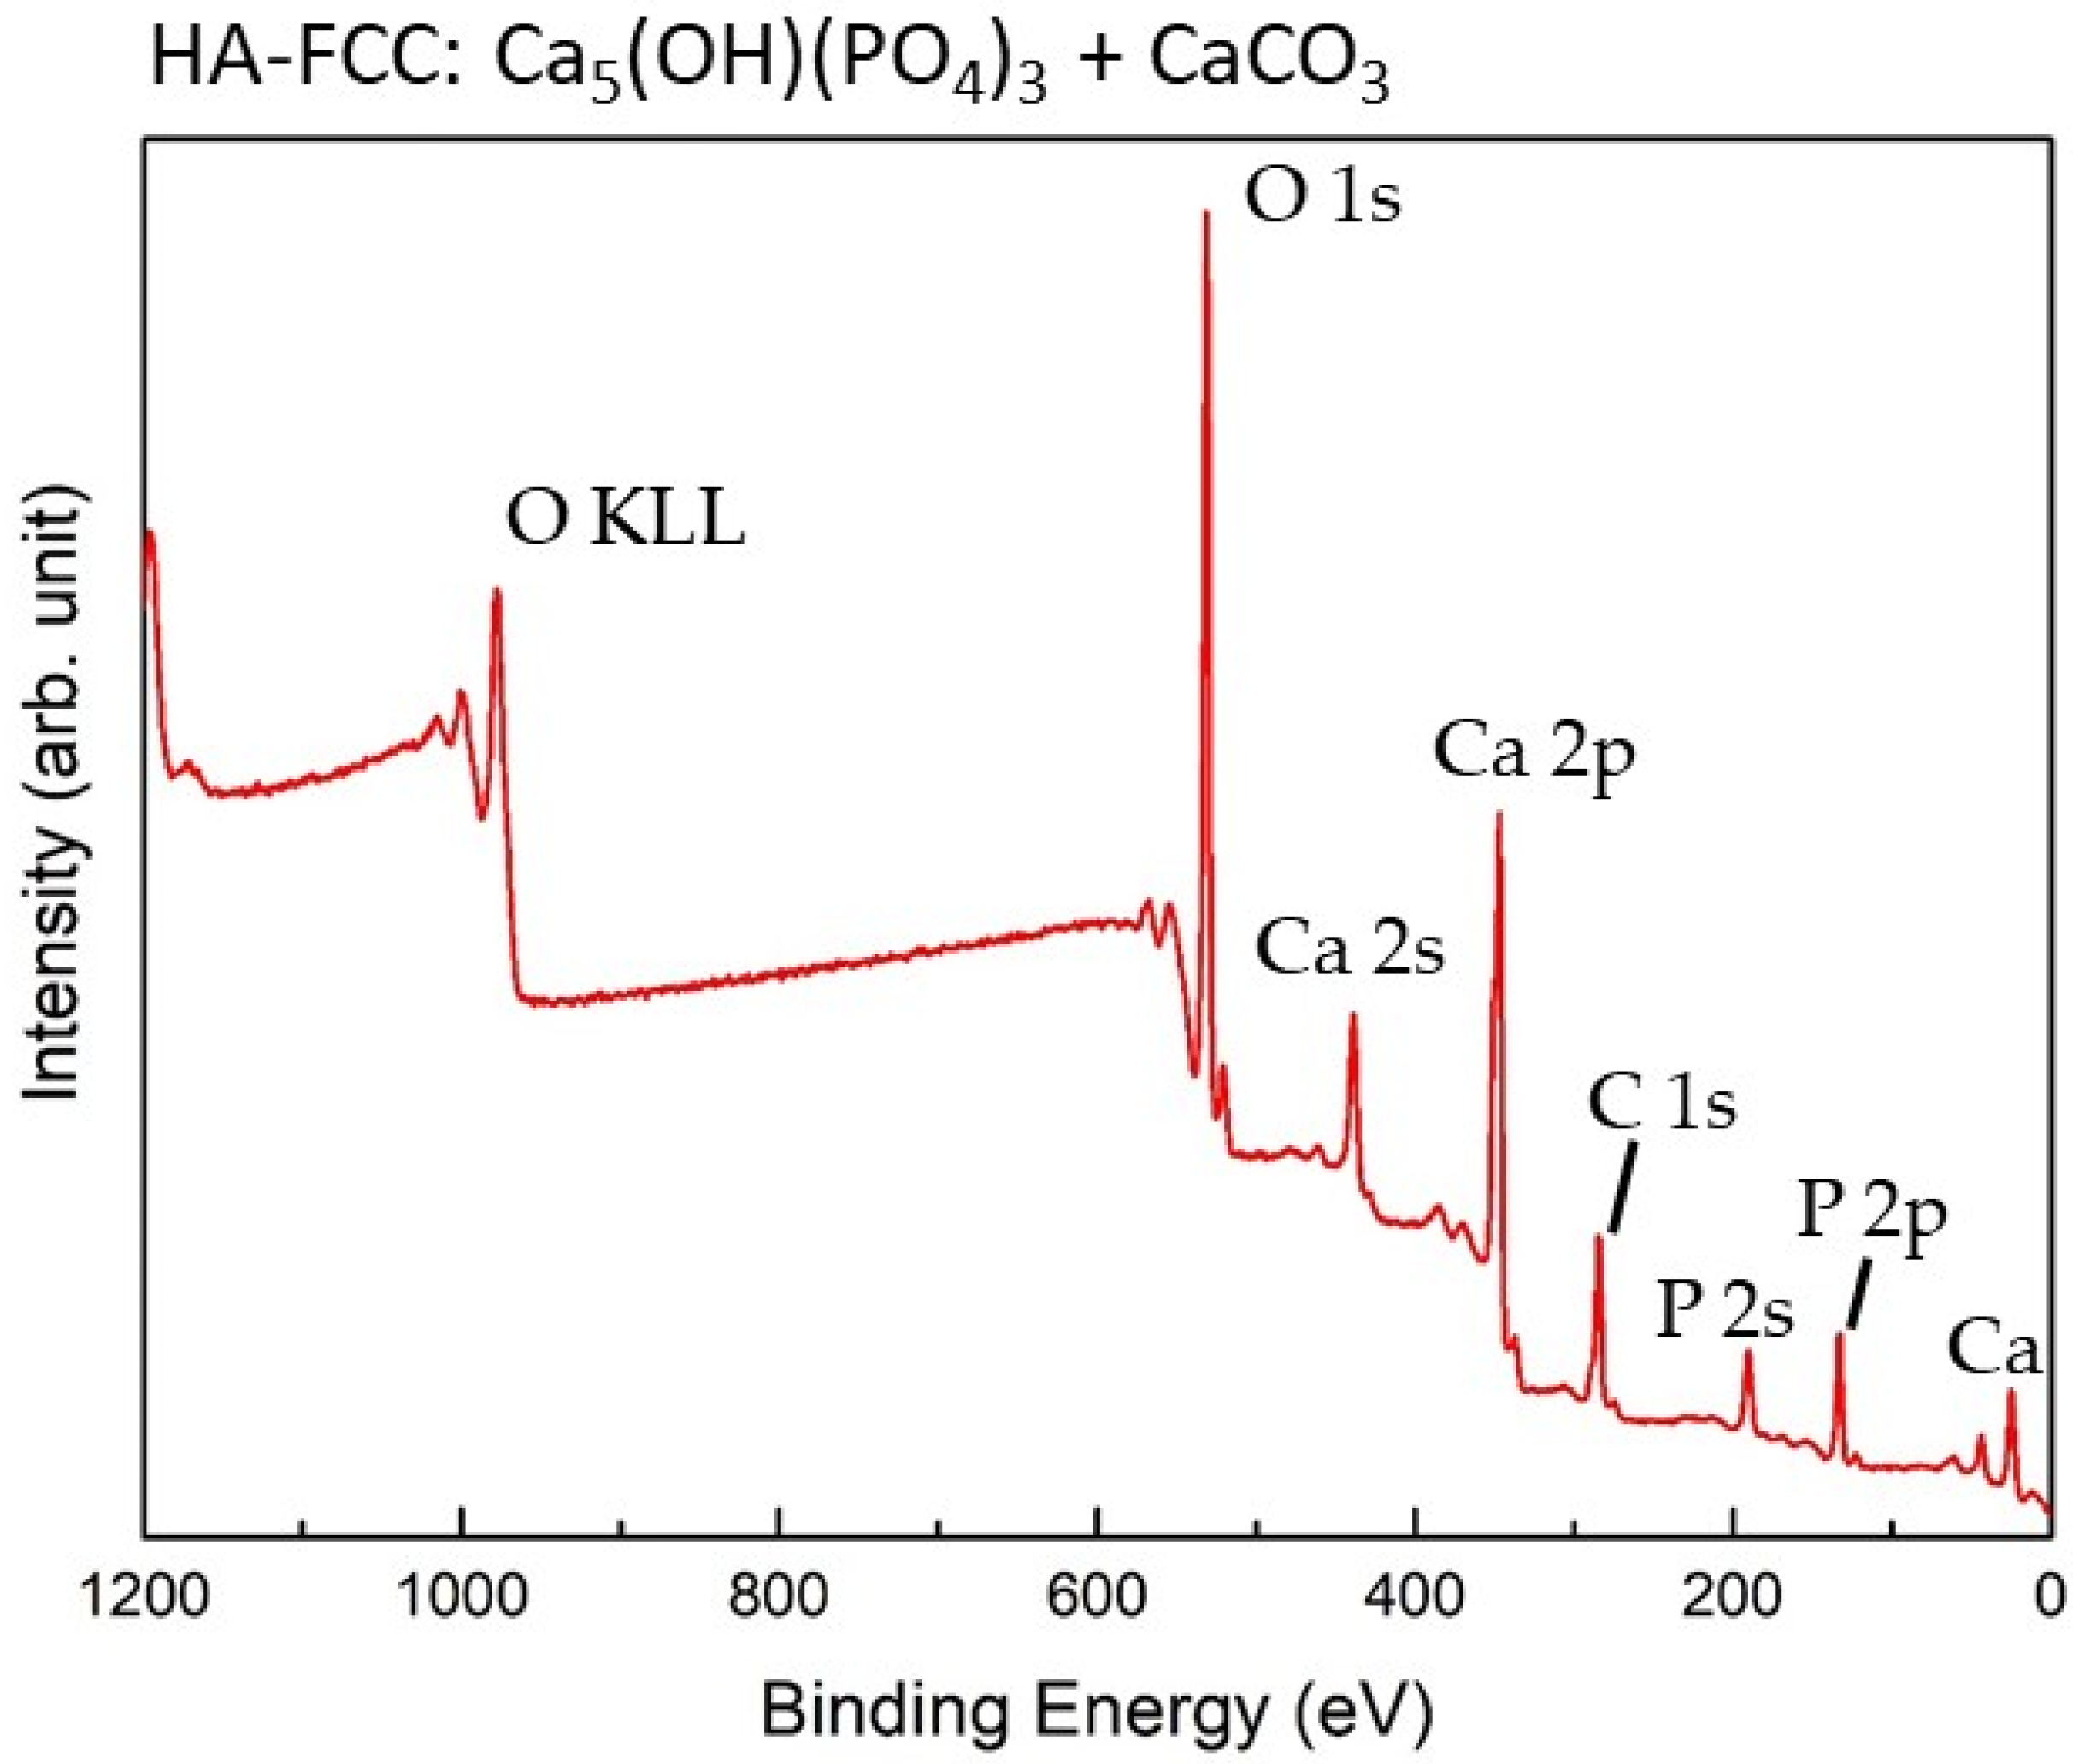
The typical survey spectrum of HA-FCC reference sample is shown in
Figure 3 and its chemical composition is reported in
Table 1. From the quantitative analysis of the revealed elements, it is possible to evaluate the atomic ratios of Ca/P and O/Ca. Obtained values of Ca 2p/P 2p ~1.5 and O 1s/Ca 2p ~2.5 are almost in agreement with stoichiometric compound, i.e., Ca
5(OH)(PO
4)
3 + CaCO
3. Besides, it should be noted the absence of any impurities except of 15.4 at% of adventitious carbon, corresponding to the component C1s-A at a binding energy (BE) of 285.0 eV listed in
Table 1.
Two strong satellites, shifted to higher BE by 23 ± 1 eV and 36 ± 1 eV, are well visible in the O 1s region. The same satellites are present also in the photoelectron regions of Ca 2p and P 2p reported in
Figure 4.
Furthermore, as shown in
Figure 5a, some other energy losses are repeating in the photoemission regions of the main constituents of HA-FCC. In order to clarify the origin of these loss peaks in hydroxyapatite functionalized calcium carbonate, the REELS analyses were performed on the reference sample. By decreasing the primary electron energy from 1000 to 100 eV, the surface sensitivity of REELS measurements was gradually increased. The results, obtained for all the energies of primary beam, are shown in the
Figure 5b.
Two strong peaks at 36 and 23 eV (marked as I and II), actually are the same shake-up satellites referred to the excitations from O 2s and Ca 3p to unoccupied orbitals of (P-O) and (Ca-O) in the valence band, respectively, observed also in photoemission spectra [
30,
31]. Sometimes these peaks are confused with collective electronic excitations, i.e., plasmonic losses, as it has been referred to in [
32,
33]. Instead from comparison with REELS spectra, it is clear that the other peaks at about 11.0 and 16.5 eV from the elastic peak, are attributed to the bulk (B) and surface (S) plasmonic losses in the crystalline HA-FCC structure [
34]. In fact, the plasmon excitations B and S are visible even in C 1s spectral region, where are absent the losses I and II of 36 and 23 eV, because in the excitation of shake-up satellites are involved only O, Ca, and P electronic orbitals.
When the loss spectra are excited by low energy electrons of 200 and 100 eV, their energy becomes too low for the excitation of shake-up processes and bulk plasmons, therefore, these loss peaks are disappearing from the spectra. At 100 eV, the principal energy losses are caused by the surface plasmons S at 11.0 eV and surface excitons SE at 7.3 eV [
34].
3.2.2. Reference Samples of Ag
Three silver compounds were analyzed to obtain the reference spectra: AgCH
3COO, which is the precursor used to produce the nanoparticles in composite, Ag
3PO
4 and the silver oxide Ag
2O. In the first two columns of the
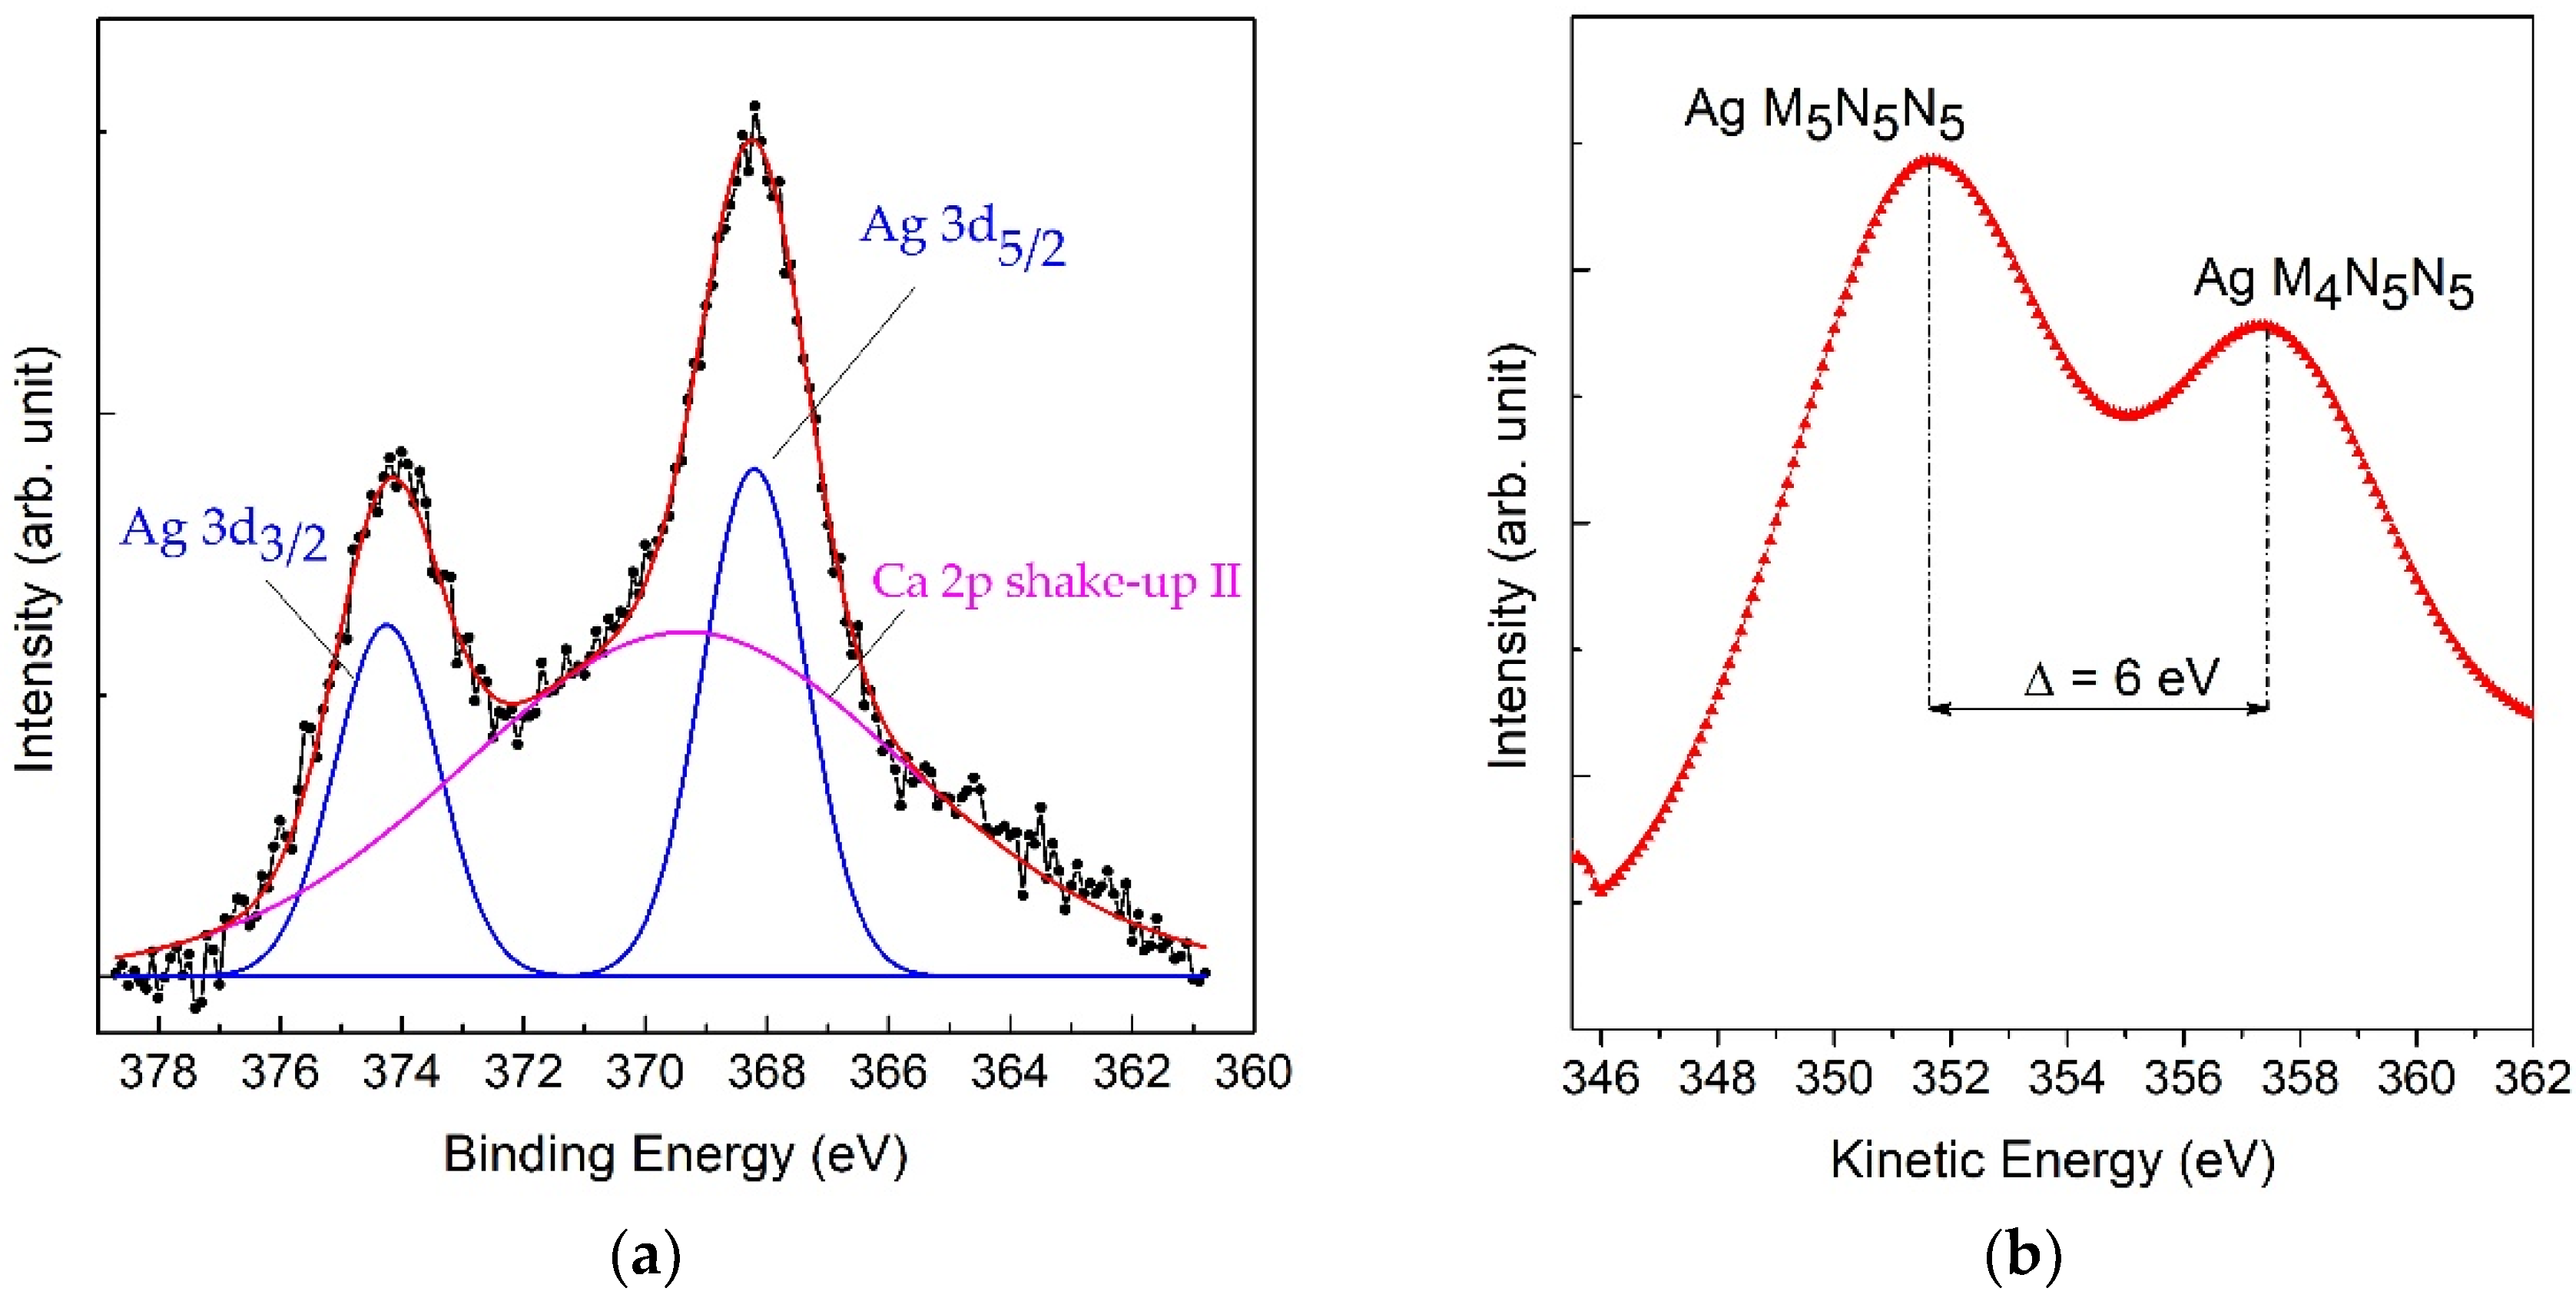
Table 2 are reported the BE values of the main doublet peak Ag 3d
5/2 and the value of kinetic energy (KE) of Auger transition Ag M
4N
5N
5. The BE scale was calibrated by setting the C 1s peak of adventitious carbon at 285.0 eV. Consequently, by rescaling the spectra to eliminate possible sample charging, the Ag 3d
5/2 peaks of phosphate Ag
3PO
4 and acetate AgCH
3COO were located at BE = 368.4 eV, whereas for Ag
2O it was at BE = 367.9 eV. Since the chemical shift in silver photoemission peaks is too small for accurate identification of Ag chemical state [
20], it was necessary to also acquire the Auger spectra, where the chemical shift in different silver compounds is higher, even of some eV. Then it is possible to calculate the Auger parameter α’ by adding the BE of Ag 3d
5/2 peak to the KE of corresponding Auger transition Ag M
4N
5N
5:
In the case of low intensity Auger signals, as it often happens in the composites with Ag nanoparticles, it is better to use the higher intensity peak of Ag M
5N
5N
5 and to add 6.0 eV, corresponding to the difference in KE between two Auger peaks [
35]. Then, from the calculated values of Auger parameter it is possible to determine the oxidation state of silver.
For the reference sample of Ag
2O, the Auger parameter was equal to 724.2 eV, which perfectly corresponds to the oxidation state +1 in this oxide [
35]. The values of Auger parameter determined for the reference samples of Ag
3PO
4 and AgCH
3COO were slightly lower, in the range of α’ = 722.5–722.7 eV, as it has been reported for other Ag salts with Ag
+1 [
29,
35,
36,
37]. All these results for three reference samples are summarized in
Table 2.
3.2.3. Composite Samples with Ag NPs
After the preliminary analyses done on the reference samples, the investigations were continued on the composite materials of HA-FCC with silver, prepared using AgCH
3CO
2 precursor. The results obtained for different HA-FCC + AgCH
3COO samples are reported in this chapter. Different samples were prepared by using three methods specifically, (1) adsorption followed by irradiation or calcination, (2) wet mixing followed by irradiation, (3) ultrasound assisted reduction with citrate or NaBH
4. Irradiation and calcination should act as silver reduction method [
38,
39,
40,
41] stimulating the formation of Ag nanomaterials homogeneously dispersed in HA-FCC. As it will be described below, different results have been obtained for each method.
For all the composite samples before and after the treatments, the main photoemission peak of Ag 3d falls in the same spectral region with the first shake-up satellite (marked II in
Figure 5) of Ca 2p line. Therefore, it was necessary to include this satellite in the peak fitting of Ag 3d spectra, as it is shown in
Figure 6. For each sample, all the main peaks of HA-FCC including their shake-up satellites have been also acquired: O 1s at BE = 531.5 eV, Ca 2p at BE = 347.7 eV, and P 2p at BE = 133.7 eV. The position of these reference peaks was used to check the calibration of BE scale. In addition to shake-up satellites, also the plasmonic losses were observed in all the spectra, indicating that the crystalline structure of HA-FCC has not been altered in the composite.
The study of the formation of Ag NPs, starting from the mixture with precursor and during the process of reduction, was continued by following the variation of silver Auger parameter. Therefore, all obtained results were compared with the reference samples and with references reported in literature [
35,
36,
37]. The results obtained for all the samples of HA-FCC + AgCH
3COO before and after all the treatments (irradiation, calcination, chemical reduction under sonication) are summarized in
Table 3.
The first method used to mix the AgCH
3COO with HA-FCC, so-called adsorption (sample 1 in
Table 3), resulted in Auger parameter α’ = 722.5 eV. It is not possible to distinguish, if this value is attributable to an oxidation state +1 in the silver acetate itself or to the formation of possible Ag phosphate bonds with phosphorus in HA-FCC. As regards the second method of mixing in wet conditions, corresponding to sample 3 in
Table 3, it was characterized by the value of α’ = 722.7 eV. In this case, the value corresponds to the oxidation state +1. The value of Auger parameter, obtained for the compound mixed by the absorption method and then subjected to irradiation, was of 723.9 eV. This difference of α’ before and after irradiation indicates a change of the Ag oxidation state. Therefore, a partial silver reduction was observed, but it was not sufficient to produce metallic nanoparticles. Calcination also did not produce a sufficient reduction: in this case the Auger parameter was α’ = 723.6 eV, which is also attributable to silver oxide Ag
2O. Better results were obtained after the sonication/chemical reduction treatment: α’ = 724.9 and 725.7 eV for the samples 6 and 7, respectively, whereas the addition of reducing agent NaBH
4 resulted in α’ = 725.7 and 725.4 eV for the samples 8 and 9, respectively. In this case was identified the state of metallic silver, indicating the formation of Ag NPs.
The results obtained for all the samples, including those of the three reference compounds, were summarized in the classic Wagner plot presented in
Figure 7.
The determination of Ag oxidation state by using the Auger parameter for identification of metallic Ag and consequently of the NPs formation is fast and reliable. This method has already been used successfully for other types of compounds with Ag nanoparticles in solution [
18,
19].
4. Conclusions
The composites of Ag nanoparticles dispersed in hydroxyapatite HA-FCC were synthesized by using different methods and characterized by XRD, TEM, REELS, and XPS techniques.
The REELS analyses of the HA-FCC reference sample have identified the nature of two strong satellites, shifted to higher BE by 23 ± 1 eV and 36 ± 1 eV from the main XPS peaks of O 1s, Ca 2p, and P 2p. All these losses were attributed to the shake-up satellites referred to the excitations from O 2s and Ca 3p core levels to unoccupied orbitals of (P-O) and (Ca-O) in the valence band and not to plasmonic collective excitations as it has been often confused. Nevertheless, also the plasmonic losses were present in the REELS spectra at about 16.5 eV (bulk plasmon) and 11 eV (surface plasmon) with respect to the elastic peak.
The use of the Auger parameters in determining the effectiveness of the different silver reduction methods, proved to be successful. In fact, from the calculated Auger parameter α′ for all the investigated samples, it was possible to evaluate the outcome of the different silver reduction methods in composite. Some of these methods, such as irradiation and calcination, were not entirely effective, producing only a partial reduction of silver in NPs. Instead, the other methods such as the combination of sonication with the addition of citrate or NaBH4, led to a complete reduction of silver to metallic state, indicating the formation of Ag NPs with a diameter of about 20 nm.
Author Contributions
Conceptualization, E.B., S.K. and G.P.; Auger parameter methodology, E.B., S.K. and G.P.; XPS and REELS investigations, E.B., S.K., and A.M.; writing and editing, E.B., S.K., and A.M.; synthetic procedure V.A., L.L. and A.D.M.; TEM investigations, V.A. and A.D.M.; XRD characterization, M.N., manuscript revision, E.B., S.K., G.P., V.A., M.N., A.D.M. and M.N. All authors have read and agreed to the published version of the manuscript.
Funding
No funding has been received for preparation of this article.
Acknowledgments
We are grateful to Omya Italia (Carrara, MS, Italy) for supplied material Omyapharm 500-OG.
Conflicts of Interest
The authors declare no conflict of interest.
References
- Prakash, J.; Pivin, J.C.; Swart, H.C. Noble metal nanoparticles embedding into polymeric materials: From fundamentals to applications. Adv. Colloid Interface Sci. 2015, 226, 187–202. [Google Scholar] [CrossRef]
- Da Silva, A.B.; Rufato, K.B.; De Oliveira, A.C.; Souza, P.R.; Da Silva, E.P.; Edvani, B.; Muniz, C.; Vilsinski, B.H.; Martins, A.F. Composite materials based on chitosan/gold nanoparticles: From synthesis to biomedical applications. Int. J. Biol. Macromol. 2020, 161, 977–998. [Google Scholar] [CrossRef] [PubMed]
- Dongmei, H.; Bachirou, G.L.; Yantao, X.; Yong, S.; Xing, H. Thermal properties characterization of chloride salts/nanoparticles composite phase change material for high-temperature thermal energy storage. Appl. Energy 2020, 264, 114674. [Google Scholar]
- Satulu, V.; Mitu, B.; Ion, V.; Marascu, V.; Matei, E.; Stancu, C.; Dinescu, G. Combining Fluorinated Polymers with Ag Nanoparticles as a Route to Enhance Optical Properties of Composite Materials. Polymers 2020, 12, 1640. [Google Scholar] [CrossRef]
- Xie, R.; Wei, T.; Bai, S.; Wang, Z. The synthesis and catalytic activity of bimetallic CuAg nanoparticles and their magnetic hybrid composite materials. New J. Chem. 2020, 44, 9684. [Google Scholar] [CrossRef]
- Ituena, E.; Ekeminic, E.; Yuanhuaa, L.; Lia, R.; Singh, A. Mitigation of microbial biodeterioration and acid corrosion of pipework steel using Citrus reticulata peels extract mediated copper nanoparticles composite. Int. Biodeterior. Biodegrad. 2020, 149, 104935. [Google Scholar] [CrossRef]
- Prosposito, P.; Burratti, L.; Venditti, I. Silver Nanoparticles as Colorimetric Sensors for Water Pollutants. Chemosensor 2020, 8, 26. [Google Scholar] [CrossRef] [Green Version]
- Jain, P.K.; Huang, X.; El-Sayed, I.H.; El-Sayed, M.A. Noble Metals on the Nanoscale: Optical and Photothermal Properties and Some Applications in Imaging, Sensing, Biology, and Medicine. Chem. Res. 2008, 41, 1578–1586. [Google Scholar] [CrossRef]
- Gambucci, M.; Aluigi, A.; Seri, M.; Sotgiu, G.; Zampini, G.; Donnadio, A.; Torreggiani, A.; Zamboni, R.; Latterini, L.; Posati, T. Effect of Chemically Engineered Au/Ag Nanorods on the Optical and Mechanical Properties of Keratin Based Films. Front. Chem. 2020, 8, 158. [Google Scholar] [CrossRef]
- Barbalinardo, M.; Antosova, A.; Gambucci, M.; Bednarikova, Z.; Albonetti, C.; Valle, F.; Sassi, P.; Latterini, L.; Gazova, Z.; Bystrenova, E. Effect of metallic nanoparticles on amyloid fibrils and their influence to neural cell toxicity. Nano Res. 2020, 13, 1081–1089. [Google Scholar] [CrossRef]
- Latterini, L.; Tarpani, L. Hierarchical Assembly of Nanostructures to Decouple Fluorescence and Photothermal Effect. J. Phys. Chem. C 2011, 115, 21098–21104. [Google Scholar] [CrossRef]
- Zhang, X.F.; Liu, Z.G.; Shen, W.; Gurunathan, S. Silver Nanoparticles: Synthesis, Characterization, Properties, Applications, and Therapeutic Approaches. Int. J. Mol. Sci. 2016, 17, 1534. [Google Scholar] [CrossRef] [PubMed]
- Azharuddin, M.; Ozgur, E.; Zhu, G.H.; Uzun, L.; Das, D.; Turner, A.P.F.; Patra, H.K. A repertoire of biomedical applications of noble metal nanoparticles. Chem. Commun. 2019, 55, 6964–6996. [Google Scholar] [CrossRef] [PubMed]
- Lee, S.H.; Jun, B.H. Silver Nanoparticles: Synthesis and Application for Nanomedicine. Int. J. Mol. Sci. 2019, 20, 865. [Google Scholar] [CrossRef] [Green Version]
- Murphy, M.; Ting, K.; Zhang, X.; Soo, C.; Zheng, Z. Current Development of Silver Nanoparticle Preparation, Investigation, and Application in the Field of Medicine. J. Nanomater. 2015, 2015, 696918. [Google Scholar] [CrossRef] [Green Version]
- Ramstedta, M.; Franklynb, P. Difficulties in determining valence for Ag0 nanoparticles using XPS—characterization of nanoparticles inside poly (3-sulphopropyl methacrylate) brushes. Surf. Interface Anal. 2010, 42, 855–858. [Google Scholar] [CrossRef]
- Aruna, I.; Mehta, B.R.; Malhotra, L.K.; Shivaprasad, S.M. Size dependence of core and valence binding energies in Pd nanoparticles: Interplay of quantum confinement and coordination reduction. J. Appl. Phys. 2008, 104, 064308. [Google Scholar] [CrossRef] [Green Version]
- Bolli, E.; Mezzi, A.; Burratti, L.; Prosposito, P.; Casciardi, S.; Kaciulis, S. X-ray and UV photoelectron spectroscopy of Ag nanoclusters. Surf. Interface Anal. 2020, 52, 1017–1022. [Google Scholar] [CrossRef]
- Toro, R.G.; Adel, A.M.; de Caro, T.; Federici, F.; Cerri, L.; Bolli, E.; Mezzi, A.; Barbalinardo, M.; Gentili, D.; Cavallini, M.; et al. Evaluation of Long–Lasting Antibacterial Properties and Cytotoxic Behavior of Functionalized Silver-Nanocellulose Composite. Materials 2021, 14, 4198. [Google Scholar] [CrossRef]
- Lopez-Salido, I.; Lim, D.C.; Kim, Y.D. Ag nanoparticles on highly ordered pyrolytic graphite (HOPG) surfaces studied using STM and XPS. Surf. Sci. 2005, 588, 6–18. [Google Scholar] [CrossRef]
- Peters, S.; Peredkov, S.; Neeb, M.; Eberhardt, W.; Al-Hadac, M. Size-dependent XPS spectra of small supported Au-clusters. Surf. Sci. 2013, 608, 129–134. [Google Scholar] [CrossRef]
- Rao, C.N.R.; Vijayakrishnan, V.; Aiyer, H.N.; Kulkarni, G.U.; Subbanna, G.N. An investigation of well-characterized small gold clusters by photoelectron spectroscopy, tunneling spectroscopy, and cognate techniques. J. Phys. Chem. 1993, 97, 11157–11160. [Google Scholar] [CrossRef]
- Paszti, Z.; Peto, G.; Horvàth, Z.E.; Karacs, A.; Guczi, L. Electronic structure of Ag nanoparticles deposited on Si (100). Solid State Commun. 1998, 107, 329–333. [Google Scholar] [CrossRef]
- Hummer, R.E. Electronic properties of Materials; Springer: Berlin/Heidelberg, Germany, 2011. [Google Scholar]
- Preisig, D.; Haid, D.; Varum, F.J.O.; Bravo, R.; Alles, R.; Huwyler, J.; Puchkov, M. Drug loading into porous calcium carbonate microparticles by solvent evaporation. Eur. J. Pharm. Biopharm. 2014, 87, 548–558. [Google Scholar] [CrossRef]
- Stirnimann, T.; Di Maiuta, N.; Gerard, D.E.; Alles, R.; Huwyler, J.; Puchkov, M. Functionalized Calcium Carbonate as a Novel Pharmaceutical Excipient for the Preparation of Orally Dispersible Tablets. Pharm. Res. 2013, 30, 1915–1925. [Google Scholar] [CrossRef]
- Clement, J.L.; Jarrett, P.S. Antibacterial Silver. Metal Based Drugs 1994, 1, 5–6. [Google Scholar] [CrossRef] [PubMed]
- Sim, W.; Barnard, R.T.; Blaskovich, M.A.T.; Ziora, Z.M. Antimicrobial Silver in Medicinal and Consumer Applications: A Patent Review of the Past Decade (2007–2017). Antibiotics 2018, 7, 93. [Google Scholar] [CrossRef] [Green Version]
- Ferraria, A.M.; Carapeto, A.P.; Botelho do Rego, A.M. X-ray photoelectron spectroscopy: Silver salts revisited. Vacuum 2012, 86, 1988–1999. [Google Scholar] [CrossRef]
- Lu, H.B.; Campbell, C.T.; Graham, D.J.; Ratner, B.D. Surface Characterization of Hydroxyapatite and Related Calcium Phosphates by XPS and TOF-SIMS. Anal. Chem. 2000, 72, 2886–2894. [Google Scholar] [CrossRef]
- Chusuei, C.C.; Goodman, D.W.; Van Stipdonk, M.J.; Justes, D.R.; Schweikert, E.A. Calcium Phosphate Phase Identification Using XPS and Time-of-Flight Cluster SIMS. Anal. Chem. 1999, 71, 149–153. [Google Scholar] [CrossRef]
- Payne, S.A.; Katti, D.R.; Katti, K.S. Probing electronic structure of biomineralized hydroxyapatite inside nanoclay galleries. Micron 2016, 90, 78–86. [Google Scholar] [CrossRef] [PubMed] [Green Version]
- Protheroe, A.R.; Steinbrunn, A.; Gallon, T.E. The Electron Energy Loss Spectra of Some Alkaline Earth Oxides. Surf. Sci. 1983, 126, 534–542. [Google Scholar] [CrossRef]
- Waltenburg, H.N.; Møller, P.J. Growth of ultrathin Cu films on CaO(100). Surf. Sci. 1999, 439, 139–145. [Google Scholar] [CrossRef]
- Moulder, J.F.; Stickle, W.F.; Sobol, P.E.; Bomben, K.D. Handbook of X-ray Photoelectron Spectroscopy: A Reference Book of Standard Spectra for Identification and Interpretation of XPS Data; Perkin-Elmer: Eden Prairie, MN, USA, 1992; p. 207. [Google Scholar]
- Aspromonte, S.G.; Mizrahi, M.D.; Schneeberger, F.A.; Ramallo López, J.M.; Boix, A.V. Study of the Nature and Location of Silver in Ag-exchanged Mordenite Catalysts. Characterization by Spectroscopic Techniques. J. Phys. Chem. C 2013, 117, 25433–25442. [Google Scholar] [CrossRef] [Green Version]
- Fonseca, A.M.; Neves, I.C. Study of silver species stabilized in different microporous zeolites. Microporous Mesoporous Mater. 2013, 181, 83–87. [Google Scholar] [CrossRef]
- Tang, B.; Xu, S.; An, J.; Zhao, B.; Xu, W. Photoinduced Shape Conversion and Reconstruction of Silver Nanoprisms. J. Phys. Chem. C 2009, 113, 7025–7030. [Google Scholar] [CrossRef]
- Sato-Berrú, R.; Redón, R.; Vázquez-Olmos, A.; Saniger, J. Silver nanoparticles synthesized by direct photoreduction of metal salts. Application in surface-enhanced Raman spectroscopy. J. Raman Spectrosc. 2009, 40, 376–380. [Google Scholar] [CrossRef]
- Ambrogi, V.; Pietrella, D.; Donnadio, A.; Latterini, L.; Di Michele, A.; Luffarelli, I.; Ricci, M. Biocompatible alginate silica supported silver nanoparticles composite films for wound dressing with antibiofilm activity. Mater. Sci. Eng. C 2020, 112, 110863. [Google Scholar] [CrossRef]
- Ambrogi, V.; Donnadio, A.; Pietrella, D.; Latterini, L.; Alunni Proietti, F.; Marmottini, F.; Padeletti, G.; Kaciulis, S.; Giovagnoli, S.; Ricci, M. Chitosan films containing mesoporous SBA-15 supported silver nanoparticles for wound dressing. J. Mater. Chem. B 2014, 2, 6054–6063. [Google Scholar] [CrossRef] [PubMed]
| Publisher’s Note: MDPI stays neutral with regard to jurisdictional claims in published maps and institutional affiliations. |
© 2021 by the authors. Licensee MDPI, Basel, Switzerland. This article is an open access article distributed under the terms and conditions of the Creative Commons Attribution (CC BY) license (https://creativecommons.org/licenses/by/4.0/).


 ,
, 


