
Pedestal High-Contrast Gratings for Biosensing

 , ,
, ,  , , , , and
Abstract
:
1. Introduction
2. Experimental Section
3. Results and Discussion
4. Conclusions
Author Contributions
Funding
Data Availability Statement
Acknowledgments
Conflicts of Interest
Abbreviations
| HCG | High-contrast grating |
| PHCG | Pedestal high-contrast grating |
| RIU | Refractive index unit |
| LoD | Limit of detection |
| LoQ | Limit of quantification |
| POC | Point-of-care |
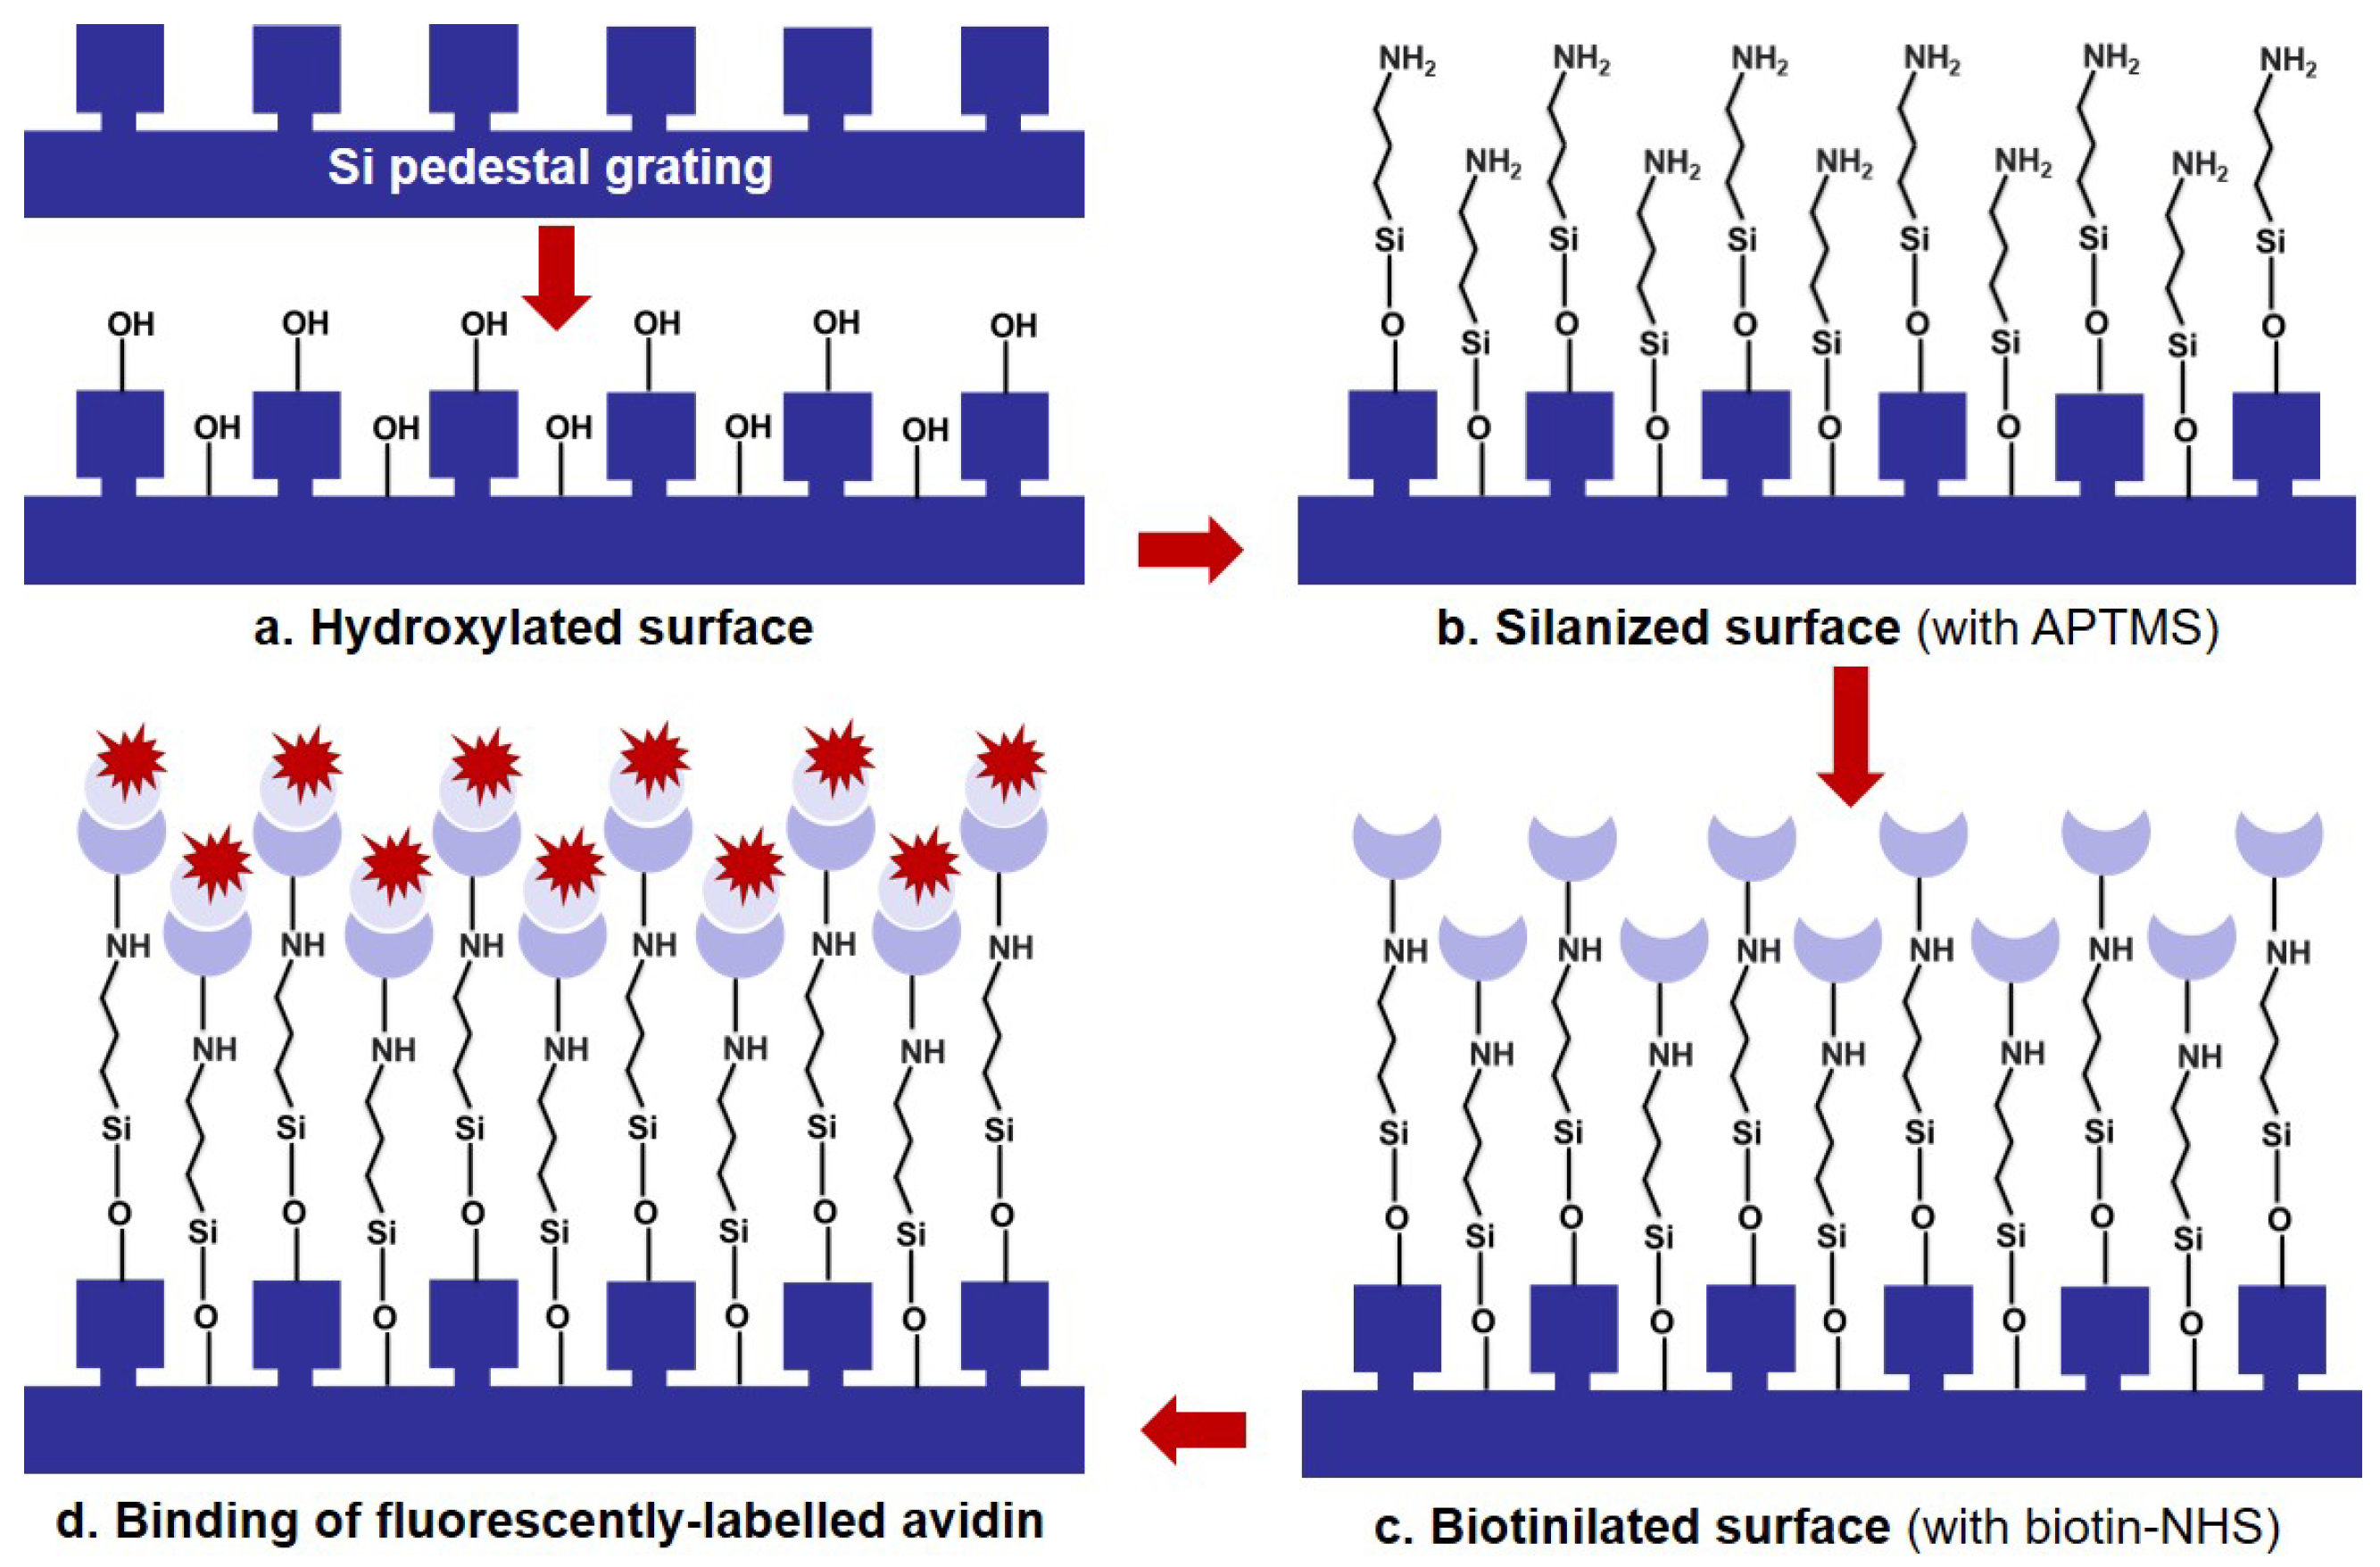
| APTMS | Amino-propyltrimethoxysilane |
| ALD | Atomic layer deposition |
| SOI | Silicon-on-insulator |
| TMA | trimethylaluminum |
| TEMAHf | Tetrakis (ethylmethylamido) hafnium |
| SEM | Scanning electron microscopy |
| XRR | X-ray reflectivity spectroscopy |
| FOM | Figure of merit |
| FWHM | Full width at half maximum |
References
- Homola, J.; Yee, S.S.; Gauglitz, G. Surface plasmon resonance sensors. Sens. Actuators B Chem. 1999, 54, 3–15. [Google Scholar] [CrossRef]
- Svedendahl, M.; Chen, S.; Dmitriev, A.; Käll, M. Refractometric sensing using propagating versus localized surface plasmons: A direct comparison. Nano Lett. 2009, 9, 4428–4433. [Google Scholar] [CrossRef] [PubMed]
- Špačková, B.; Wrobel, P.; Bocková, M.; Homola, J. Optical biosensors based on plasmonic nanostructures: A review. Proc. IEEE 2016, 23, 2380–2408. [Google Scholar] [CrossRef]
- Anker, J.N.; Hall, W.P.; Lyandres, O.; Shah, N.C.; Zhao, J.; Van Duyne, R.P. Biosensing with plasmonic nanosensors. Nat. Mater. 2008, 7, 442–453. [Google Scholar] [CrossRef] [PubMed]
- Shkondin, E.; Repän, T.; Takayama, O.; Lavrinenko, A.V. High aspect ratio titanium nitride trench structures as plasmonic biosensor. Opt. Mater. Express 2017, 7, 4171–4182. [Google Scholar] [CrossRef] [Green Version]
- Valsecchi, C.; Brolo, A.G. Periodic metallic nanostructures as plasmonic chemical sensors. Langmuir 2013, 29, 5638–5649. [Google Scholar] [CrossRef] [PubMed]
- Kabashin, A.V.; Evans, P.; Pastkovsky, S.; Hendren, W.; Wurtz, G.A.; Atkinson, R.; Pollard, R.; Podolskiy, V.A.; Zayats, A.V. Plasmonic nanorod metamaterials for biosensing. Nat. Mater. 2009, 8, 867–871. [Google Scholar] [CrossRef]
- Sreekanth, K.V.; Alapan, Y.; ElKabbash, M.; Efe Ilker, E.; Hinczewski, M.; Gurkan, U.A.; De Luca, A.; Strangi, G. Extreme sensitivity biosensing platform based on hyperbolic metamaterials. Nat. Mater. 2016, 15, 621–627. [Google Scholar] [CrossRef] [Green Version]
- Beliaev, L.Y.; Takayama, O.; Melentiev, P.N.; Lavrinenko, A.V. Photoluminescence control by hyperbolic metamaterials and metasurfaces: A review. Opt-Electron. Adv. 2021, 4, 210031. [Google Scholar] [CrossRef]
- Minopoli, A.; Acunzo, A.; Ventura, B.D.; Velotta, R. Nanostructured surfaces as plasmonic biosensors: A review. Adv. Mater. Interfaces 2021, 9, 2101133. [Google Scholar] [CrossRef]
- Threm, D.; Nazirizadeh, Y.; Gerken, M. Photonic crystal biosensors towards on-chip integration. J. Biophot. 2012, 5, 601–616. [Google Scholar] [CrossRef] [PubMed]
- Baker, J.; Sriram, R.; Miller, B. Two-dimensional photonic crystals for sensitive microscale chemical and biochemical sensing. Lab Chip 2015, 15, 971–990. [Google Scholar] [CrossRef] [PubMed] [Green Version]
- Pitruzzello, G.; Krauss, T. Photonic crystal resonances for sensing and imaging. J. Opt. 2018, 20, 073004. [Google Scholar] [CrossRef]
- Yavas, O.; Svedendahl, M.; Dobosz, P.; Sanz, V.; Quidant, R. On-a-chip biosensing based on all-dielectric nanoresonators. Nano Lett. 2017, 17, 4421–4426. [Google Scholar] [CrossRef] [Green Version]
- Yavas, O.; Svedendahl, M.; Quidant, R. Unravelling the role of electric and magnetic dipoles in biosensing with Si nanoresonators. ACS Nano 2019, 13, 4582–4588. [Google Scholar] [CrossRef] [Green Version]
- García-Guirado, J.; Svedendahl, M.; Puigdollers, J.; Quidant, R. Enhanced chiral sensing with dielectric nanoresonators. Nano Lett. 2020, 20, 585–591. [Google Scholar] [CrossRef]
- Ding, L.; Eschimese, D.; Ang, T.; Morits, D.; Chu, H.S.; Lim, S.T.; Png, C.E.; Gorelik, S.; Paniagua-Dominguez, R.; Kuznetsov, A.I. One-dimensional high-Q silicon nanoparticle chain resonators for refractive index sensing. ACS Appl. Nano Mater. 2022, 5, 3170–3176. [Google Scholar] [CrossRef]
- Romano, S.; Zito, G.; Torino, S.; Calafiore, G.; Penzo, E.; Coppola, G.; Cabrini, S.; Rendina, I.; Mocella, V. Label-free sensing of ultralow-weight molecules with all-dielectric metasurfaces supporting bound states in the continuum. Photon. Res. 2018, 6, 726–733. [Google Scholar] [CrossRef]
- Yesilkoy, F.; Arvelo, E.R.; Jahani, Y.; Liu, M.; Tittl, A.; Cevher, V.; Kivshar, Y.; Altug, H. Ultrasensitive hyperspectral imaging and biodetection enabled by dielectric metasurfaces. Nat. Photon. 2019, 13, 390–396. [Google Scholar] [CrossRef] [Green Version]
- Romano, S.; Mangini, M.; Penzo, E.; Cabrini, S.; Chiara De Luca, A.; Rendina, I.; Mocella, V.; Zito, G. Surface refractive index imaging based on quasi-bound states in the continuum. ACS Nano 2020, 14, 15417–15427. [Google Scholar] [CrossRef]
- Wawro, D.; Priambodo, P.; Magnusson, R.R. Resonating periodic waveguides as ultraresolution sensors in biomedicine. Nanoeng. Fabr. Prop. Opt. Devices 2004, 5515, 52. [Google Scholar]
- Wang, J.; Chen, L.; Kwan, S.; Liu, F.; Deng, X. Resonant grating filters as refractive index sensors for chemical and biological detections. J. Vac. Sci. Technol. B 2005, 23, 3006. [Google Scholar] [CrossRef]
- Magnusson, R.; Ding, Y.; Lee, K.J.; Priambodo, P.S.; Wawro, D.D. Characteristics of resonant leaky-mode biosensors. Nanosens. Mater. Devices II 2005, 6008, 60080U. [Google Scholar]
- Nazirizadeh, Y.; Bog, U.; Sekula, S.; Mappes, T.; Lemmer, U.; Martina Gerken, M. Low-cost label-free biosensors using photonic crystals embedded between crossed polarizers. Opt. Express 2010, 18, 19120–19128. [Google Scholar] [CrossRef] [PubMed]
- Magnusson, R.; Shokooh-Saremi, M.; Lee, K.J. Leaky-mode resonance photonics: An applications platform. Nanoeng. Fabr. Prop. Opt. Devices VIII 2011, 8102, 810202. [Google Scholar]
- Gallegos, D.; Long, K.D.; Yu, H.; Clark, P.P.; Lin, Y.; George, S.; Natha, P.; Cunningham, B.T. Label-free biodetection using a smartphone. Lab Chip 2013, 13, 2124–2132. [Google Scholar] [CrossRef]
- Nazirizadeh, Y.; von Oertzen, F.; Plewa, K.; Barié, N.; Jakobs, P.-J.; Guttmann, M.; Leiste, H.; Gerken, M. Sensitivity optimization of injection-molded photonic crystal slabs for biosensing applications. Opt. Express 2013, 3, 556–565. [Google Scholar] [CrossRef] [Green Version]
- Isaacs, S.; Hajoj, A.; Abutoama, M.; Kozlovsky, A.; Golan, E.; Abdulhalim, I. Resonant grating without a planar waveguide layer as a refractive index sensor. Sensors 2019, 19, 3003. [Google Scholar] [CrossRef] [Green Version]
- Maksimov, D.N.; Gerasimov, V.S.; Romano, S.; Polyutov, S.P. Refractive index sensing with optical bound states in the continuum. Opt. Express 2020, 28, 38907–38916. [Google Scholar] [CrossRef]
- Finco, G.; Ziaee Bideskan, M.; Vertchenko, L.; Beliaev, L.Y.; Malureanu, R.; René Lindvold, L.; Takayama, O.; Andersen, P.D.; Lavrinenko, A.V. Guided-mode resonance on pedestal and half-buried high-contrast gratings for biosensing applications. Nanophotonics 2021, 10, 4289–4296. [Google Scholar] [CrossRef]
- Dziekan, Z.; Pituła, E.; Kwietniewski, N.; Stonio, B.; Monika Janik, M.; Śmiarowski, T.; Koba, M.; Parzuchowski, P.; Niedziółka-Jönsson, J.; Śmietana, M. Performance of nanoimprinted and nanocoated optical label-free biosensor—Nanocoating properties perspective. Opt. Lasers Eng. 2022, 153, 107009. [Google Scholar] [CrossRef]
- Chang-Hasnain, C.J.; Yang, W. High-contrast gratings for integrated optoelectronics. Adv. Opt. Photon. 2012, 4, 379–440. [Google Scholar] [CrossRef] [Green Version]
- Fernanda Pineda, M.; Chan, L.L.-Y.; Kuhlenschmidt, T.; Choi, C.J.; Kuhlenschmidt, M.; Cunningham, B.T. Rapid specific and label-free detection of porcine rotavirus using photonic crystal biosensors. IEEE Sens. 2009, 9, 470–477. [Google Scholar] [CrossRef]
- Shafiee, H.; Lidstone, E.A.; Jahangir, M.; Inci, F.; Hanhauser, E.; Henrich, T.J.; Kuritzkes, D.R.; Cunningham, B.T.; Demirci, U. Nanostructured optical photonic crystal biosensor for HIV viral load measurement. Sci. Rep. 2014, 4, 4116. [Google Scholar] [CrossRef] [Green Version]
- Sun, T.; Kan, S.; Marriott, G.; Chang-Hasnain, C. High-contrast grating resonators forlabel-free detection of disease biomarkers. Sci. Rep. 2016, 6, 27482. [Google Scholar] [CrossRef] [Green Version]
- Yeh, C.-T.; Barshilia, D.; Hsieh, C.-J.; Li, H.-Y.; Hsieh, W.-H.; Chang, G.-E. Rapid and highly sensitive detection of C-reaction protein using robust self-compensated guided-mode resonance biosensing system for point-of-care applications. Biosensors 2021, 11, 523. [Google Scholar] [CrossRef]
- Lin, P.T.; Singh, V.; Hu, J.; Richardson, K.; David Musgraves, J.; Luzinov, I.; Hensley, J.; Kimerlinga, L.C.; Agarwala, A. Chip-scale mid-infrared chemical sensors using air-clad pedestal silicon waveguides. Lab Chip 2013, 13, 2161–2166. [Google Scholar] [CrossRef]
- Bhalla, N.; Sathish, S.; Galvin, C.; Campbell, R.; Sinha, A.; Shen, A. Plasma-assisted large-scale nanoassembly of metal-insulator bioplasmonic mushrooms. ACS Appl. Mater. Interfaces 2018, 10, 219–226. [Google Scholar] [CrossRef]
- Garín, M.; Solà, M.; Julian, A.; Ortega, P. Enabling silicon-on-silicon photonics with pedestalled Mie resonators. Nanoscale 2018, 10, 14406–14413. [Google Scholar]
- Chang, B.; Leussink, P.; Jensen, F.; Hübner, J.; Jansen, H. DREM: Infinite etch selectivity and optimized scallop size distribution with conventional photoresists in an adapted multiplexed Bosch DRIE process. Microelectron. Eng. 2018, 191, 77–83. [Google Scholar] [CrossRef]
- Hussein El Dib, S.E. Nanostructures for Bio-Chemo Sensing. Master’s Thesis, Degree-Granting University, Technical University of Denmark, Kongens Lyngby, Denmark, 2019. [Google Scholar]
- Jakša, G.; Štefane, B.; Kovač, J. XPS and AFM characterization of aminosilanes with different numbers of bonding sites on a silicon wafer. Surf. Interface Anal. 2013, 45, 1709–1713. [Google Scholar] [CrossRef]
- Ahmed, R.; Ozen, M.O.; Karaaslan, M.G.; Prator, C.A.; Thanh, C.; Kumar, S.; Torres, L.; Iyer, N.; Munter, S.; Southern, S.; et al. Tunable fano-resonant metasurfaces on a disposable plastic- template for multimodal and multiplex biosensing. Adv. Mater. 2020, 32, 1907160. [Google Scholar] [CrossRef] [PubMed]
- Taleuzzaman, M. Limit of Blank (LOB), Limit of Detection (LOD), and Limit of Quantification (LOQ). Org. Med. Chem. Int. J. 2018, 7, 001–005. [Google Scholar]
- Shrivastava, A.; Gupta, V.B. Methods for the determination of limit of detection and limit of quantitation of the analytical methods. Chron. Young Sci. 2011, 2, 21–25. [Google Scholar] [CrossRef]
- Lukosz, W. Integrated optical chemical and direct biochemical. Sens. Actuators B Chem. 1995, 29, 37–50. [Google Scholar] [CrossRef]
- Gottschalk, P.G.; Dunn, J.R. The five-parameter logistic: A characterization and comparison with the four-parameter logistic. Anal. Biochem. 2005, 343, 54–65. [Google Scholar] [CrossRef]
- Liu, T.; Liang, L.-L.; Xiao, P.; Sun, L.-P.; Huang, Y.-Y.; Ran, Y.; Jin, L.; Guan, B.-O. A label-free cardiac biomarker immunosensor based on phase-shifted microfiber Bragg grating. Biosens. Bioelectron. 2018, 100, 155–160. [Google Scholar] [CrossRef]


| HCG | Quality | Figure of | Bulk Refractive | Limit of | Limit of |
|---|---|---|---|---|---|
| Sensing | Factor | Merit | Index Sensitivity | Detection | Quantification |
| Platform | (FOM) | (LoD) | (LoQ) | ||
| [RIU] | [nm/RIU] | [ng/mL] | [ng/mL] | ||
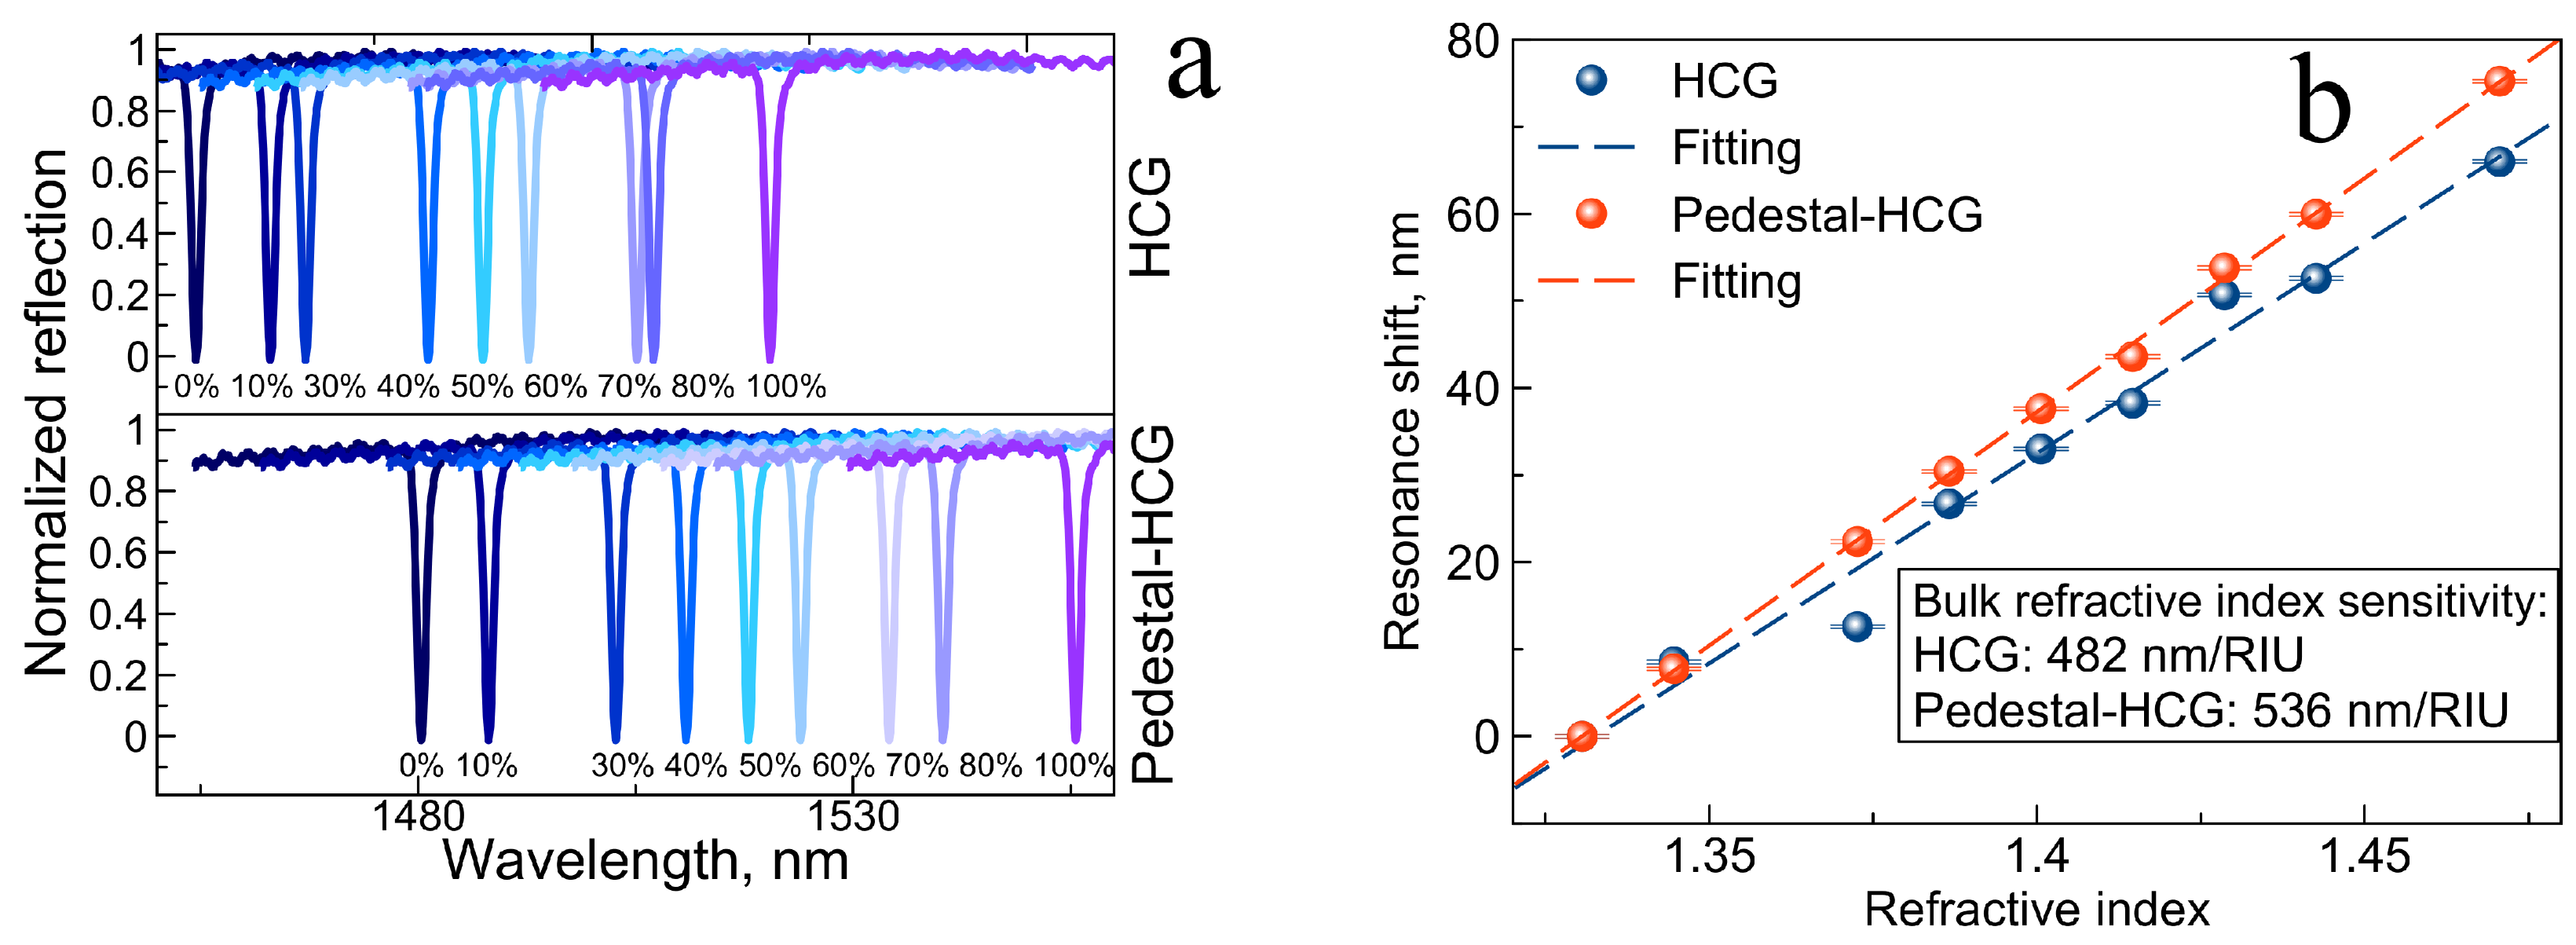
| Conventional | (1.3 ± 0.1) × 10 | 438 ± 2 | 482 ± 2 | 3.2 ± 0.1 | 213 ± 11 |
| Pedestal | (1.5 ± 0.1) × 10 | 564 ± 2 | 536 ± 2 | 2.1 ± 0.1 | 85 ± 13 |
Publisher’s Note: MDPI stays neutral with regard to jurisdictional claims in published maps and institutional affiliations. |
© 2022 by the authors. Licensee MDPI, Basel, Switzerland. This article is an open access article distributed under the terms and conditions of the Creative Commons Attribution (CC BY) license (https://creativecommons.org/licenses/by/4.0/).
Share and Cite
Beliaev, L.Y.; Stounbjerg, P.G.; Finco, G.; Bunea, A.-I.; Malureanu, R.; Lindvold, L.R.; Takayama, O.; Andersen, P.E.; Lavrinenko, A.V. Pedestal High-Contrast Gratings for Biosensing. Nanomaterials 2022, 12, 1748. https://0-doi-org.brum.beds.ac.uk/10.3390/nano12101748
Beliaev LY, Stounbjerg PG, Finco G, Bunea A-I, Malureanu R, Lindvold LR, Takayama O, Andersen PE, Lavrinenko AV. Pedestal High-Contrast Gratings for Biosensing. Nanomaterials. 2022; 12(10):1748. https://0-doi-org.brum.beds.ac.uk/10.3390/nano12101748
Chicago/Turabian StyleBeliaev, Leonid Yu., Peter Groth Stounbjerg, Giovanni Finco, Ada-Ioana Bunea, Radu Malureanu, Lars René Lindvold, Osamu Takayama, Peter E. Andersen, and Andrei V. Lavrinenko. 2022. "Pedestal High-Contrast Gratings for Biosensing" Nanomaterials 12, no. 10: 1748. https://0-doi-org.brum.beds.ac.uk/10.3390/nano12101748