Article

Novel Fluorescent Probe Based on Rare-Earth Doped Upconversion Nanomaterials and Its Applications in Early Cancer Detection

1
Jiangsu Key Laboratory of Advanced Laser Materials and Devices, School of Physics and Electronic Engineering, Jiangsu Normal University, Xuzhou 221116, China
2
Department of Physics, The University of Texas at Arlington, Arlington, TX 76019-0059, USA
3
Medical Technology Research Centre, Chelmsford Campus, Anglia Ruskin University, Chelmsford CM1 1SQ, UK
*
Authors to whom correspondence should be addressed.
Nanomaterials 2022, 12(11), 1787; https://0-doi-org.brum.beds.ac.uk/10.3390/nano12111787
Submission received: 1 April 2022 / Revised: 13 May 2022 / Accepted: 20 May 2022 / Published: 24 May 2022
(This article belongs to the Special Issue Luminescence Nanomaterials and Applications)

Abstract

:
In this paper, a novel rare-earth-doped upconverted nanomaterial NaYF4:Yb,Tm fluorescent probe is reported, which can detect cancer-related specific miRNAs in low abundance. The detection is based on an upconversion of nanomaterials NaYF4:Yb,Tm, with emissions at 345, 362, 450, 477, 646, and 802 nm, upon excitation at 980 nm. The optimal Yb3+:Tm3+ doping ratio is 40:1, in which the NaYF4:Yb,Tm nanomaterials have the strongest fluorescence. The NaYF4:Yb, Tm nanoparticles were coated with carboxylation or carboxylated protein, in order to improve their water solubility and biocompatibility. The two commonly expressed proteins, miRNA-155 and miRNA-150, were detected by the designed fluorescent probe. The results showed that the probes can distinguish miRNA-155 well from partial and complete base mismatch miRNA-155, and can effectively distinguish miRNA-155 and miRNA-150. The preliminary results indicate that these upconverted nanomaterials have good potential for protein detection in disease diagnosis, including early cancer detection.

1. Introduction

MicroRNAs (miRNAs) are important regulators of cell proliferation, division, differentiation, and apoptosis. They can regulate the expression levels of various genes in DNA post-transcriptionally. The abnormal expression of miRNAs has been associated with many diseases (cancer, tumors, and diabetes) [1], and miRNAs can be obtained through blood, urine, etc. [2], which has the advantage of being non-invasive. Therefore, miRNAs are considered important biomarkers for tumors [3]. Patryk Krzeminski [4] et al. demonstrated that DNA methylation contributes to miRNA-155 expression, and the survival data of myeloma cells show a correlation between miR-155 expression and multiple myeloma outcomes. A number of studies have shown that miRNA-155 is closely related to MM, and the overexpression of miRNA 155 in blood is an important signal for the diagnosis of MM [5,6,7]. Therefore, the detection of miRNA-155 to diagnose early MM is an important and efficient method.
The concept of upconversion luminescence was first proposed by Auzel and Ovsyankin et al. [8]. The radiation process is a nonlinear anti-Stokes emission, excited by the effective absorption of two or more low-energy photons. Then, it transitions from the ground state to the excited state through a multi-step process, and finally, it returns to the ground state energy level in radiative transition, realizing the conversion of long-wavelength excitation light into short-wavelength emission light. The excitation wavelength (980 nm) of upconverted nanomaterials is in the “optical transmission window” of biological tissues [9,10,11,12] due to the least light absorbed by biological tissues [13,14,15,16]. This special luminescence process makes upconversion nanomaterials have incomparable advantages over traditional organic dyes, quantum dots, fluorescent proteins, and other biomolecular markers [17,18,19], such as near-infrared light as excitation light, resulting in less photo-damage, lower auto-fluorescence background of biological tissue, and a deep penetration depth [9,10,11,12,13,14,15,16,17,18,19]. In addition, rare-earth-doped upconversion nanoparticles have multi-wavelength emissions, high-fluorescence intensity and high stability, good water solubility, as well as good biocompatibility [20,21,22,23,24,25,26,27,28,29,30,31]. Moreover, rare-earth-doped nanoparticles also have strong scintillation luminescence that can be used for X-ray-induced photodynamic therapy, which is a well-captivated area, as this new therapy can be used for deep as well as skin cancer treatment [20,21,22], radiation dosimetry [23,24] and temperature sensing [25]. These irreplaceable advantages establish upconversion luminescent nanomaterials as a potential fluorescent marker in biological detection [28,29,30,31] and have developed rapidly. For example, Mao et al. [32] prepared NaYF4:Yb,Er upconversion nanoparticles using the hydrothermal method, and discovered their specific detection of miRNA by using the principle of base stacking on the surface. Kowalik et al. [33] linked IgG antibodies to the PEG-NHS-modified NaYF4:Yb,Tm@SiO2 surface to achieve specific labeling to demonstrate the great potential of photodynamic targeted therapy.
The main body of rare-earth-doped upconversion nanoparticle materials is composed of host materials, sensitizers, and activators [34]. The commonly used host materials themselves have no fluorescence but can provide a suitable crystal field for the activated ions, so that the luminescent centers produce specific emissions. Y3+, Gd3+, Lu3+, La3+ are usually selected as host elements [35]. The high-quality host material plays a decisive role in the entire upconversion luminescence efficiency. The spacing between rare-earth ions, the symmetry distribution, and the number of coordination ions would affect the crystal structure of the host material. The most common NaYF4 is currently recognized as the most effective blue-green light upconversion luminescent host material [36,37]. Because the hexagonal NaYF4 has a higher symmetry than the cubic NaYF4, the luminous efficiency of the upconversion in hexagonal NaYF4 is 10-times higher than in the cubic NaYF4 [38]. Nd3+ and Yb3+ ions are the most common sensitizers in the upconversion systems [39,40]. Yb3+ has a large absorption cross-section at 950–1000 nm, which is related to the only excited state and can absorb the excited infrared photons as well as effectively obtain the energy. The energy is then transferred to the activators. Yb3+ is more often chosen as the sensitizer of nanomaterials because its upconversion luminescence efficiency is higher than that of Nd3+. The activators are rare-earth ions, such as Er3+, Tm3+, Ho3+, Nd3+, Pr3+, etc. [41,42,43,44], among which the Yb3+/Er3+ (Tm3+, Ho3+) pairs are recognized as the most efficient [45].
The standard preparation methods of rare-earth-doped upconversion nanoparticles include the co-precipitation method, high-temperature thermal decomposition method, solvothermal method, microemulsion method, sol–gel method, etc. Nanoparticles with tunable morphology, high-fluorescence intensity, and good dispersion have advantages and disadvantages. For example, Gao et al. [46] compared the effects of factors, such as the concentration of reactants, the ratio of reactants and ligand solvents, and the types of ligand solvents on the synthesis of nanoparticles, respectively. Hydrothermal synthesis has been widely used for NaYF4:Yb,Er nanoparticle synthesis. This method has a fast reaction and precipitation rate and crystallinity; however, the fluorescence efficiency of the nanoparticles synthesized is relatively low. Amphiphilic ligands can help the particles to be well dispersed in various polar solvents. However, the surface of the obtained upconversion nanoparticles is usually coated with hydrophobic organic ligands, such as oleic acid, oleylamine, and octadecene, which make them less water soluble and difficult for biological applications. To improve the water solubility and biocompatibility, the surface of upconvertion nanoparticles must be modified with bioactive ligands or biomolecules. Surface ligand exchange, surface ligand oxidation, and surface ligand assembly are common surface modification methods [47,48,49]. Jiang et al. [48] used polymeric anhydride to interact with octadecene and oleic acid ligands on the surface of nanoparticles by coordination adsorption, and then cross linked with dicyclohexanetriamine to obtain stable water-soluble upconverted nanoparticles. The effective modification of upconverted materials has become a key factor in their applications in biological detections.
In this paper, high-temperature thermal decomposition was used to prepare NaYF4:Yb3+/Tm3+ upconverted nanoparticle materials and it was found that the optimal Yb3+/Tm3+ ratio is 40:1, in terms of the luminescence efficiency. These new types of upconverted nanoparticles were modified by surface coating and tested for protein detection for the purpose of early cancer diagnosis.

2. Experimental Materials and Methods

2.1. Reagents and Instruments

Chemicals and Reagents: These chemicals were purchased from Shanghai Aladdin Biochemical Technology Co. Ltd. (Shanghai, China): yttrium chloride hexahydrate (YCl3 6H2O), ytterbium chloride hexahydrate (YbCl3 6H2O), thulium chloride hexahydrate (TmCl3●6H2O) gadolinium chloride hexahydrate (GdCl3 6H2O), oleic acid (OA), 1-octadecene (ODE), ammonium fluoride (NH4F), cyclohexane (C6H12), methanol (MeOH). These Chemicals were purchased from Sinopharm Chemical Reagent Co., Ltd. (Shanghai, China): hydrochloric acid (HCL), succinic acid (C6H10O4), sodium carbonate (Na2CO3), sodium bicarbonate (NaHCO3), acetonitrile (C2H3N), and 1-ethyl-(3-Dimethylaminopropyl) carbonate diimide hydrochloride (EDC).
Anhydrous ethanol (C2H6O) and sodium hydroxide (NaOH) were purchased from Xilong Chemical Co., Ltd. (Guangzhou, Guangdong, China). Bovine serum albumin (BSA), N,N-dimethylformamide (DMF), and N-hydroxysuccinimide (NHS) were purchased from Shanghai Macklin Biochemical Co. Ltd. (Shanghai, China). Nitronium tetrafluoroborate (NOBF4) was purchased from Hebei Bailingwei Superfine Materials Co., Ltd. (Langfang, Hebei, China), PBS buffer and DNA with amino and FAM were purchased from Sangon Biotech Co. Ltd. (Shanghai, China), corresponding base sequence is 5′-NH2-CCCCCCCCCCCCACCCCTATCACGATTAGCATTAA-6-FAM-3′. The ultrapure water was produced by a water purification system (H20BASIC-B, Sartorius, Germany).
Instrumentation: the intelligent digital magnetic stirring electric heating mantle (ZNCL-TS-250 mL, Shanghai Anchun Instrument Co., Ltd., Shanghai, China) was used to prepare upconverted nanomaterials and carboxylated proteins. Fluorescence was measured using a fluorescence spectrometer (F-4600, Hitachi, Hitachi, Ltd., Tokyo, Japan). Phase analysis of upconverted nanomaterials was carried out by X-ray powder diffractometer (X-ray Diffraction, XRD, D8 ADVANCE, Bruker, Germany). The morphology of the upconverted nanomaterials was characterized by field emission scanning electron microscope (Scanning Electron Microscope, SEM, SU8010, Hitachi Co., Ltd., Tokyo, Japan) and scanning transmission electron microscope (Transmission Electron Microscopy, TEM, FEI TECNAI G2 F20, Hitachi Co., Ltd., Tokyo, Japan). A Fourier transform infrared spectrometer measured infrared absorption (Tensor 27, Bruker, Germany). The luminescence was measured with a 980 nm fiber laser (BOT980-5W, Xi’an Leize Electronic Technology Co., Ltd., Xi’an, China).

2.2. Preparation of Upconverted Nanomaterials

Rare-earth-doped upconverted luminescent nanomaterials NaYF4:Yb,Tm were synthesized by high-temperature thermal decomposition. The preparation of 2 mmol NaYF4:20% Yb3+, 0.5% Tm3+ nanomaterials was performed by first charging 1.39 mmol YCl3 6H2O, 0.6 mmol YbCl3 6H2O, and 0.01 mmol TmCl3 6H2O into a three-neck round-bottom flask. Then, oleic acid (12 mL) and octadecene (30 mL) were added, and the flask flowed with nitrogen gas for 10 min to ensure no oxygen in the flask. Next, under nitrogen protection with magnetic stirring, the mixture was heated to 160 °C and reacted for 1 h to obtain a pale-yellow solution. The mixture was cooled to 50 °C and then 10 mL of a methanol solution containing 8.0 mmol of ammonium fluoride and 5.0 mmol of sodium hydroxide was added dropwise to the mixture. The reaction was continuously stirred at 50 °C for 30 min to ensure a complete integration. Then, the temperature was raised to 80 °C to evaporate the methanol. During the evaporation of methanol, the solution continued to bubble, and the mixture was continuously heated to 120 °C for 30 min until no more bubbles were generated in the solution. Finally, the sample was heated to 300 °C for 90 min. After the reaction was over, the solution was naturally cooled to room temperature and cyclohexane was added to disperse the mixture. The mixture was centrifuged at 8000 rpm/min for 5 min to obtain a precipitate, which was then washed with cyclohexane. The above steps were centrifuged and washed three times, and the NaYF4:Yb,Tm upconverted nanomaterial finally obtained was dispersed in cyclohexane and stored. In addition, the experimental steps for the preparation of NaGdF4:Yb,Tm upconverted nanomaterials are the same as above. The YCl3·6H2O in the experimental material was replaced by GdCl3·6H2O, and the experimental steps were repeated to obtain NaGdF4:Yb,Tm upconverted nanomaterials.

2.3. Water-Soluble Upconverted Nanomaterials

Two mL of the cyclohexane solution of the upconverted nanomaterial prepared in the above experiment was prepared and ultrasonically dispersed for 5 min. Twenty mg of NaBF4 was dissolved in two mL of acetonitrile solution and was added to the fully dispersed cyclohexane solution of upconverted nanomaterials by stirring at 1000 rpm/min for 30 min to obtain a mixed solution of water and oil separation. Then, the water-soluble NaYF4:Yb, Tm upconverted nanomaterials were obtained by centrifuging at 8000 rpm/min for 15 min.

2.4. Preparation of Carboxylated Proteins

First, we dissolved 1 g of bovine serum albumin in 20 mL of ultrapure water, then excess oxalic acid was added, and we adjusted the pH to 7–8 with an aqueous sodium carbonate solution under magnetic stirring. Then, 5 mmol of EDC was added and the mixed solution was stirred overnight. A dialysis bag with a molecular-weight cut-off of 10k–30k Da was used for dialysis. The denatured proteins were put into the dialysis bag, clamped on both sides with dialysis clips to prevent leaking, and immersed into a sodium bicarbonate aqueous solution (1000 mL, 2 mmol) leaving it in a refrigerator at 4 °C. The sodium bicarbonate aqueous solution was replaced every 4–6 h to ensure that the protein was always in a slightly alkaline environment. The protein was dialyzed and purified under this condition for at least 72 h, and the carboxylated bovine serum albumin was obtained, which was divided into centrifuge tubes and stored in a −20 °C refrigerator.

2.5. Carboxylated Protein-Modified Upconverted Nanoparticles

Next, 0.5 mL of the prepared carboxylated protein, described above, was dissolved in 2 mL of DMF solution, then water-soluble upconverted nanomaterials were added to the DMF solution and the pH was adjusted to about 8 with aqueous sodium bicarbonate solution by stirring for 2 h. After the reaction was completed, the mixed solution was centrifuged at 10,000 rpm/min for 10 min. The precipitates were washed twice with DMF centrifugation, and finally dispersed with DMF for preservation. The above operations were all carried out at room temperature.

2.6. DNA Probes Linked to Carboxylated Protein-Modified Upconverting Nanoparticles

The pH of 1 mL of the carboxylated protein-modified upconverted nanomaterials obtained in the above steps was adjusted to about 6 with 20 μmol of hydrochloric acid aqueous solution, then 5 mg EDC and 5 mg NHS were added and stirred at room temperature for 25 min to let the carboxyl groups fully react with the nanoparticles. Next, the aminated DNA probe with FAM was added to a 40 μL PBS buffer to make a concentration of 100 μmol. An appropriate amount of the solution was immediately added to the carboxylated upconverted nanomaterial solution, and then put in a shaker to react for 30 min. The reaction was washed twice with PBS buffer at 10,000 rpm/min for 5 min each time, and the resulting precipitates were DNA probes with FAM linking to a carboxylated protein-modified upconverted nanomaterial fluorescent probe (DNA/dBSA /NaYF4:Yb, Tm).

3. Experimental Results and Discussion

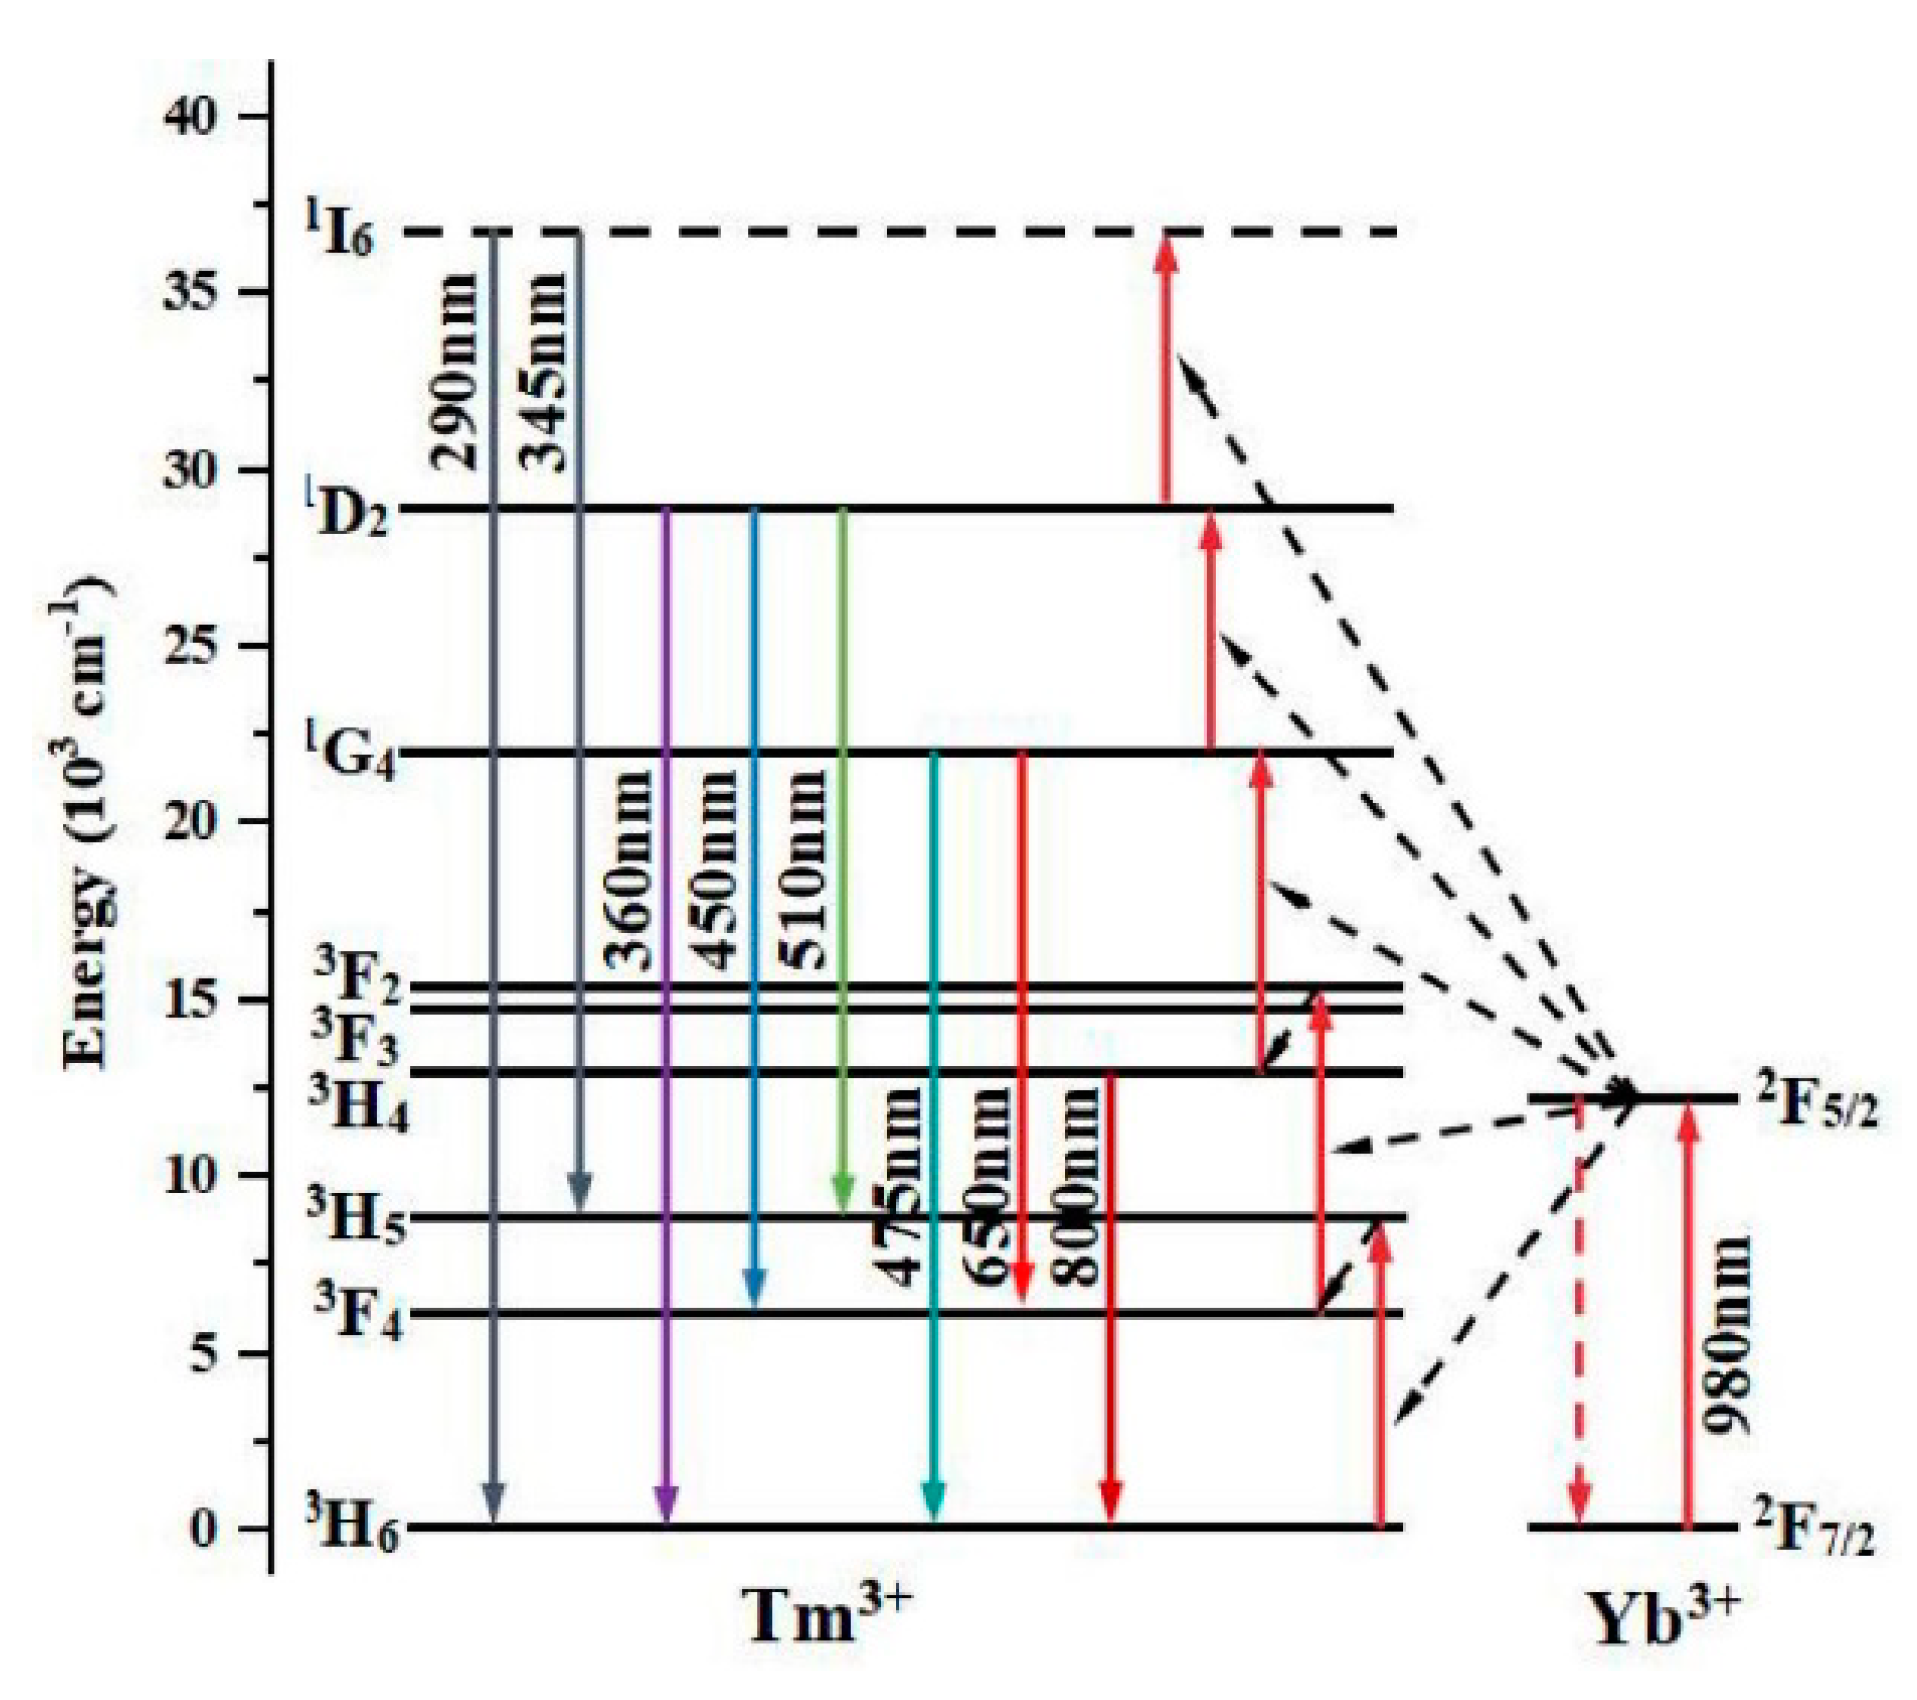
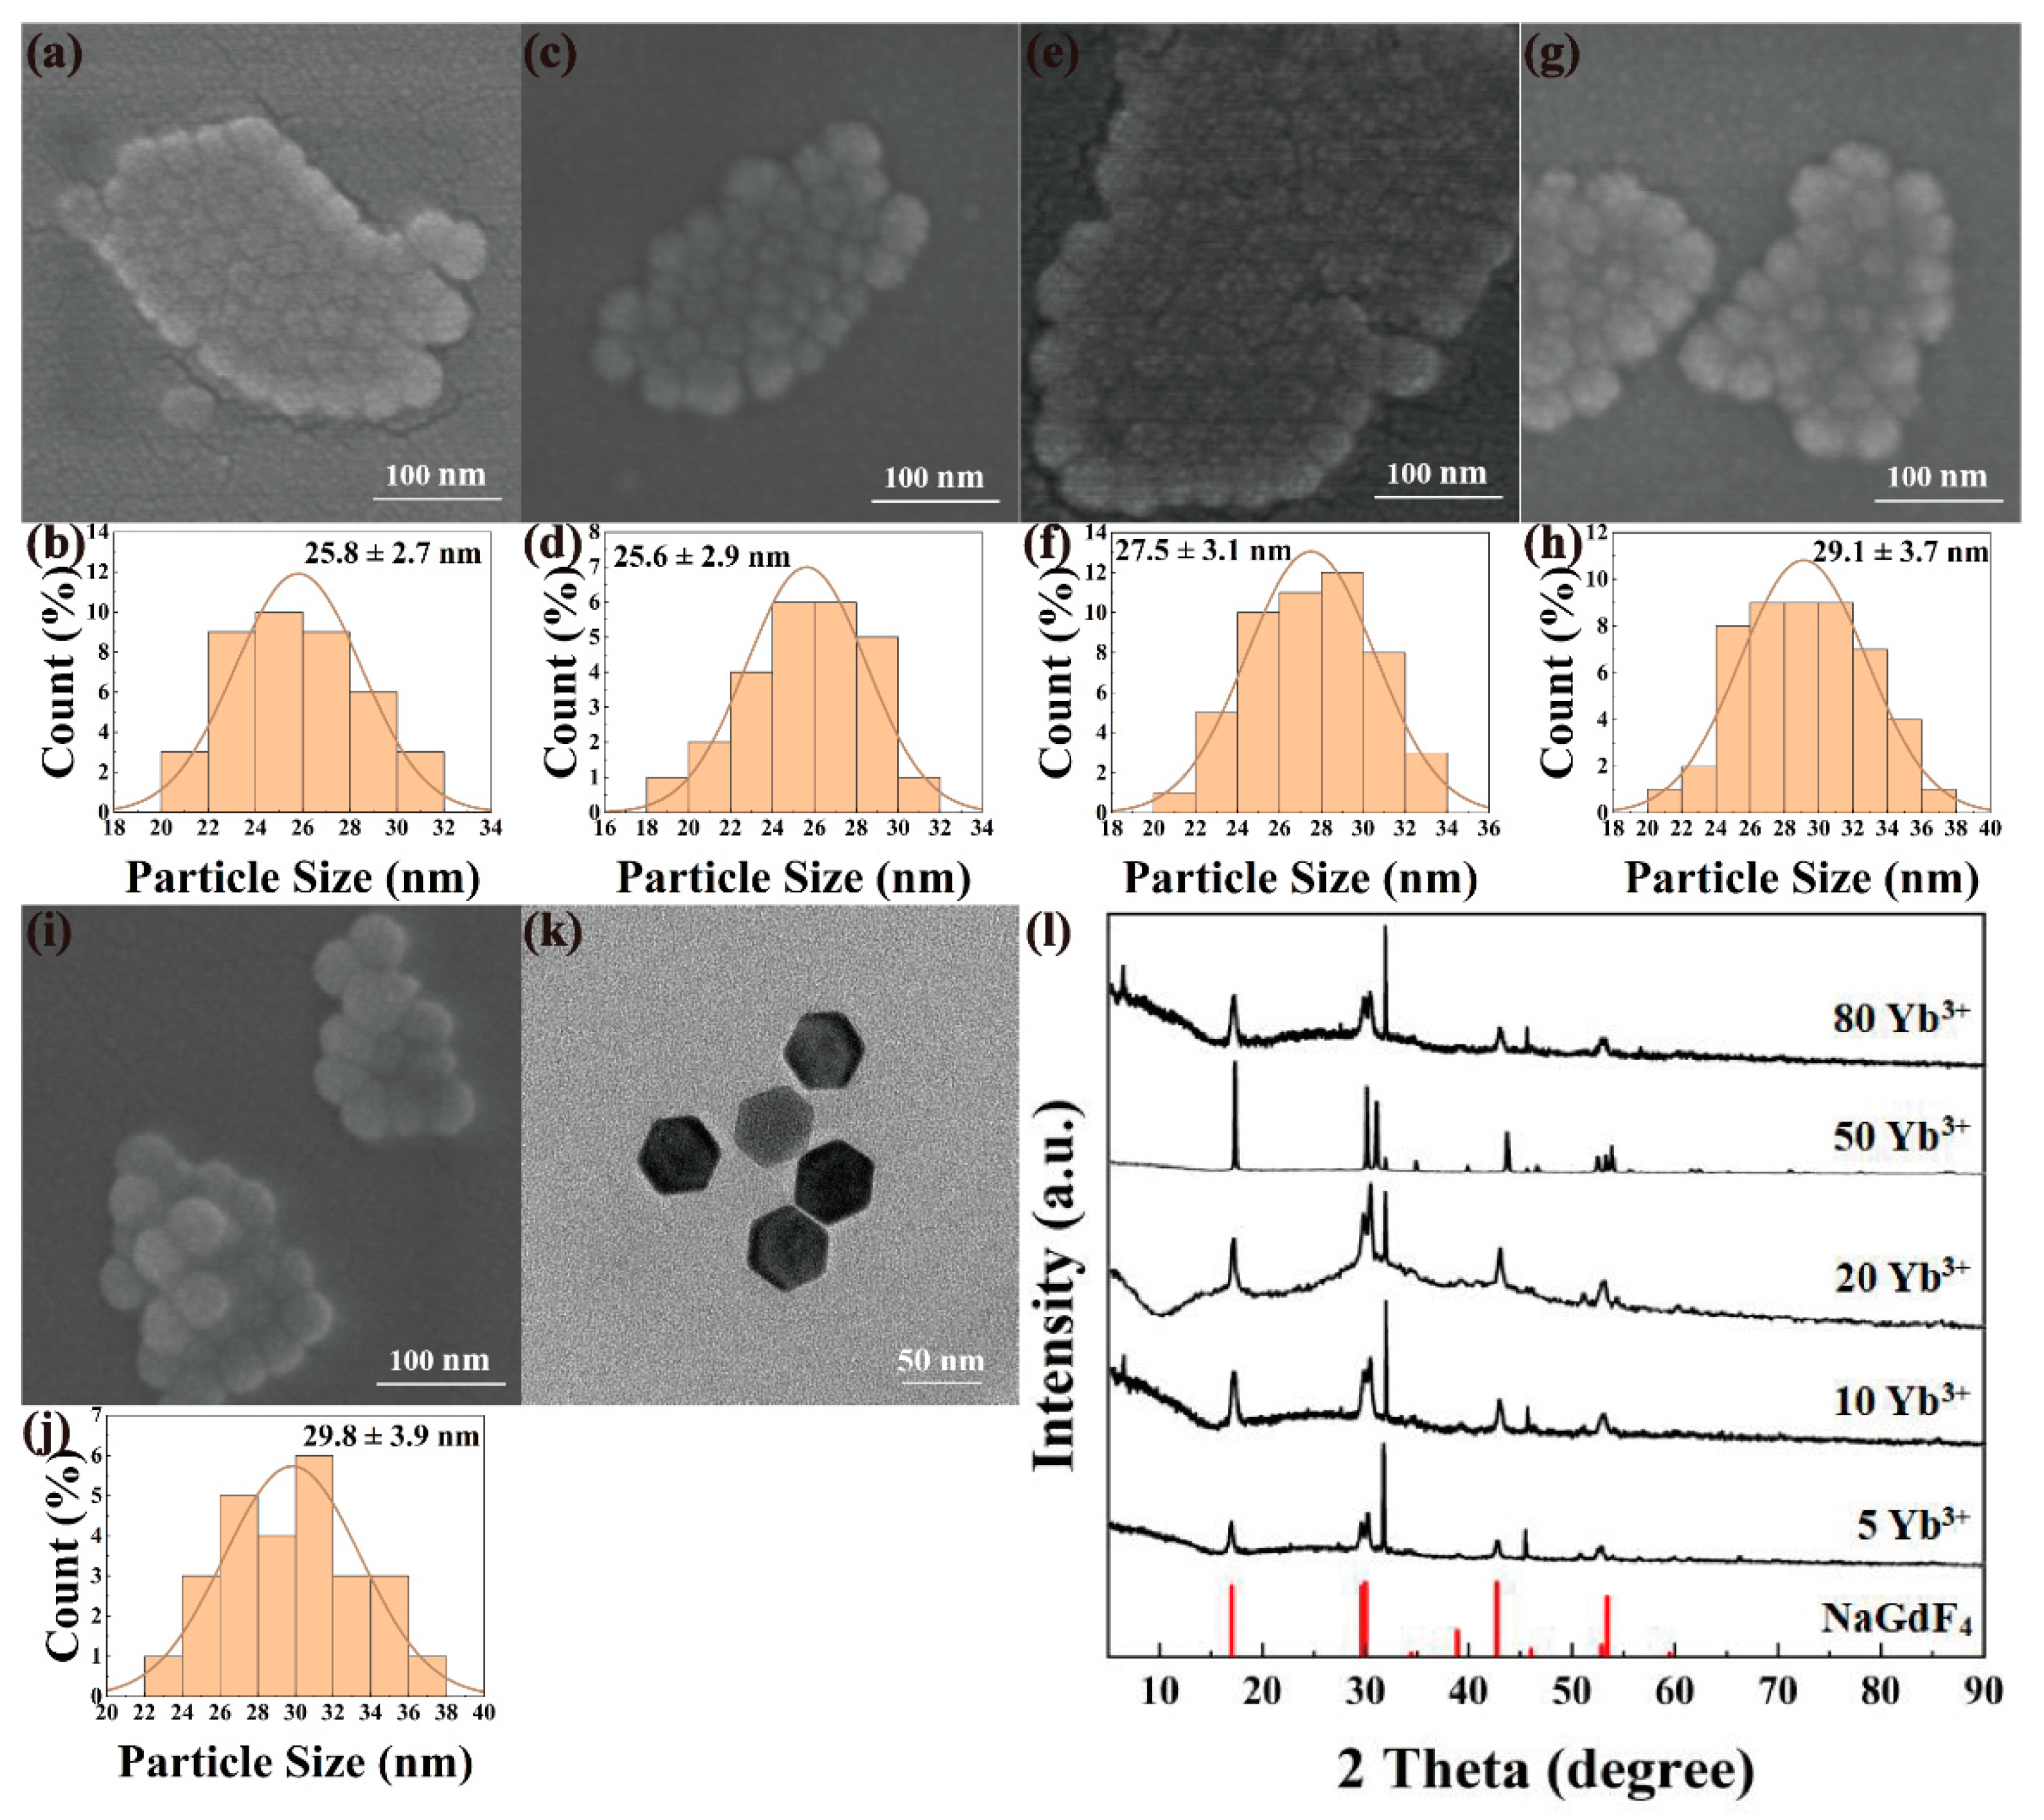
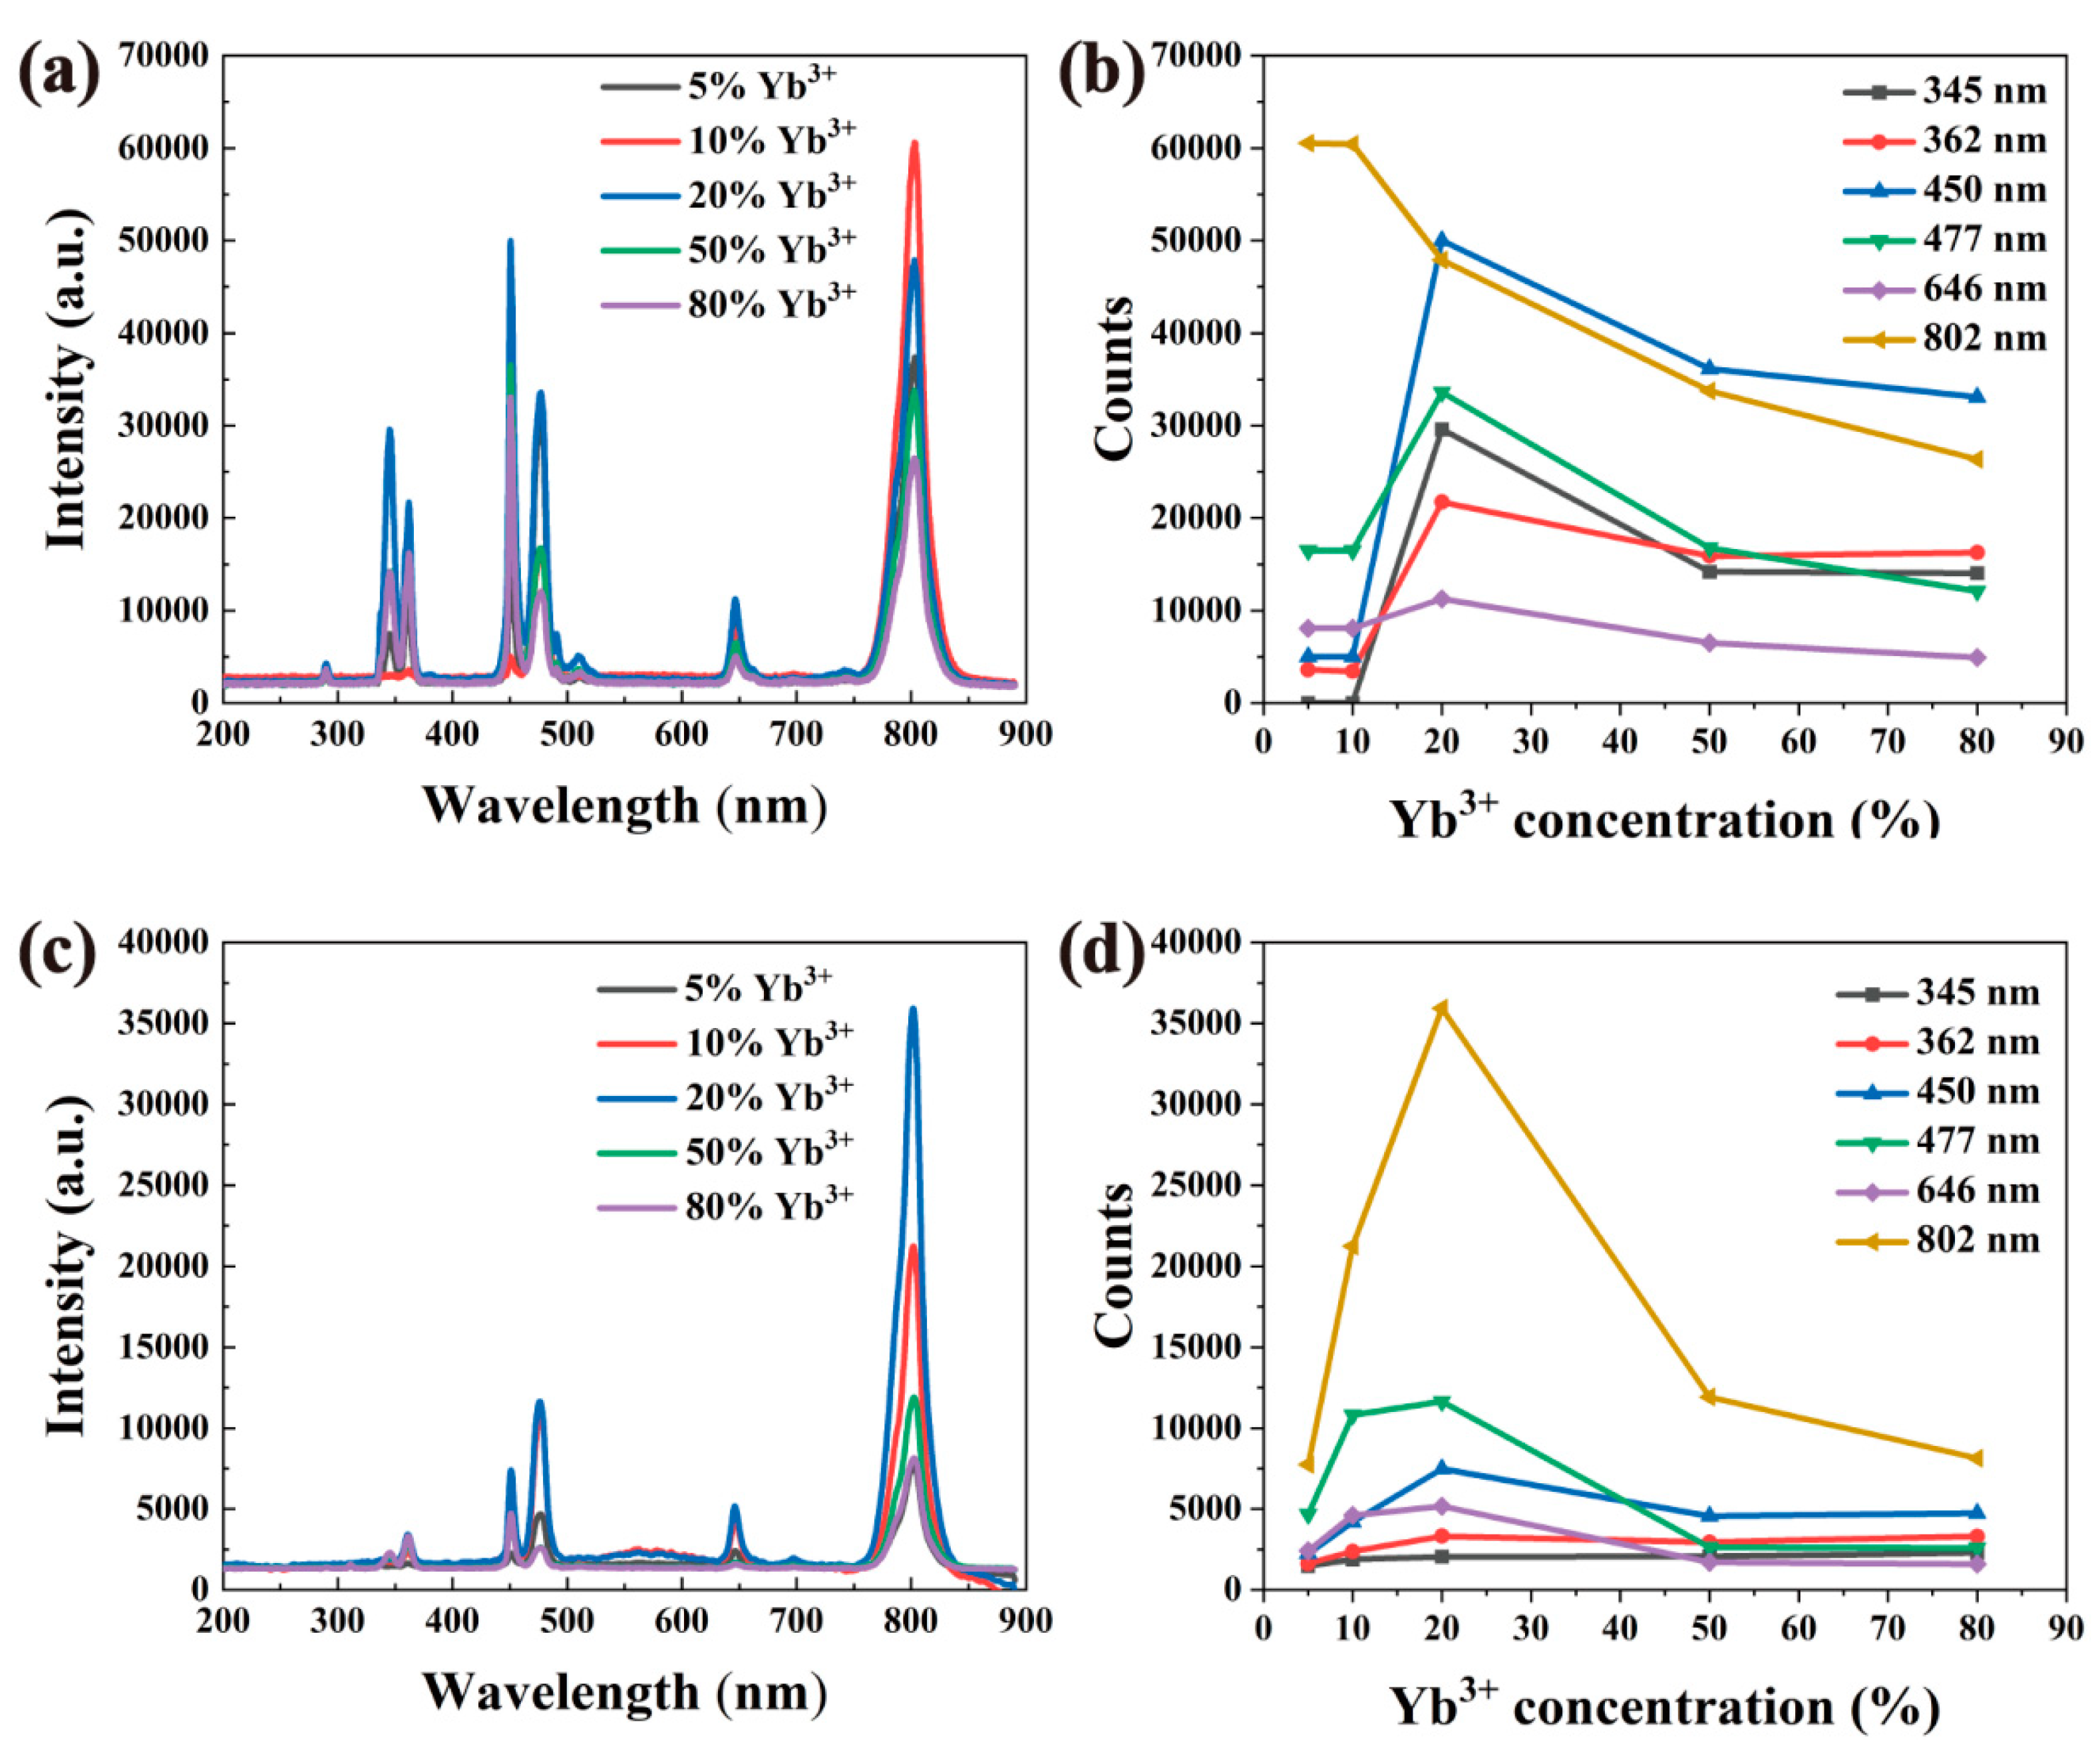
3.1. The Effect of Yb3+ Doping Concentration on the Luminescence of Upconverted Nanomaterials

Figure 1 shows the energy structure and the transitions of Yb3+ and Tm3+ ions in the upconverting luminescence process. It can be seen that upconversion luminescence is a complex multi-photon energy transfer and conversion process. The energy level transition of 2F7/2 → 2F5/2 of the sensitizer Yb3+ ion matches the energy of the near-infrared photon at 980 nm, so it can continuously absorb the excitation energy and then transfer it to the adjacent luminescent center Tm3+. The 3H5, 3F2 (3F3), and 1G4 energy levels are from Tm3+ ions. Among them, there are three methods for upconversion luminescence: (1) the 3H6 energy level absorbs three photons continuously and transitions to the 1G4 energy level; (2) the 3H6 energy first absorbs two photons continuously and then transitions to the 3F2, then, through the cross-relaxation process 3F2,3 + 3H4 → 3H6 + 1D2 to the 1D2; (3) the non-radiation transitions from 1G4, 1D2 of Tm3+ to the lower energy levels 3F2,3,4, 3H4,5,6 to achieve upconversion luminescence. From the emission spectra of NaYF4:Yb,Tm and NaGdF4:Yb,Tm in Figure 3b,d, it can be seen that different host materials NaY(Gd)F4 will not affect the position of the emission peak, but the doping concentration of Yb3+ ions affects the intensity of the emission peak. However, the change is not a simple linear increase or decrease with the increase or decrease in the doping ratio of Yb3+.

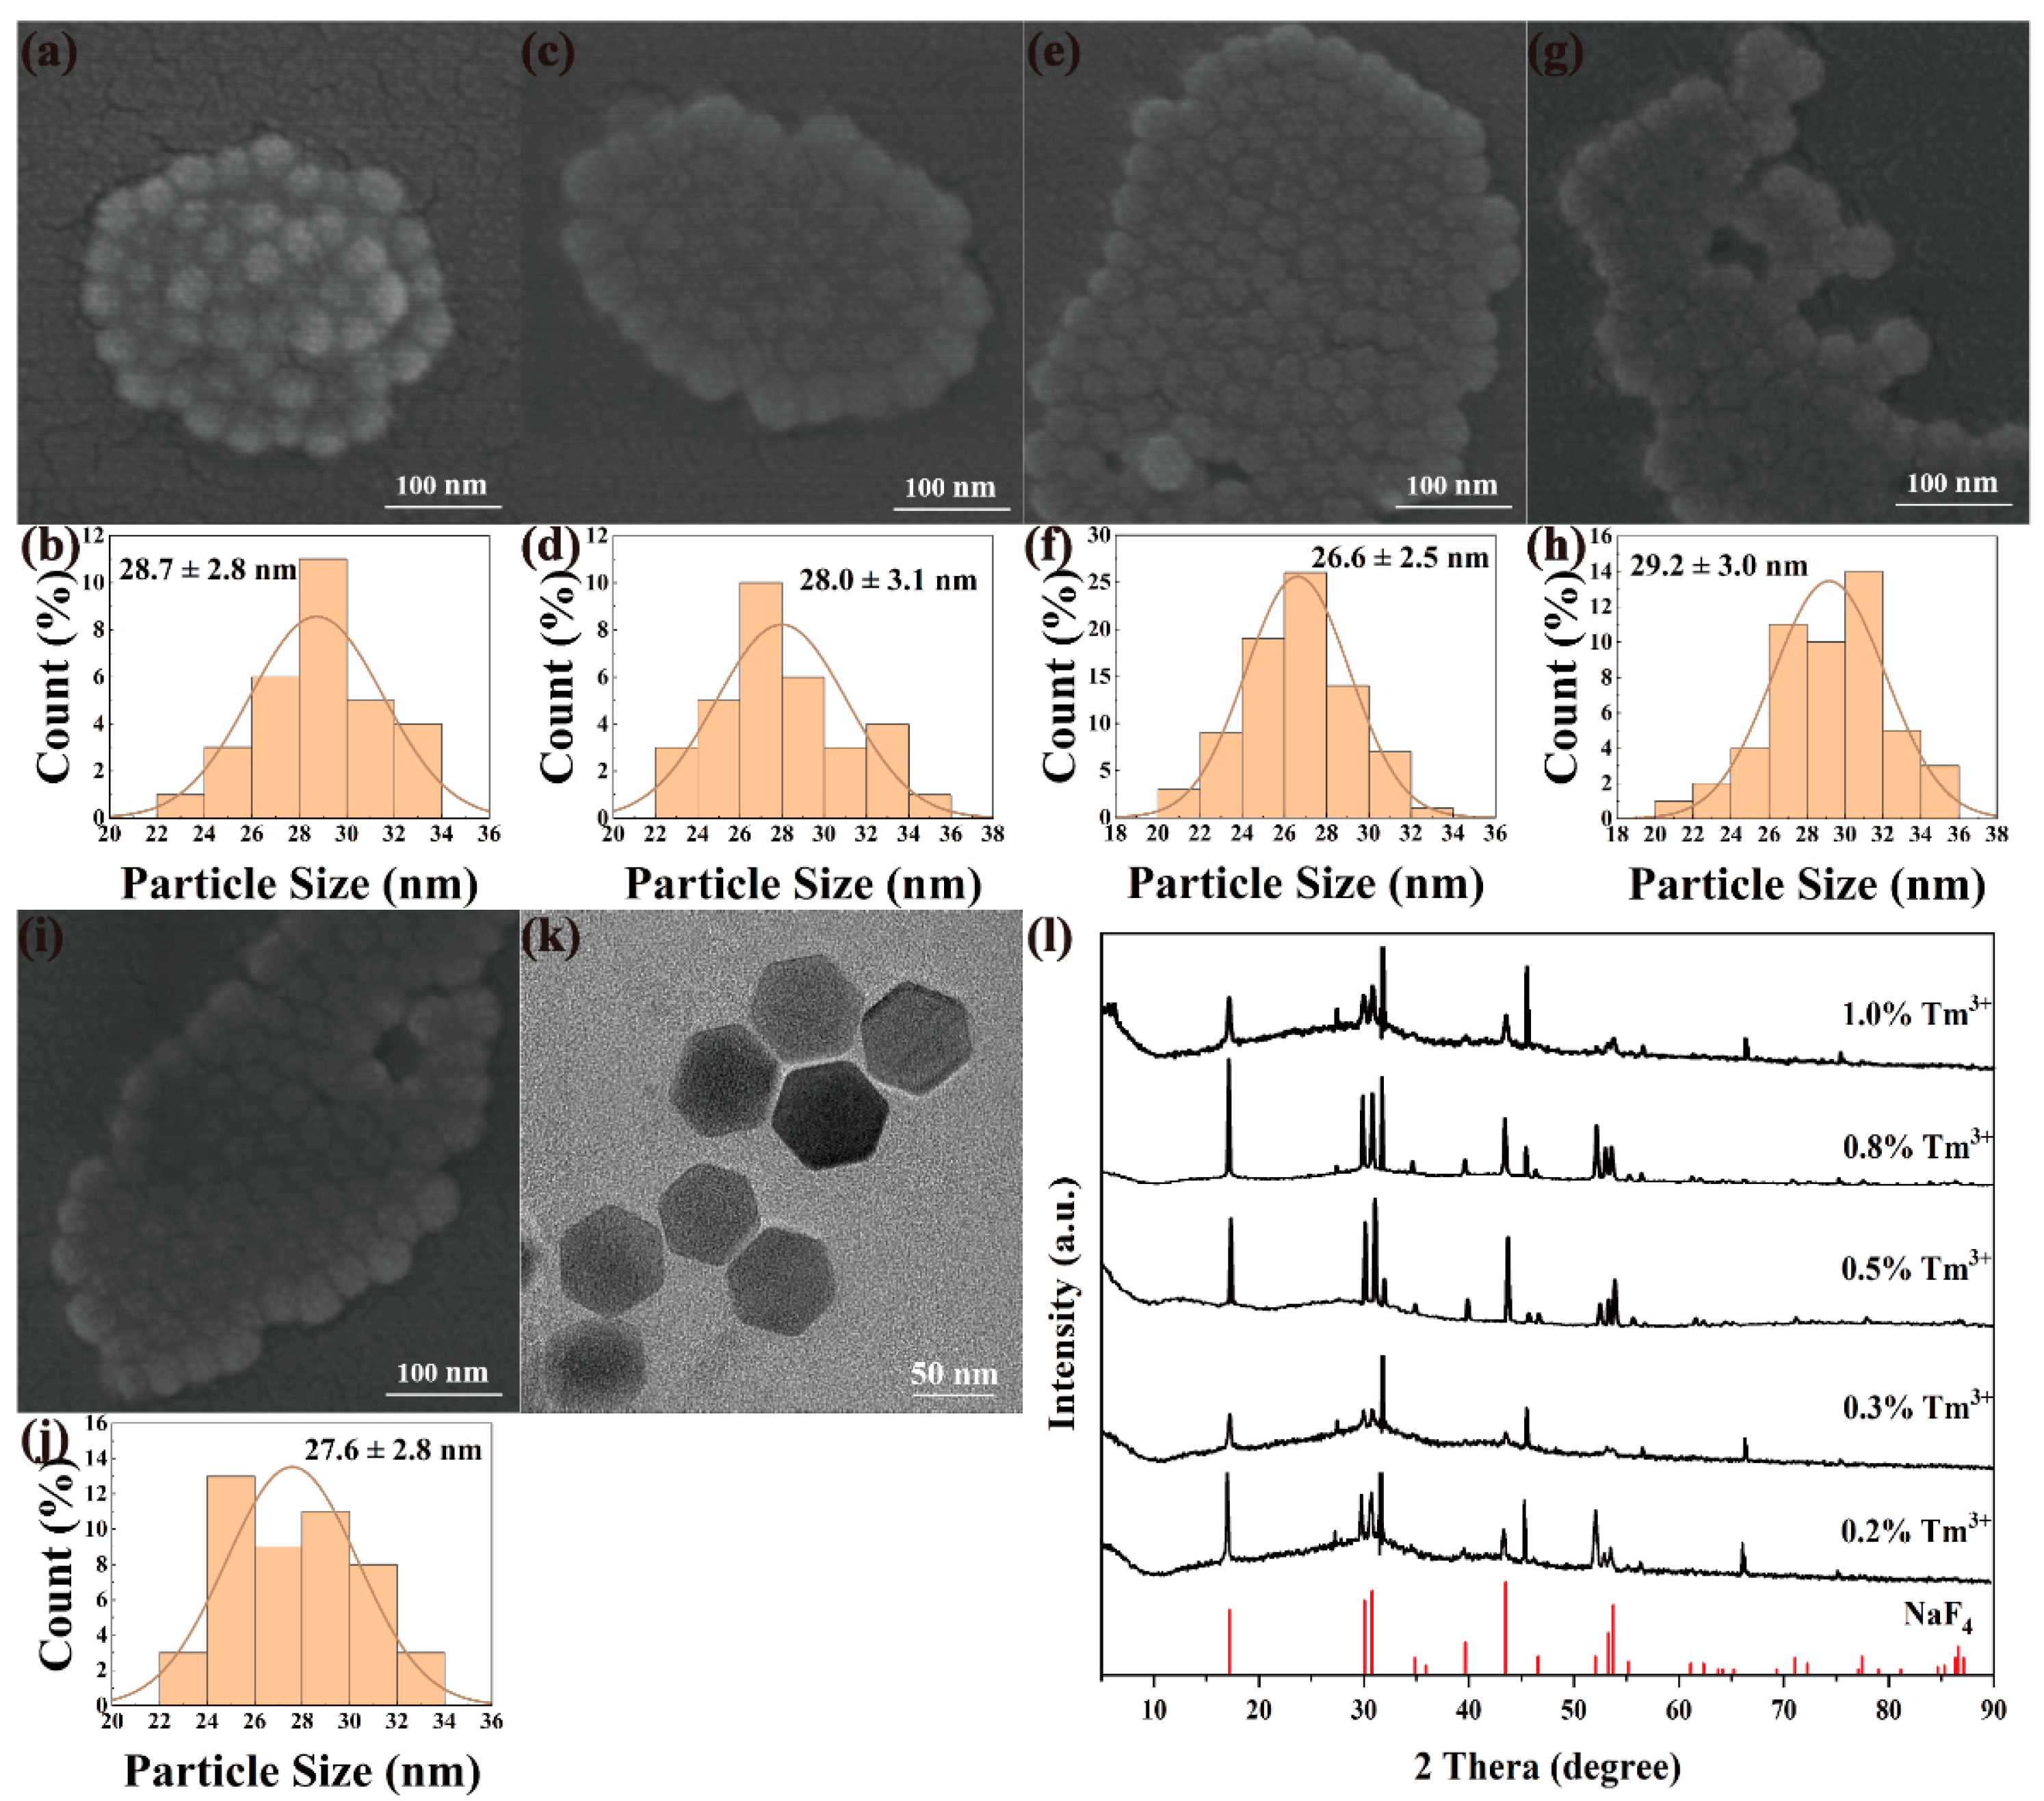
3.2. The Effect of Rare-Earth Ion Doping Concentration on the Luminescence of Upconverted Nanomaterials

3.2.1. Effect of Yb3+ Doping Concentration on Upconverted Nanomaterials

NaYF4:x%Yb3+, 0.5%Tm3+ and NaGdF4:x%Yb3+, 0.5%Tm3+ (x = 5, 10, 20, 50, 80) nanomaterials were synthesized by high-temperature thermal decomposition under the same experimental conditions by varying the doping molar fraction of Yb3+ ions with a fixed Tm3+ ions molar fraction of 0.5%. Figure 2 and Figure 3 show the multi-directional characterization results of the prepared NaYF4:x%Yb3+, 0.5%Tm3+ and NaGdF4:x%Yb3+, 0.5%Tm3+. As shown in Figure 2a–j and Figure 3a–j, all the nanomaterials exhibit the characteristics of high size dispersion and good crystallinity. It can be seen from Figure 2k and Figure 3k that NaYF4: 20%Yb3+, 0.5%Tm3+ and NaGdF4:20%Yb3+, 0.5%Tm3+ are uniform in morphology and size, forming a complete and regular hexagonal phase. Obviously, the doping concentration of Yb3+ ions does not have much effect on the morphology of the upconverted nanomaterials. The nanomaterials with different Yb3+ doping ratios can be synthesized with particle sizes between 25–38 nm, which lays a good foundation for the subsequent preparation of upconversion fluorescent probes. NaYF4:x%Yb3+, 0.5%Tm3+(x = 5, 10, 20, 50, 80) and NaGdF4:x%Yb3+, 0.5%Tm3+ (x = 5, 10, 20, 50, 80) were subjected to phase analysis, as shown in Figure 2l and Figure 3l, the XRD patterns were compared with standard card No.16-0994 (NaF4), and the diffraction peaks obtained all corresponded to the standard card one by one, indicating that the samples obtained under this condition were all pure hexagonal NaYF4:Yb, Tm and NaGbF4:Yb, Tm.
Figure 2. SEM, particle size analysis, TEM and XRD images of NaYF4: x%Yb3+, 0.5%Tm3+. SEM: (a) x = 5, (c) x = 10, (e) x = 20, (g) x = 50, (i) x = 80; particle size analysis: (b) x = 5, (d) x = 10, (f) x = 20, (h) x = 50, (j) x = 80; (k) TEM image of NaYF4: 20%Yb3+, 0.5%Tm3+; (l) XRD of NaYF4:x%Yb3+,0.5%Tm3+ (x = 5, 10, 20, 50, 80).
Nanomaterials 12 01787 g002
Figure 3. SEM, particle size analysis, TEM and XRD images of NaGdF4: x%Yb3+, 0.5%Tm3+. SEM: (a) x = 5, (c) x = 10, (e) x = 20, (g) x = 50, (i) x = 80; particle size analysis: (b) x = 5, (d) x = 10, (f) x = 20, (h) x = 50, (j) x = 80; (k) TEM image of NaGdF4: 20%Yb3+, 0.5%Tm3+; (l) XRD of NaGdF4:x%Yb3+, 0.5%Tm3+ (x = 5, 10, 20, 50, 80).
Nanomaterials 12 01787 g003
Figure 4 shows the fluorescence spectra of nanomaterials with different concentrations of Yb3+ doping. It can be seen from Figure 4a,c that the emission peak position is not affected by the host material NaY(Gd)F4 or the doping concentration of Yb3+ ions. The intensity of the emission peak changes as the doping ratio of Yb3+ changes, but the change is not a simple linear increase or decrease with the increase or decrease in the doping ratio of Yb3+.
As shown in Figure 4, the luminescence intensity at 450, 477 and 646 nm increased gradually with the increase in Yb3+ concentration up to 20%, then the emission intensity is decreased with the increase in Yb3+ concentration (Figure 4b,d).
Upon Yb3+ doping, with the change in doping concentration, the number of photons absorbed at 980 nm increases, and the energy transferred to Tm3+ ions increases, so that its luminescence is enhanced. When the concentration of Yb3+ continues to increase, the photon energy absorbed by the Yb3+ ions will pass through the “bridge” between Yb3+ − Yb3+ and surface defects. Through energy resonance transfer, the energy will be transferred to the surface defects and organic vibration groups, through the free radiation process. According to the experimental results, when the optimal Yb3+ doping mole fraction is 20%, the luminescence reaches its peak.

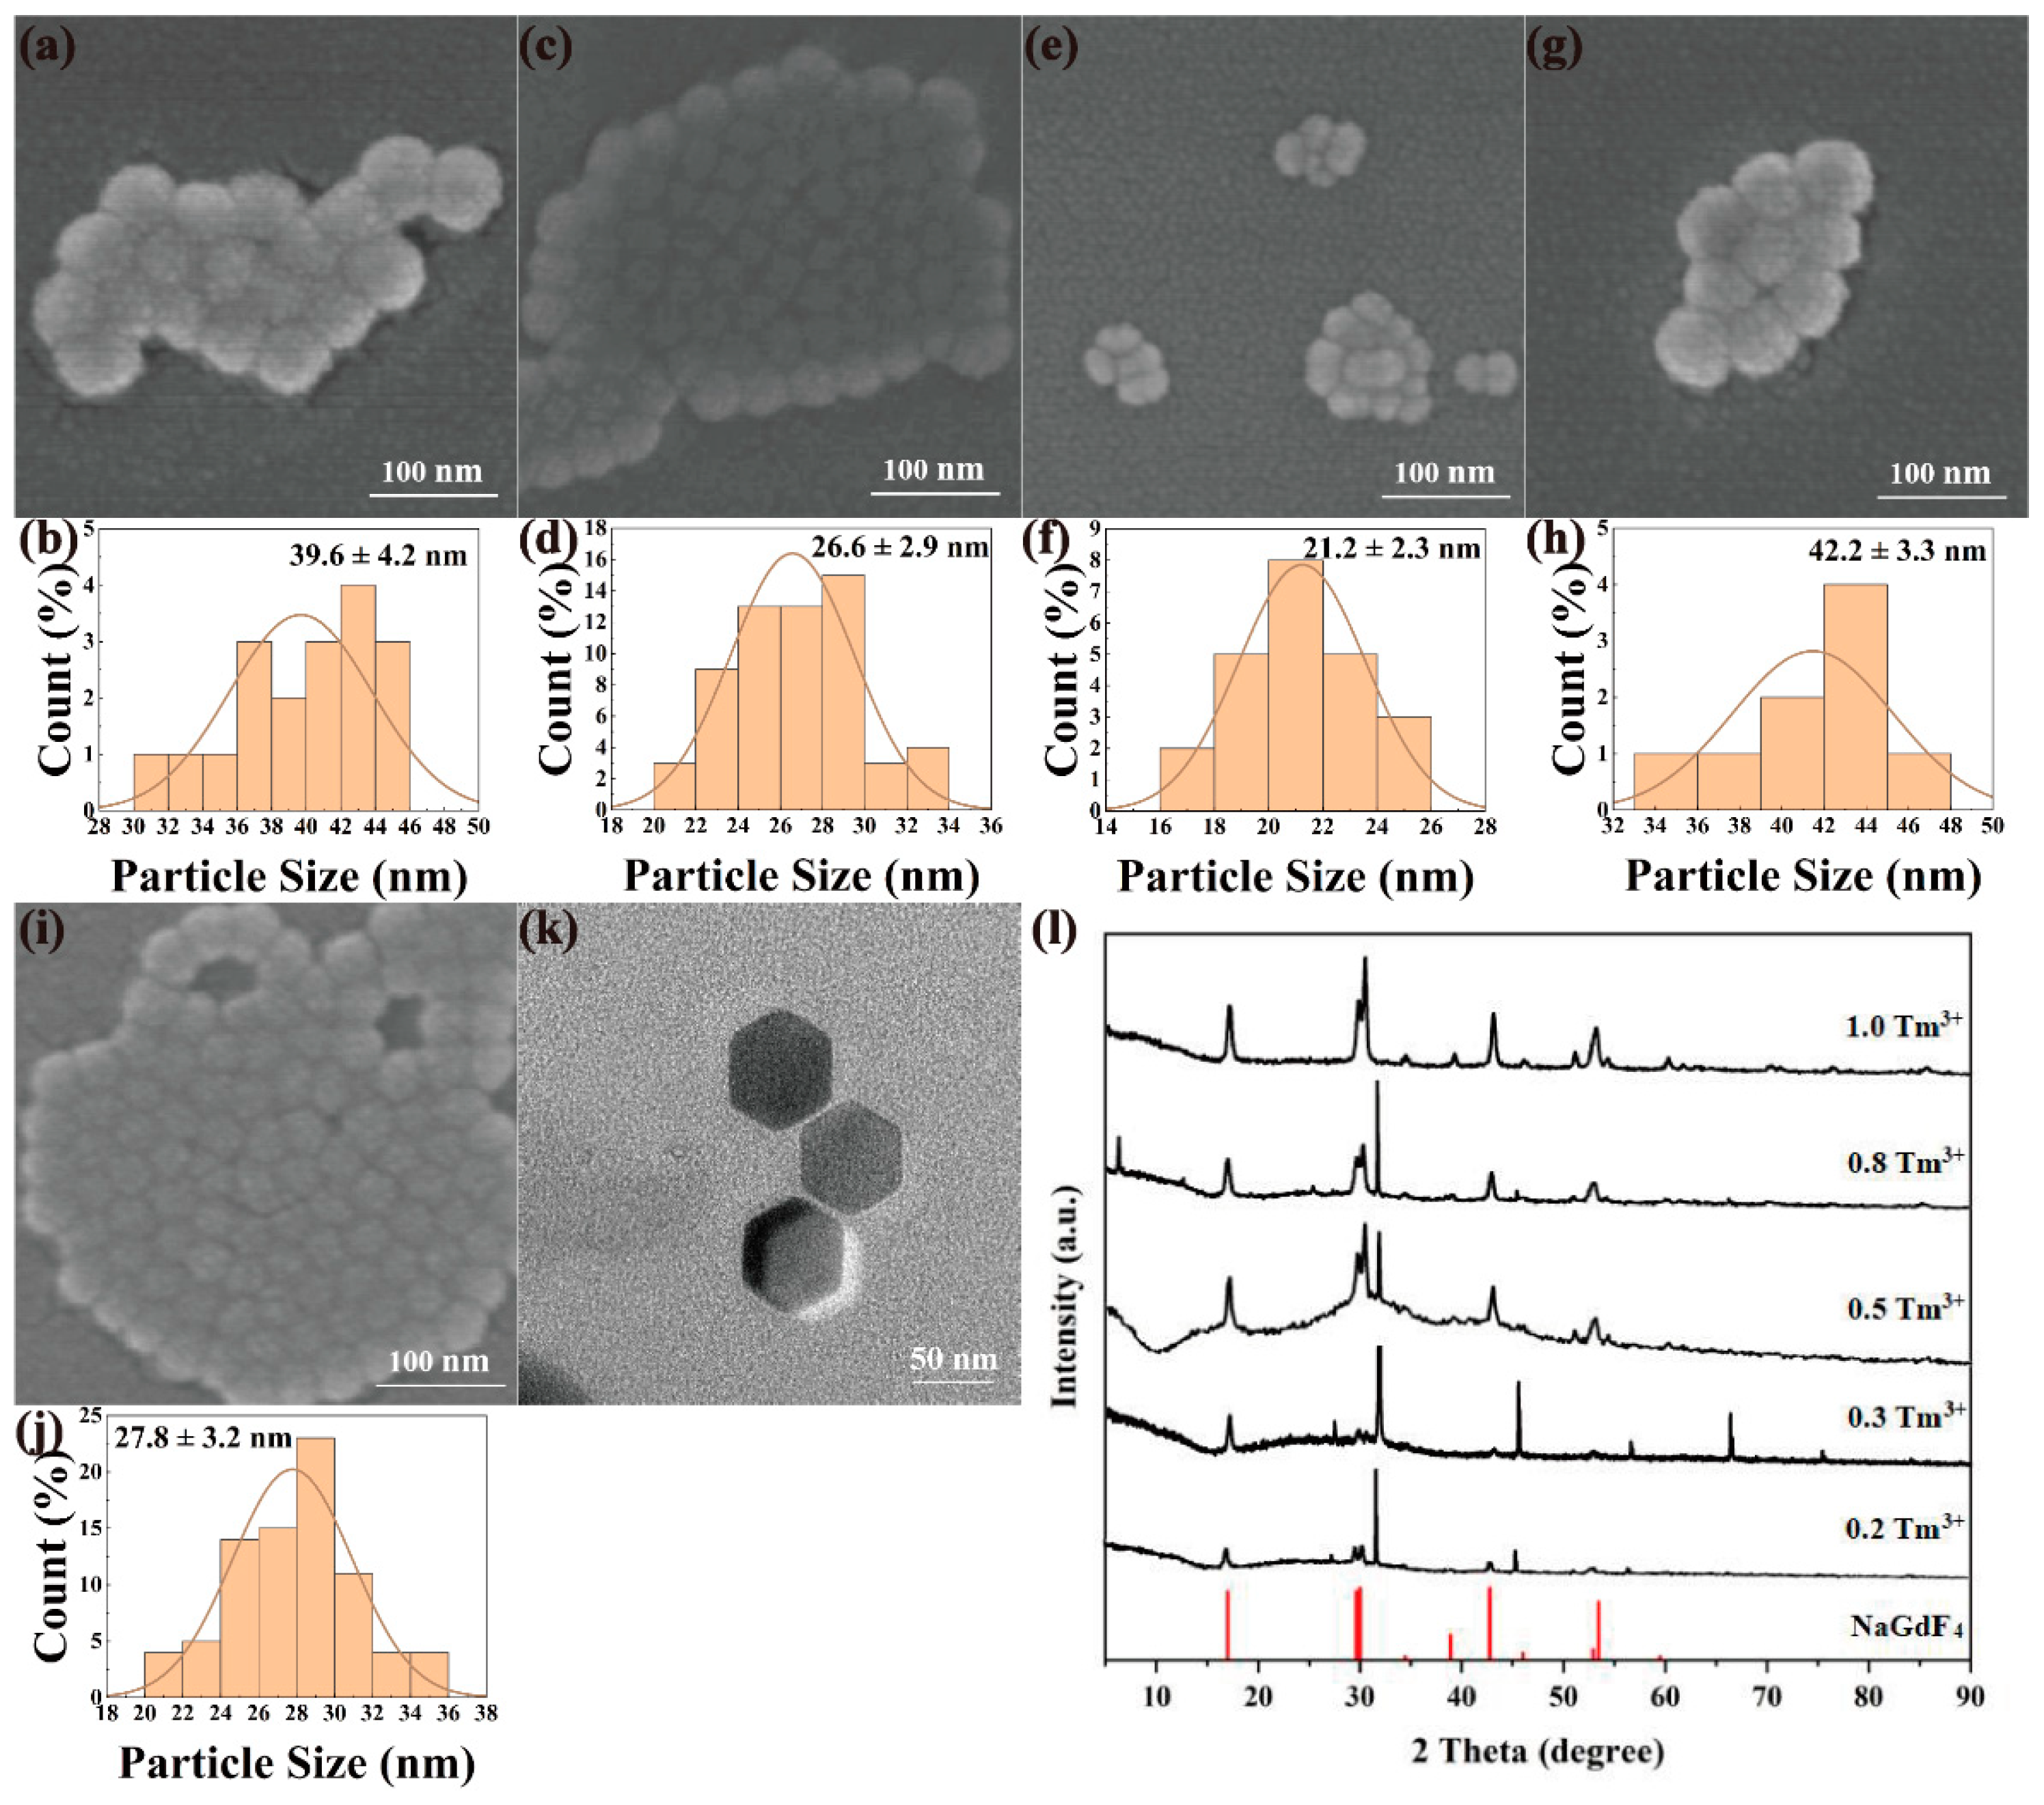
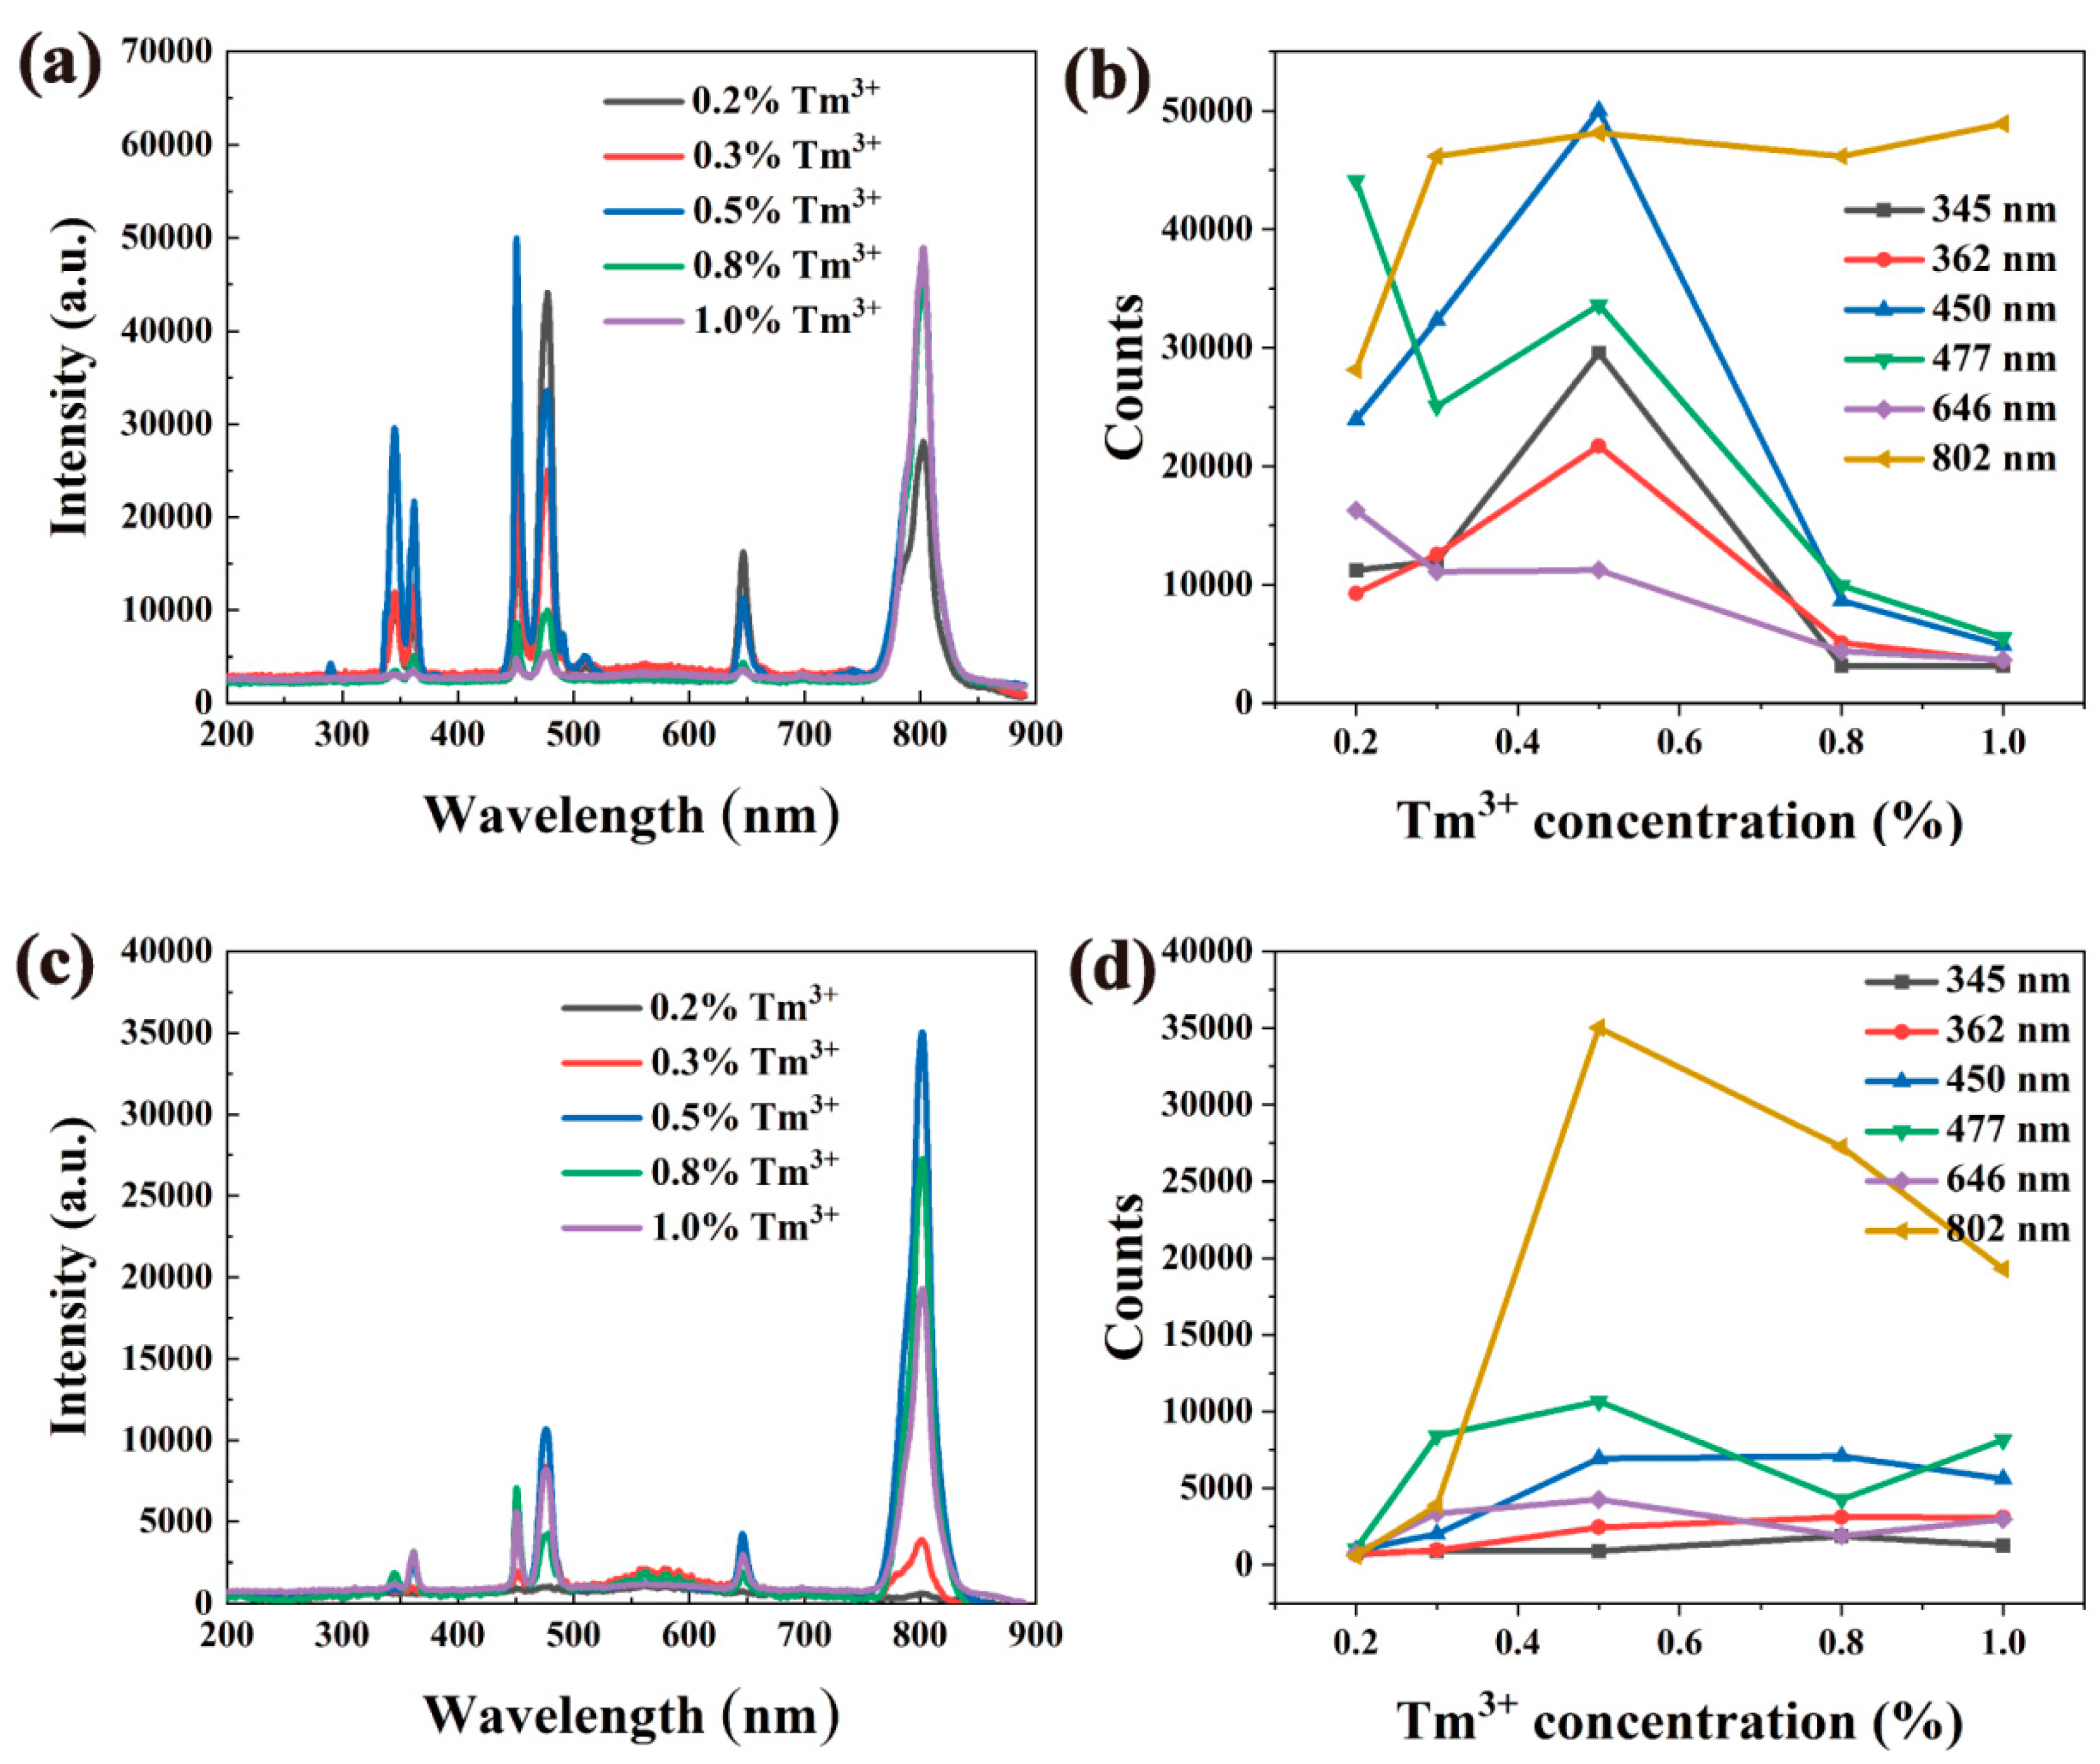
3.2.2. The Effect of Tm3+ Doping Concentration on Upconverted Nanomaterials

NaYF4:20%Yb3+, x%Tm3+ and NaGdF4:20%Yb3+, x%Tm3+ were synthesized by the same method and conditions by varying the concentration of Tm3+ (x = 0.2, 0.3, 0.5, 0.8, 1.0) while the concentration of Tb3+ was fixed at 20%. Figure 5 and Figure 6 show the multi-directional characterization results of the prepared NaYF4:20%Yb3+, x%Tm3+ and NaGdF4:20%Yb3+, x%Tm3+. As can be seen in Figure 5a–j and Figure 6a–j, all the nanomaterials have high dispersibility in size distribution and good crystallinity. It can be seen from Figure 5k and Figure 6k that the upconverted nanomaterials have uniform morphology and size, forming a regular hexagonal phase. Similarly, by changing the doping concentration of Tm3+, the morphology of the upconverted nanomaterials does not change too much. The particle sizes of nanomaterials with different Tm3+ doping ratios can be between 21–43 nm. The XRD pattern of NaGdF4: x%Yb3+, 0.5%Tm3+ (x = 0.2, 0.3, 0.5, 0.8, 1) and NaGdF4: 20%Yb3+, x%Tm3+ (x = 0.2, 0.3, 0.5, 0.8, 1) nanomaterials was also compared with the standard card No.27-0699 (NaGdF4), NaGdF4: Yb, Tm is a pure hexagonal phase. As shown in Figure 5l and Figure 6l, the diffraction peaks obtained all corresponded to the standard card, which means that the samples obtained under this condition were all pure hexagonal NaYF4:Yb, Tm and NaGbF4:Yb, Tm.
The luminescence spectra of materials with different Tm3+ concentrations are shown in Figure 7. As the mole fraction of Tm3+ increases from 0.2% to 0.5%, the luminescence peaks at 450, 475, and 646 nm also change. As the mole fraction of Tm3+ increases from 0.5% to 1%, the emission intensities of these three luminescence peaks gradually decrease. When the mole fraction of Tm3+ is 0.2%, the luminescence intensity of the nanomaterial is not strong because there are not enough excitable Tm3+ ions in the nanomaterials. As the concentration of Tm3+ increases gradually, the number of excitable Tm3+ ions increases accordingly, and the luminescence of nanomaterials becomes stronger accordingly. When the mole fraction of Tm3+ reaches 0.5%, the upconversion luminescence intensity reaches the maximum, and then gradually becomes weaker. This is because the increase in Tm3+ ion concentration reduces the interionic distance and strengthens the interaction. Finally, the concentration quenching effect and cross-relaxation effect are observed, resulting in a decrease in luminescence intensity. At the same time, when the sample is excited with the same power of the 980 nm laser, since the total energy is fixed, the energy that each Tm3+ can receive will decrease with the increase in Tm3+, leading to the weakening of the luminescence.

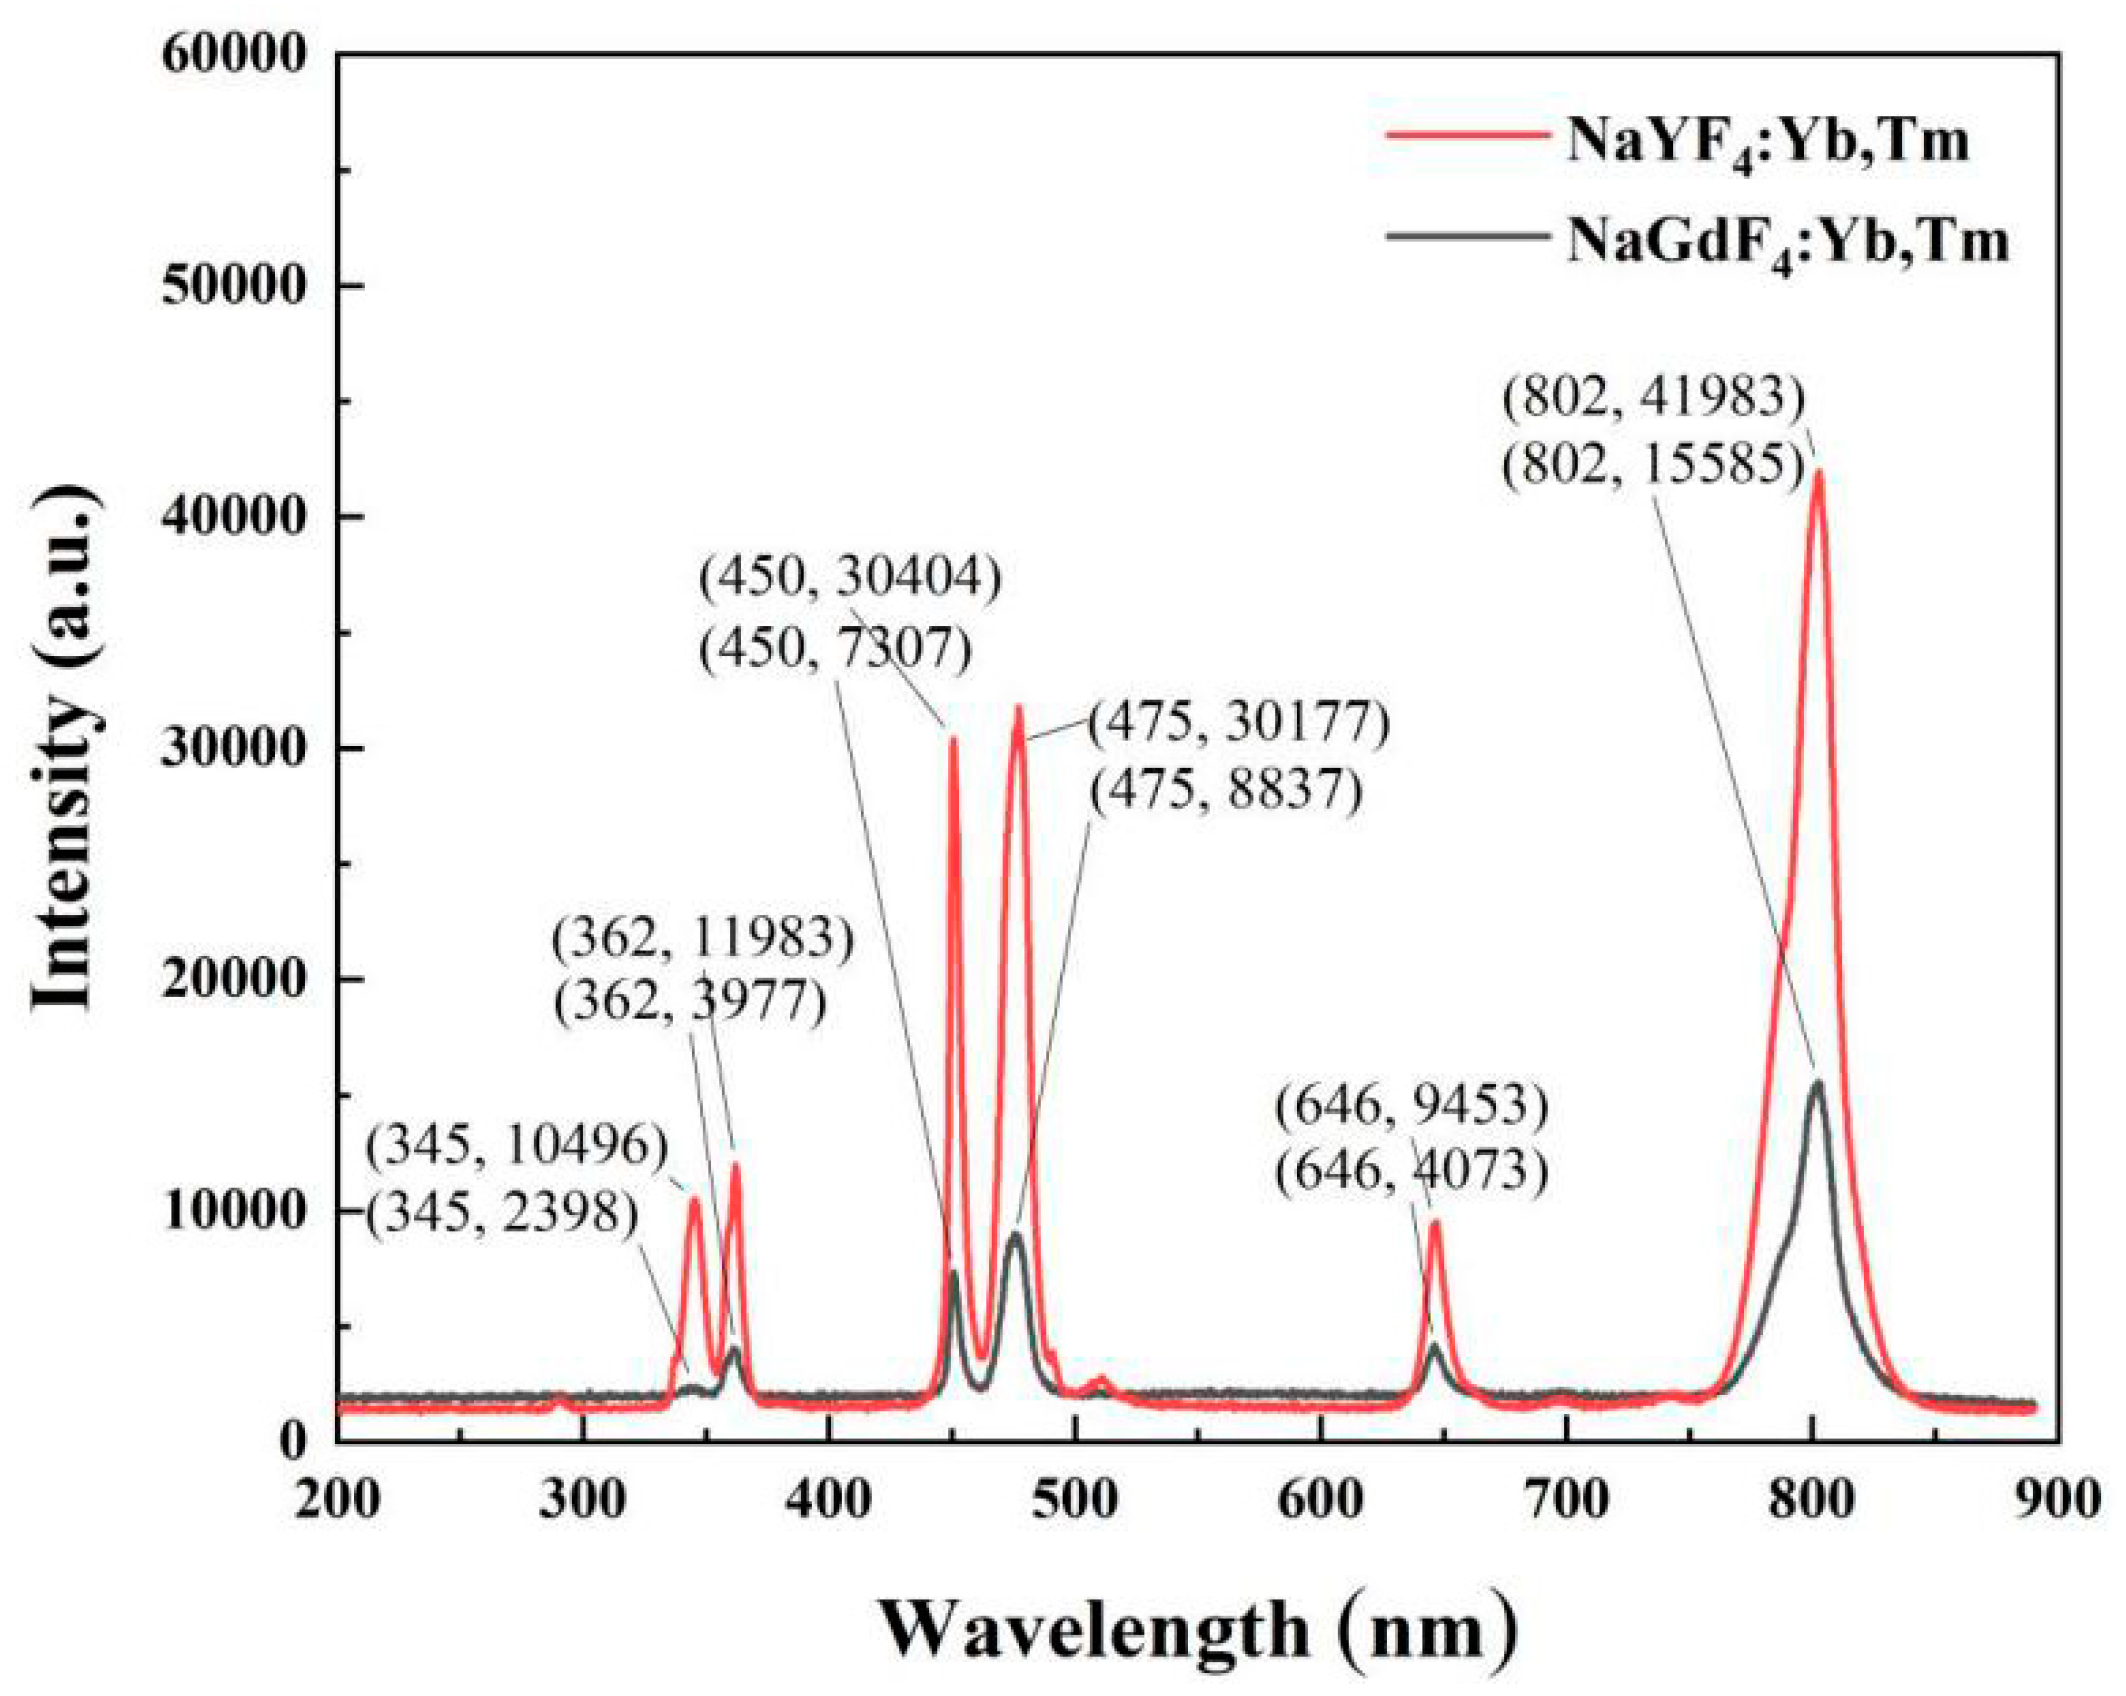
3.2.3. Comparison of Luminescence Properties of Two Upconverted Nanomaterials with the Best Doping Ratio

From the above results, the luminescence intensity of nanomaterials is the strongest when the mole fraction of Yb3+ is 20 % and the mole fraction of Tm3+ is 0.5 %. Therefore, the optimal doping concentration ratio (40:1) is selected to prepare these two kinds of upconverting nanomaterials. Figure 8 shows the luminescence intensity comparison of NaYF4:20%Yb3+,0.5%Tm3+ and NaGdF4:20%Yb3+,0,5%Tm3+. At 345, 362, 450, 477, 646, 802 nm, the luminescence intensity of NaYF4:Yb,Tm is 4.4, 3.0, 4.2, 3.4, 2.3, and 2.7-times stronger than that of NaGdF4:Yb,Tm, respectively. The luminescence intensity of NaYF4:Yb, Tm is much higher than that of NaGdF4:Yb, Tm under the same power of 980 nm laser excitation. Therefore, we chose NaYF4:20%Yb3+,0.5%Tm3+ upconverted nanomaterials as the substrate to further investigate protein detections.

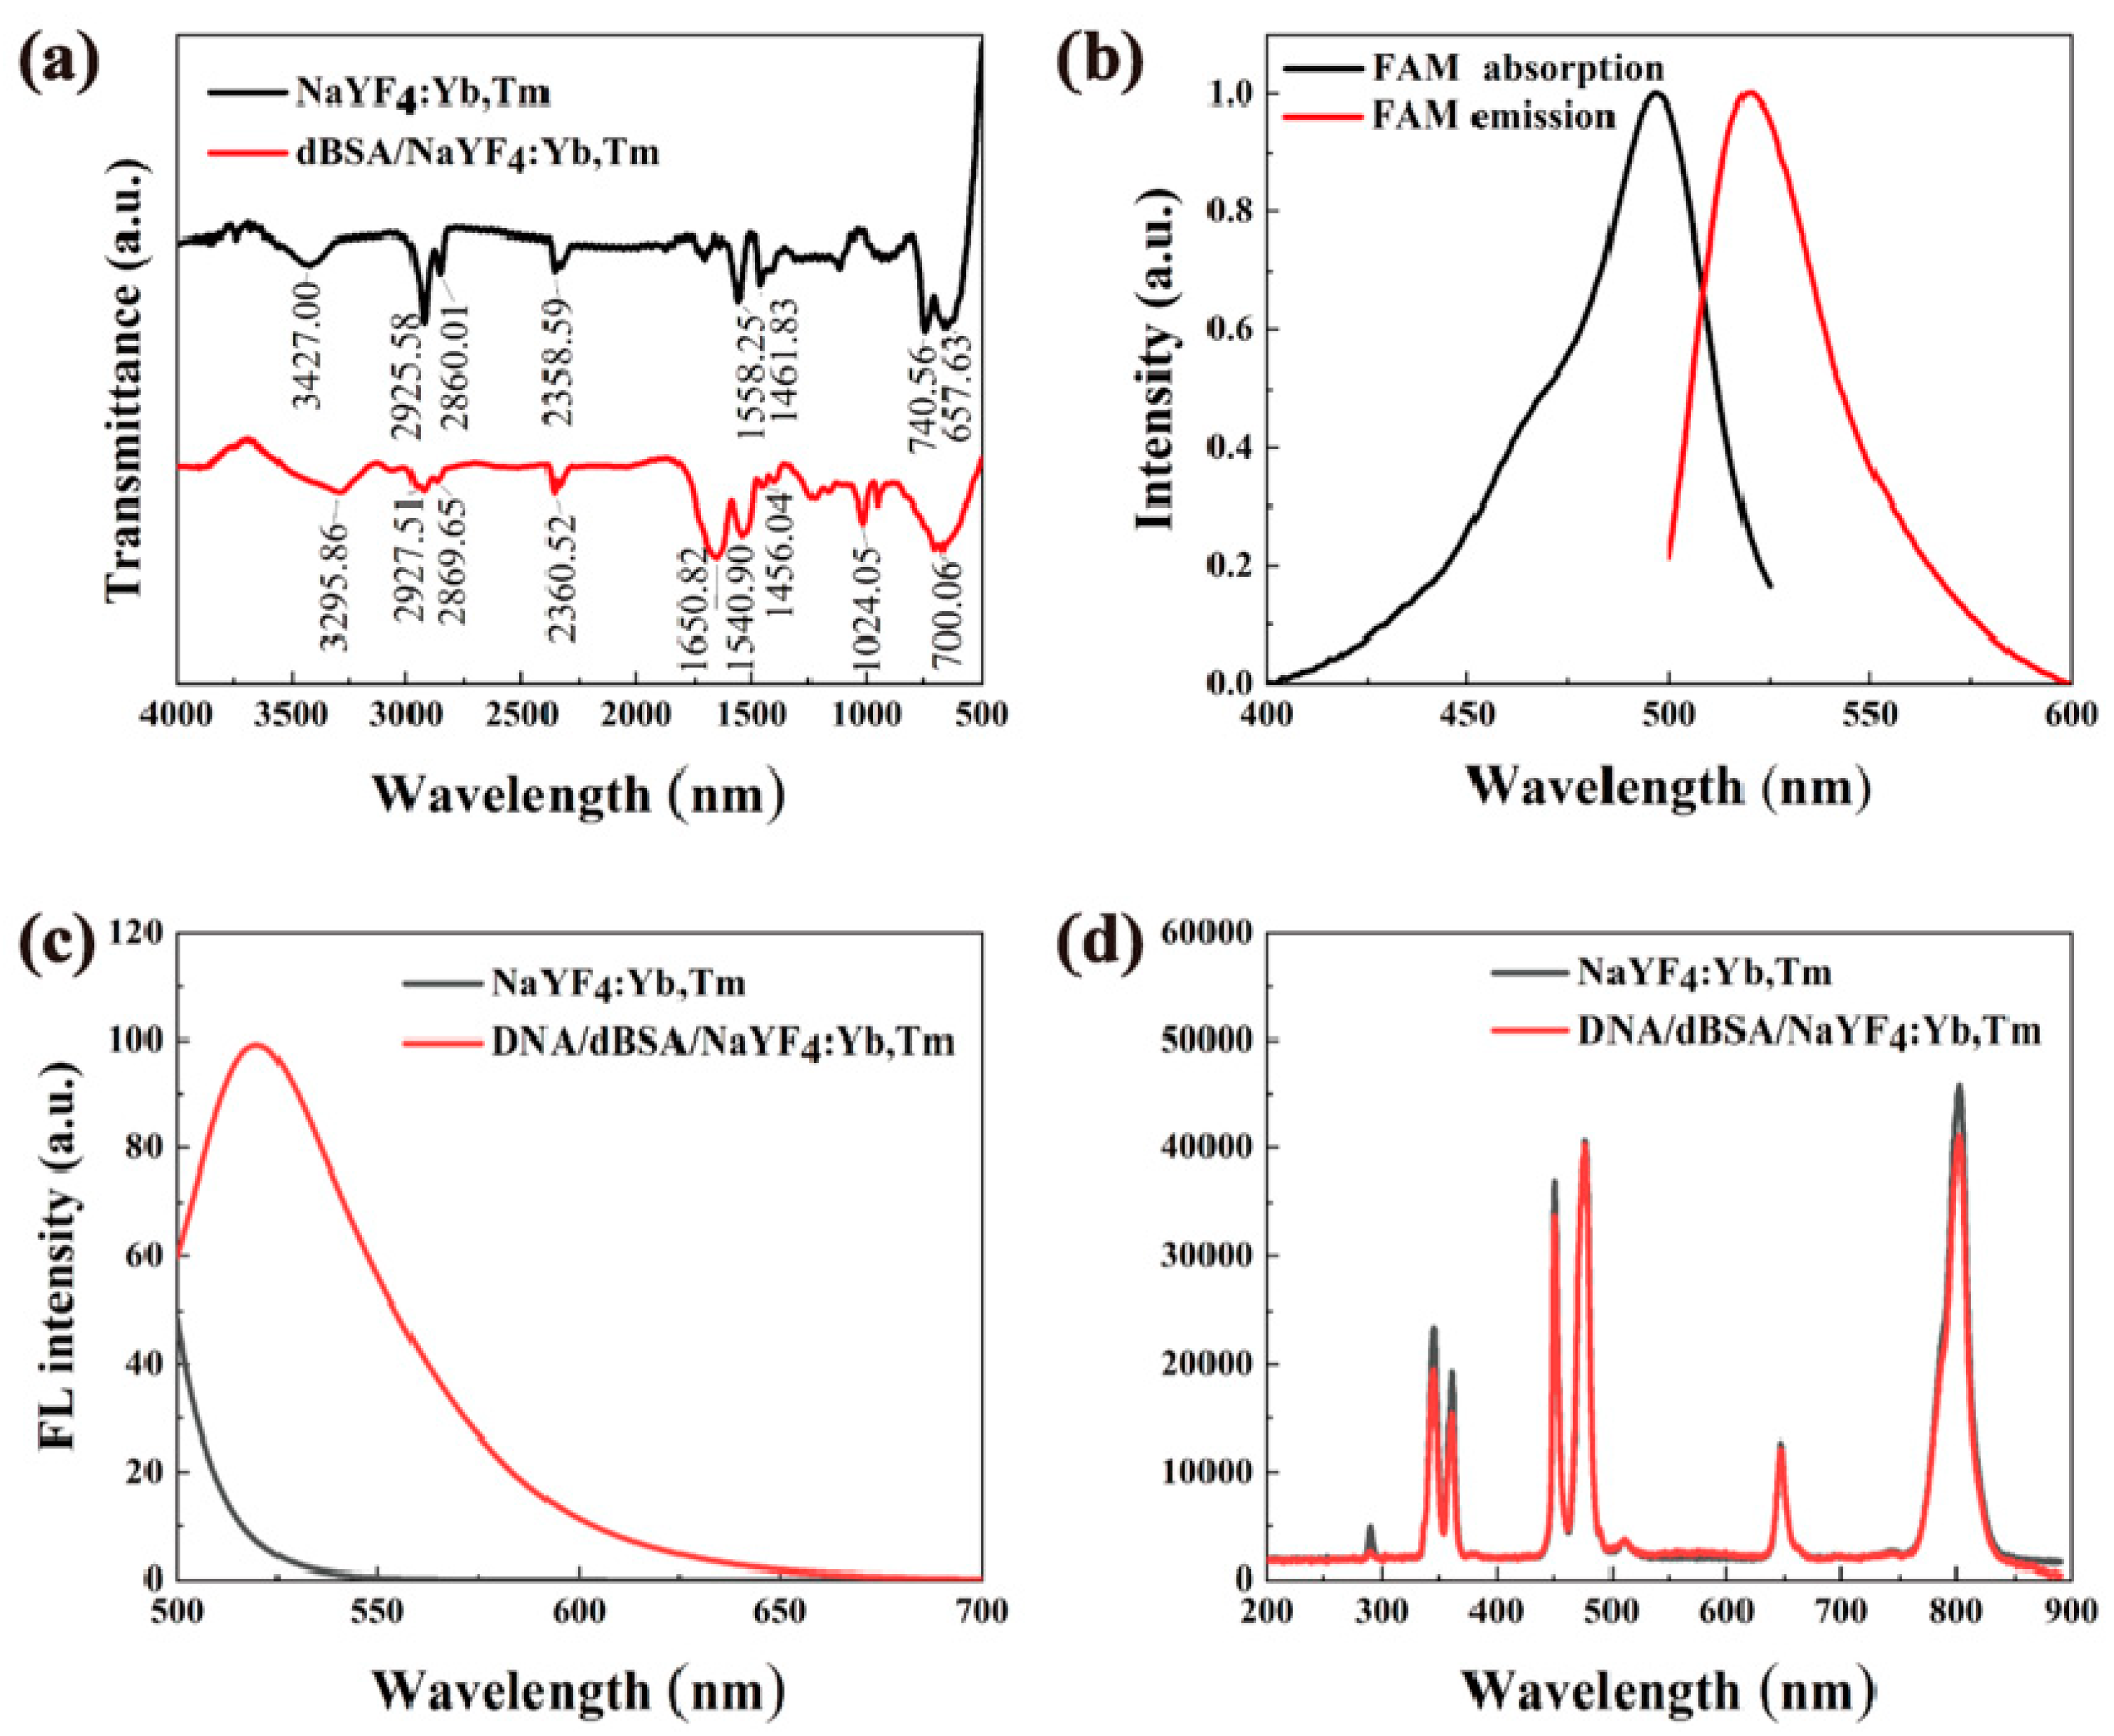
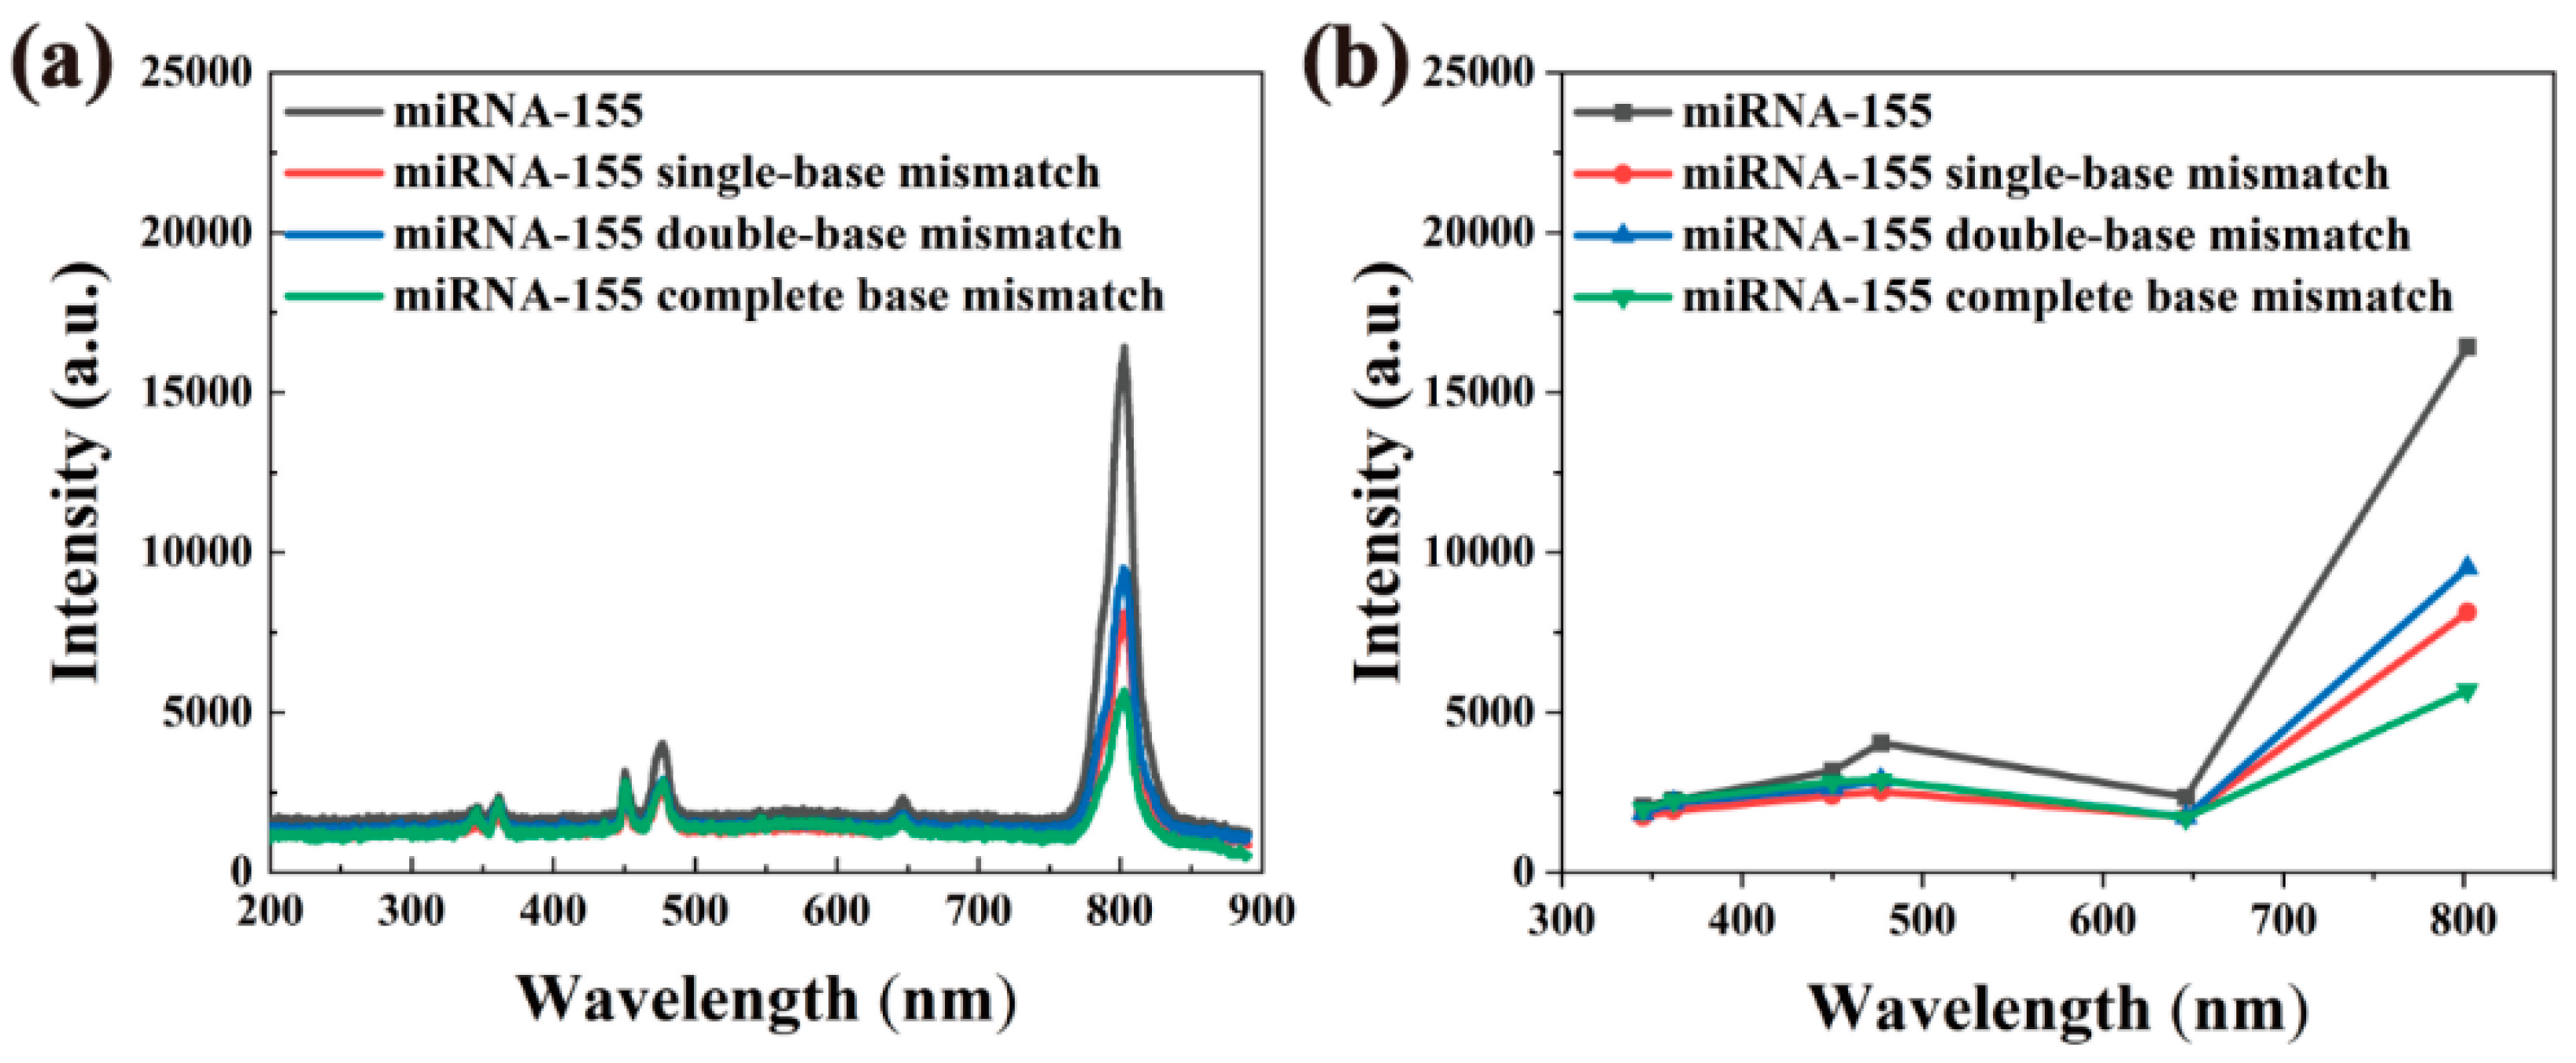
3.3. Analysis of Fluorescence Characteristics Based on NaYF4:Yb3+, Tm3+ Biological Probes

After the carboxylated bovine serum albumin was added to the upconverted nanomaterial sample for reaction treatment, we carried out repeated centrifugal washing on the sample to remove the carboxylated bovine serum albumin, and then measured the infrared absorption spectrum of the remaining samples, as shown in Figure 9a (the red line). As shown in Figure 9a, the broad infrared (IR) absorption peak at 3295.86 cm−1 represents the stretching vibration peak of OH in the carboxyl functional group; the sharp IR absorption peak at 1650.82 cm−1 represents the C=O formed after the reaction between the carboxylated protein and NH2-PEG group stretching vibration peak; 1024.05 cm−1 represents the stretching vibration absorption peak of -O- in PEG; 700.06 cm−1 broad absorption peak represents the out-of-plane rocking vibration absorption peak of NH in bovine serum albumin and NH2-PEG. Repeated centrifugal washing can completely remove the free carboxylated bovine serum albumin in the solution, and the upconversion material is inorganic and will not absorb at these positions. Therefore, it is considered that the new characteristic peaks belonging to organic functional groups can only come from carboxylated bovine serum proteins that have been attached to the surface of upconverted nanomaterials, which cannot be washed away. The above results prove that the surface of NaYF4:Yb3+, Tm3+ nanomaterials contains many carboxyl functional groups, and the carboxylated bovine serum albumin has been successfully modified the surface of water-soluble nanomaterials. Figure 9b shows the excitation and emission spectra of DNA/dBSA/NaYF4:Yb,Tm excited at 480 nm. The excitation spectrum is from 450 nm to 490 nm, and the emission spectrum is from 510 nm to 530 nm, which is mainly the contribution of FAM. As described in Section 2.6, we carried out repeated centrifugal washing to fully wash the excess DNA, and then obtained the fluorescence spectrum in Figure 9c. As shown in Figure 9c, when the DNA/dBSA/NaYF4:Yb,Tm fluorescent probes were excited at 480 nm, a strong emission peak is observed at 520 nm, which is consistent with the FAM fluorescence peak. It indicates that some DNA strands were not washed away due to their attachment to the carboxylated protein-modified upconversion material, namely DNA was attached successfully to the surfaces of UCNP via a protein and a FAM was added to the UCNP/DNA complex. Similarly, NaYF4:Yb,Tm and DNA/dBSA/NaYF4:Yb,Tm was excited at 980 nm, and the upconversion intensity of the luminescence is quite strong, as shown in Figure 9d. These nanocomposites have strong upconversion luminescence with good water solubility and biocompatibility, making them a new type of fluorescent probe.

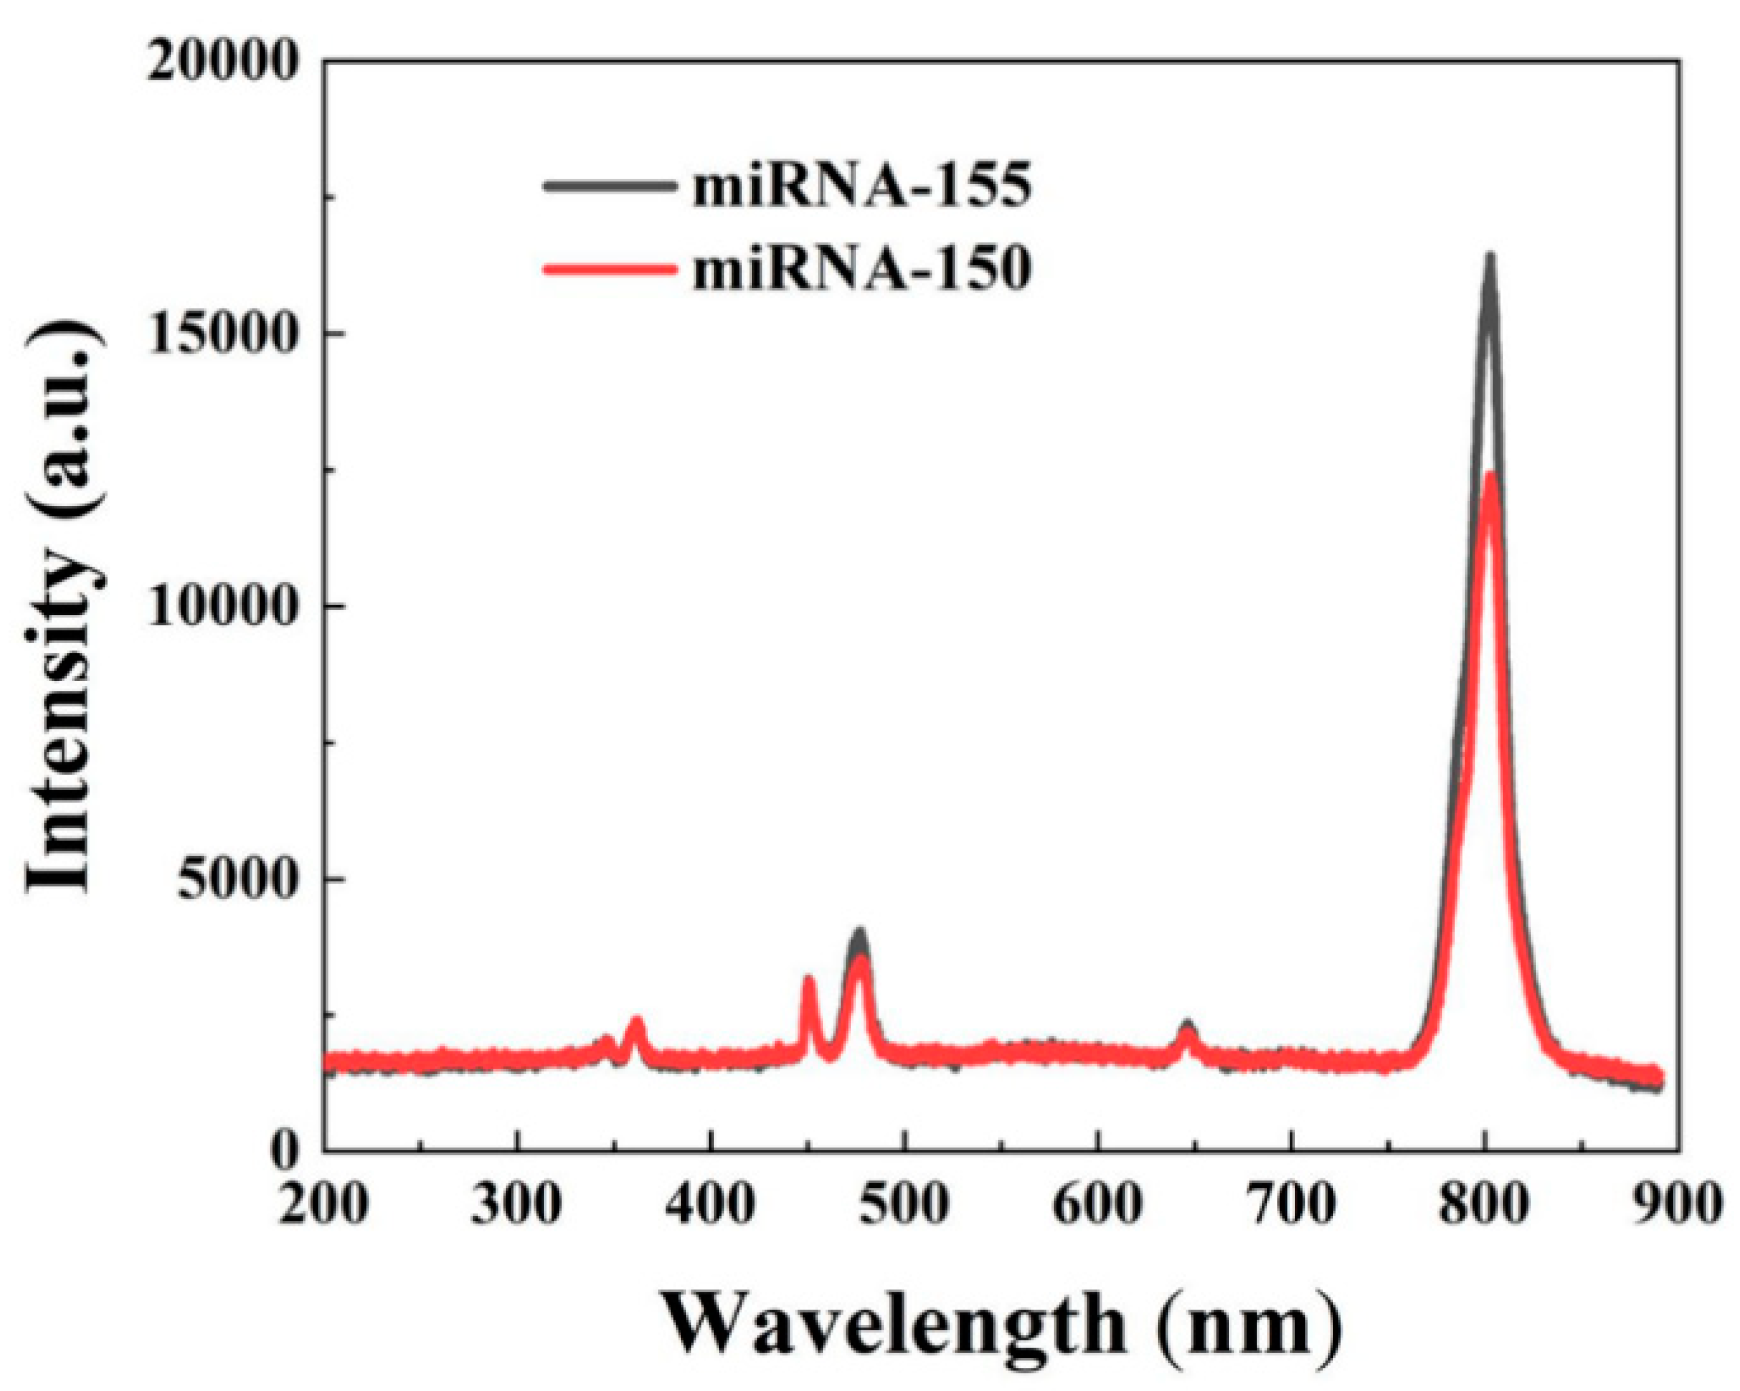
3.4. Fluorescent Probes for the Detection of Different Proteins

To test the detection of these upconverted nanomaterials for protein detection, 100 pM solutions of miRNA-155, single-base mismatch of miRNA-155, double-base mismatch of miRNA-155, complete-base mismatch of miRNA-155 and miRNA-150 solution with the same concentration of 100 pM were prepared, respectively. The prepared nucleotide sequences of miRNAs and fluorescent probes are shown in Table 1. The prepared fluorescent probes of upconverted nanomaterials were tested with different miRNAs and mismatched miRNAs, and the samples were excited by a fiber laser with a wavelength of 980 nm and their fluorescence spectra were measured.
As shown in Figure 10, the fluorescence spectrum of the fluorescent probe after connecting different miRNA-155 changed significantly. In general, the fluorescence spectra of the four groups were very similar, and the fluorescence intensity decreased significantly (compared with Figure 9d). The sample added with miRNA-155 had the strongest fluorescence intensity. The more mismatched bases, the more obvious fluorescence quenching and the smaller spectral intensity. It is worth noting that the fluorescence quenching at 345 nm, 362 nm, 450 nm, 477 nm and 646 nm is more obvious than that at 802 nm.
We divided the peak intensity at 802 nm (I802) by the peak intensity at 345 nm (I345), 362 nm (I362), 450 nm (I450), 477 nm (I477) and 646 nm (I646) to calculate a group of fluorescence peak ratios for further analysis of the differences in fluorescence spectra of samples with different miRNA-155s. The results are shown in Table 2. As can be seen in Table 2, the five peak ratios of the fluorescent probes are very close to those of the upconverted nanomaterials; then, the value of the completely mismatched miRNA155 is relatively close to that of the upconverted nanomaterials, and intact miRNA-155 had the greatest effect on all five peak ratios. It seems that the completely mismatched miRNA-155 has little effect on the peak ratios, and the intact miRNA-155 has the greatest effect on the peak ratios. This result may be that miRNAs with different sequences have different effects on different molecular bonds of upconverted nanomaterials. It is believed that these peak ratios can be used for specific recognition of miRNA-155. For fluorescent probes with multiple emission peaks, in addition to identifying the target substance by simply comparing the changes in peak intensity, the ratios between peaks can also be used for substance-specific identification. The fluorescence probe with multiple emission peaks provides more abundant optical information for the study of the characteristic changes of the detected object and has great application potential.
As shown in Figure 11, when the fluorescent probes were connected to miRNA-155 and miRNA-150, respectively, the fluorescence intensity of miRNA-155 was higher than that of miRNA-150. The experimental results show that the fluorescent probe can effectively distinguish different types of miRNAs.

4. Conclusions

In this paper, a novel NaYF4:Yb,Tm surface-functionalized fluorescent probe was proposed based on upconverted nanomaterials. Quantitative analysis of the effects of Yb3+ and Tm3+ ion concentrations on the morphology, size, and luminescence properties of NaYF4:Yb,Tm and NaGdF4:Yb,Tm indicated that the optimal doping concentration ratio of Yb3+:Tm3+ is 40: 1. In the study, by comparing the fluorescence emission of NaYF4: 20% Yb, 0.5% Tm and NaGdF4: 20% Yb, 0.5% Tm, upconverted nanomaterials with better luminescence properties were obtained. A novel fluorescent probe was designed for the surface carboxylation of NaYF4:Yb,Tm and the connection with amino group and DNA. The probe can be used for the detection of different specific biological miRNAs. When the fluorescent probes are used to detect different miRNAs, they can distinguish different miRNAs, especially miRNAs with base mismatches, from non-specific RNA molecular analytes. The preliminary studies indicate that the upconverted probes have a good potential for protein detection in early cancer diagnosis.

Author Contributions

Conceptualization, Instruction, Funding and Writing: Y.L., L.Z. and W.C.; Experimental design and processing: Z.D.; Material Characterization, data analysis and simulation: Y.H., H.R., J.W., W.N. and Y.W.; Data analysis and editing: C.H., C.X. and C.Y.; Z.D. and edited and formatted the figures: Z.D. and J.W.; Supervision and approval for submission: Y.L. and W.C. All authors have read and agreed to the published version of the manuscript.

Funding

This research was funded by National Natural Science Foundation of China grant number 61971207, Postgraduate Research & Practice Innovation Program of Jiangsu Province grant number (KYCX20_2213) and Natural Science Foundation of the Jiangsu Higher Education Institutes of China grant number 19KJA510003 and 20KJA430003.

Institutional Review Board Statement

Not applicable.

Informed Consent Statement

Not applicable.

Data Availability Statement

Not applicable.

Acknowledgments

W.C. would like to thank Solgro. Inc. and the University of Texas at Arlington for support.

Conflicts of Interest

The authors declare no conflict of interest.

References

  1. Lv, Y.; Huang, Z.; Lin, Y.; Fang, Y.; Xu, Z. MiRNA expression patterns are associated with tumor mutational burden in lung adenocarcinoma. OncoImmunology 2019, 8, 1–8. [Google Scholar] [CrossRef] [PubMed]
  2. Danese, E.; Minicozzi, A.M.; Benati, M.; Paviati, E.; Lima-Oliveira, G.; Gusella, M.; Pasini, F.; Salvagno, G.L.; Montagnana, M.; Lippi, G. Reference miRNAs for colorectal cancer: Analysis and verification of current data. Sci. Rep. 2017, 7, 8413. [Google Scholar] [CrossRef] [PubMed]
  3. Wen, J.; Zhou, S.; Yu, Z.; Chen, J.; Yang, G.; Tang, J. Decomposable quantum-dots/DNA nanosphere for rapid and ultrasensitive detection of extracellular respiring bacteria. Biosens. Bioelectron. 2017, 100, 469–474. [Google Scholar] [CrossRef] [PubMed]
  4. Krzeminski, P.; Sarasquete, M.E.; Misiewicz-Krzeminska, I.; Corral, R.; Corchete, L.A.; Martín, A.A.; García-Sanz, R.; San Miguel, J.F.; Gutiérrez, N.C. Insights into epigenetic regulation of microRNA-155 expression in multiple myeloma. Biochim. Biophys. Acta—Gene Regul. Mech. 2015, 1849, 353–366. [Google Scholar] [CrossRef] [PubMed]
  5. Yébenes, V.G.D.; Bartolomé-Izquierdo, N.; Ramiro, A.R. Regulation of B-cell development and function by micrornas. Immunol. Rev. 2013, 253, 25–39. [Google Scholar] [CrossRef] [Green Version]
  6. Spierings, D.C.; McGoldrick, D.; Hamilton-Easton, A.M.; Neale, G.; Murchison, E.P.; Hannon, G.J.; Green, D.R.; Withoff, S. Ordered progression of stage-specific miRNA profiles in the mouse B2 B-cell lineage. Blood 2011, 117, 5340–5349. [Google Scholar] [CrossRef] [Green Version]
  7. Sacco, A.; Zhang, Y.; Maiso, P.; Manier, S.; Rossi, G.; Treon, S.P.; Ghobrial, I.M.; Roccaro, A.M. MicroRNA aberrations in waldenstrom macroglobulinemia. Clin. Lymphoma Myeloma Leuk. 2013, 13, 205–207. [Google Scholar] [CrossRef]
  8. Auzel, F. Compteur quantique par transfert d’energie entre deux ions de terres rares dans un tungstate mixte et dans un verre. C. R. Acad. Sci. Paris 1966, 262, 1016–1019. [Google Scholar]
  9. Zhan, Q.; Qian, J.; Liang, H.; Zhan, Q.; Somesfalean, G.; Andersson-Engels, S. Using 915 nm Laser Excited Tm3+/Er3+/Ho3+-Doped NaYbF4 Upconversion Nanoparticles for in Vitro and Deeper in Vivo Bioimaging without Overheating Irradiation. Acs Nano 2011, 5, 3744–3757. [Google Scholar] [CrossRef]
  10. Chen, W. Manganese Doped Upconversion Luminescence Nanoparticles. U.S. Patent 7,008,559 B2, 29 June 2006. [Google Scholar]
  11. Joly, A.G.; Chen, W.; McCready, D.E.; Malm, J.-O.; Bovin, J.-O. Upconversion luminescence of CdTe nanoparticles. Phys. Rev. B 2005, 71, 165304. [Google Scholar] [CrossRef] [Green Version]
  12. Ouyang, J.; Ripmeester, J.A.; Wu, X.; Kingston, D.; Yu, K.; Joly, A.G.; Chen, W. Upconversion Luminescence of Colloidal CdS and ZnCdS Semiconductor Quantum Dots. J. Phys. Chem. C 2007, 111, 16261–16266. [Google Scholar] [CrossRef]
  13. Morgan, N.Y.; English, S.W.; Chen, W.; Chernomordik, V.; Russo, A.; Smith, P.D.; Gandjbakhche, A. Real time in vivo non-invasive optical imaging using near-infrared fluorescent quantum dots. Acad. Radiol. 2005, 12, 313–323. [Google Scholar] [CrossRef] [PubMed]
  14. Chen, W.; Zhang, X.; Huang, Y. Luminescence Enhancement of EuS Clusters in USY-Zeolite. Appl. Phys. Lett. 2000, 76, 2328–2330. [Google Scholar] [CrossRef]
  15. Li, L.; Rashidi, L.H.; Yao, M.; Ma, L.; Chen, L.; Zhang, J.; Zhang, Y.; Chen, W. CuS Nanoagents for Photodynamic and Photothermal Therapies: Phenomena and Possible Mechanisms, Photodiagnosis and Photodynamic Therapy. Photodign. Photody Ther. 2017, 19, 5–14. [Google Scholar] [CrossRef] [PubMed]
  16. Li, Y.; Lu, W.; Huang, Q.; Li, C.; Chen, W. In vitro Photothermal Ablation of Tumor Cells with CuS nanoparticles. Nanomedicine 2010, 5, 1161–1171. [Google Scholar] [CrossRef] [PubMed] [Green Version]
  17. Zhu, G.; Zheng, J.; Song, E.; Donovan, M.; Zhang, K.; Liu, C.; Tan, W. Self-assembled, aptamer-tethered DNA nanotrains for targeted transport of molecular drugs in cancer theranostics. Proc. Natl. Acad. Sci. USA 2013, 110, 7998–8003. [Google Scholar] [CrossRef] [Green Version]
  18. Dacosta, M.V.; Doughan, S.; Han, Y.; Krull, U.J. Lanthanide upconversion nanoparticles and applications in bioassays and bioimaging: A review. Anal. Chim. Acta 2014, 832, 1–33. [Google Scholar] [CrossRef]
  19. Probst, C.E.; Zrazhevskiy, P.; Bagalkot, V.; Gao, X. Quantum dots as a platform for nanoparticle drug delivery vehicle design. Adv. Drug Deliv. Rev. 2013, 65, 703–718. [Google Scholar] [CrossRef] [Green Version]
  20. Chen, W.; Zhang, J. Using Nanoparticles to Enable Simultaneous Radiation and Photodynamic Therapies for Cancer Treatment. J. Nanosci. Nanotechnol. 2006, 6, 1159–1166. [Google Scholar] [CrossRef]
  21. Liu, F.; Chen, W.; Wang, S.P.; Joly, A.G. Investigation of Water-Soluble X-ray Luminescence Nanoparticles For Photodynamic Activation. Appl. Phys. Lett. 2008, 92, 43901. [Google Scholar] [CrossRef]
  22. Liu, Y.F.; Chen, W.; Wang, S.P.; Joly, A.G.; Westcott, S.; Woo, B.K. X-ray Luminescence of LaF3:Tb and LaF3:Ce, Tb Water Soluble. Nanoparticles J. Appl. Phys. 2008, 103, 63105. [Google Scholar] [CrossRef]
  23. Chen, W.; Westcott, S.L.; Zhang, J. Dose Dependence of X-ray Luminescence from CaF2:Eu2+, Mn2+ Phosphors. Appl. Phys. Lett. 2007, 91, 211103. [Google Scholar] [CrossRef]
  24. Chen, W.; Westcott, S.L.; Wang, S.; Liu, Y. Dose Dependent X-Ray Luminescence in MgF2:Eu2+, Mn2+ Phosphors. J. Appl. Phys. 2008, 103, 113103. [Google Scholar] [CrossRef]
  25. Wang, S.P.; Westcott, S.; Chen, W. Nanoparticle luminescence thermometry. J. Phys. Chem. B 2002, 106, 11203–11209. [Google Scholar] [CrossRef]
  26. Chen, W.; Joly, A.G.; Zhang, J.Z. Up-Conversion Luminescence of Mn2+ in ZnS:Mn Nanoparticles. Phys. Rev. B. 2001, 64, 412021–412024. [Google Scholar] [CrossRef]
  27. Chen, X.; Liu, J.; Li, Y.; Pandey, N.K.; Chen, T.; Wang, L.; Amador, E.H.; Chen, W.; Liu, F.; Xiao, E.; et al. Study of copper-cysteamine based X-ray induced photodynamic therapy and its effects on cancer cell proliferation and migration in a clinical mimic setting. Bioactive Materials 2021, 7, 504–514. [Google Scholar] [CrossRef] [PubMed]
  28. Gao, C.; Zheng, P.; Liu, Q. Recent Advances of Upconversion Nanomaterials in the Biological Field. Nanomaterials 2021, 11, 2474. [Google Scholar] [CrossRef]
  29. Long, M.; Liu, Q.; Wang, D.; Wang, J.; Zhang, Y.; Tang, A.; Liu, N.; Buid, B.; Chen, W.; Yang, H. A New nanoclay-based bifunctional hybrid fiber membrane with hemorrhage control and wound healing for emergency self-rescue. Mater. Today Adv. 2021, 12, 100190. [Google Scholar] [CrossRef]
  30. Pandey, N.K.; Xiong, W.; Wang, L.; Chen, W.; Lumata, L. Aggregation-induced emission luminogens for highly effective microwave dynamic therapy. Bioact. Mater. 2021, 7, 112–125. [Google Scholar] [CrossRef]
  31. Wang, Y.; Alkhaldi, N.D.; Pandey, N.K.; Chudal, L.; Wang, L.Y.; Lin, L.W.; Zhang, M.B.; Yong, Y.X.; Amador, E.H.; Huda, M.N.; et al. A new type of cuprous-cysteamine sensitizers: Synthesis, optical properties and potential applications. Mater. Today Phys. 2021, 19, 100435. [Google Scholar] [CrossRef]
  32. Mao, L.; Lu, Z.; He, N.; Zhang, L.; Deng, Y.; Duan, D. A new method for improving the accuracy of miRNA detection with NaYF4:Yb,Er upconversion nanoparticles. Sci. China Chem. 2017, 60, 157–162. [Google Scholar] [CrossRef]
  33. Kowalik, P.; Kaminska, I.; Fronc, K.; Borodziuk, A.; Sikora, B. The ROS-generating photosensitizer-free NaYF4:Yb,Tm@SiO2 upconverting nanoparticles for photodynamic therapy application. Nanotechnology 2021, 32, 475101. [Google Scholar] [CrossRef] [PubMed]
  34. Etchart, I.M.; Bérard Laroche, M. Efficient white light emission by upconversion in Yb -, Er- and Tm -doped Y BaZnO. Chem. Commun. 2011, 47, 6263–6265. [Google Scholar] [CrossRef]
  35. Zheng, K.; Liu, Z.; Zhao, D.; Zhang, D.; Qin, G.; Qin, W. Infrared to ultraviolet upconversion fluorescence of Gd3+ in β-NaYF4 microcrystals induced by 1560 nm excitation. Opt. Mater. 2011, 33, 783–787. [Google Scholar] [CrossRef]
  36. Shan, J.; Kong, W.; Wei, R.; Nan, Y.; Ju, Y. An investigation of the thermal sensitivity and stability of the β-NaYF4:Yb,Er upconversion nanophosphors. J. Appl. Phys. 2010, 107, 937. [Google Scholar] [CrossRef] [Green Version]
  37. SchäFer, H.; Ptacek, P.; Voss, B.; Eickmeier, H.; Haase, M. Synthesis and Characterization of Upconversion Fluorescent Yb3+, Er3+ Doped RbY2F7 Nano and Microcrystals. Cryst. Growth Des. 2010, 10, 2202–2208. [Google Scholar] [CrossRef]
  38. Li, C.X.; Quan, Z.W.; Yang, J.; Yang, P.P.; Lin, J. Highly uniform and monodisperse beta-NaYF(4):Ln(3+) (Ln = Eu, Tb, Yb/Er, and Yb/Tm) hexagonal microprism crystals: Hydrothermal synthesis and luminescent properties. Inorg. Chem. 2007, 46, 6329. [Google Scholar] [CrossRef]
  39. Sch Fer, H.; Ptacek, P.; Zerzouf, O.; Haase, M. Synthesis and Optical Properties of KYF4/Yb, Er Nanocrystals, and their Surface Modification with Undoped KYF4. Adv. Funct. Mater. 2010, 18, 2913–2918. [Google Scholar] [CrossRef]
  40. Zhang, F. Photon Upconversion Nanomaterials; Springer: Berlin/Heidelberg, Germany, 2015. [Google Scholar] [CrossRef]
  41. Chien, H.W.; Tsai, M.T.; Yang, C.H.; Lee, R.H.; Wang, T.L. Interaction of LiYF4:Yb3+/Er3+/Ho3+/Tm3+@LiYF4:Yb3+ upconversion nanoparticles, molecularly imprinted polymers, and templates. RSC Adv. 2020, 10, 35600–35610. [Google Scholar] [CrossRef] [PubMed]
  42. Gao, D.L.; Zheng, H.R.; Yu, Y.; Lei, Y.; Zhang, X.S. Spectroscopic properties of Tm3+ and Ln3+ (Ln3+ = Yb3+, Er3+, Pr3+, Ho3+, Eu3+) co-doped fluoride nanocrystals. Scientia Sinica (Phys. Mech. Astron.) 2010, 40, 287–295. [Google Scholar]
  43. Yun, R.; Luo, L.; He, J.; Wang, J.; Li, X.; Zhao, W.; Nie, Z. Tunable and white up-conversion emission from Tm3+-Ho3+-Yb3+/-Nd3+ co-doped GdVO4 phosphors under 808-nm excitation. J. Mater. Sci. Mater. Electron. 2021, 32, 8149–8156. [Google Scholar] [CrossRef]
  44. Kasprowicz, D.; Brik, M.G.; Majchrowski, A.; Michalski, E.; Głuchowski, P. Up-conversion emission in KGd(WO ) single crystals triply-doped with Er /Yb /Tm, Tb /Yb /Tm and Pr /Yb /Tm ions. Opt. Mater. 2011, 33, 1595–1601. [Google Scholar] [CrossRef]
  45. Li, Z.; Zhang, Y.; Hieu, L.; Zhu, R.; Ghida, E.B.; Wei, Y.; Han, G. Upconverting NIR Photons for Bioimaging. Nanomaterials 2015, 5, 2148–2168. [Google Scholar] [CrossRef] [PubMed] [Green Version]
  46. Hou, Y.; Qiao, R.; Fang, F.; Wang, X.; Gao, M. NaGdF4 Nanoparticle-Based Molecular Probes for Magnetic Resonance Imaging of Intraperitoneal Tumor Xenografts In Vivo. Acs Nano 2012, 7, 330–338. [Google Scholar] [CrossRef] [PubMed]
  47. Gao, D.; Zhang, X.; Zheng, H.; Gao, W.; He, E. Yb3+/Er3+ codoped β-NaYF4 microrods: Synthesis and tuning of multicolor upconversion. J. Alloy. Compd. 2013, 554, 395–399. [Google Scholar] [CrossRef]
  48. Jiang, G.; Pichaandi, J.; Johnson, N.; Burke, R.D.; Van Veggel, F.C.J.M. An Effective Polymer Cross-Linking Strategy To Obtain Stable Dispersions of Upconverting NaYF4 Nanoparticles in Buffers and Biological Growth Media for Biolabeling Applications. Langmuir 2012, 28, 3239–3247. [Google Scholar] [CrossRef]
  49. Huang, W.; Shen, J.; Lei, W.; Chang, Y.; Ye, M. Y2O3:Yb/Er nanotubes: Layer-by-layer assembly on carbon-nanotube templates and their upconversion luminescence properties. Mater. Res. Bull. 2012, 47, 3875–3880. [Google Scholar] [CrossRef]
Figure 1. Schematic diagram of energy level transition of Yb3+ and Tm3+ ions.
Nanomaterials 12 01787 g001
Figure 4. Fluorescence spectra of NaYF4: Yb3+, Tm3+ and NaGdF4: Yb3+, Tm3+ with different Yb3+ doping ratios. (a) Fluorescence spectra of NaYF4:x%Yb3+,0.5%Tm3+ (x = 5, 10, 20, 50, 80) at 980 nm excitation. (b) Schematic diagram of the relationship between the maximum intensity of the luminescence peaks corresponding to NaYF4: Yb3+ and Tm3+ with different doping ratios and the concentration change. (c) Fluorescence spectra of NaGdF4:x%Yb3+,0.5%Tm3+ (x = 5, 10, 20, 50, 80) at 980 nm excitation. (d) Schematic diagram of the relationship between the maximum intensity of the luminescence peaks corresponding to NaGdF4: Yb3+ and Tm3+ with different doping ratios and the concentration changes.
Nanomaterials 12 01787 g004
Figure 5. SEM, particle size analysis, TEM, and XRD images of NaYF4: 20%Yb3+, x%Tm3+. (a) x = 0.2, (c) x = 0.3, (e) x = 0.5, (g) x = 0.8, (i) x = 1.0; particle size analysis: (b) x = 0.2, (d) x = 0.3, (f) x = 0.5, (h) x = 0.8, (j) x = 1.0; (k) TEM image of NaYF4: 20%Yb3+, 0.5%Tm3+; (l) NaYF4: 20%Yb3+, x%Tm3+ (X = 0.2, 0.3, 0.5, 0.8, 1.0).
Nanomaterials 12 01787 g005
Figure 6. SEM, particle size analysis, TEM, and XRD images of NaGdF4: 20%Yb3+, x%Tm3+. (a) x = 0.2, (c) x = 0.3, (e) x = 0.5, (g) x = 0.8, (i) x = 1.0; particle size analysis: (b) x = 0.2, (d) x = 0.3, (f) x = 0.5, (h) x = 0.8, (j) x = 1.0; (k) TEM image of NaGdF4: 20%Yb3+, 0.5%Tm3+; (l) NaGdF4: 20%Yb3+, x%Tm3+ (X = 0.2, 0.3, 0.5, 0.8, 1.0).
Nanomaterials 12 01787 g006
Figure 7. Fluorescence spectra of NaYF4: Yb3+, Tm3+ and NaGdF4: Yb3+, Tm3+ with different Tm3+ doping ratios. (a) Fluorescence spectra of NaYF4:20%Yb3+, x%Tm3+ (x = 0.2, 0.3, 0.5, 0.8, 1.0) at 980 nm excitation. (b) NaYF4: Yb3+ with different Tm3+ doping ratios, the relationship between the maximum intensity of the luminescence peak corresponding to Tm3+ and the concentration change. (c) Fluorescence spectra of NaGdF4:20%Yb3+, x%Tm3+ (x = 0.2, 0.3, 0.5, 0.8, 1.0 at 980 nm excitation). (d) The corresponding doping ratios of NaGdF4: Yb3+ and Tm3+ with different Tm3+ doping ratios.
Nanomaterials 12 01787 g007
Figure 8. Comparison of fluorescence spectra of NaYF4: 20% Yb3+, 0.5% Tm3+ and NaGdF4: 20% Yb3+, 0.5% Tm3+ at 980 nm excitation.
Nanomaterials 12 01787 g008
Figure 9. (a) Infrared absorption spectra of NaYF4: Yb,Tm before and after modification with carboxylated bovine serum albumin. (b) Absorption and emission spectra of the FAM fluorophore. (c) Fluorescence spectra of NaYF4:Yb,Tm and novel fluorescent probes under excitation at 480 nm. (d) Fluorescence spectra of NaYF4:Yb,Tm and novel fluorescent probes under excitation at 980 nm.
Nanomaterials 12 01787 g009
Figure 10. Fluorescence spectra of fluorescent probes connected to miRNA-155, miRNA-155 single-base mismatch, miRNA-155 double-base mismatch, and miRNA-155 complete-base mismatch. (a) Fluorescence spectra of mismatched sequences relative to miRNA-155 at 980 nm excitation. (b) MiRNA-155 with different sequences, the relationship between the maximum intensity of the luminescence peak corresponding to sequences change.
Nanomaterials 12 01787 g010
Figure 11. Fluorescence spectra of fluorescent probes connected to miRNA-155 and miRNA-150 under excitation at 980 nm.
Nanomaterials 12 01787 g011
Table 1. Nucleotide sequences of miRNAs and fluorescent probes.
NameSequences (5′-3′)
miRNA-155 UUAAUGCUAAUCGUGAUAGGGGU
miRNA-150UCUCCCAACCCUUGUACCAGUG
miRNA-155 matched DNA strandsNH2-CCCCCCCCCCCC-ACCCCTATCACGATTAGCATTAA-CGCTAT-FAM
miRNA-150 matched DNA strandsNH2-CCCCCCCCCCCC-CACTGGTACAAGGGTTGGGAGA-CGCTAT-FAM
miRNA-155 single base mismatchUUAAGGCUAAUCGUGAUAGGGGU
miRNA-155 double base mismatchUUAAGGCUAAUAGUGAUAGGGGU
miRNA-155 complete base mismatchAATTACGATTAGCACTATCCCCA
Table 2. The ratio of fluorescence peaks at 802 nm and 450 nm.
Fluorescent SubstanceI802/I345I802/I362I802/I450I802/I477I802/I646
NaYF4:20%Yb3+, 0.5%Tm3+1.972.381.241.133.65
Fluorescent probes2.092.711.231.013.37
FP + CmiRNA-1552.872.522.011.963.32
FP+ M2miRNA-155 5.194.383.613.295.5
FP + M1miRNA-1554.664.213.383.224.69
FP + miRNA-1557.927.285.194.066.99
Noting: FP + CmiRNA-155 represents fluorescent probe with completely mismatched miRNA155; FP+ M2miRNA-155 represents fluorescent probe with miRNA-155 double-base mismatch: FP+ M2miRNA-155 represents fluorescent probe with miRNA-155 single-base mismatch; FP + miRNA-155 represents fluorescent probe with miRNA-155.
Publisher’s Note: MDPI stays neutral with regard to jurisdictional claims in published maps and institutional affiliations.

