Article

High-Throughput Color Imaging Hg2+ Sensing via Amalgamation-Mediated Shape Transition of Concave Cube Au Nanoparticles

1
National Engineering Laboratory for Rice and By-Products Further Processing, College of Food Science and Engineering, Central South University of Forestry & Technology, Changsha 410004, China
2
Technology Center of Gaoqing Black Cattle Product Processing and Quality Improvement, College of Food Science and Engineering, Shandong Agriculture and Engineering University, Jinan 250100, China
3
Tropical Feed Resources Research and Development Center (TROFREC), Department of Animal Science, Facully of Agriculture, Khon Kaen University, Khon Kaen 40002, Thailand
*
Authors to whom correspondence should be addressed.
These authors contributed equally to this work.
Nanomaterials 2022, 12(11), 1902; https://0-doi-org.brum.beds.ac.uk/10.3390/nano12111902
Submission received: 26 March 2022 / Revised: 6 May 2022 / Accepted: 20 May 2022 / Published: 2 June 2022
(This article belongs to the Special Issue Nanomaterials for Sensing Application)

Abstract

:
Mercury, as one type of toxic heavy metal, represents a great threat to environmental and biological metabolic systems. Thus, reliable and sensitive quantitative detection of mercury levels is particularly meaningful for environmental protection and human health. We proposed a high-throughput single-particle color imaging strategy under dark-field microscopy (DFM) for mercury ions (Hg2+) detection by using individual concave cube Au nanoparticles as optical probes. In the presence of ascorbic acid (AA), Hg2+ was reduced to Hg which forms Au–Hg amalgamate with Au nanoparticles, altering their localized surface plasmon resonance (LSPR). Transmission electron microscopy (TEM) images demonstrated that the concave cube Au nanoparticles were approaching to sphere upon increasing the concentration of Hg2+. The nanoparticles underwent an obvious color change from red to yellow, green, and finally blue under DFM due to the shape-evolution and LSPR changes. In addition, we demonstrated for the first time that the LSPR of Au–Hg amalgamated below 400 nm. Inspired by the above-mentioned results, single-particle color variations were digitalized by converting the color image into RGB channels to obtain (green+blue)/red intensity ratios [(G+B)/R]. The concentration-dependence change was quantified by statistically analyzing the (G+B)/R ratios of a large number of particles. A linear range from 10 to 2000 nM (R2 = 0.972) and a limit of detection (LOD) of 1.857 nM were acquired. Furthermore, many other metal ions, like Cu2+, Cr3+, etc., did not interfere with Hg2+ detection. More importantly, Hg2+ content in industrial wastewater samples and in the inner regions of human HepG2 cells was determined, showing great potential for developing a single-particle color imaging sensor in complex biological samples using concave cube Au nanoparticles as optical probes.

1. Introduction

Mercury ions have been recognized as one of the most hazardous pollutants to human health; it cannot be decomposed once released into ecosystems, which has received considerable attention [1,2,3]. Moreover, Hg2+ can be absorbed by the bodies of animals or plants and then stay inside to contaminate them; it ends up being enriched in the human body through the food chain [4,5]. Once ingested by the human body, Hg2+ is not easily excreted and will cause physiological damage, including kidney dysfunction, immune system destruction, and even death [6,7,8]. Therefore, it is of great significance to develop an efficient platform for monitoring Hg2+ in biological and environmental systems. Up to now, various techniques have been proposed for Hg2+ sensing including coupled plasma mass spectrometry [9,10], atomic absorption spectrometry [11,12], surface-enhanced Raman scattering (SERS) [13], and electrochemical methods [14]. Although the quantification of Hg2+ can be achieved by the above sensing methods, these techniques have inevitable limitations, such as time-consuming, inferior reproducibility, poor portability, and requiring professional technicians. Hence, it is highly desired to develop a simple, cost-effective, and highly sensitive approach for Hg2+ detection.
Lately, the emerging single-particle detection (SPD) method with dark-field microscopy (DFM) has been widely concerned owing to its high signal-to-noise ratio, good spatiotemporal resolution, and ultralow sample consumption, providing more possibilities for the exploration of special chemical reactions [15]. In addition, single-particle imaging detection provides excellent sensitivity toward analytes and explains the unknown mechanism because each nanoparticle is considered to be the output of a separate signal response and tiny variations occurring on single-particles can be monitored with DFM [16,17,18]. DFM was used to real-time monitor the in situ growth of single Ag@Hg nanoalloys through a direct amalgamation of Ag nanoparticles with elemental mercury. A comprehensive understanding of the growth mechanism of nanoalloys was elucidated: first, Hg atoms were rapidly adsorbed onto Ag nanoparticles; second, the Hg atoms slowly diffuse into Ag nanoparticles; and third, further diffusion of Hg atoms leads to the formation of spherical Ag@Hg nanoalloys [16]. In recent years, many nanoprobes have been successfully used for Hg2+ detection and imaging with DFM. For example, Au nanoparticles modified with oligonucleotides have been developed to detect Hg2+ levels based on the DFM imaging colorimetric method. In the presence of Hg2+, free Au nanoparticles in the solution were bound with the fixed Au nanoparticles due to oligonucleotide hybridization, which results in an obvious color change from green to yellow under DFM [19]. Au nanorods were used as plasmonic transducers for the investigation of Hg2+ detection through associated blue shifts of the surface plasmon resonance peak wavelengths (λmax) were measured in individual nanorods by DFM [20]. A tetrahedral DNA-directed core-satellite nanostructure is used as the SERS probe to monitor the deteriorating mercury emissions using DFM combined with Raman spectroscopy [21]. The SPD with DFM has high sensitivity in the detection of Hg2+. However, the development of high-throughput statistics for Hg2+ color imaging detection applications has lagged. To date, the application of SPD with DFM has been proposed for other analytes imaging detection: sulfide, alkaline phosphatase (ALP), and permanganate (MnO4) [22,23]. In general, the SPD imaging detection method with DFM provides more possibilities for the exploration of special chemical reactions and brings great opportunities to develop analytical techniques.
Herein, we proposed a high-throughput single-particle color imaging approach for Hg2+ detection. As illustrated in Scheme 1, in the presence of ascorbic acid (AA), Hg2+ is reduced to Hg and forms Au–Hg amalgamate with Au nanoparticles, triggering the morphological change. Under DFM, the concave cube Au nanoparticles experienced a noticeable color variation from red to yellow, green, and finally blue. Encouraged by this result, we quantified the color variation of the single concave cube Au nanoparticles by splitting the image into RGB channels. The (G+B)/R ratio of a large number of individual particles was extracted to quantify Hg2+ concentration by Gaussian fitting. Each particle acted as a signal probe and performing Gaussian fitting can effectively avoid the interference of the ensemble averaging effect. A linear dynamic range of 10–2000 nM and the LOD of 1.857 nM were readily achieved. The high sensitivity of this single-particle color imaging was validated by detecting Hg2+ in river water, in the inner regions of human HepG2 cells. In summary, a high-throughput single-particle color imaging strategy exhibits promising potential in the field of bio-sensing.

2. Experimental Sections

2.1. Chemicals

Chloroauric acid (HAuCl4·3H2O), (3-aminopropyl) triethoxysilane (APTES), and ascorbic acid (AA) were purchased from Sigma-Aldrich (St. Louis, MI, USA). Hexadecyl trimethyl ammonium Bromide (CTAB), disodium hydrogen phosphate (Na2HPO4), sodium hydrogen phosphate (NaH2PO4), trisodium citrate (Na3C6H5O7), hydrogen peroxide (H2O2), sodium hydroxide (NaOH), hydrochloric acid (HCl), and nitric acid (HNO3) were bought from Beijing Chemical Reagents Company (Beijing, China). Copper sulfate pentahydrate (CuSO4·5H2O), sodium chloride (NaCl), potassium chloride (KCl), barium chloride (BaCl2), chromium chloride hexahydrate (CrCl·6H2O), calcium chloride (CaCl2), manganese sulfate (MnSO4), lead nitrate (Pb (NO3)2), zinc chloride (ZnCl2), ferric chloride (FeCl3), nickel dichloride (NiCl2), and mercuric nitrate (Hg (NO3)2) were purchased from Sinopharm Chemical Reagent Corporation (Shanghai, China). Dulbecco’s Modified Eagle’s medium (DMEM), fetal bovine serum, and 0.25% pancreatin were acquired from the U.S. Gibco Company (Paisley, UK). All glassware used was cleaned in a batch of freshly prepared aqua regia solution (HCl/HNO3; 3/1 v/v), and then rinsed thoroughly with H2O before use.

2.2. Apparatus

UV-Vis absorption spectra were recorded on a UV-1800 spectrometer (Shimadzu, Kyoto, Japan). Transmission electron microscopy (TEM) images were recorded via a Titan G2 60–300 microscopy (FEI, Thermo Fisher scientific, Hillsboro, OR, USA), and ImageJ software (Version 1.52k, NIH, Bethesda, MD, USA). Ultrapure water with a resistivity of 18.2 MΩ•cm was produced using a Millipore Milli-Q IQ7003 water purification system. A Nikon Ni-U upright microscope equipped with a 100-W halogen tungsten lamp, an oil immersion dark-field condenser (numerical aperture (NA) = 1.20–1.43) and a 40× Plan Fluor objective lens was used for DFM imaging. A DP73 single-chip true-color charge-coupled device (CCD) camera (DP80, Olympus, Tokyo, Japan) was mounted on the left side of the microscope top to capture images. The (G+B)/R ratio of the nanoparticles was processed with ImageJ software.

2.3. Preparation of Au Concave Cube Nanoparticles

Typically, 206 μL of HAuCl4 solution (1%) and 75 μL NaOH (1 M) were mixed with 10 mL of CTAB in a 50 mL serum bottle. The solution turns pale yellow after being shaken for 30 s. Then, 10 μL of 33% H2O2 was added to the mixture and the solution color changed from pale yellow to colorless. Next, 300 μL AA (0.1 M) was added, and the solution was kept undisturbed at a 30 °C water bath for 15 min. The solution color varied from colorless to light blue to greenish-blue, indicating the formation of nanoparticles. Subsequently, the excessive unreacted AA and free CTAB were removed by centrifugation twice (12,000 rpm, 5 min) and the nanoparticles were re-dispersed in ultrapure water. Finally, the concave cube Au nanoparticles colloid was stored at 4 °C before use.

2.4. Effect of AA, pH, and Reaction Time

The effect of AA, pH, and reaction time was investigated under UV-Vis. For determination of the optimal concentration of AA, briefly, Hg (NO3)2 solution (with the final concentrations of 200 μM) and 2 mL concave cube Au nanoparticles were added into a 5-mL centrifuge tube. Different concentration of AA solutions (with the final concentration of 10, 20, 30, 40, 50, 60, 70, 80, 90, 100, and 110 μM, respectively) was added to the above- mixed solutions. After gentle shaking, the UV-Vis spectra of the solutions were taken. To determine the optimal pH and reaction time, Hg (NO3)2 solution and 2 mL of concave cubic Au nanoparticles were added to a 5-mL centrifuge tube. After gentle shaking, the above procedures were repeated by replaced with different pH (5.5, 6.5, 7.5, 8.5, and 9.5) and reaction times, respectively. Then, UV-Vis spectra of the solutions were carried out.

2.5. Sensitive and Selective Detection of Hg2+ at the Single-Particle Level

For determination of Hg2+ sensitivity at the single-particle level under DFM, the concave cubic Au nanoparticles were first absorbed onto the surface of coverslips modified by APTES, followed by soaking in Hg2+ solution with a series of various concentrations (e.g., with a final concentration of 0, 10, 50, 200, 500, 1000, 2000, 4000, 20,000, and 40,000 nM, respectively). Subsequently, 80 μM AA was added separately to each above solution and incubated for 10 min. After that, the coverslips were reversely placed on a glass side and the color DFM images were captured with an exposure time of 200 ms. The (G+B)/R ratio by Gaussian fitting was calculated to assess Hg2+ content.
To investigate the selectivity toward Hg2+, the above procedures were repeated, but Hg2+ was replaced with 40,000 nM of other metal ions, including Cu2+, Na+, K+, Ba2+, Cr3+, Ca2+, Mn2+, Pb2+, and Zn2+, and followed by capturing their DFM images. All the experiments were repeated three times.

2.6. Hg2+ Detection in Industrial Water

To validate the real applications of the assays using concave cubic Au nanoparticles, industrial water was used as the analysis of a real sample, which was collected from laboratory wastewater on the campus of Central South University of Forestry and Technology. Each of the water samples was filtered through a 0.2-µm membrane to remove the potential aggregates and impurities. Subsequently, the coverslips modified by concave cubic Au nanoparticles were soaked in a water sample containing AA (80 µM) for 10 min. Then, the coverslips were reversely placed on a glass side for DFM imaging. For each water sample, three independent experimental tests were performed.

3. Results and Discussion

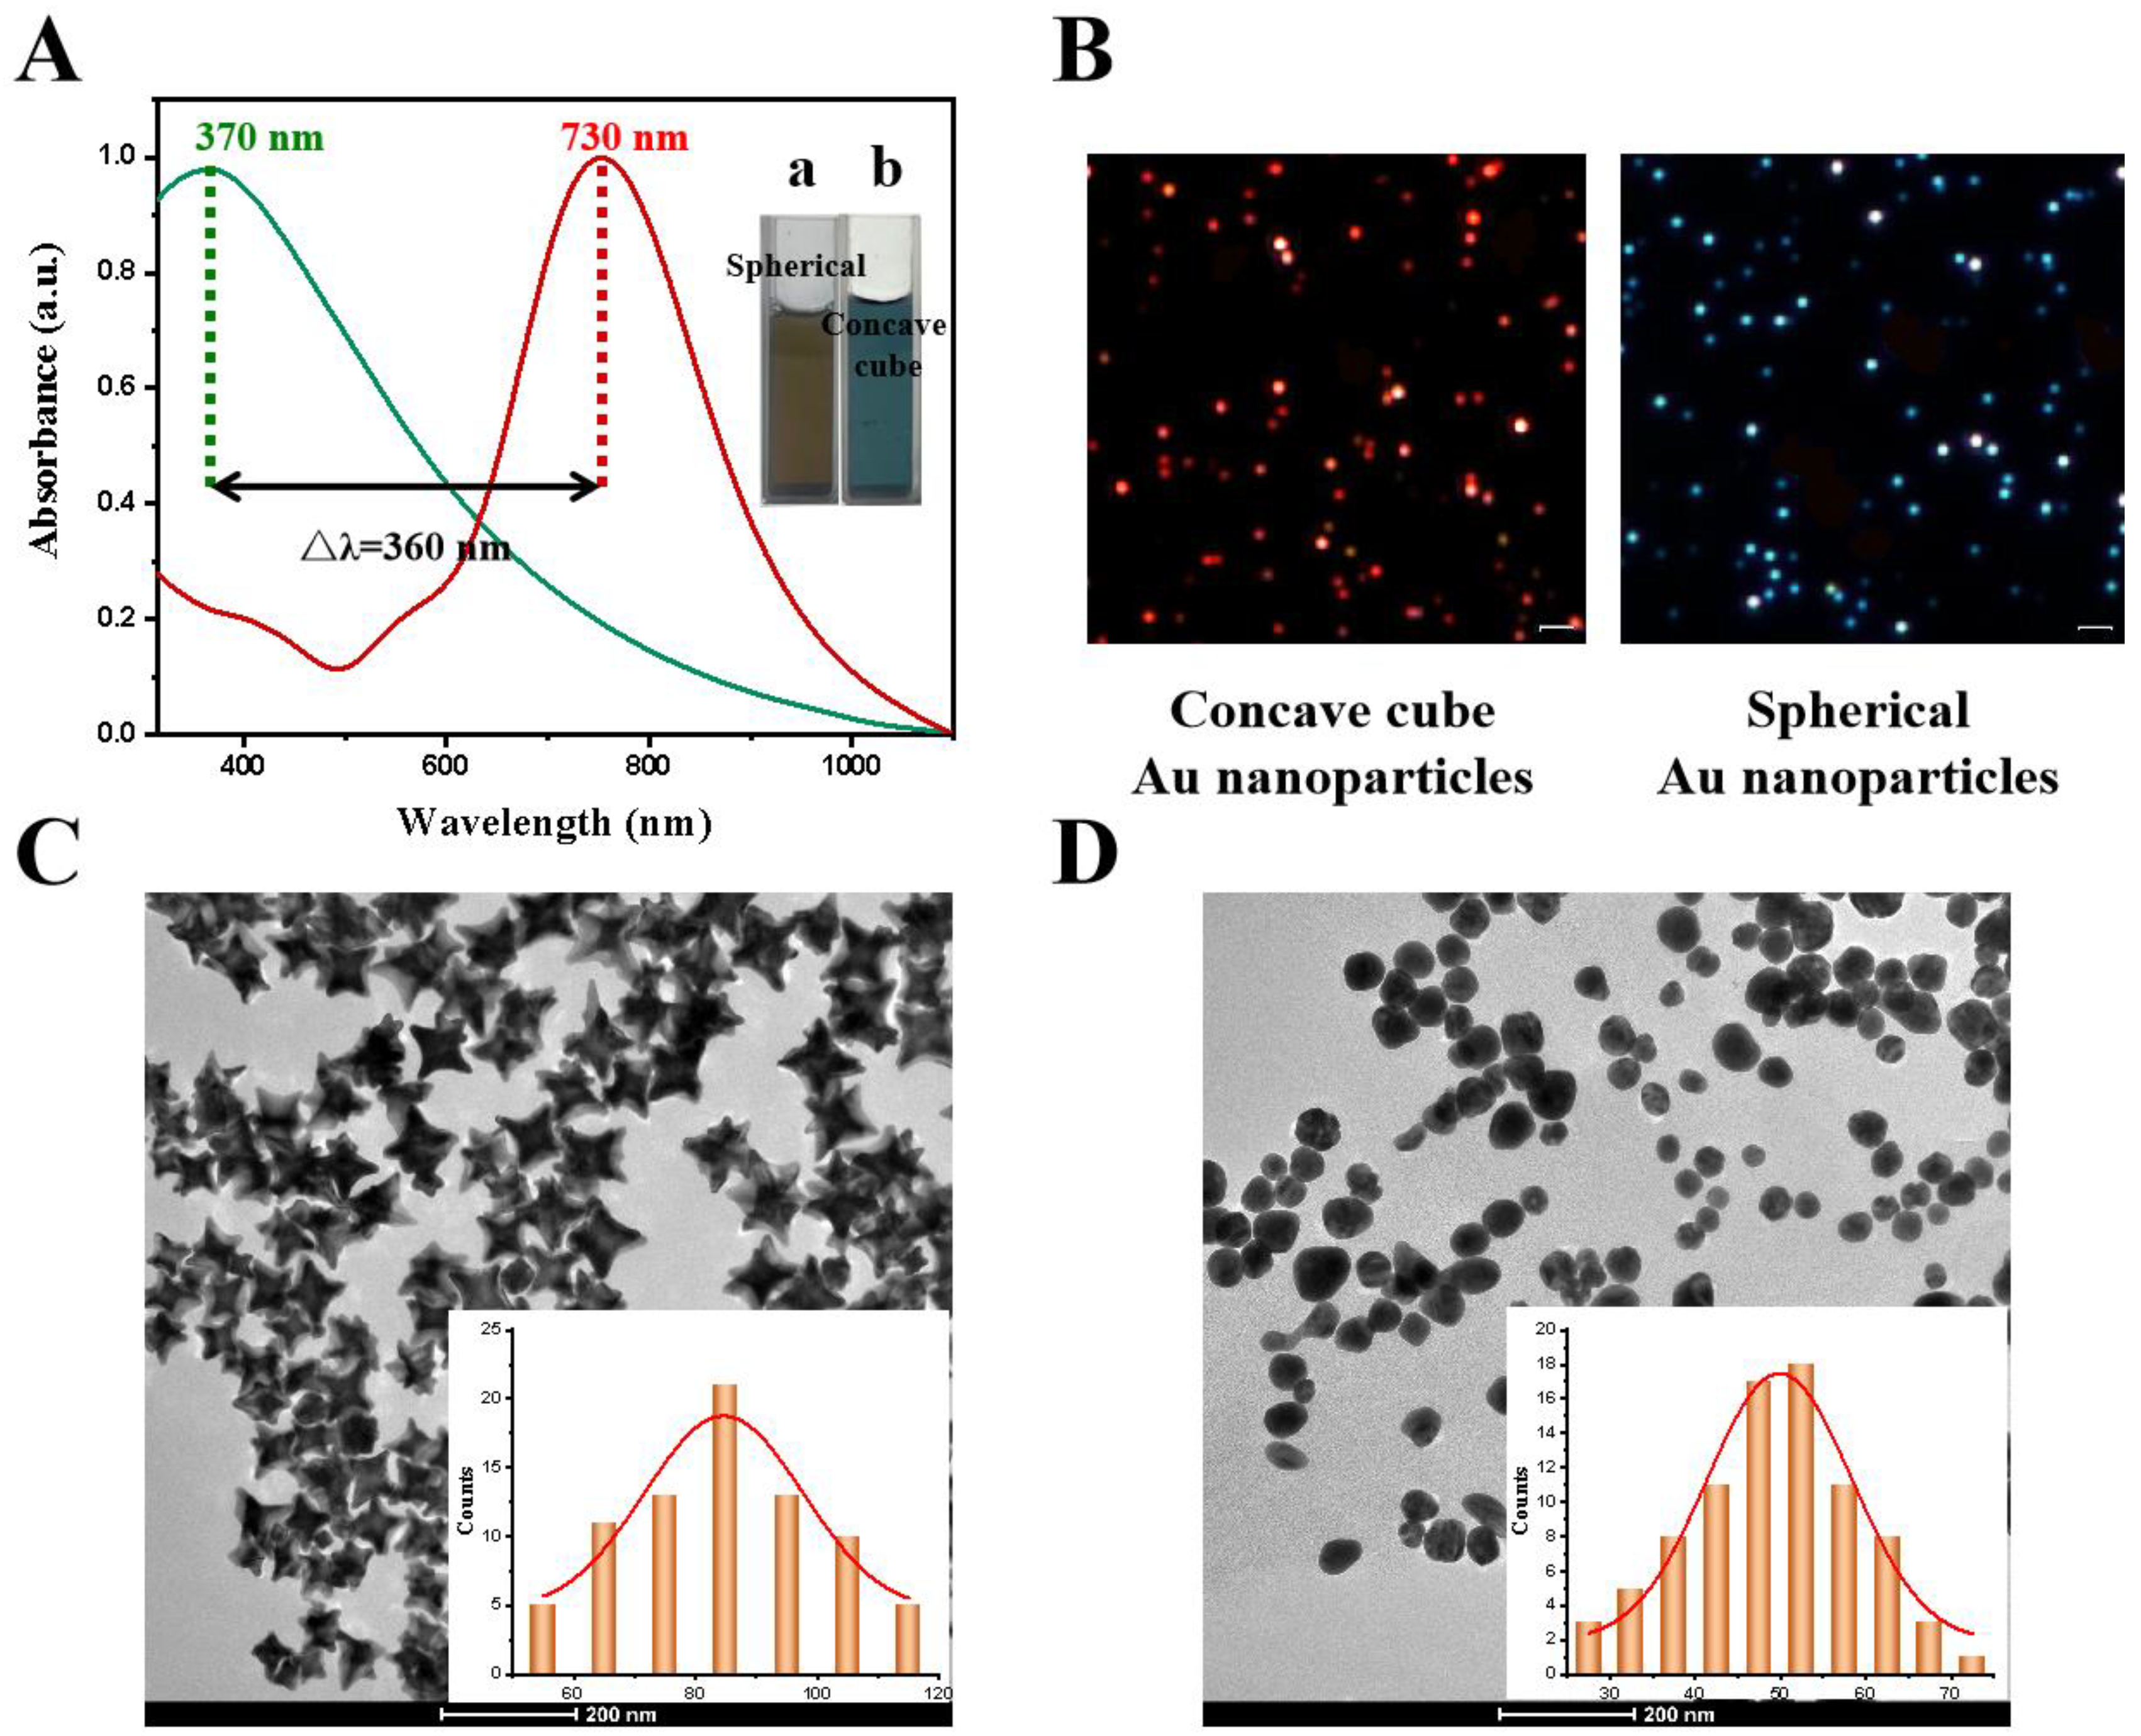
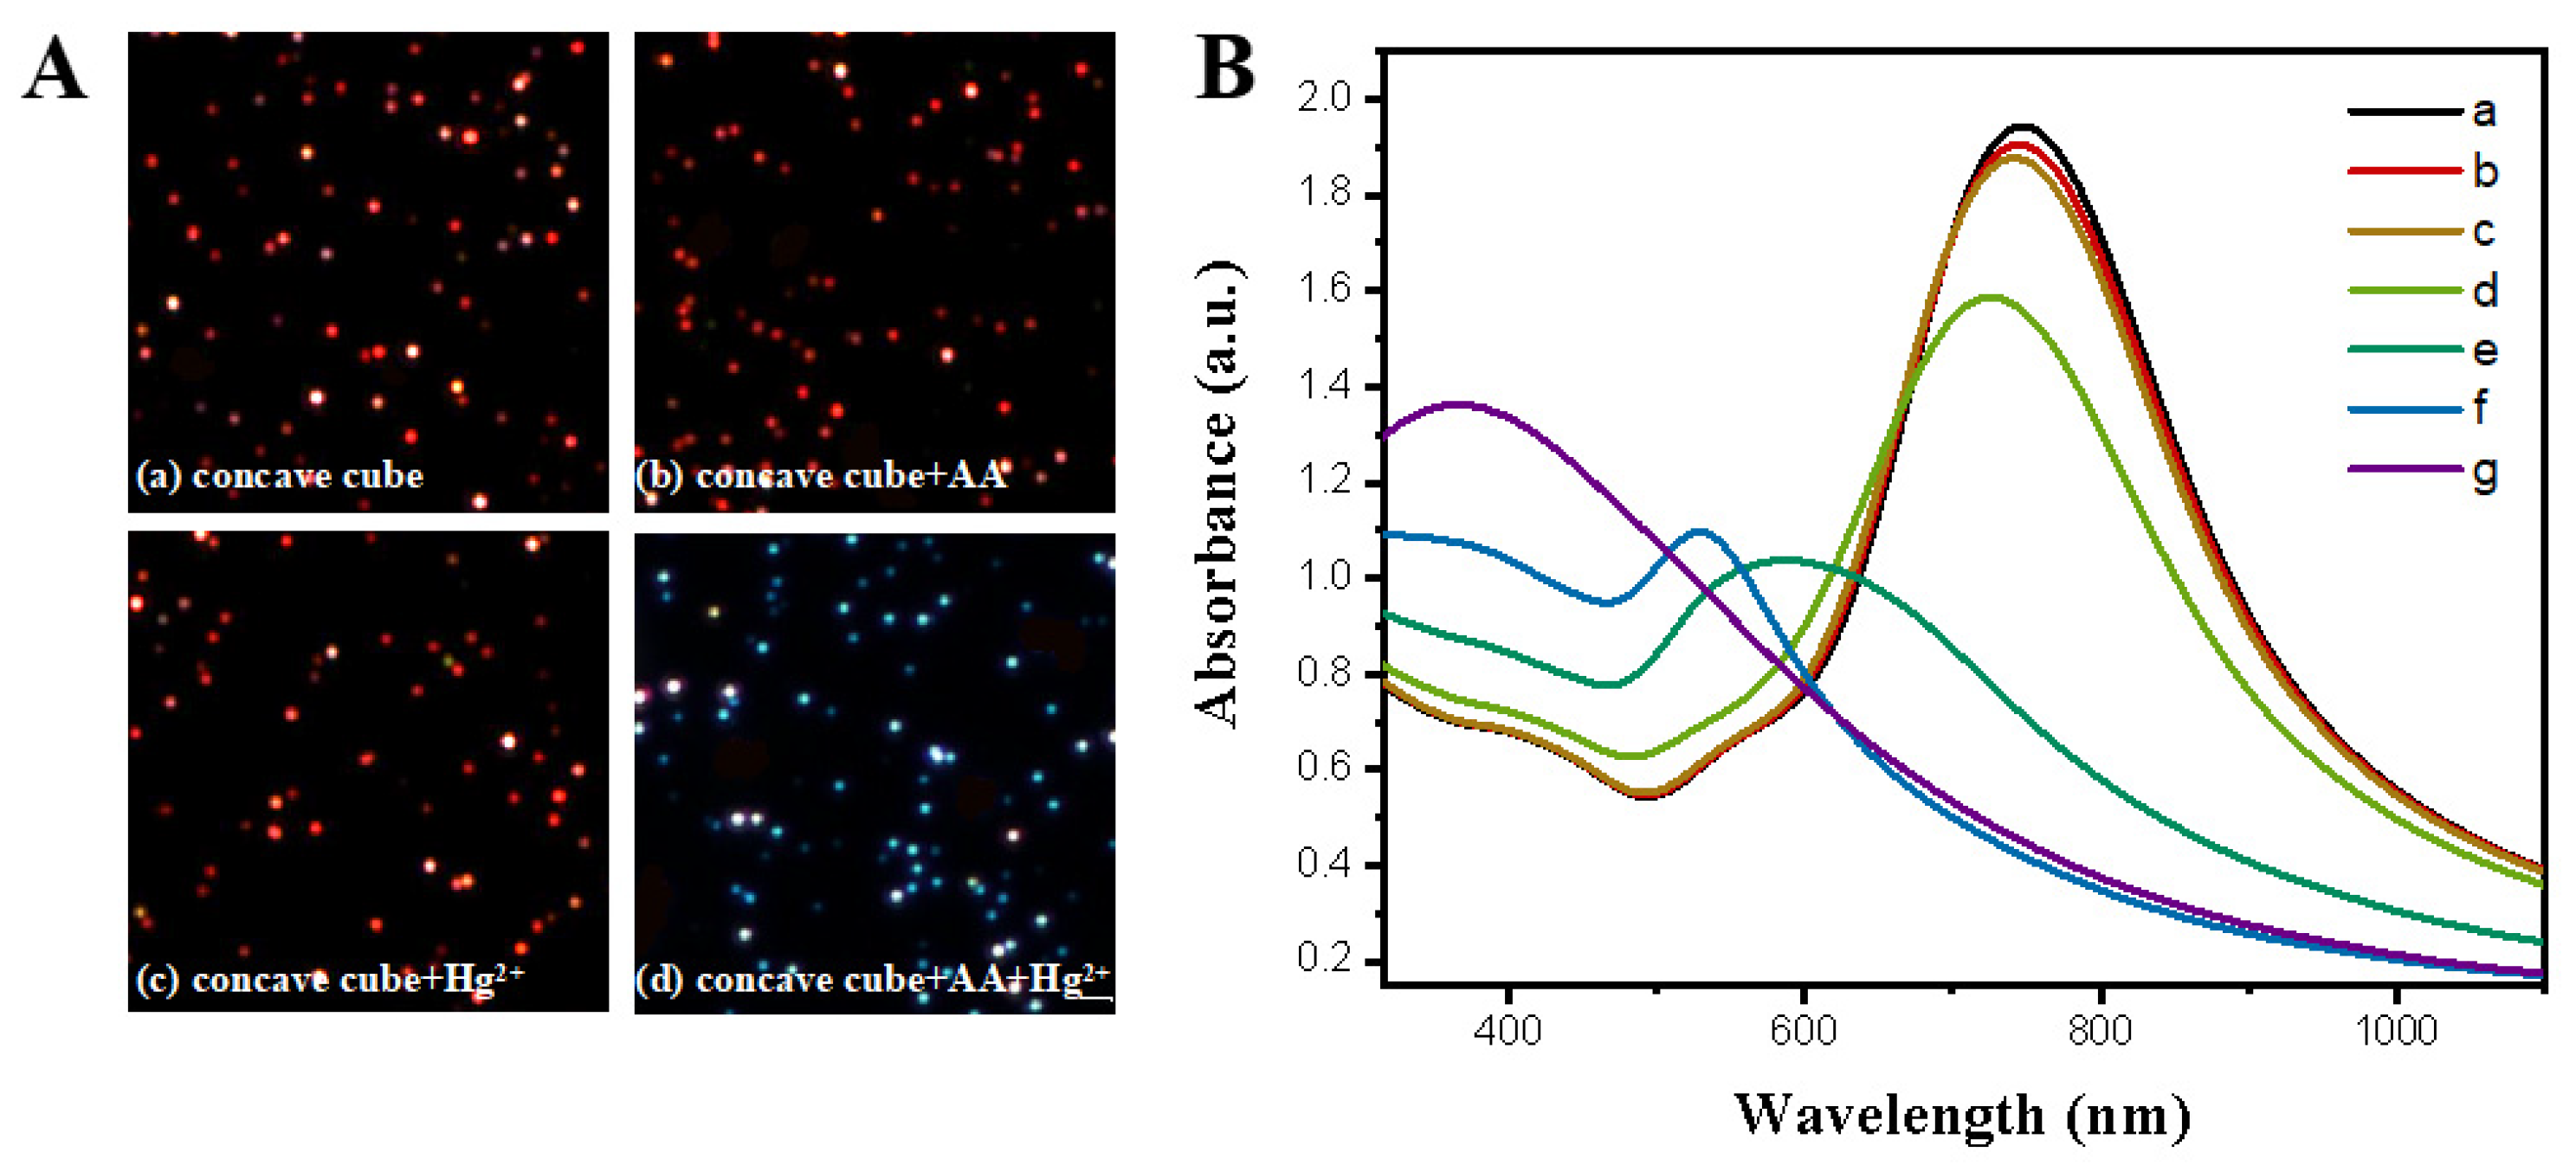
3.1. Characterization of Concave Cubic Au Nanoparticles and the Feasibility of the Hg2+ Detection

In this work, concave cubic Au nanoparticles were employed as the optical probes to monitor Hg2+ content under DFM; thus, the property of the as-obtained concave cubic Au nanoparticles was first characterized. Concave cubic Au nanoparticles have an obvious absorption peak at 730 nm (Figure 1A, the red curve). The solution color is greenish-blue, as shown in the photo (b) (Figure 1A). In the presence of AA and Hg2+, the absorption peak of concave cubic Au nanoparticles solution exhibited a blue shift and was located at 370 nm (Figure 1A, the green curve). The blue shift is mainly due to the adsorption of Hg0 onto Au nanoparticles surfaces that alter the surrounding dielectric constant [24]. We demonstrated for the first time that the LSPR of Au–Hg amalgamates below 400 nm. Most Au–Hg amalgamates nanoprobes have been developed based on the following three models: the LSPR of Au nanostars, Au nanorods, and Au nanoprisms after amalgamation were shifting to 520 nm, 473 nm, and 620 nm, respectively [25,26,27]. Correspondingly, the color of the solution turned from greenish-blue to brownish yellow, as shown in photo (a), indicating that concave cubic Au nanoparticles have undergone a morphological change (Figure 1A). Under DFM, concave cubic Au nanoparticles exhibited red color. However, after the addition of AA and Hg2+, the color of the nanoparticles turns blue (Figure 1B). The concave cubic Au nanoparticles before and after exposure to AA and Hg2+ were further characterized with TEM, as shown in Figure 1C,D. TEM images show that the concave cubic Au nanoparticles were uniform in morphology with an average size of 85 ± 1.9 nm, and the Au nanoparticles after the addition of AA and Hg2+ displayed good spherical structure with a diameter of 52 ± 1.38 nm. In the presence of AA, it allows reduction of Hg2+ to Hg0 that subsequently undergoes amalgamation with the concave cubic Au nanoparticles, leading the Au nanoparticles to undergo a morphological change from concave to spherical.
Based on the above results, we aim to develop a high-throughput single-particle color imaging method for Hg2+ detection via amalgamation-mediated shape transition of concave cube Au nanoparticles. The feasibility of Hg2+ detection was investigated by imaging single nanoparticles under different conditions (Figure 2A). Under DFM, single concave cube Au nanoparticles exhibited bright red. The presence of either AA (final concentration 80 μM) or the Hg2+ (final concentration 40 μM), only, did not induce any color change of the concave cube Au nanoparticles. In the presence of 80 μM AA and 40 µM Hg2+, the color of the concave cube Au nanoparticles turned blue. This result is also supported by the UV-Vis results, as shown in Figure 2B. The introduction of AA alone (final concentration 80 μM) to concave cube Au nanoparticles solution did not induce any significant change in the UV-Vis absorption spectrum (Figure 2B, b curve). The presence of Hg2+ alone (final concentration 200 μM) did not lead to a change in UV-Vis absorbance spectrum (Figure 2B, c curve). Nevertheless, when the concentration of Hg2+ is 5 µM in the presence of 80 μM AA, a single UV-Vis absorption peak was blue-shifted (Figure 2B, d curve). With increasing the concentration of Hg2+, the absorption spectrum of concave cube Au nanoparticles changed more significantly (Figure 2B, e curve). When the concentration of Hg2+ is 100 µM in the presence of 80 μM AA, a single UV-Vis absorption peak at 532 nm was observed (Figure 2B, f curve). If the concentration of Hg2+ is 200 µM in the presence of 80 μM AA, the UV-Vis absorbance underwent an increase, accompanied by a blue shift from 532 to 370 nm (Figure 2B, g curve). The results illustrate that we can design a high-throughput single-particle color imaging approach for Hg2+ detection via amalgamation-mediated shape transition of concave cube Au nanoparticles under DFM.

3.2. Optimization of Experimental Conditions for Hg2+ Detection

To obtain the best response performance of concave cube Au nanoparticles for Hg2+ detection, key parameters, including pH, the concentration of AA, and reaction time, were systematically optimized, as shown in Figure 3. The Δλmax shift (nm) (the blue-shift distance of the LSPR) was applied to evaluate the response of concave cube Au nanoparticles for Hg2+ quantitation under various conditions in this study. Firstly, we explored the suitable concentration of AA in bulk solution. This was achieved by increasing AA concentration from 10 to 110 μM while keeping other parameters constant. As shown in Figure 3A, the UV-Vis absorption peak of concave cube Au nanoparticles gradually blue-shifted with the increase in AA concentration, a plateau was gradually achieved until the amount of AA increased to 80 μM. When the concentration of AA is higher than 80 μM, the Δλmax shift (nm) did not change further, mainly because Hg2+ was reduced completely by the AA. Secondly, the solution gradient of pH values from 5.5 to 7.5 (5.5, 6.0, 6.5, 7.0 and 7.5) were tested for Hg2+ sensing. The concave cube Au nanoparticles were found to have the greatest response to Hg2+ at pH 6.5 (Figure 3B). At pH < 6.5, concave cube Au nanoparticles became unstable, while at higher pH values, the formation of mercuric hydroxides can cause detection effects. Finally, a reaction time was explored (Figure 3C). When AA and Hg2+ were introduced in concave cube Au nanoparticles solution, the UV-Vis absorption peak gradually blue-shifted with reaction time prolongs and a steady-state was achieved at ∼10 min. Based on the above results, the optimal analytical conditions for quantitation of Hg2+ are 80 μM AA, pH at 6.5, and the reaction time of 10 min.

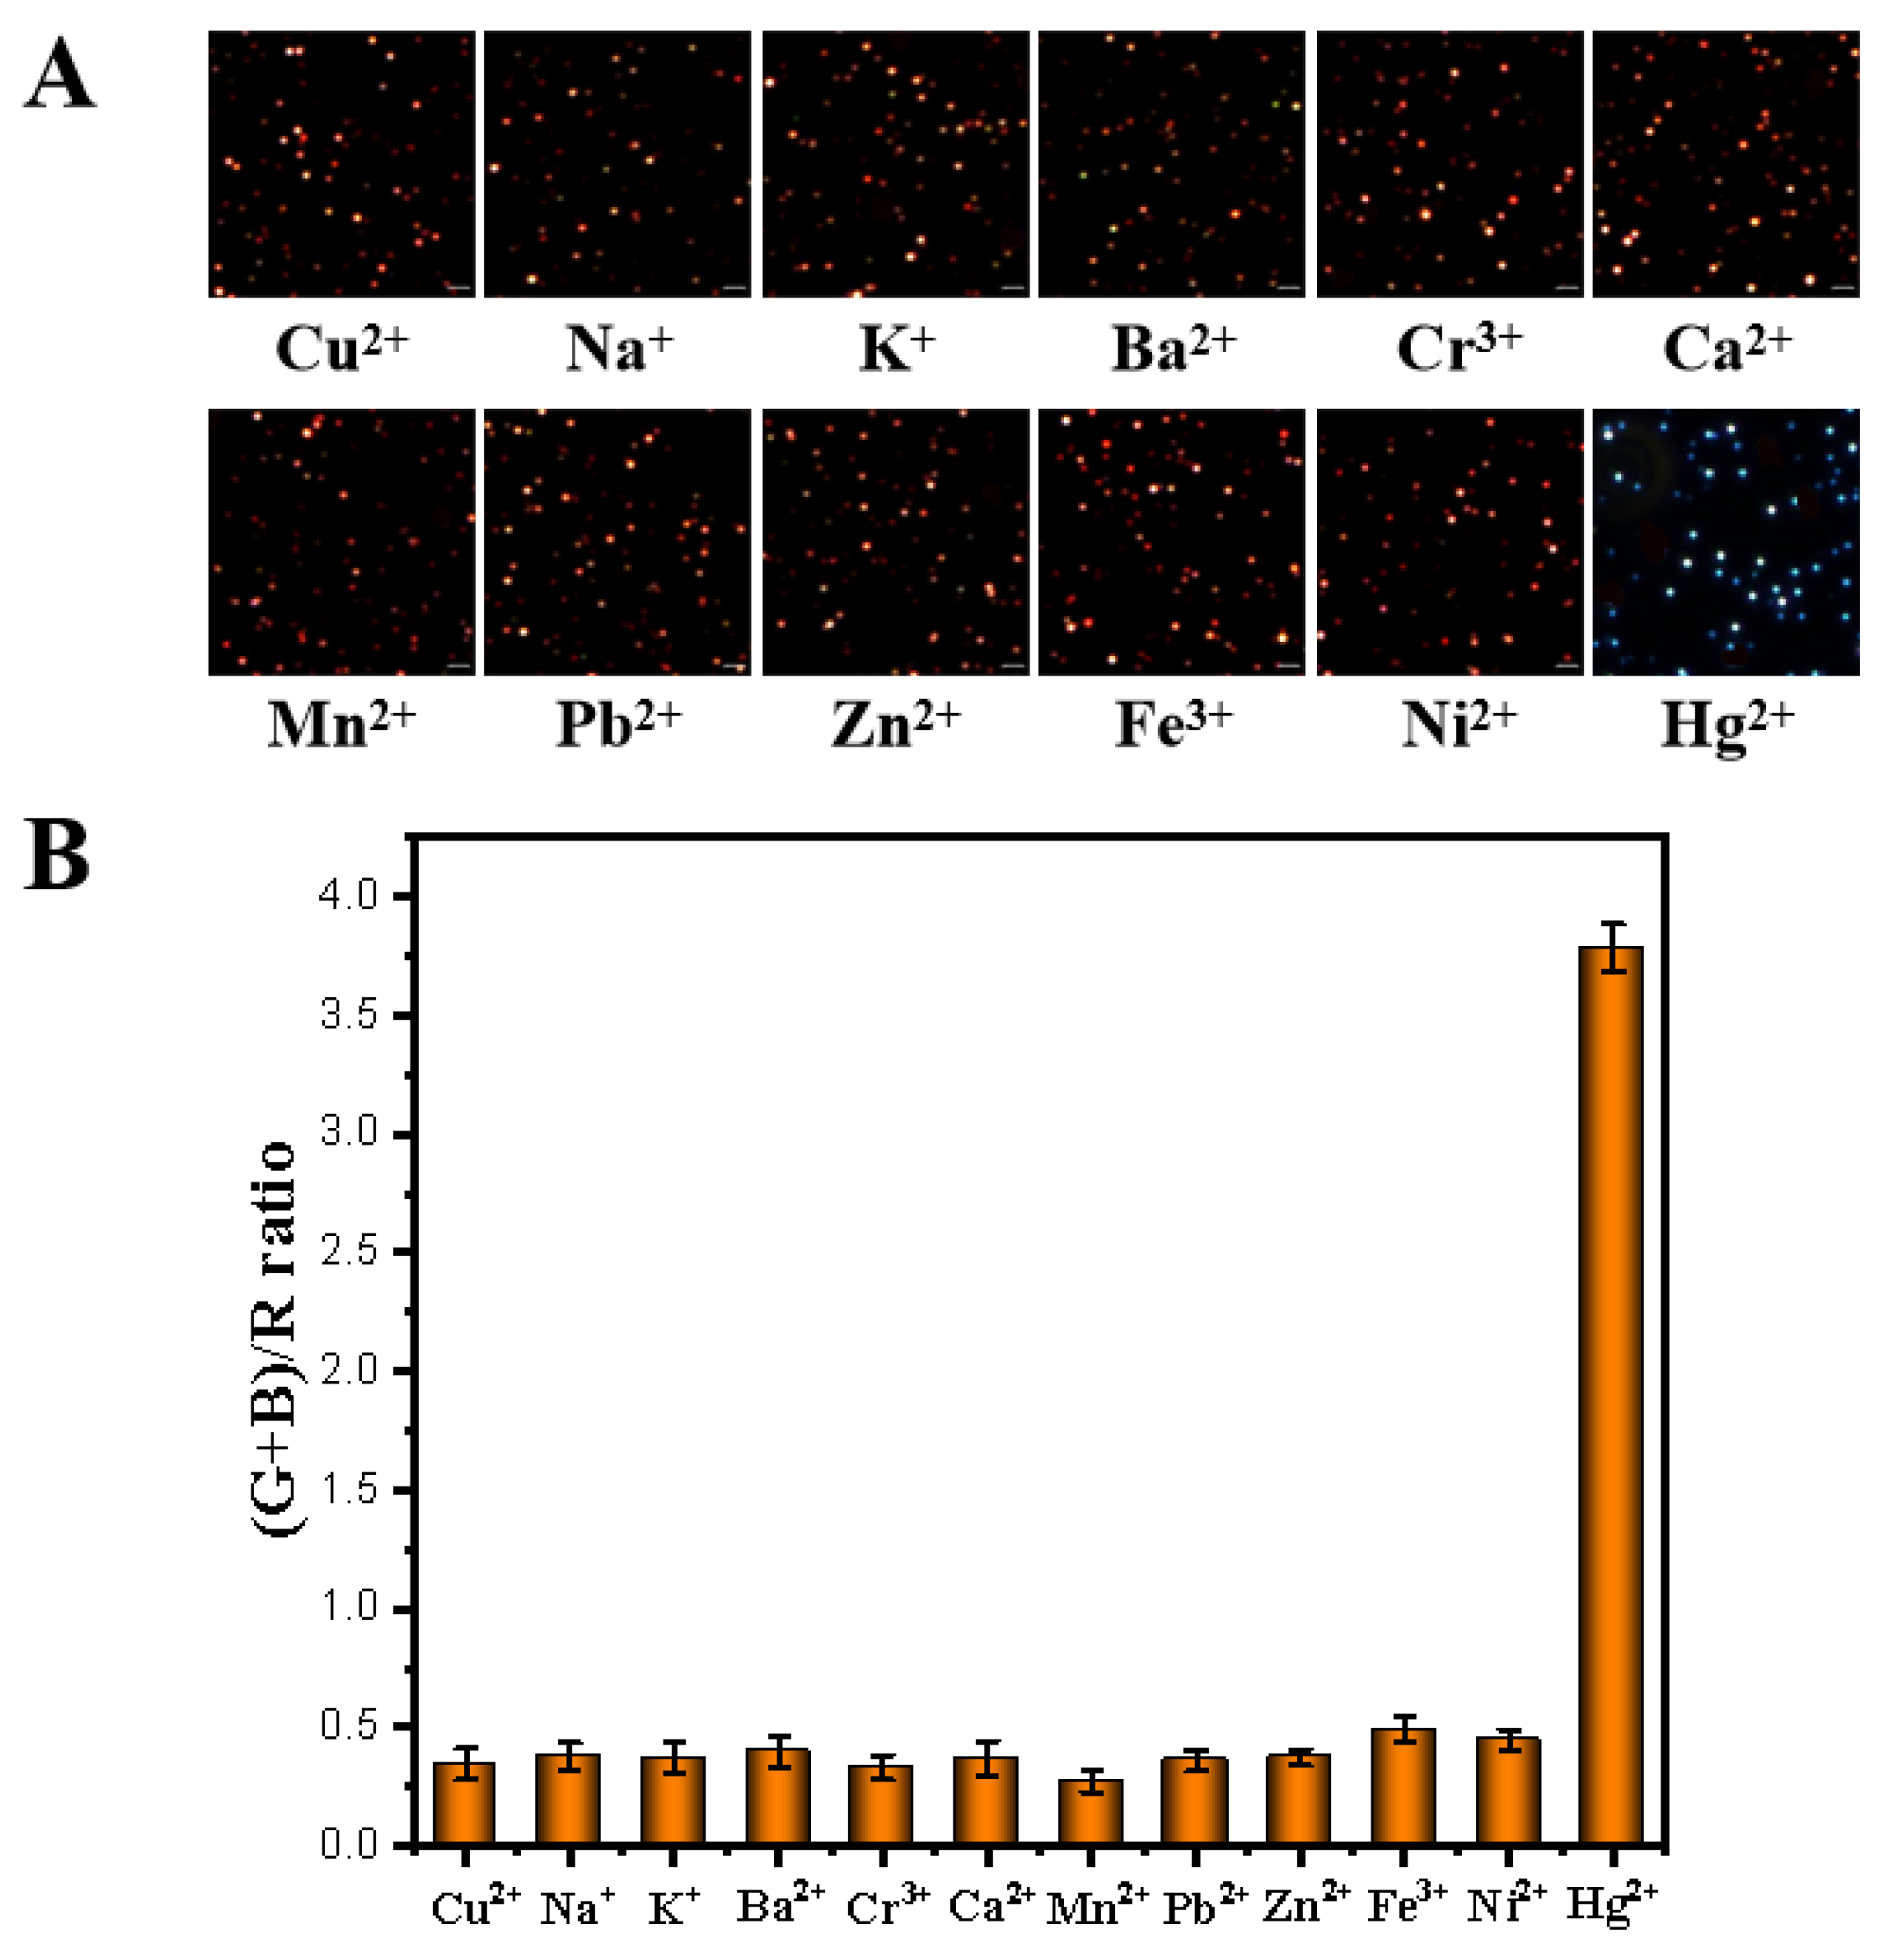
3.3. The Sensitive and Selective Detection of Hg2+ at the Single-Particle Level

We designed a sensitive approach for Hg2+ detection by high-throughput single-particle color imaging. Although the particles exhibit a noticeable color change from red to yellow, green, and finally blue under DFM, direct determination of color alteration with the naked eye may introduce inevitable artificial error. To digitalize the color variation of nanoparticles, we split the color images into the three channels, red (R), green (G), and blue (B), and the (G+B)/R ratio was extracted to assess color variation. As shown in Figure 4A, concave cube Au nanoparticles exhibited a noticeable red color in the original DFM image and exhibited a noticeable scattering signal in the red and green channel, the spectral response of the color charge-coupled device (CCD) camera in the red and green channel was close to the UV-Vis absorption wavelength of concave cube Au nanoparticles at 730 nm. However, concave cube Au nanoparticles after exposure to Hg2+ and AA displayed evident blue color in the original DFM image and the scattering signals in the green and blue channels were enhanced. This was reasonable because the addition of Hg2+ and AA led to the LSPR gradually blue-shift of concave cube Au nanoparticles solution, amalgamation led to the shape-evolution of nanoparticles, resulting in the transformation of nanoparticles into spherical nanoparticles located at 370 nm, the results correspond to CCD in the green and blue channel. On this color variation basis, an accurate high-throughput single-particle color imaging strategy can be readily established to monitor the Hg2+ by statistically calculating the (G+B)/R ratio with a Gaussian fitting [28].
Single-particle imaging provides higher sensitivity toward analytes compared to traditional bulk measures because each nanoparticle is considered to be the output of a separate signal response and tiny variations occurring on single-particles can be monitored with DFM [15,22]. Under the optimal conditions, we imaged the color variation of concave cube Au nanoparticles with increasing Hg2+ concentrations in the range of 0–4000 nM and the (G+B)/R ratio Gaussian fitting was obtained to quantify Hg2+ concentration (Over 500 particles for statistics). Figure 5A shows a typical DFM image of the concave cube Au nanoparticles in the range of Hg2+ concentration 0–4000 nM, concave cube Au nanoparticles exhibited a uniform red color and changed gradually from red to green and blue color, indicative of the accumulative formation of Au–Hg on the surface of the nanoparticles. The color variation appeared uniform for most of the particles, suggesting that they had similar reactivity toward Hg2+ and the single-particle color imaging via amalgamation-mediated shape transition of concave cube Au nanoparticles were indeed successful. A small amount of green color can be distinguished when the Hg2+ concentration is higher than 500 nM and all particles turned blue when the Hg2+ concentration was above 4000 nM. By determining the (G+B)/R ratio and Gaussian fitting, a dynamic range from 0 to 40,000 μM was obtained in Figure 5B and the corresponding linear equation of (G+B)/R = 0.000718 + 0.381 × CHg2+ was constructed when Hg2+ concentration is 10–2000 nM (Figure 5C), with a correlation coefficient (R2) of 0.972. The LOD was 1.857 nM (3σ/slope, where σ is the standard deviation of five blank samples). Taken together, the experimental results by using high-throughput single-particle color imaging sensing could be accomplished with the ease of RGB calculation, which is much better than those from colorimetric and fluorescence methods in the linear detection range and LOD (Table 1) [29,30].
To validate the feasibility of our proposed method for practical applications, the selectivity experiment was performed by replacing Hg2+ with other metal ions, including Cu2+, Na+, K+, Ba2+, Cr3+, Ca2+, Mn2+, Pb2+, Zn2+, Fe3+, and Ni2+, followed by capturing their DFM images. As shown in Figure 6A, no obvious color change was observed after adding other metal ions as Hg2+ did, confirmed by the DFM images. The (G+B)/R ratio further illustrated that Au formed alloys with Hg more strongly when compared to other metals (Figure 6B). Furthermore, most metal ions cannot be reduced by AA at pH 5.0, but can form chelates with some of them to further reduce their interaction with Au nanoparticles [31]. Therefore, due to specific interaction, our assay demonstrated high selectivity to Hg2+, showing the good application in the real sample test.

3.4. Real Sample Analysis in Industrial Water

To demonstrate the potential applicability of this strategy for real sample assay, we first investigated the Hg2+ content in the industrial wastewater sample. Different Hg2+ concentrations (concentrations: 0, 10, 20, and 40 μg/L, respectively) were then added to the river water samples solution containing concave cube Au nanoparticles and AA (80 μM) to obtain recovery of the spiked Hg2+. The Hg2+ concentrations in the industrial wastewater sample (each with three measurements) were found to be 0.376 μg/L and the sample recovery efficiencies between 102.8 and 107.9% were obtained as depicted in Table 2, demonstrating the reliability of this method for real biological samples.

4. Conclusions

In conclusion, we developed a high-throughput single-particle color imaging strategy under DFM for the detection of Hg2+ using concave cube Au nanoparticles as optical probes. This strategy is based on the quantification of color variation of the single concave cube Au nanoparticles. In the presence of AA, the Hg2+ could be reduced to Hg0, which forms Au–Hg amalgamate resulting in a blue shift of the LSPR of nanoparticles. The amalgam reaction was confirmed by TEM and UV-Vis. Under DFM, the concave cube Au nanoparticles undergo an obvious color change from red to yellow, green, and finally blue with the increasing concentration of Hg2+. We separated the DFM images into R, G, and B channels and calculated the (G+B)/R ratio to digitize the color change, which is linearly related to Hg2+ concentration. A linear range from 10 to 2000 nM (R2 = 0.989) and a limit of detection of 1.875 nM were achieved, indicating the high sensitivity of the proposed strategy. In the river water sample assay, recoveries between 102.8 and 107.9% were obtained. Furthermore, we detected the Hg2+ level at the inner regions of human HepG2 cells by full use of resolution advantages and the content of Hg2+ entering was different attributed to the complex matrix of cells. Therefore, a high-throughput single-particle color imaging strategy provides a powerful platform for sensing and is expected to be extended to other biomolecule assays in clinical samples in the future.

Author Contributions

Conceptualization, H.Z. and W.X.; methodology, H.Z., W.X. and T.Y.; software, H.Z.; validation, H.Z., M.S. and Y.Y.; formal analysis, H.Z.; investigation, M.S.; resources, T.Y.; data curation, T.Y.; writing—original draft preparation, H.Z. and Y.X.; writing—review and editing, Q.L.; visualization, Y.X. and Y.Y.; supervision, H.Z.; project administration, Y.X.; funding acquisition, Q.L. and K.Y. All authors have read and agreed to the published version of the manuscript.

Funding

The research leading to these results received funding from the Key R&D Plan of Zibo City Integration Program (2021SNPT0007), and Storage and Processing Post of Vegetable Innovation Team in Modern Agricultural Industry Technology System of Shandong Province (SDAIT-05-14).

Institutional Review Board Statement

Not applicable.

Data Availability Statement

The data presented in this study are available upon reasonable request from the corresponding author.

Acknowledgments

The authors would like to thank Fengli Yue and Metha Wanapat, who supported us with the writing and editing in this paper.

Conflicts of Interest

The authors declare no conflict of interest.

References

  1. Subedi, S.; Neupane, L.N.; Yu, H.; Lee, K.-H. A new ratiometric fluorescent chemodosimeter for sensing of Hg2+ in water using irreversible reaction of arylboronic acid with Hg2+. Sens. Actuators B Chem. 2021, 338, 129814. [Google Scholar] [CrossRef]
  2. Vanjare, B.D.; Mahajan, P.G.; Ryoo, H.-I.; Dige, N.C.; Choi, N.G.; Han, Y.; Kim, S.J.; Kim, C.-H.; Lee, K.H. Novel rhodamine based chemosensor for detection of Hg2+: Nanomolar detection, real water sample analysis, and intracellular cell imaging. Sens. Actuators B Chem. 2021, 330, 129308. [Google Scholar] [CrossRef]
  3. Wang, X.; Xu, C.; Wang, Y.; Li, W.; Chen, Z. Electrochemical DNA sensor based on T-Hg-T pairs and exonuclease III for sensitive detection of Hg2+. Sens. Actuators B Chem. 2021, 343, 130151. [Google Scholar] [CrossRef]
  4. Moniruzzaman, M.; Lee, S.; Park, Y.; Min, T.; Bai, S.C. Evaluation of dietary selenium, vitamin C and E as the multi-antioxidants on the methylmercury intoxicated mice based on mercury bioaccumulation, antioxidant enzyme activity, lipid peroxidation and mitochondrial oxidative stress. Chemosphere 2021, 273, 129673. [Google Scholar] [CrossRef] [PubMed]
  5. Akkemik, E.; Taser, P.; Bayindir, A.; Budak, H.; Ciftci, M. Purification and characterization of glutathione S-transferase from turkey liver and inhibition effects of some metal ions on enzyme activity. Environ. Toxicol. Pharmacol. 2012, 34, 888–894. [Google Scholar] [CrossRef]
  6. Chen, X.; Fang, J.; Liao, S.; Mia, R.; Li, W.; Gao, C.; Tian, D.; Li, W. A smart chitosan nonwoven fabric coated with coumarin-based fluorophore for selective detection and efficient adsorption of mercury (II) in water. Sens. Actuators B Chem. 2021, 342, 130064. [Google Scholar] [CrossRef]
  7. Boening, D.W. Ecological effects, transport, and fate of mercury: A general review. Chemosphere 2000, 40, 1335–1351. [Google Scholar] [CrossRef]
  8. Bendl, R.F.; Madden, J.T.; Regan, A.L.; Fitzgerald, N. Mercury determination by cold vapor atomic absorption spectrometry utilizing UV photoreduction. Talanta 2006, 68, 1366–1370. [Google Scholar] [CrossRef]
  9. Song, Y.; Ma, Q.; Cheng, H.; Liu, J.; Wang, Y. Simultaneous enrichment of inorganic and organic species of lead and mercury in pg L−1 levels by solid phase extraction online combined with high performance liquid chromatography and inductively coupled plasma mass spectrometry. Anal. Chim. Acta 2021, 1157, 338388. [Google Scholar] [CrossRef]
  10. Xing, Y.; Han, J.; Wu, X.; Pierce, D.T.; Zhao, J.X. Aggregation-based determination of mercury (II) using DNA-modified single gold nanoparticle, T-Hg (II)-T interaction, and single-particle ICP-MS. Microchim. Acta 2020, 187, 56. [Google Scholar] [CrossRef]
  11. Butler, O.T.; Cairns, W.; Cook, J.M.; Davidson, C.M. Atomic spectrometry update—A review of advances in environmental analysis. J. Anal. At. Spectrom. 2015, 35, 9–53. [Google Scholar]
  12. Hsu, I.-H.; Hsu, T.-C.; Sun, Y.-C. Gold-nanoparticle-based graphite furnace atomic absorption spectrometry amplification and magnetic separation method for sensitive detection of mercuric ions. Biosens. Bioelectron. 2011, 26, 4605–4609. [Google Scholar] [CrossRef] [PubMed]
  13. Sun, Z.; Du, J.; He, K.; Jing, C. T-Hg2+-T-based satellite structured surface enhanced Raman scattering sensor for Hg2+ detection. J. Raman Spectrosc. 2018, 49, 1575–1580. [Google Scholar] [CrossRef]
  14. Mihai, L.; Mihalcea, R.; Tomescu, R.; Paun, C.; Cristea, D. Selective Mid-IR metamaterial-based gas sensor system: Proof of concept and performances tests. Nanomaterials 2022, 12, 1009. [Google Scholar] [CrossRef]
  15. Hu, J.; Zhang, T.; Chen, Y.; Xu, P.; Zheng, D.; Li, X. Area-Selective, In-situ growth of Pd-modified ZnO nanowires on MEMS hydrogen sensors. Nanomaterials 2022, 12, 1001. [Google Scholar] [CrossRef]
  16. Yue, L.; Cheng, Z.H. Real-time dark-field scattering microscopic monitoring of the in situ growth of single Ag@Hg nanoalloys. ACS Nano 2013, 7, 11026–11034. [Google Scholar]
  17. Xie, T.; Jing, C.; Ma, W.; Ding, Z.; Gross, A.J.; Long, Y.T. Real-time monitoring for the morphological variations of single gold nanorods. Nanoscale 2014, 7, 511–517. [Google Scholar] [CrossRef]
  18. Wang, F.; Li, Y.; Han, Y.; Ye, Z.; Wei, L.; Luo, H.-B.; Xiao, L. Single-particle enzyme activity assay with spectral-resolved dark-field optical microscopy. Anal. Chem. 2019, 91, 6329–6339. [Google Scholar] [CrossRef]
  19. Liu, X.; Wu, Z.; Zhang, Q.; Zhao, W.; Zong, C.; Gai, H. Single gold nanoparticle-based colorimetric detection of picomolar mercury ion with dark-field microscopy. Anal. Chem. 2016, 88, 2119–2124. [Google Scholar] [CrossRef]
  20. Schopf, C.; Martín, A.; Iacopino, D. Plasmonic detection of mercury via amalgam formation on surface-immobilized single Au nanorods. Sci. Technol. Adv. Mater. 2017, 18, 60–67. [Google Scholar] [CrossRef] [Green Version]
  21. Feng, N.; Shen, J.; Li, C.; Zhao, Q.; Fodjo, E.K.; Zhang, L.; Chen, S.; Fan, Q.; Wang, L. Tetrahedral DNA-directed core-satellite assembly as SERS sensor for mercury ions at the single-particle level. Analyst 2022, 147, 1866–1872. [Google Scholar] [CrossRef] [PubMed]
  22. Hao, J.; Xiong, B.; Cheng, X.; He, Y.; Yeung, E.S. High-throughput sulfide sensing with colorimetric analysis of single Au-Ag core-shell nanoparticles. Anal. Chem. 2014, 86, 4663–4667. [Google Scholar] [CrossRef] [PubMed]
  23. Ye, Z.; Weng, R.; Ma, Y.; Wang, F.; Liu, H.; Wei, L.; Xiao, L. Label-free, single-particle, colorimetric detection of permanganate by GNPs@ Ag core-shell nanoparticles with dark-field optical microscopy. Anal. Chem. 2018, 90, 13044–13050. [Google Scholar] [CrossRef] [PubMed]
  24. Petrucci, R.; Bortolami, M.; Di Matteo, P.; Curulli, A. Gold nanomaterials-based electrochemical sensors and biosensors for phenolic antioxidants detection: Recent advances. Nanomaterials 2022, 12, 959. [Google Scholar] [CrossRef] [PubMed]
  25. Xu, D.; Yu, S.; Yin, Y.; Wang, S.; Lin, Q.; Yuan, Z. Sensitive colorimetric Hg2+ detection via amalgamation-mediated shape transition of gold nanostars. Front. Chem. 2018, 6, 566. [Google Scholar] [CrossRef]
  26. Schopf, C.; Wahl, A.; Martín, A.; O’Riordan, A.; Iacopino, D. Direct Observation of Mercury Amalgamation on Individual Gold Nanorods Using Spectroelectrochemistry. J. Phys. Chem. C 2016, 120, 19295–19301. [Google Scholar] [CrossRef]
  27. Ling, R.; Zhang, Q.; Ren, H.; Tursen, J.; Bi, J.; Wu, Z.; Qin, W.; Zhang, C. Label-free, sensitive colorimetric detection of mercury(II) by target-disturbed in situ seeding growth of gold triangular nanoprisms. Nanotechnology 2020, 31, 225501. [Google Scholar] [CrossRef]
  28. Chen, S.; Wang, W.; Yan, M.; Tu, Q.; Chen, S.-W.; Li, T.; Yuan, M.-S.; Wang, J. 2-Hydroxy benzothiazole modified rhodol: Aggregation-induced emission and dual-channel fluorescence sensing of Hg2+ and Ag+ ions. Sens. Actuators B Chem. 2018, 255, 2086–2094. [Google Scholar] [CrossRef]
  29. Yu, Y.; Lin, L.-R.; Yang, K.-B.; Zhong, X.; Huang, R.-B.; Zheng, L.-S. p-Dimethylaminobenzaldehyde thiosemicarbazone: A simple novel selective and sensitive fluorescent sensor for mercury (II) in aqueous solution. Talanta 2006, 69, 103–106. [Google Scholar] [CrossRef]
  30. Chen, G.-H.; Chen, W.-Y.; Yen, Y.-C.; Wang, C.-W.; Chang, H.-T.; Chen, C.-F. Detection of mercury (II) ions using colorimetric gold nanoparticles on paper-based analytical devices. Anal. Chem. 2014, 86, 6843–6849. [Google Scholar] [CrossRef]
  31. Martell, A.E. Chelates of Ascorbic Acid: Formation and Catalytic Properties. In Ascorbic Acid: Chemistry, Metabolism, and Uses; Seib, P.A., Tolbert, B.M., Eds.; American Chemical Society: Washington, DC, USA, 1982; Volume 200, pp. 153–178. [Google Scholar]
Scheme 1. Schematic illustration of the Hg2+detection method based on single particle color imaging under DFM.
Nanomaterials 12 01902 sch001
Figure 1. (A) UV-Vis spectra, (B) Representative DFM images, (C) TEM images of concave cubic Au nanoparticles, (D)TEM images of concave cubic Au nanoparticles after incubation with 80 μM AA and 200 μM Hg2+ (The inset is the corresponding nanoparticle size statistics).
Nanomaterials 12 01902 g001
Figure 2. (A) Representative DFM images of concave cube Au nanoparticles in water (a), 80 μM AA solution (b), 200 μM Hg2+ solution (c), and 80 μM AA + 40 μM Hg2+ solution (d). (B) The UV-Vis spectra: concave cube Au nanoparticles (a), concave cube Au nanoparticles + 80 µM AA (b), concave cube Au nanoparticles + 200 μM Hg2+ (c), concave cube Au nanoparticles + 80 μM AA + 5 µM Hg2+ (d), concave cube Au nanoparticles + 80 μM AA + 50 µM Hg2+ (e), concave cube Au nanoparticles + 80 μM AA + 100 µM Hg2+ (f), and concave cube Au nanoparticles + 80 μM AA + 200 µM Hg2+(g).
Nanomaterials 12 01902 g002
Figure 3. Optimization of experimental conditions on Hg2+ sensing. (A) The Δλmax shift statistics of concave cube Au nanoparticles under different AA concentrations. (B) The Δλmax shift statistics of concave cube Au nanoparticles under different pH. (C) The Δλmax shift statistics of concave cube Au nanoparticles with different reaction times.
Nanomaterials 12 01902 g003
Figure 4. Representative DFM images of concave cube Au nanoparticles (A) before and (B) after incubated with Hg2+ and AA. The DFM color image was split into three corresponding red, green, and blue channels. The (G+B)/R ratio reflects the color variation.
Nanomaterials 12 01902 g004
Figure 5. (A) DFM images of concave cube Au nanoparticles with the increased Hg2+ concentrations over the range of 0–40,000 nM and the corresponding Gaussian fitting of (G+B)/R ratio. (B) (G+B)/R ratio dynamic range vs. Hg2+ concentration over the range of 0–40,000 nM and (C) a linear relationship with Hg2+ over 0–2000 nM.
Nanomaterials 12 01902 g005
Figure 6. The response of concave cube Au nanoparticles to Hg2+ in the case of comparative other metal ion, including Cu2+, Na+, K+, Ba2+, Cr3+, Ca2+, Mn2+, Pb2+, and Zn2+. (A) Representative DFM images. (B) The histogram of (G+B)/R ratio.
Nanomaterials 12 01902 g006
Table 1. Comparison of detection performance of the methods for Hg2+ sensing.
MethodsLinear RangeLODRef
Fluorescence0–5.77 μM0.77 μM[5]
Colorimetric0–2 μM20 nM[6]
Fluorescence0–4 μM0.27 μM[7]
Fluorescence0–350 nM15.2 nM[8]
Colorimetric3–500 nM3 nM[9]
Colorimetric0.03–35 μM10 nM[10]
Single-particle color imaging0–2000 nM1.857 nMThis work
Table 2. Recovery estimation of Hg2+ in water samples.
SamplesHg2+ Added (μg/L)Measured (μg/L)Recovery (%)
Industrial water00.376-
109.72102.8
2018.54107.9
4038.87102.9
Publisher’s Note: MDPI stays neutral with regard to jurisdictional claims in published maps and institutional affiliations.

