
Enhancing the Low-Temperature CO Oxidation over CuO-Based α-MnO2 Nanowire Catalysts


Collaborative Innovation Center of Atmospheric Environment and Equipment Technology, Jiangsu Key Laboratory of Atmospheric Environment Monitoring and Pollution Control, School of Environmental Science and Engineering, Nanjing University of Information Science & Technology, Nanjing 210044, China
*
Authors to whom correspondence should be addressed.
†
These authors contributed equally to this work.
Nanomaterials 2022, 12(12), 2083; https://0-doi-org.brum.beds.ac.uk/10.3390/nano12122083
Submission received: 31 May 2022
/
Revised: 13 June 2022
/
Accepted: 14 June 2022
/
Published: 16 June 2022
(This article belongs to the Special Issue Nanotechnologies and Nanomaterials: Selected Papers from CCMR)
Abstract
:A series of CuO-based catalysts supported on the α-MnO2 nanowire were facilely synthesized and employed as the CO oxidation catalysts. The achieved catalysts were systematically characterized by XRD, SEM, EDS-mapping, XPS and H2-TPR. The catalytic performances toward CO oxidation had been carefully evaluated over these CuO-based catalysts. The effects of different loading methods, calcination temperatures and CuO loading on the low temperature catalytic activity of the catalyst were investigated and compared with the traditional commercial MnO2 catalyst with a block structure. It was found that the slenderness ratio of a CuO/α-MnO2 nanowire catalyst decreases with the increase in CuO loading capacity. The results showed that when CuO loading was 3 wt%, calcination temperature was 200 °C and the catalyst that was supported by the deposition precipitation method had the highest catalytic activity. Besides, the α-MnO2 nanowire-supported catalysts with excellent redox properties displayed much better catalytic performances than the commercial MnO2-supported catalyst. In conclusion, the CuO-based catalysts that are supported by α-MnO2 nanowires are considered as a series of promising CO oxidation catalysts.
1. Introduction
Carbon monoxide is generally considered to be a fuel, resulting from the incomplete combustion of fuel. The environmental pollution it causes has become a serious problem all over the world, which has a great impact on human health and living environment [1,2]. At present, CO degradation technologies mainly include adsorption, separation, biodegradation, combustion, plasma catalysis, photocatalysis, catalytic oxidation and so on [3]. Among them, catalytic oxidation has been widely used because of its advantages of high purification efficiency, low reaction temperature and low cost [4]. Therefore, the design and development of catalysts with advanced performance is the key to solve CO catalytic oxidation. It was found that noble metals (Au [5], Pt [6] and Rh [7]) as the active center supported on specific metal oxides (CeO2 [8], MnO2 [9], ZrO2 [10] and Fe2O3 [11]) with excellent oxygen storage capacity usually have high activity for CO catalytic oxidation. However, due to the high price and scarce resources of precious metals, their large-scale application is greatly limited. In the past few decades, various transition metal oxides (Co3O4, CuO, Fe2O3 and MnO2) have proved to show excellent catalytic activity in CO catalytic oxidation. Co3O4-based catalysts have been widely studied for their low temperature catalytic activity that is similar to that of noble metal catalysts. However, the rapid deactivation of Co3O4-based catalysts occurs under high humidity [12,13]. In contrast, CuO-based catalysts have poor low temperature activity but high humidity tolerance. Therefore, the preparation of CuO-based catalysts with excellent low temperature activity has always been a research focus and challenge in the field of CO catalytic oxidation [14].
In order to design and prepare highly efficient CuO-based catalysts, the effect of catalyst supports and preparation strategies have been extensively studied. Among many catalysts supports, MnO2 has been widely studied because of its low cost, environmental friendliness and high activity [15]. It is well known that the physicochemical properties of MnO2 with different morphologies are often different. The common one-dimensional structures of MnO2 include block structure, nanorods, nanotube and nanowires. Among these morphologies, MnO2 of a nanowire structure plays an important role because nanowire with a one-dimensional structure can be used as the basic assembly unit of two- or three-dimensional structural materials [16,17]. In addition, composites with novel structures and properties can be prepared easily. Compared with traditional MnO2 with a bulk structure, nanostructured MnO2 materials generally have better physicochemical properties, such as a higher specific surface area, lower density and adjustable chemical properties [18]. In addition, various studies have shown that MnO2 materials with nanowire morphology usually have a high surface area and strong metal-support interactions. Compared with other morphologies of MnO2 nanomaterials, MnO2 nanowire usually has higher catalytic activity [19,20]. Therefore, nanowire is the main form of MnO2 nanomaterials. MnO2 nanowires generally have more surface oxygen adsorption, stronger reducibility, higher specific surface area and lower Mn-O bond strength than MnO2 nanorods. Therefore, it has a better catalytic performance in the catalytic combustion of dimethyl ether and the catalytic oxidation of toluene. Saputra et al. [21] found that MnO2 nanowire exhibited higher activity than MnO2 nanorods and MnO2 nanofibers in the co-degradation of phenol by reactive oxygen species and hydroxyl groups. In addition, compared with nanorod and nanotube MnO2, MnO2 nanowires as supports have stronger interactions with Ag and exhibit higher toluene oxidation activity. Among the MnO2 nanomaterials (α-MnO2, β-MnO2), α-MnO2 nanowire also showed the best catalytic activity for CO, even after Co3O4 nanoparticles were decorated. Liang et al. [22] synthesized four MnO2 nanomaterials with different crystal types. They found that the order of activity of CO catalytic oxidation is α = δ > γ > β-MnO2 because the [2 × 2] and [1 × 1] tunnel structures of α-MnO2 can occupy more space to obtain more CO adsorption sites. On the other hand, the strong catalytic performance of α-MnO2 for CO oxidation is due to the prolonged length of the Mn-O bond that is caused by twisted [MnO6], which may be conducive to the fracture of Mn-O bond, thus promoting CO oxidation. Therefore, α-MnO2 reacts easily with CO, which further improves its catalytic performance.
In addition, various studies have been carried out to improve the CO catalytic oxidation activity of MnO2 nanowires. In order to achieve this goal, effective strategies, including element-doped surface engineering and combination with other active substances have been extensively developed [23]. Metal loading and doping are two commonly used modification methods for preparing catalysts. Both can significantly improve the catalytic activity of MnO2 nanowires [24,25]. The loading method can disperse the metal or metal oxide on the surface of the catalyst carrier highly uniformly, and the catalyst with higher activity can be obtained due to the formation of a strong metal-support interaction. The doping method is to replace the metal cations in the main metal oxides with different cations, which can greatly change the chemical bonding on the surface of the main metal oxides and improve their catalytic performance [26,27]. The active sites in the catalytic system may be oxygen atoms near the dopant or the dopant itself. Therefore, the activity of MnO2 nanowires can be further improved by dispersing more active components on their surfaces. Gao et al. [28] found that hydrothermal doping of Cu significantly improved the CO oxidation activity and water resistance of α-MnO2 nanowires. For γ-MnO2, Zn-doped MnO2 achieves a 90% CO conversion at 160 °C and shows the best CO oxidation activity in other elements that are doped with γ-MnO2. Li et al. [29] synthesized α-MnO2 with a porous surface structure by acid treatment. It has rich adsorption sites for O2, thus enhancing the catalytic oxidation activity of MnO2 to CO. In addition, combining Au, Ag and CuO with MnO2 nanomaterials can effectively improve the efficiency of CO catalytic oxidation. Xu et al. [30] also studied the effect of a Ag-supported catalyst on CO catalytic oxidation activity on α-MnO2 nanowires, and the T90% of Ag/α-MnO2 could reach below 100 °C.
In this study, α-MnO2 material with a perfect nanowire structure was successfully prepared by a one-step hydrothermal method. The nanowires with excellent structural properties and thermal stability could be used as CuO-based catalyst supports. A series of CuO-based α-MnO2 nanowire catalysts were prepared by initial impregnation and deposition precipitation methods for CO catalytic oxidation reaction at a low temperature. The catalysts were characterized by X-ray powder diffraction (XRD), scanning electron microscopy (SEM), energy-dispersed spectroscopy (EDS) mapping, X-ray photoelectron spectroscopy (XPS), etc. The effects of different loading methods, calcination temperature, CuO loading and the mesoscopic structure of MnO2 on CO oxidation activity at low temperature were studied.
2. Materials and Methods
2.1. Synthesis of α-MnO2 Nanowire Support
The α-MnO2 nanowire support was synthesized by a hydrothermal method according to the scheme that was previously reported [31]. Specifically, 3 mmol of MnSO4·H2O was first dissolved in 40 mL of deionized water and stirred for 5 min until the MnSO4·H2O solution was clarified. Then, 2 mmol of KMnO4 was also dissolved in 40 mL of deionized water and stirred for 5 min. After that, the KMnO4 solution was gradually added to the MnSO4·H2O solution to obtain the brown suspension, and the stirring was continued for 30 min. The stirred brown suspension was transferred to a Teflon reactor and hydrothermal reaction at 160 °C for 12 h. The brown-black liquid that was obtained after the hydrothermal treatment was washed six times with ethanol. The solid that was obtained by centrifugation was placed in a vacuum drying oven at 100 °C for 12 h, and then the α-MnO2 nanowire support was obtained.
2.2. CuO-Based α-MnO2 Nanowire Catalyst Preparation
The CuO-based supported α-MnO2 nanowire catalysts containing x wt% CuO (x = mCuO/(mCuO + msupport) × 100%) were synthesized by a deposition precipitation method. To be specific, α-MnO2 nanowire was dispersed in Cu(NO3)2·3H2O solution, and then Na2CO3 (0.01 M) solution was added droplet by droplet to adjust the pH to 8~9. The mixed solution was fully stirred for 30 min and then stood for 1h. After filtration, it was washed with deionized water and dried for 12 h in an oven of 120 °C. Then, the CuO-based α-MnO2 nanowire catalysts with different CuO loading were obtained by calcination at 200 °C for 5 h and were denoted as xCuO/α-MnO2-200-DP (x = 1, 3, 5, 10, 20 and 30). Meanwhile, a series of catalysts defined as 3CuO/α-MnO2-T-DP (T = 120, 200, 300 and 400) were synthesized under the same preparation process at a different calcination temperature, where “T” refers to the calcination temperature of the catalyst. In order to clarify the influence of the loading mode on the performance of the catalyst, the CuO-based α-MnO2 nanowire catalyst by incipient impregnation method was denoted as 3CuO/α-MnO2-200-IMP.
In addition, the CuO that was supported on a commercial MnO2 catalyst (3CuO/C-MnO2-200-DP) indicated that the special morphology of α-MnO2 nanowire also promoted the catalytic activity of CO catalytic oxidation. The commercial MnO2 that was used in this study was the most common one in the market, and it was normal to have fewer impurities in the commercial MnO2.
2.3. Catalyst Characterizations
X-ray powder diffraction (XRD) patterns of all catalysts were performed on a Smart Lab/3 kW Intelligent multifunctional X-ray Diffractometer (Shimadzu, Kyoto, Japan) (Cu Kα radiation 40 kV/100 mA, the step of 5°/min, 2θ = 10–80°). Scanning electron microscopy (SEM) and energy-dispersed spectroscopy (EDS) mapping measurements of all catalysts were carried out on a scanning electron microscopy (FEI TECNAI G2 F20, Hillsboro, OR, USA). The sample was glued to the conductive adhesive, and gold spraying was performed for 45 s and 10 mA using Oxford Quorum SC7620 sputtering coater (Quorum, UK). The morphology of the sample was photographed with a ZEISS Gemini SEM 300 scanning electron microscope. The X-ray photoelectron spectroscopy (XPS) measurements were tested on an Escalab 250Xi (Thermo Fisher Scientific, Waltham, MA, USA) that was equipped with an Al Kα X-ray source to determine the elemental composition and chemical states of the elements. The powder of the sample was spread and coated on conductive tape on the sample holder. The binding energies were calibrated using the C 1s line at 284.5 eV as the reference.
H2 temperature-programmed reduction (H2-TPR) experiments were carried out in a self-made fixed-bed reactor (assemble). The consumption curve of H2 was recorded and analyzed by an online LC-D200 mass spectrometer (TILON, Seoul, Korea). A mixture of H2 (0.4 mL/min) and Ar (7.6 mL/min) was introduced into the reactor. After the H2 signal baseline (m/z = 2) was stabilized, a H2-TPR experiment was performed at a heating rate of 20 °C/min from room temperature to 800 °C.
2.4. Catalyst Evaluation
The catalytic activity of CO oxidation of the catalyst in this system had been tested in a vertical fixed-bed continuous flow reactor that was equipped with quartz tubes (I.D. = 10.00 mm). The temperature of the reaction should be the center temperature of the catalyst bed and it was detected and controlled by the thermocouple that was located in the center of the catalyst bed. The gas flows of the feed gases are controlled by the mass flow controllers (MFC, Brooks Instrument, Hatfield, UK) and used as feed 1 vol % CO, 20 vol. % O2 and balanced N2. The catalyst weighed 0.1 g and was injected with CO reaction gas with a total flow of 20 mL/min. The CO oxidation corresponding to the gas hourly space velocity (GHSV) was 12,000 mL/(g·h) gas, and the catalytic activity of CO oxidation over different catalysts was tested in the specified temperature range. Finally, a GC-680 gas chromatograph (Perkin Elmer, Waltham, MA, USA) with a thermal conductivity detector (TCD) was used for an on-line analysis of the outlet gas. The catalytic activity of the catalyst was reflected and expressed by CO conversion. The conversion rate of CO was calculated based on the formula below:
FCO,Inlet represented the flow rate of CO species into; FCO,outlet represented the flow rate of CO species out of the reactor.
3. Results and Discussion
3.1. Characterizations of the Catalysts
3.1.1. XRD Analysis
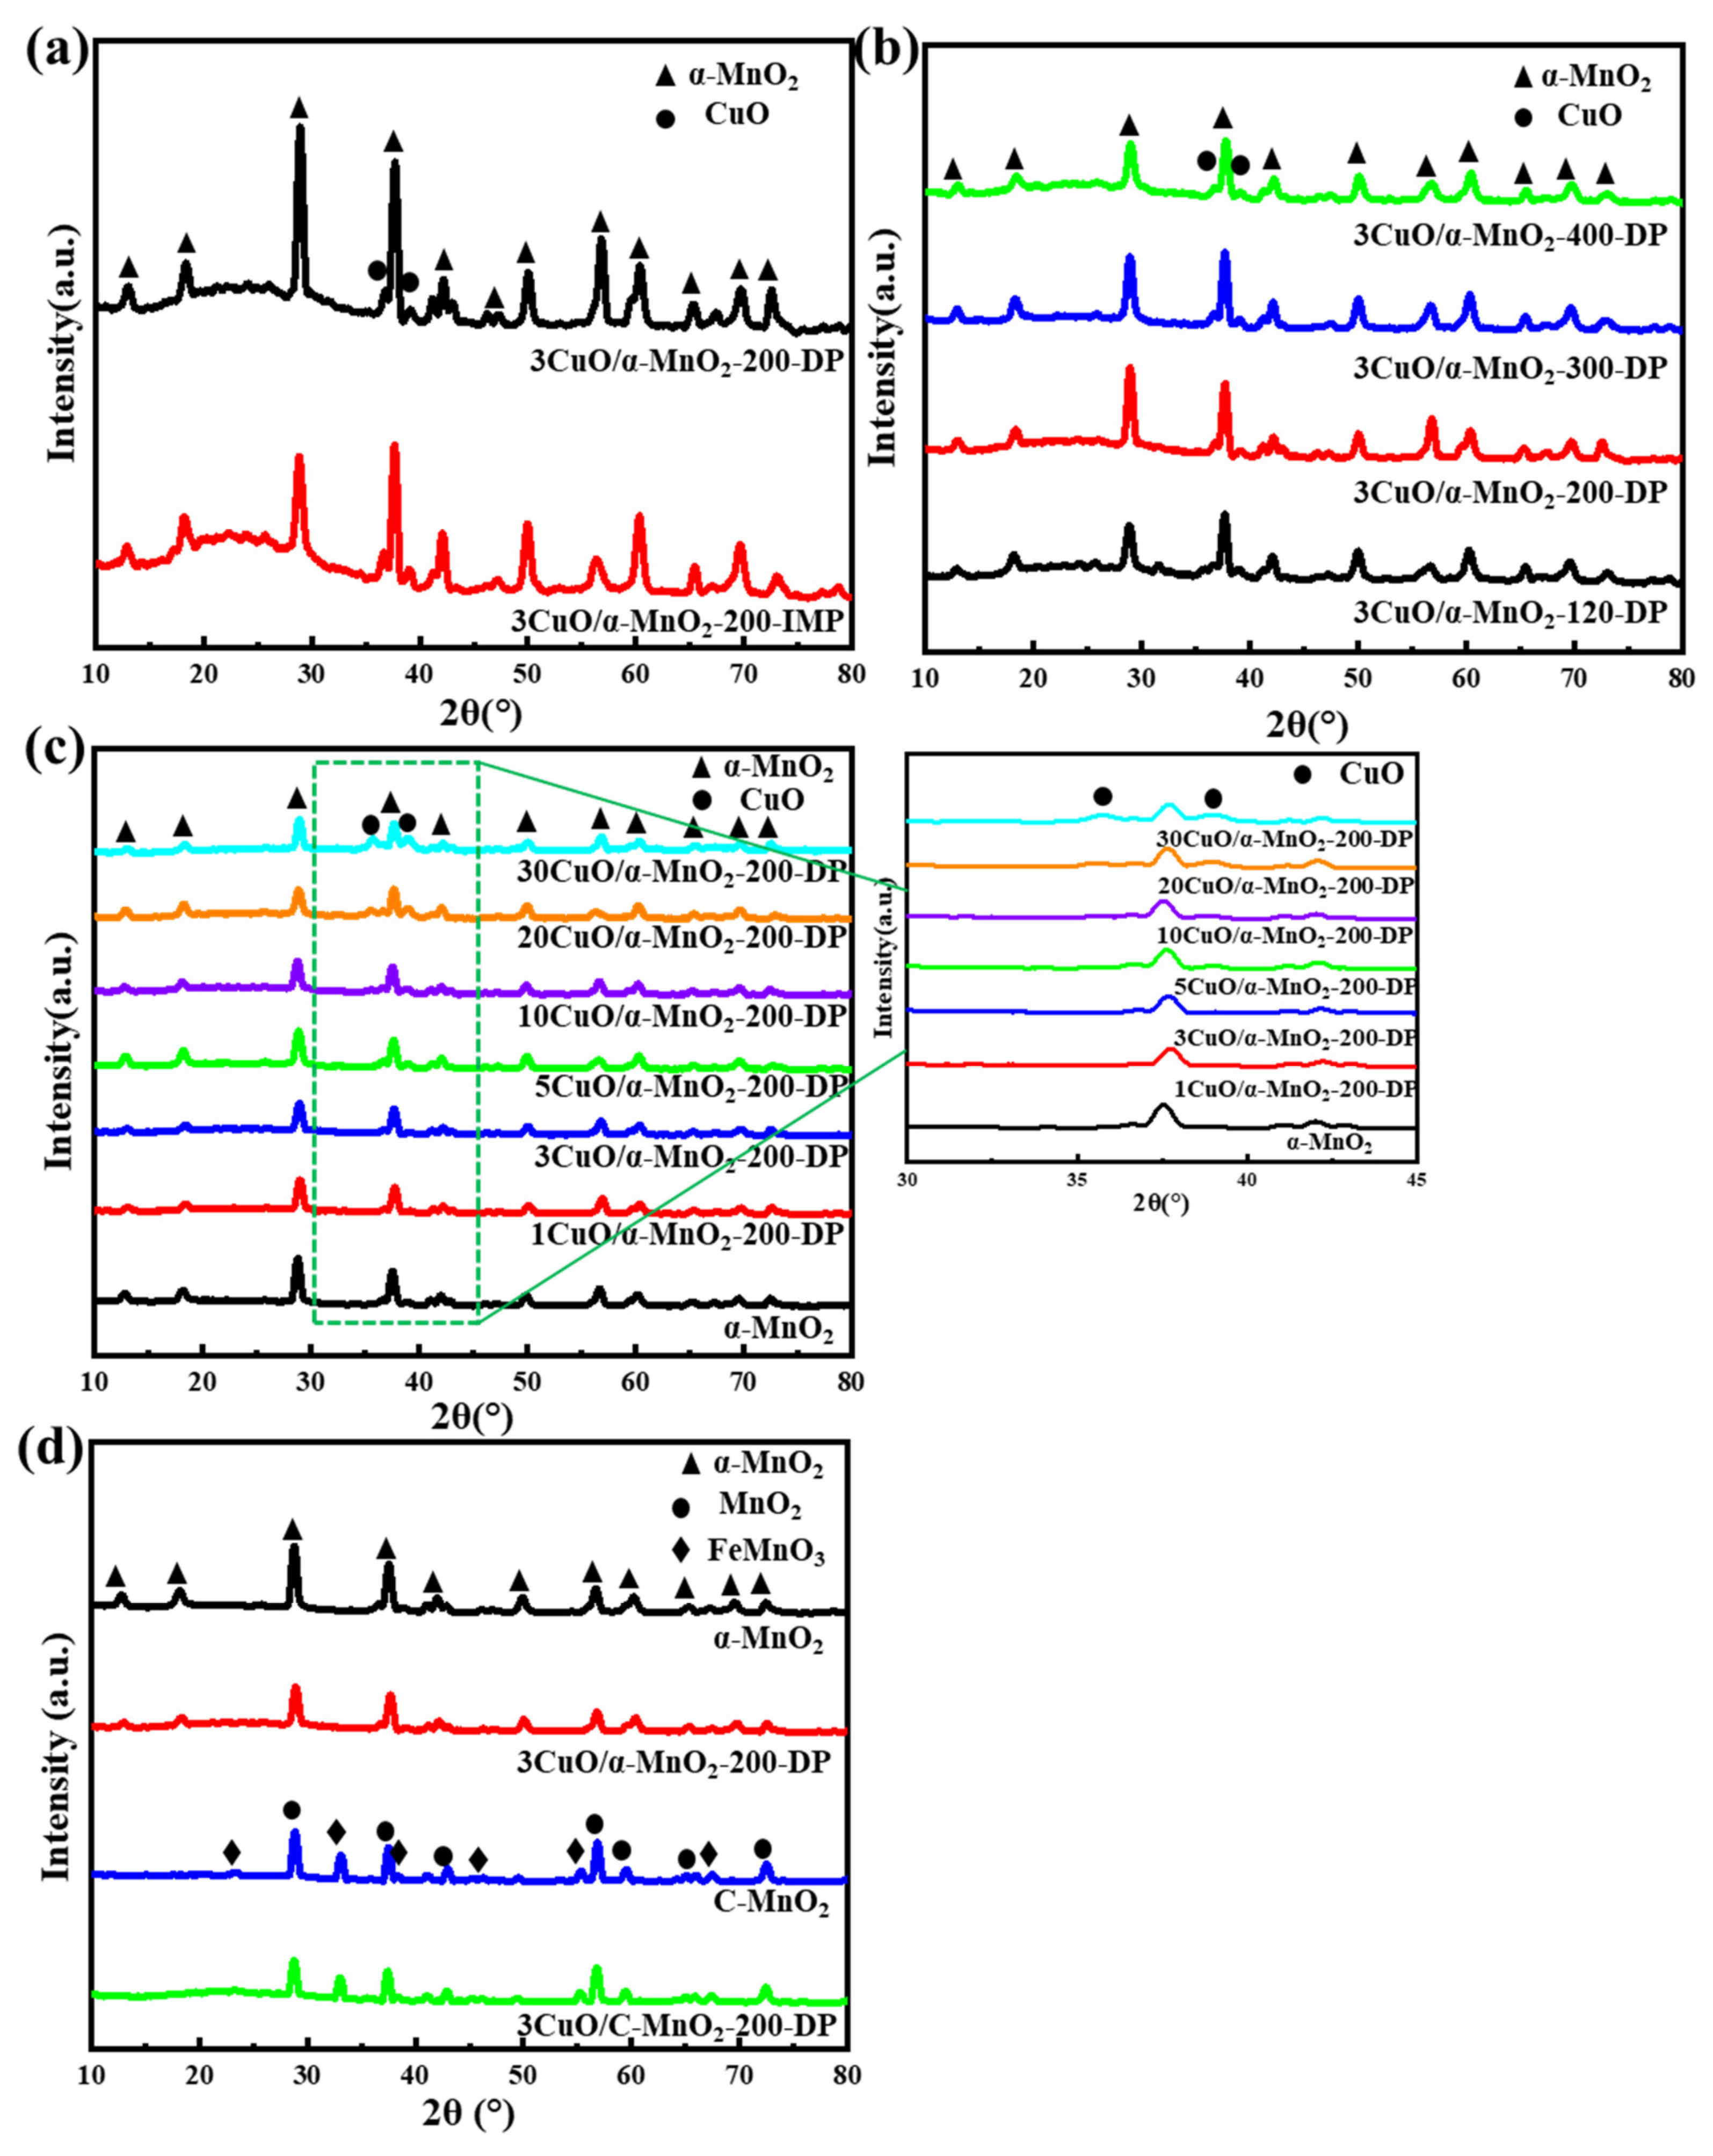
In order to study the crystal phase structure of the supports and catalysts, a series of materials were analyzed by XRD. In Figure 1, the diffraction peaks of α-MnO2 that were located at 2θ = 12.78°, 18.11°, 25.71°, 37.52°, 41.97°, 49.86°, 56.37°, 65.11° and 69.71° could be ascribed to the α-MnO2 phase (PDF#44-0141) [30]. Specific, obvious diffraction peaks correspond to the (1 1 0), (2 0 0), (2 2 0), (2 1 1), (3 0 1), (4 1 1), (6 0 0), (5 2 1), (0 0 2) and (5 4 1) crystal planes of the MnO2 structure, respectively. Figure 1a shows the XRD patterns of 3CuO/α-MnO2-200-DP and 3CuO/α-MnO2-200-IMP under different loading methods. As can be seen from the figure, the MnO2 diffraction peak intensity of the 3CuO/α-MnO2-200-DP catalyst that was prepared by the deposition precipitation method (DP) loaded with CuO was significantly stronger than 3CuO/α-MnO2-200-IMP that was prepared by the initial impregnation method (IMP). The catalytic activity test showed that the CO catalytic oxidation activity of 3CuO/α-MnO2-200-DP was significantly better than that of 3CuO/α-MnO2-200-IMP.The test also proved that the (2 2 0) and (6 0 0) crystal planes of α-MnO2 may play a dominant role in CO catalytic oxidation. At the same time, compared with the 3CuO/α-MnO2-200-IMP, the characteristic peak of CuO in the 3CuO/α-MnO2-200-DP catalyst was much lower. The results showed that the CuO dispersion on the surface of the 3CuO/α-MnO2-200-DP catalyst was significantly higher than that of 3CuO/α-MnO2-200-IMP.
In general, calcination at higher temperatures was always accompanied by an increase in mean particle size and a decrease in specific surface area due to pore clogging. In addition to reducing the surface area, higher calcination temperatures reduced the active ingredients, ultimately leading to a reduction in the active interface sites. On the other hand, the CuO/α-MnO2 catalyst generated CuMn2O4 at higher temperature and deactivates [32]. Figure 1b shows the XRD patterns of 3CuO/α-MnO2-T-DP at different calcination temperatures. When the calcination temperature raised from 120 °C to 300 °C, the intensity of the XRD diffraction peak increased and the diffraction peak was the strongest at 300 °C. This ought to be attributed to the collapse of the nanowire framework at the calcination temperature as high as 300 °C, which made the dispersion of CuO worse. However, when the calcination temperature raised to 400 °C, the peak intensity decreased, which was caused by the formation of CuMn2O4. Moreover, due to the low content of CuMn2O4, its characteristic diffraction peak cannot be displayed in the XRD pattern.
The XRD patterns of the pure α-MnO2 nanowire support and xCuO/α-MnO2-200-DP catalysts with different CuO loading are shown in Figure 1c. As can be seen from the figure, almost all the xCuO/α-MnO2-200-DP nanowire catalysts showed wide and clear XRD peaks, indicating that all the catalysts displayed good crystallinity. As the CuO loading increased, two diffraction peaks were detected at the 2θ = 35.5° and 38.8°, which were the diffraction peaks of CuO (PDF#05-0661) [33]. On the other hand, with the increase in CuO content, the intensity of the CuO diffraction peak also increased, indicating that the grain size of CuO increased. At the same time, the characteristic peak intensity of the (2 2 0) and (2 1 1) crystal planes of α-MnO2 decreased obviously.
Figure 1d shows the XRD patterns of pure α-MnO2 nanowire, commercial MnO2 and corresponding catalysts. As can be seen from the figure, the diffraction peak of C-MnO2 was the same as that of MnO2 (PDF#72-1984). In addition, the diffraction peak of impurity FeMnO3 (PDF#75-0894) was observed in the C-MnO2 diffraction peak by comparison [34]. The characteristic peak of CuO cannot be clearly seen in the figure, due to the low loading of CuO. On the other hand, it indicated the high dispersion of CuO on the catalyst’s surface.
3.1.2. SEM Observation
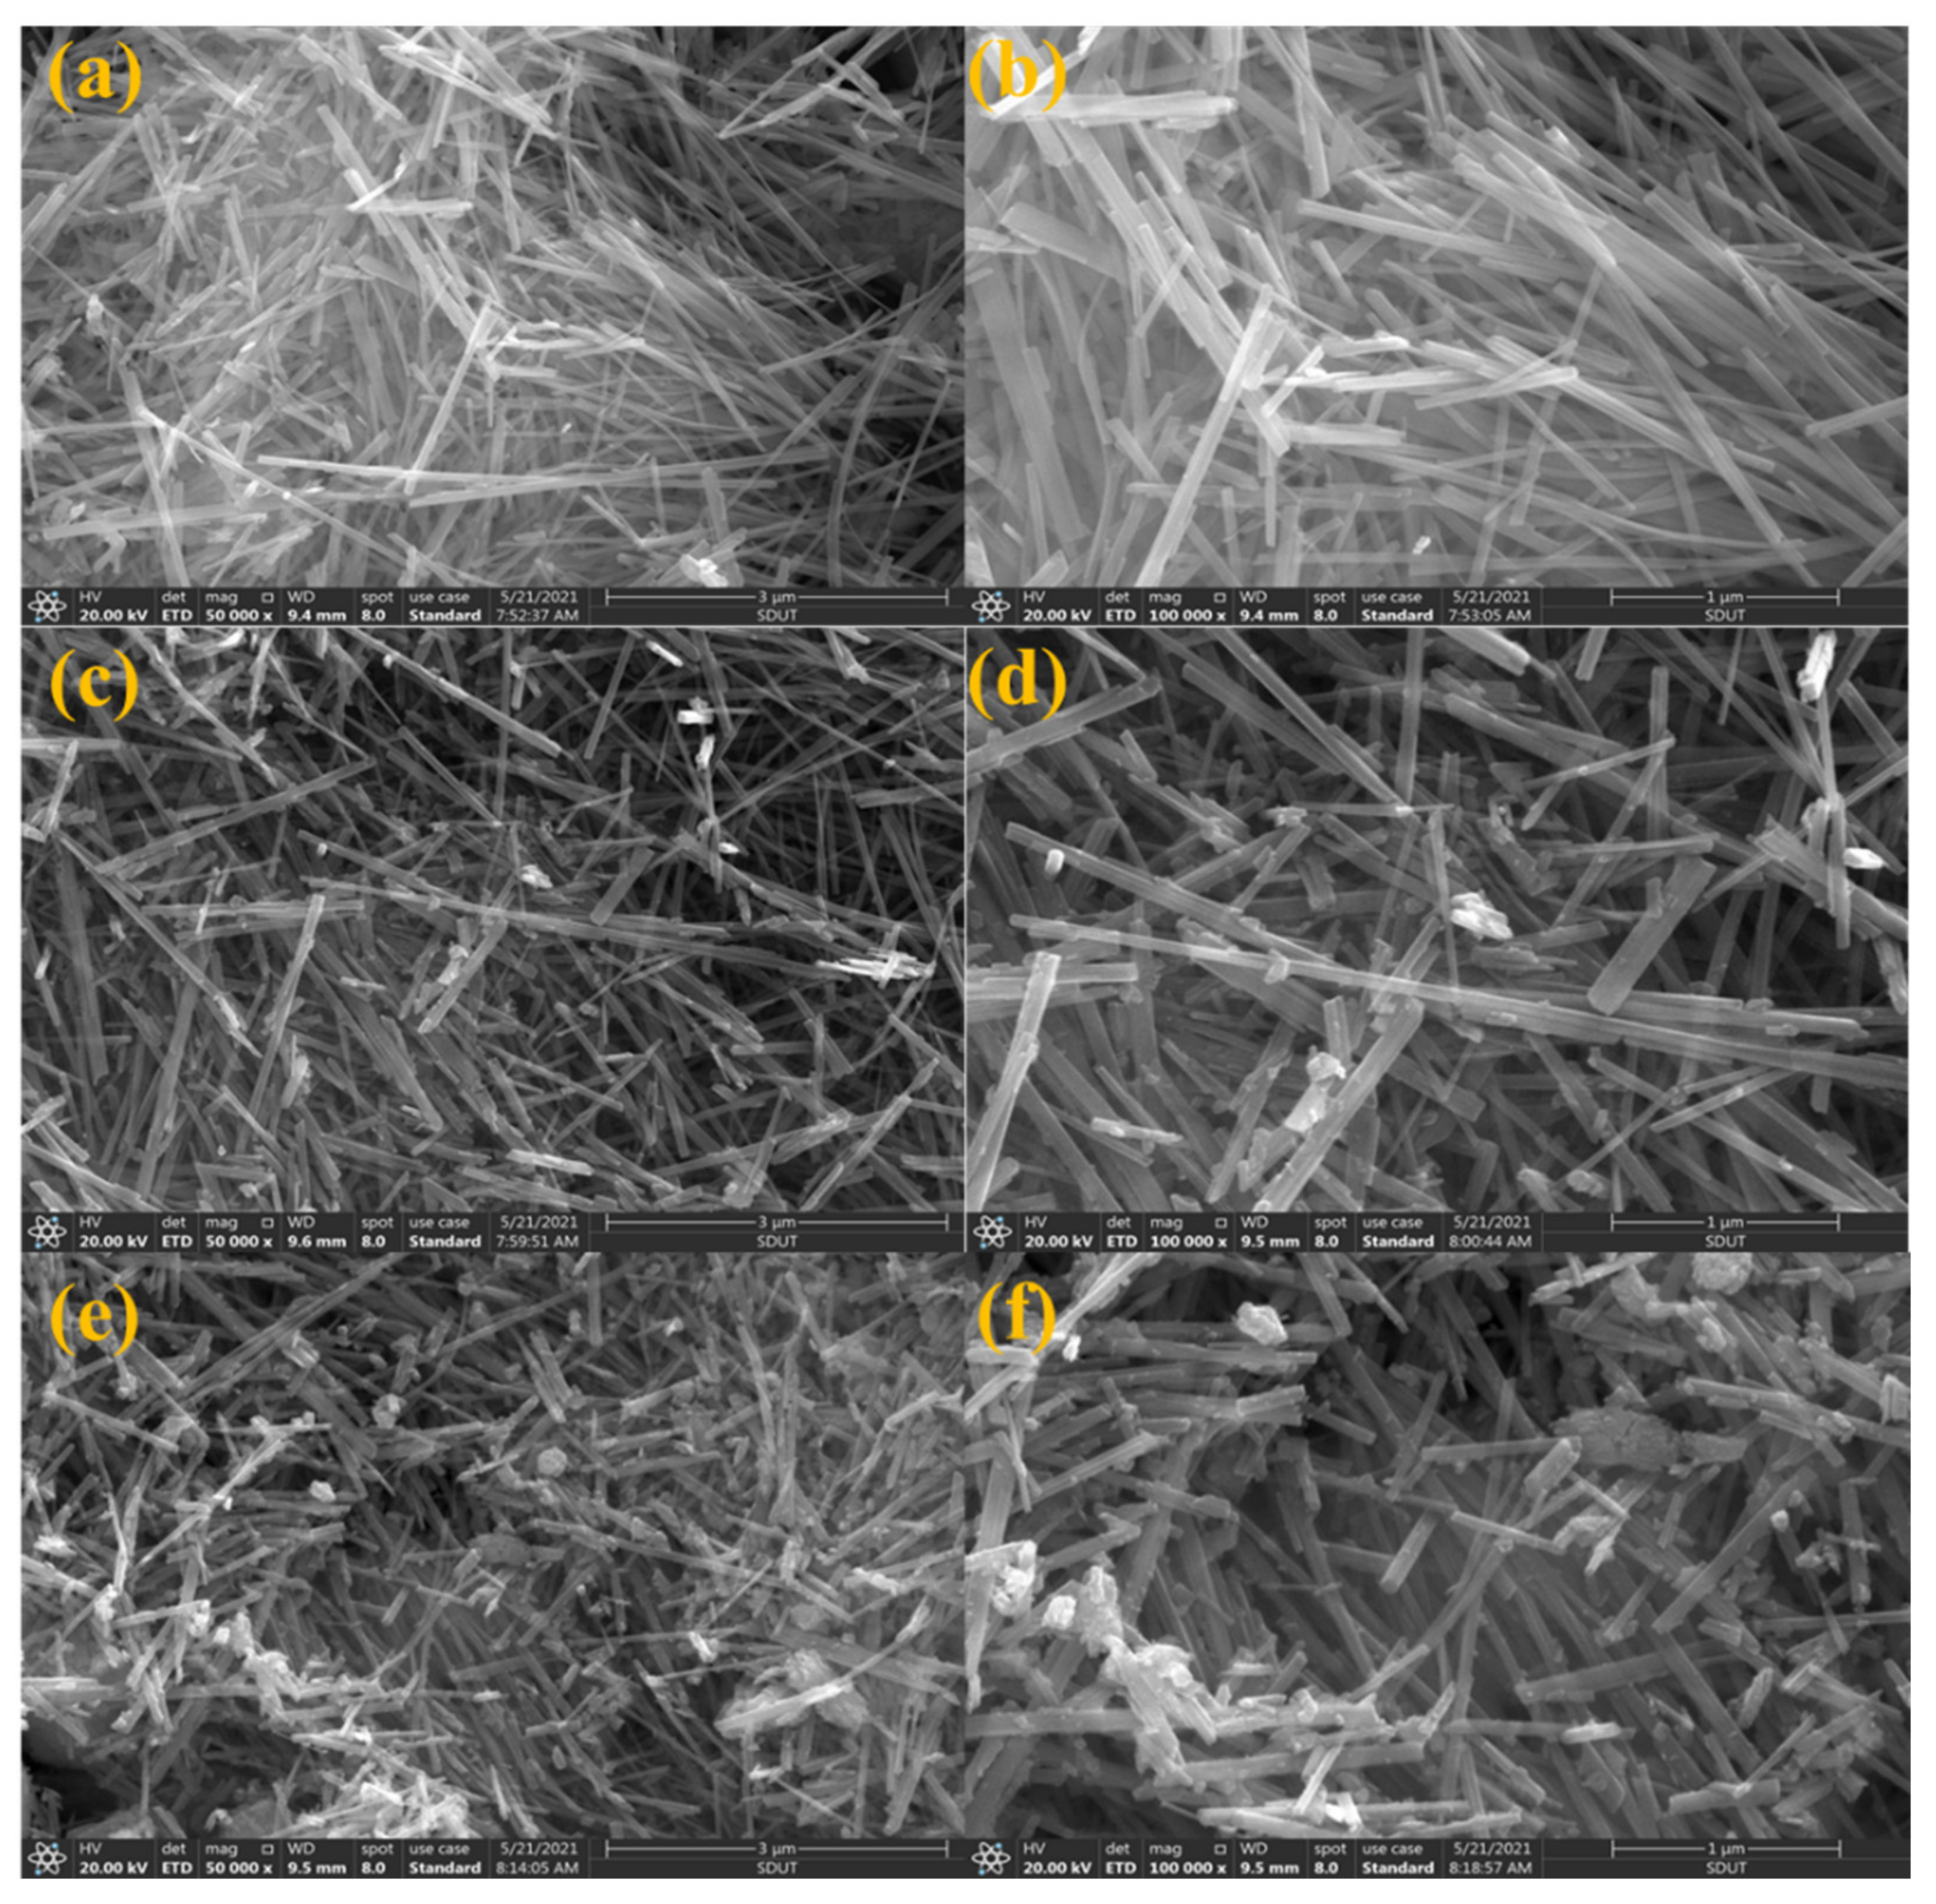
SEM images of the α-MnO2 nanowire support and xCuO/α-MnO2-200-DP catalysts were analyzed, as shown in Figure 2. The 5CuO/α-MnO2-200-DP and 30CuO/α-MnO2-200-DP with different CuO loadings were selected as representative catalysts. Figure 2a,b shows the morphology of pure α-MnO2 nanowire. It was found that the nanowire had a uniform morphology, smooth surface, and large aspect ratio (length: 5–15 μm, width: 100–200 nm). Figure 2c,e, respectively, show the 5CuO/α-MnO2-200-DP and 30CuO/α-MnO2-200-DP nanowires’ catalysts’ structure. When the CuO loading increased from 0% to 5%, α-MnO2 nanowire support retained its morphology, while the 30% CuO loading catalyst showed irregular nanowire. At the same time, the aspect ratio of α-MnO2 nanowires decreases with the increase in CuO loading. The CuO loading was observed on the surface of the 5CuO/α-MnO2-200-DP and 30CuO/α-MnO2-200-DP catalysts.
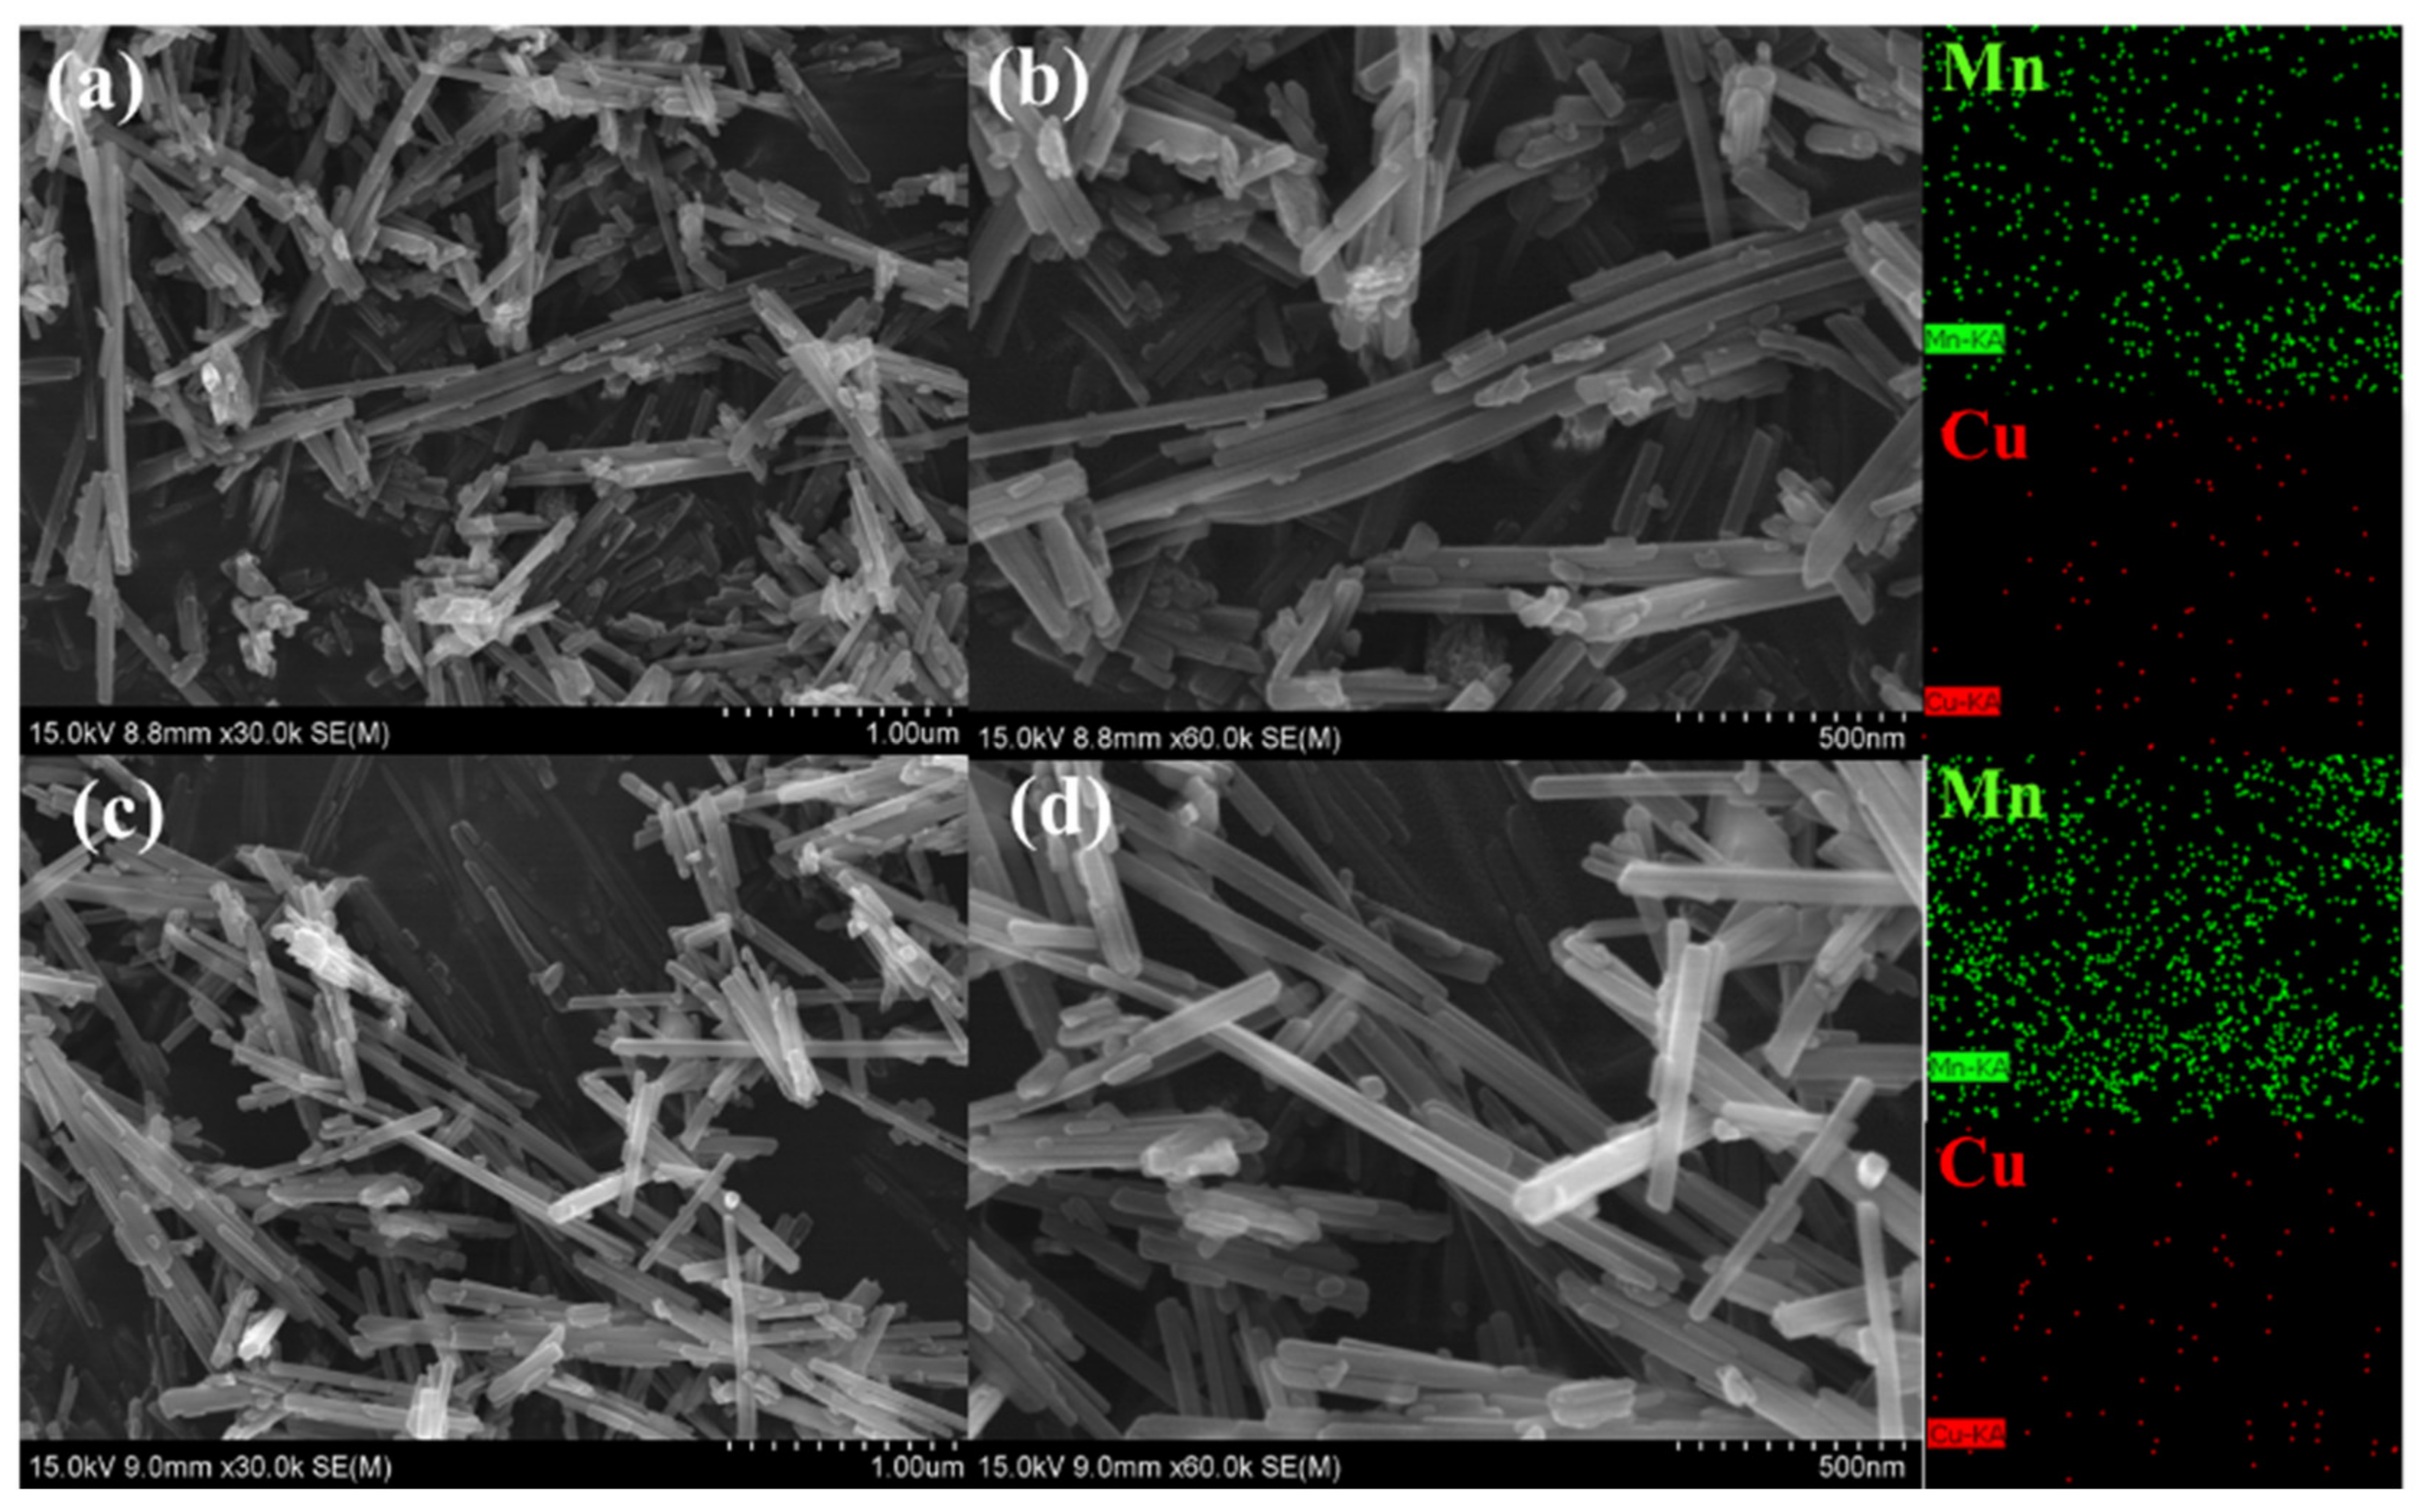
The spatial dispersion of Mn and Cu elements in the nanowire structure could be characterized and analyzed by scanning transmission electron microscopy (STEM) and energy dispersive spectroscopy mapping (EDS-mapping) of the 3CuO/α-MnO2-200-DP and 3CuO/α-MnO2-200-IMP catalysts. It could be seen from Figure 3 that the supported metal Cu element was uniformly distributed on the surface of the catalysts. In addition, the dispersion of Cu element in the 3CuO/α-MnO2-200-DP catalyst was significantly higher than that of the 3CuO/α-MnO2-200-IMP catalyst, indicating that the catalyst that was prepared by the precipitation deposition method could better distribute the Cu element on the catalyst’s surface.
3.1.3. XPS Analysis
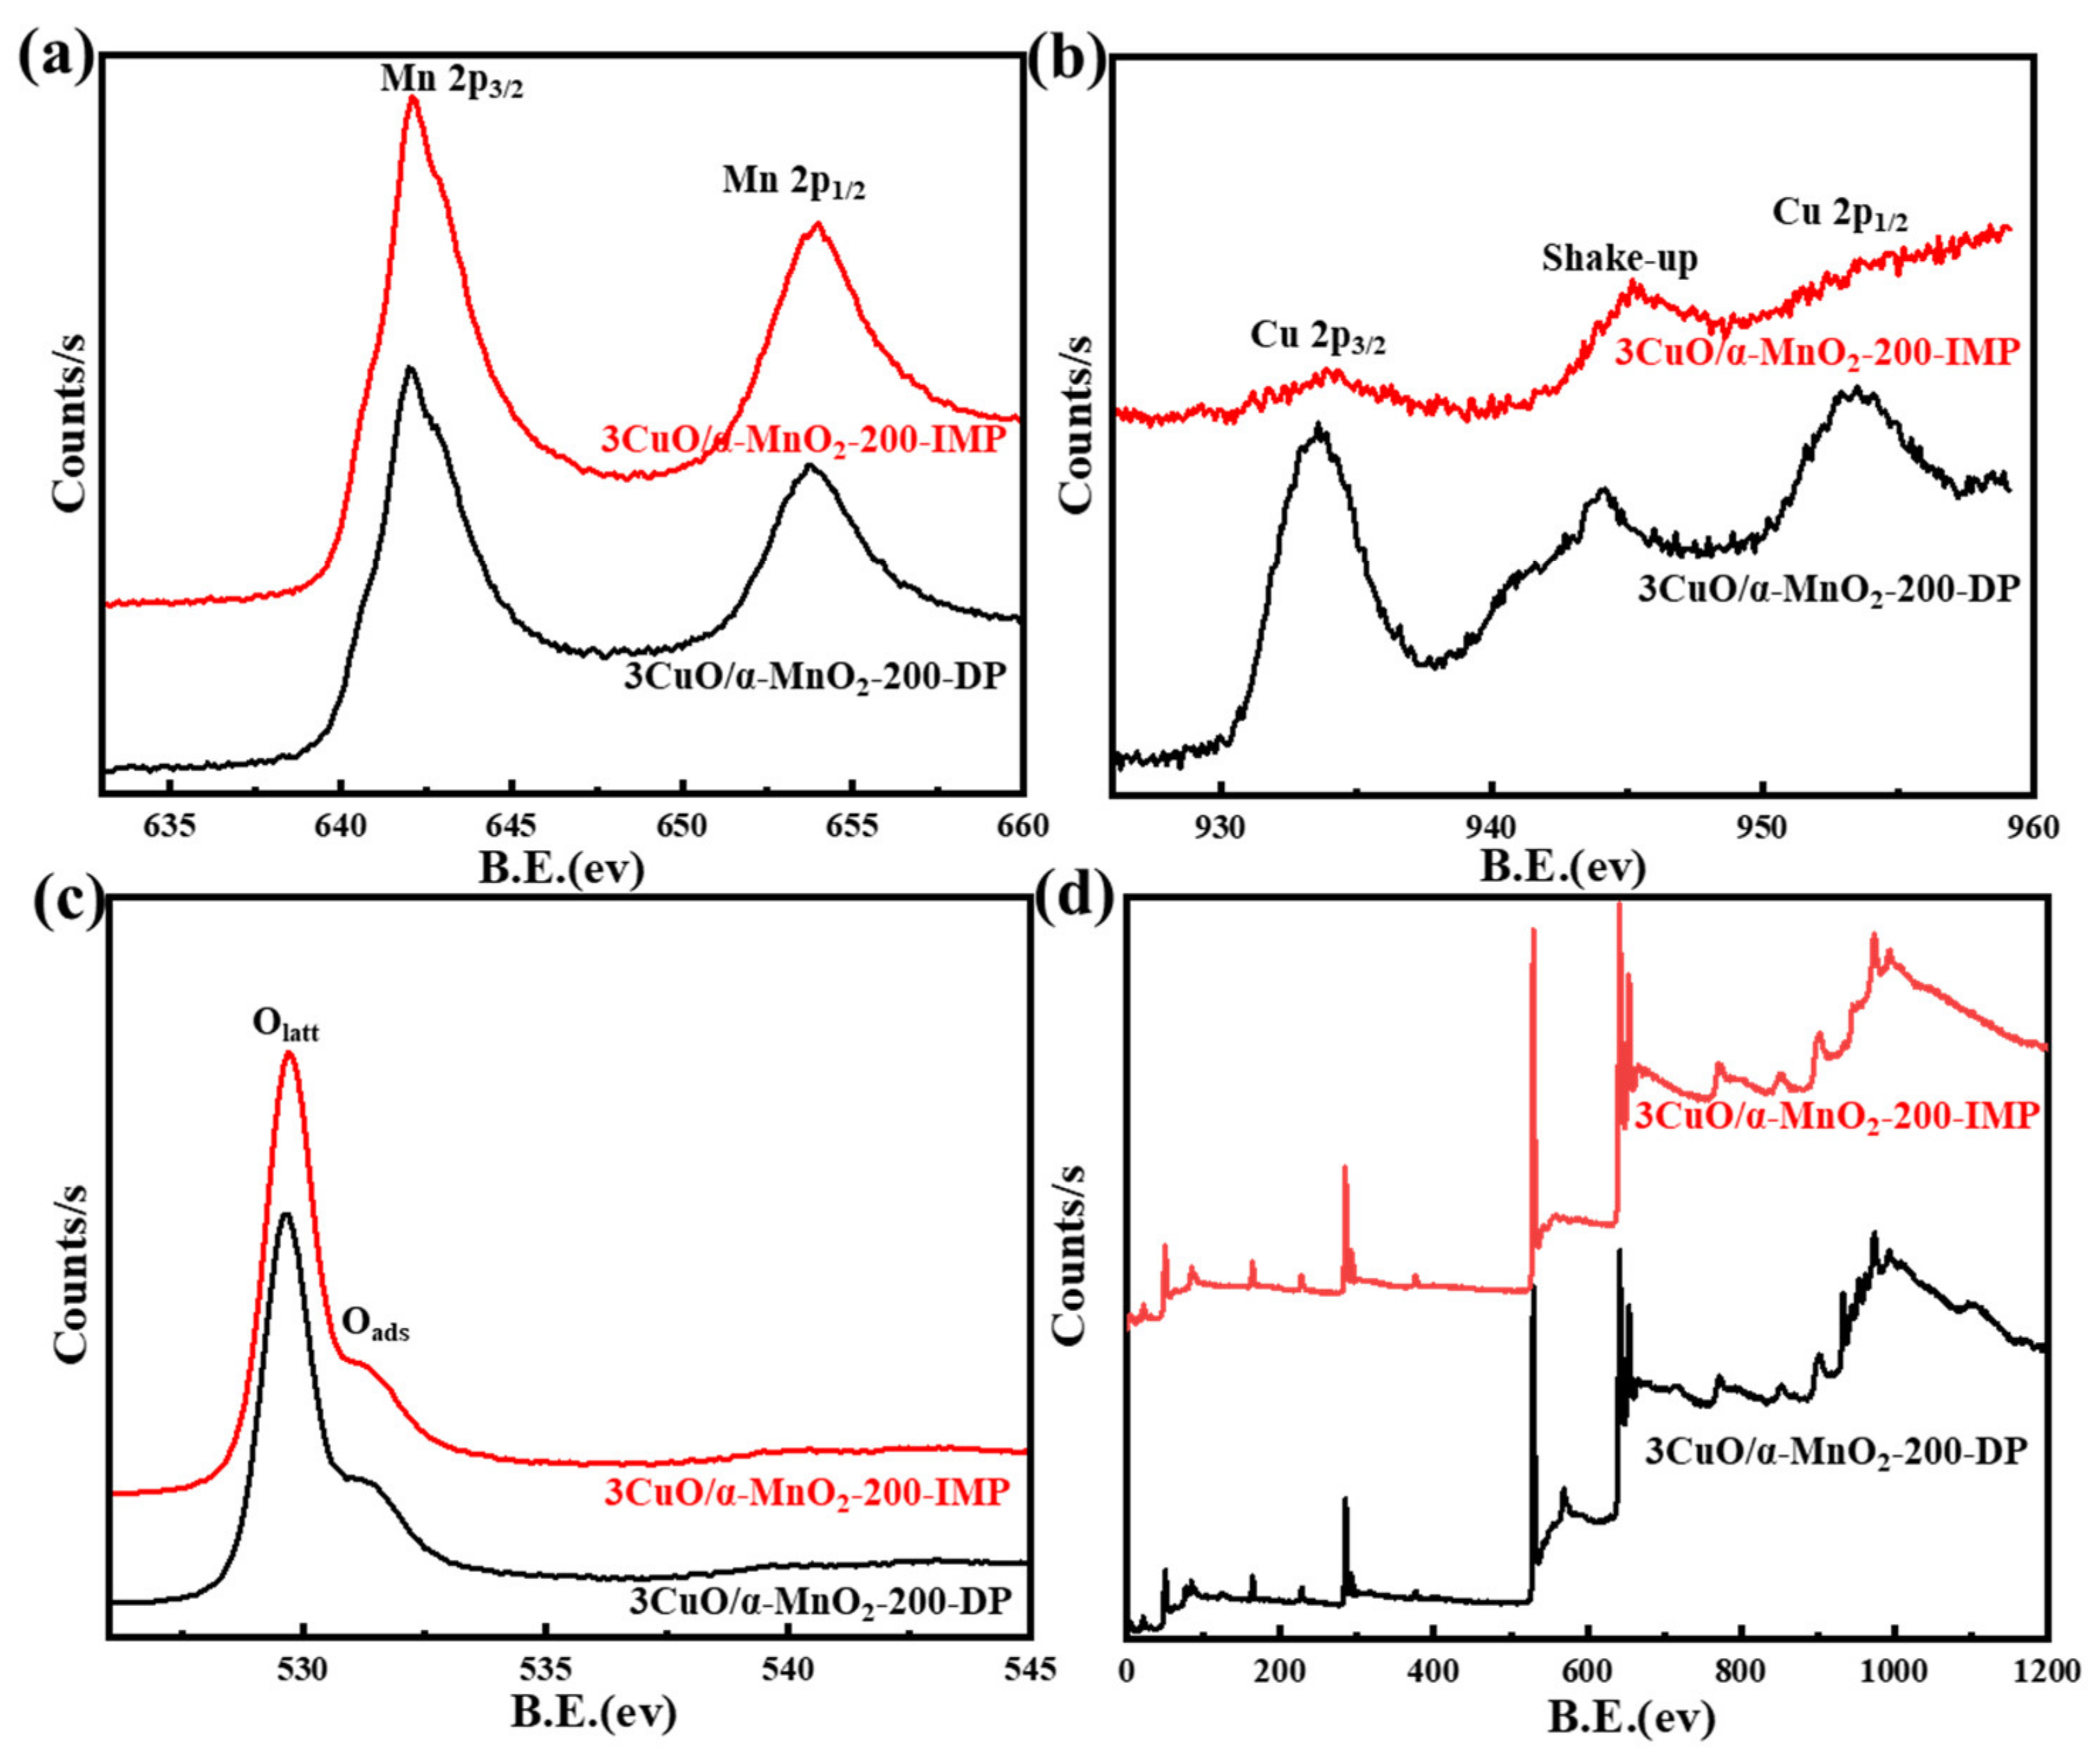
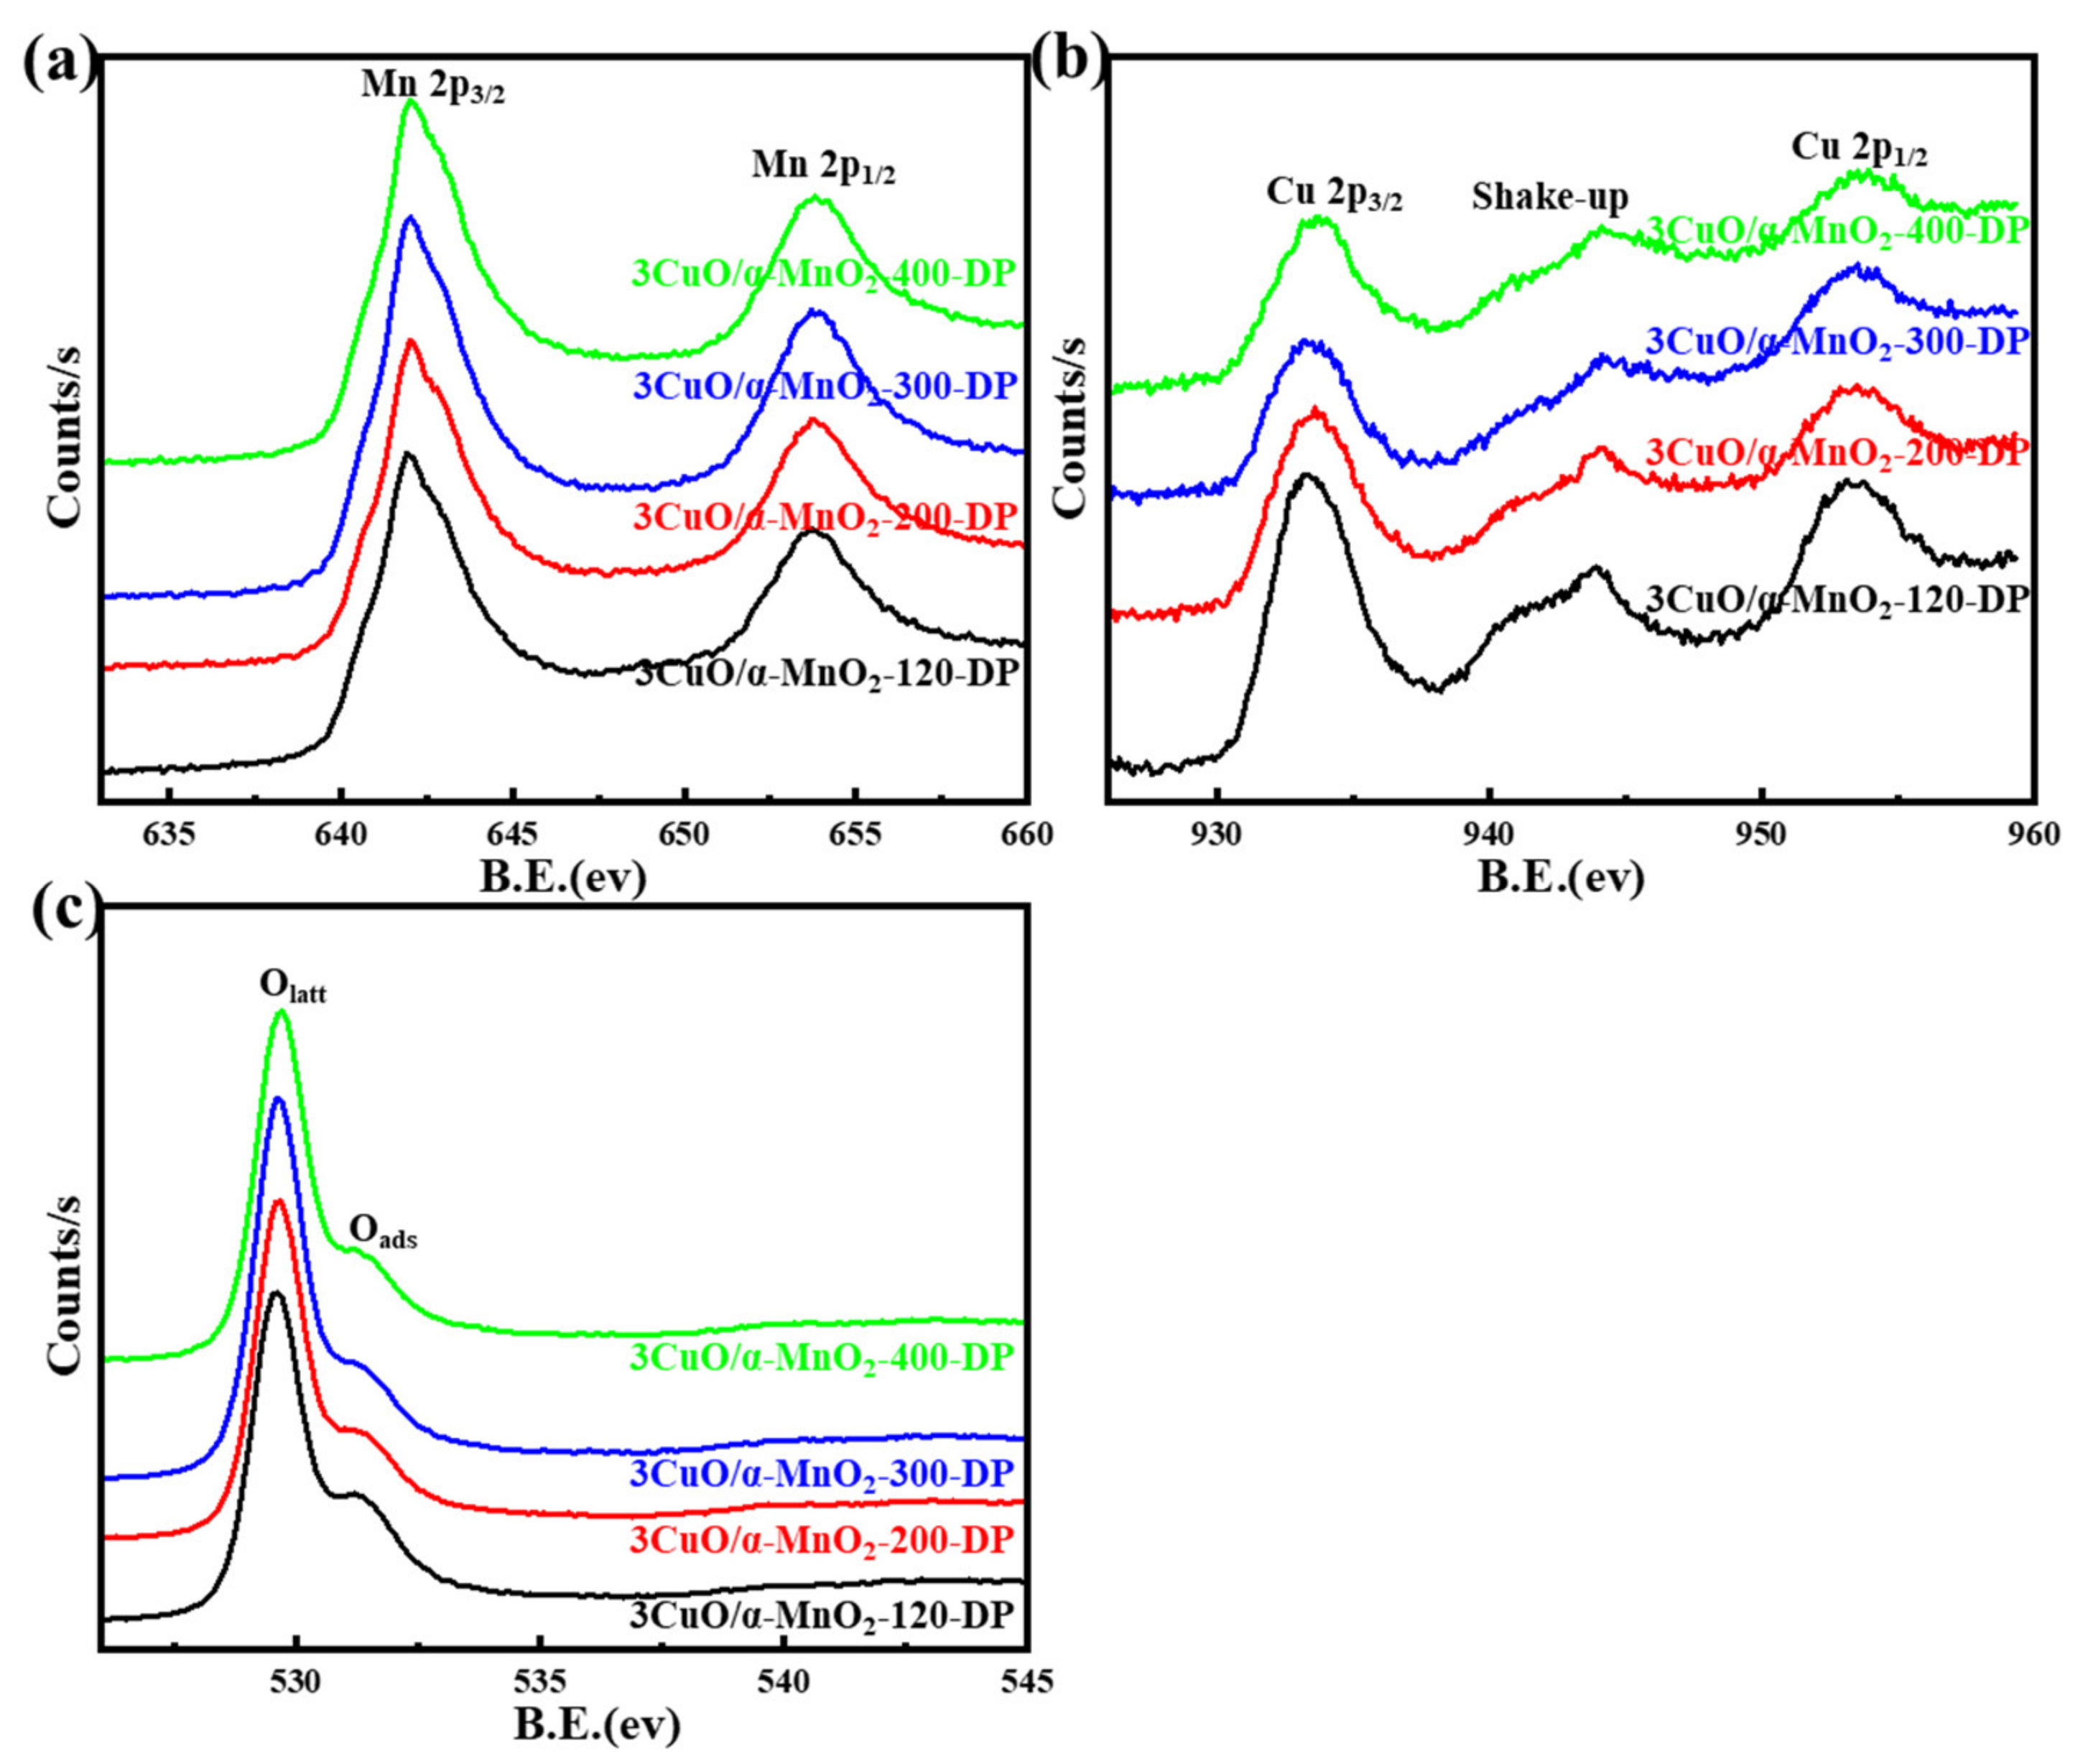
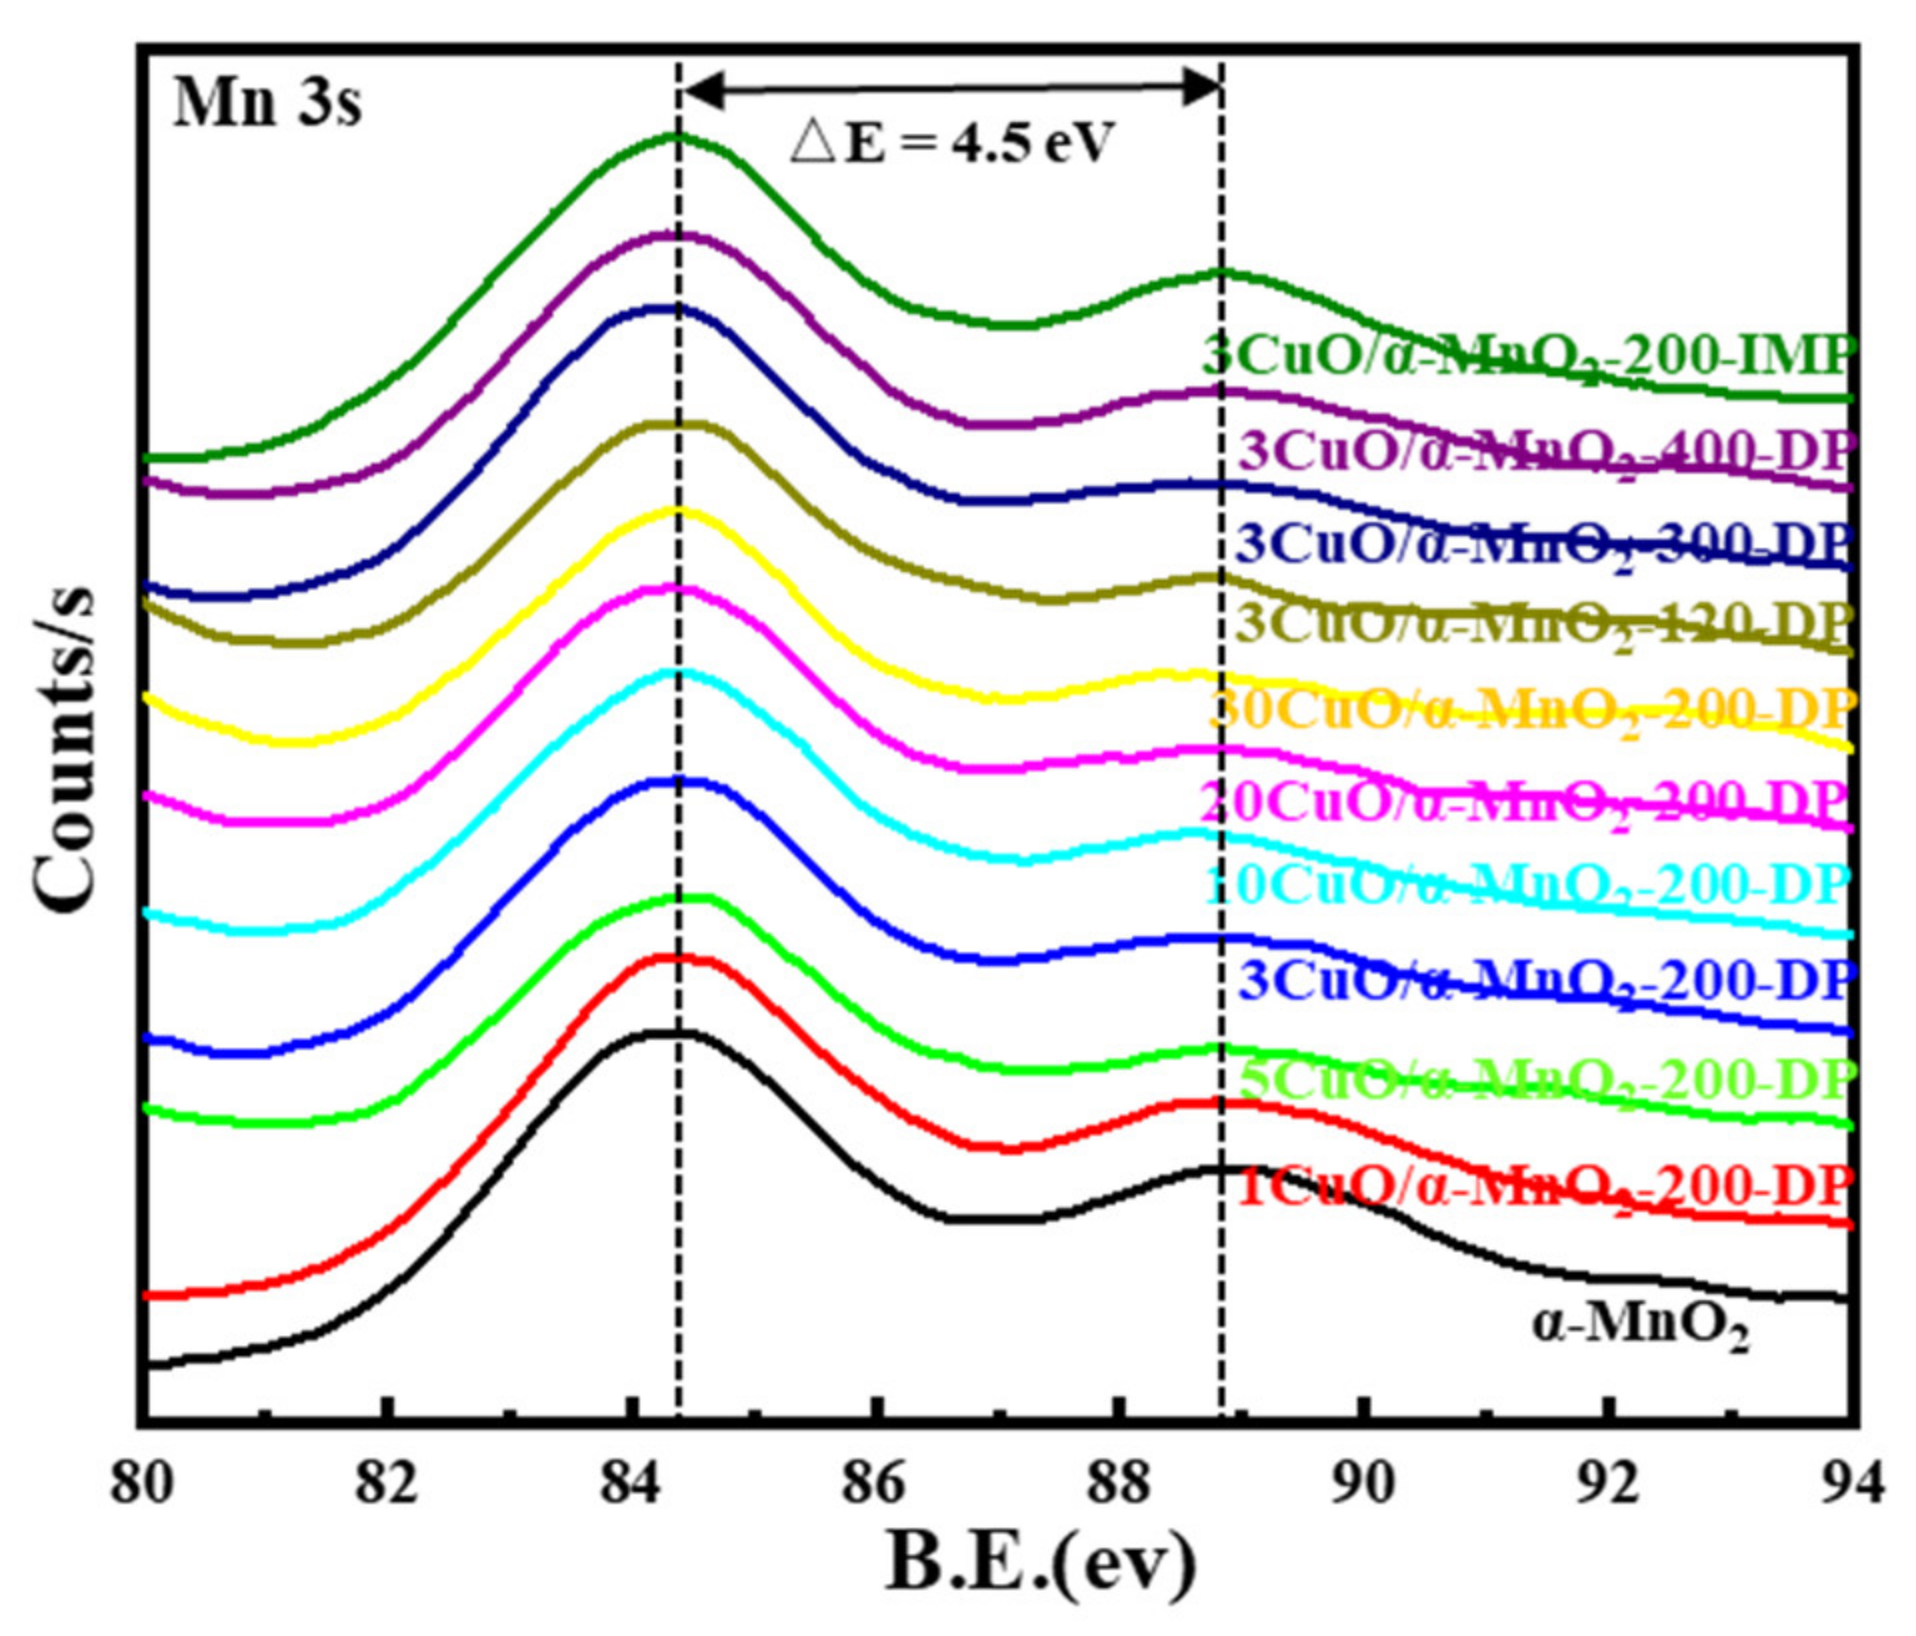
An XPS analysis of a series of prepared catalysts provided further evidence of surface chemical coordination, valence and composition states. Their XPS curves were shown in Figure 4, Figure 5, Figure 6 and Figure 7. It can be seen from Figure 7 that the XPS spectrum of Mn 3s had a double peak structure, and the double peak spacing of all catalysts was 4.5 eV. Therefore, it could be concluded that the Mn species in all catalysts existed in the form of MnO2. It can be seen from Figure 4a,c that the XPS distribution of Mn 2p and O 1s catalysts under different loading modes was almost the same, because the addition of a small amount of CuO did not affect the overall element concentration ratio of Mn and O. It can be observed from Figure 4b that these catalysts have two main peaks at 933.3 eV and 953.03 eV, which may be attributed to Cu 2p3/2 and Cu 2p1/2, respectively. In addition, it was noteworthy that the Cu 2p3/2 peak was almost accompanied by an oscillating satellite peak in the range of 940.38–943.28 eV. This was accompanied by three satellite peaks with Cu 2p3/2 peaks at 940.4 eV (I), 941.8 eV (II), and 943.4 eV (III). It was well known that the satellite peak was caused by the transfer of electrons from the ligand orbit to the 3d orbit of Cu, which confirmed the existence of Cu2+ in the divalent form of the 3d9 structure, rather than the species level of Cu+ or Cu0 with d-filled energy [35,36]. Meanwhile, the XPS spectrum of Cu 2p varies greatly under different loading modes. The peak intensity of the Cu 2p spectrum of the 3CuO/α-MnO2-200-IMP catalyst was significantly lower than that of the 3CuO/α-MnO2-200-DP catalyst. The peak intensity of the Cu 2p spectrum of the 3CuO/α-MnO2-200-IMP catalyst was significantly lower than that of the 3CuO/α-MnO2-200-DP catalyst. The main reason for this was the different CuO dispersion over these catalysts. Specifically, the CuO dispersion of the 3CuO/α-MnO2-200-IMP catalyst was poorer than the 3CuO/α-MnO2-200-DP catalyst. According to the XPS survey spectra results (Table 1), the surface concentration of the Cu element over the 3CuO/α-MnO2-200-DP catalyst was 2.9%, which was similar to the content of the Cu element that was added. However, the surface concentration (1.7%) of the Cu element in the 3CuO/α-MnO2-200-IMP catalyst was much lower than the theoretical value. These results indicated that the deposition-precipitation method could better disperse the CuO than the initial impregnation method over the α-MnO2 nanowire support.
The XPS spectra of Mn 2p, O 1s and Cu 2p at different calcination temperatures of the 3CuO/α-MnO2-T-DP catalyst are shown in Figure 5. As can be seen from Figure 5a, these catalysts had two main peaks at 654.0 eV and 642.1 eV, which belong to Mn 2p1/2 and Mn 2p3/2 spin orbits, respectively. It should be noted that these two peaks were characteristic signals of Mn (IV). All these indicated the occurrence of interfacial reactions and the formation of MnO2. To show the redox characteristics of the prepared catalyst, the surface oxidation state of copper was also studied [37]. As can be seen from Figure 5b, the XPS peaks that are centered on 954.0 eV and 933.0 eV belong to Cu 2p1/2 and Cu 2p3/2, respectively. The binding energy of Cu 2p increased with the increase in calcination temperature. Meanwhile, with the increase in calcination temperature, the peak intensity corresponding to Cu 2p decreased, which may be caused by the decrease in Cu species’ concentration on the catalyst surface, caused by the increase in calcination temperature. To further investigate the properties of various oxygen substances on the 3CuO/α-MnO2-T-DP catalyst, the XPS spectrum of O 1s of 3CuO/α-MnO2-T-DP are shown in Figure 5c. All the catalysts show two peaks of different oxygen species. Specifically, the peaks of 529.9 eV and 531.2 eV can be attributed to the lattice oxygen (Olatt) and surface-adsorbed oxygen (Oads) of CuOx and α-MnO2, respectively. Combined with the data after peak fitting in Table 2, with the increase in calcination temperature, the acromial area ratio also decreased correspondingly. The oxygen vacancy concentration of 3CuO/α-MnO2-200-DP was the highest. According to previous reports [38], the formation of oxygen anion radicals was due to the increased adsorption of environmental oxygen by surface oxygen vacancies, which will further improve the performance of catalysts.
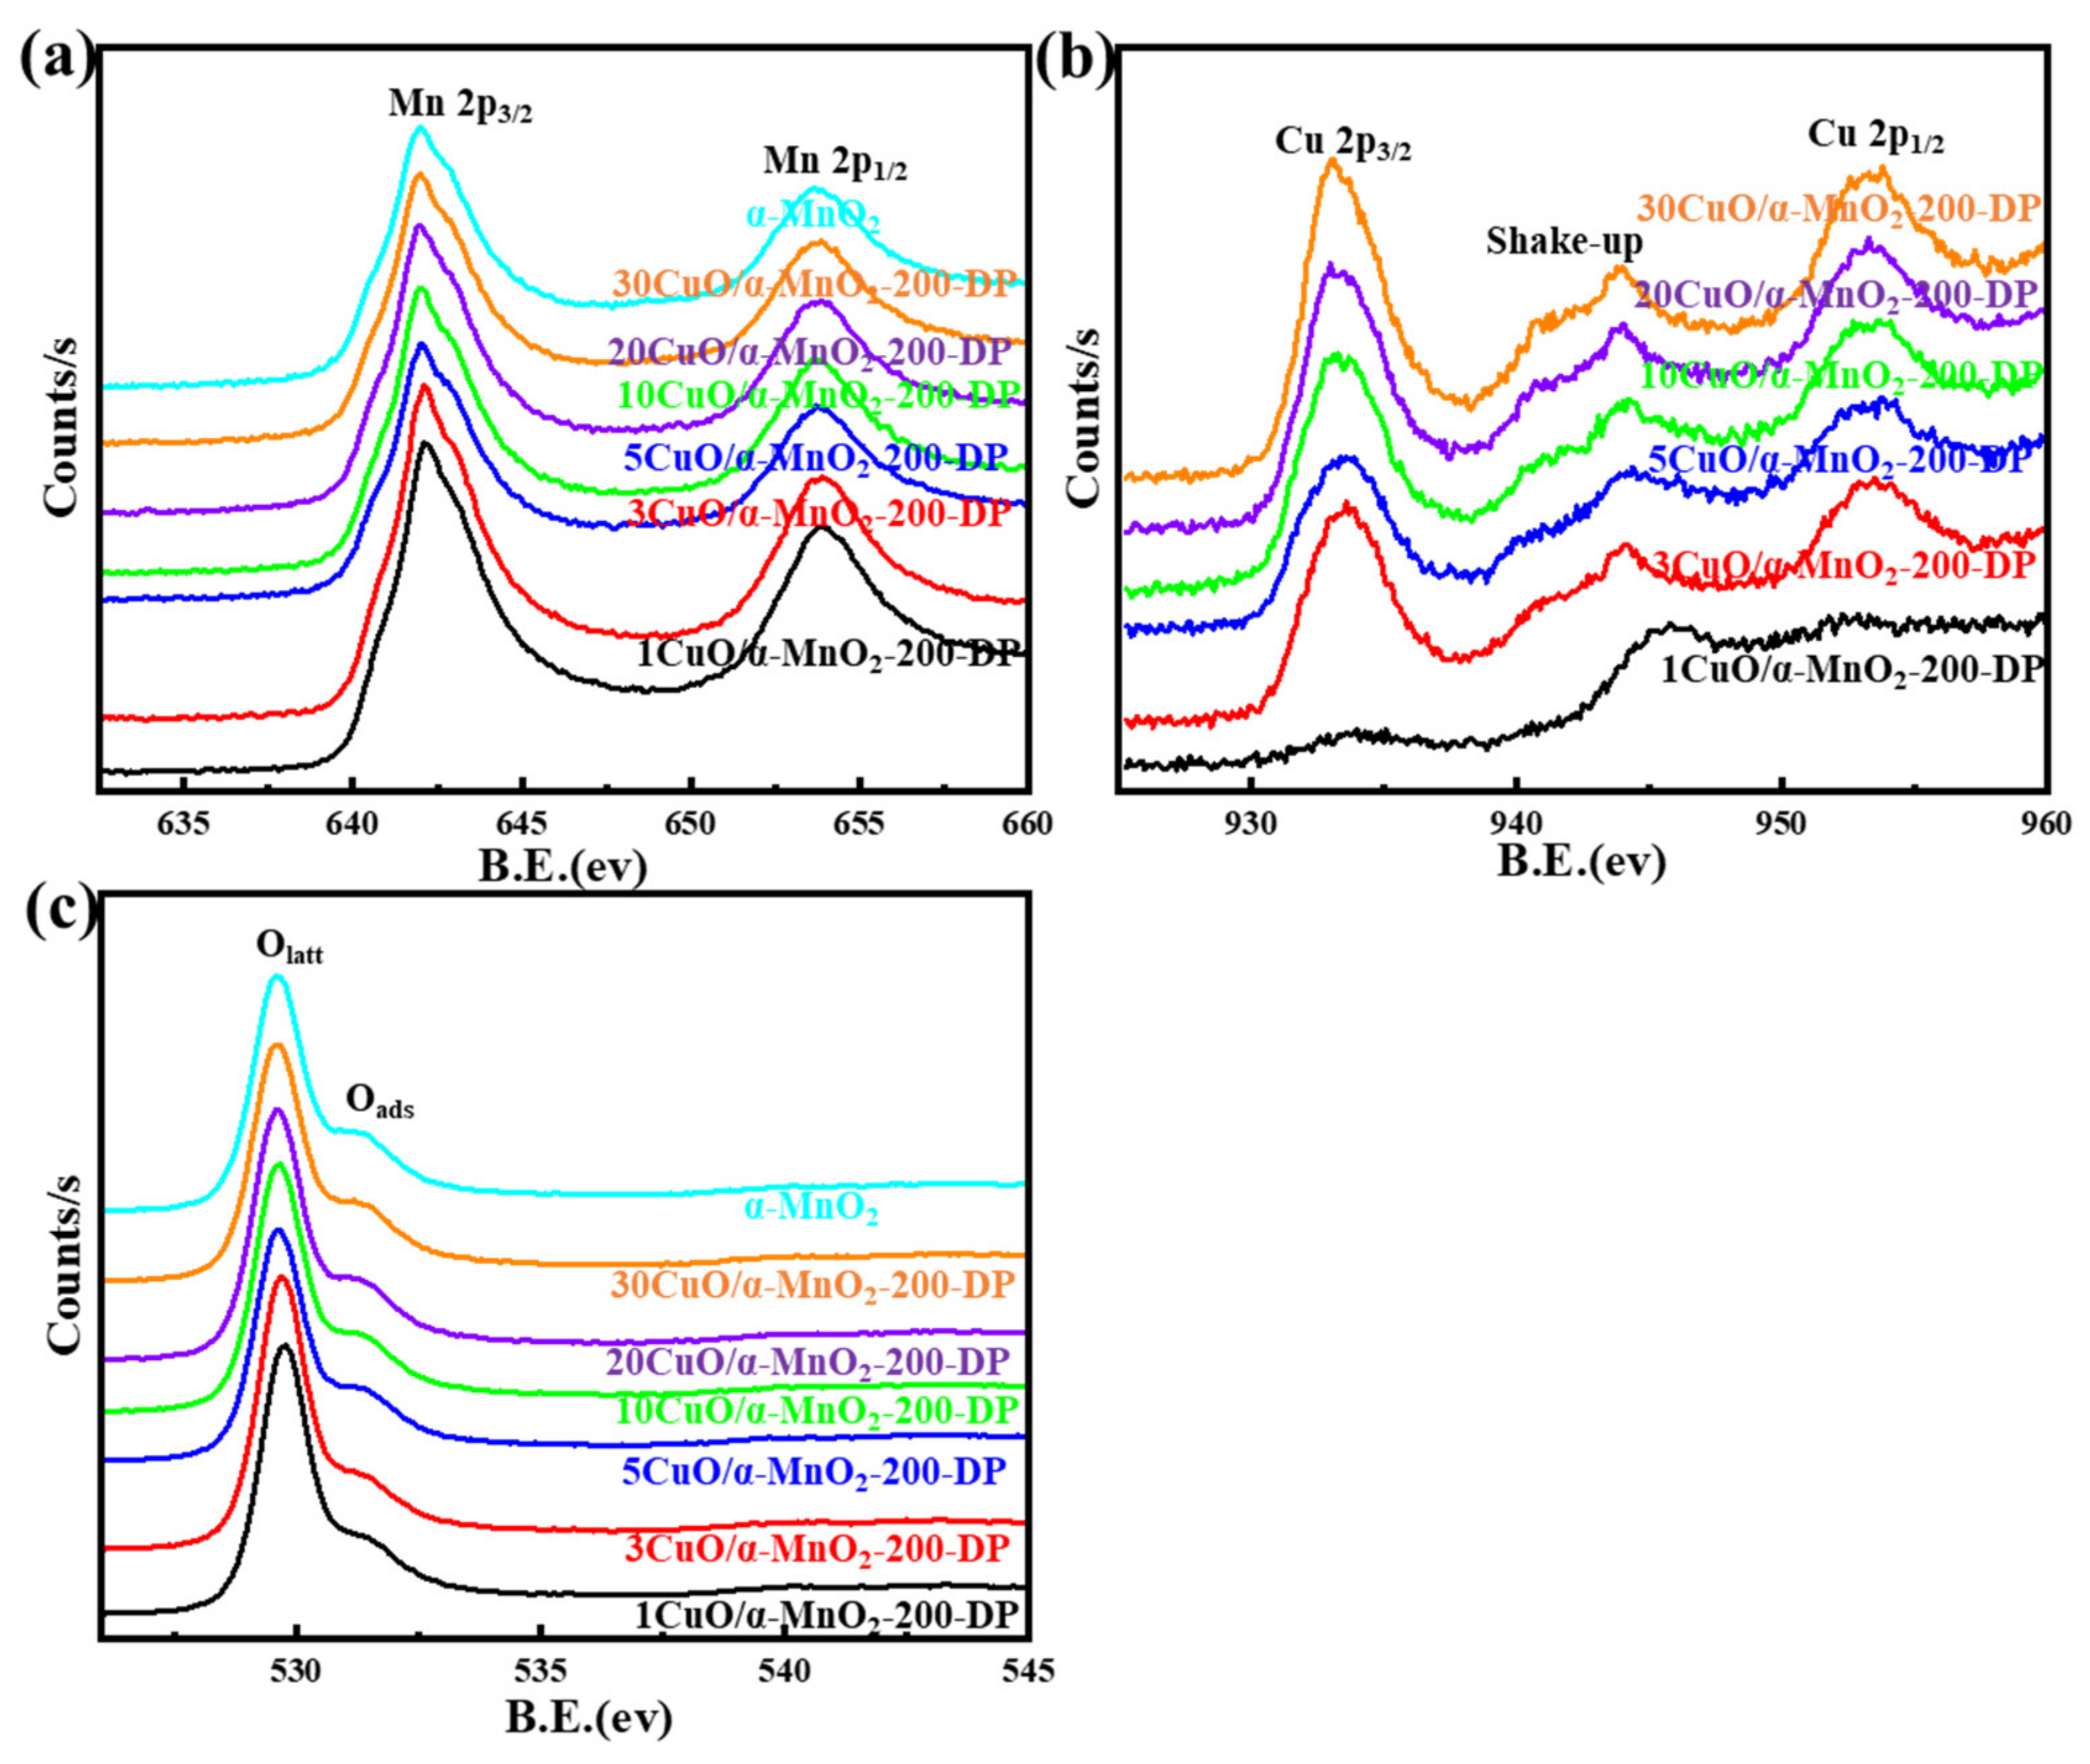
Figure 6 shows the XPS spectra of Mn 2p, O 1s and Cu 2p in xCuO/α-MnO2-200-DP catalysts with different CuO loadings. As can be seen from Figure 6a, these catalysts had two main peaks at 652.7 eV and 642.0 eV, which were Mn 2p1/2 and Mn 2p3/2, respectively. This indicated that Mn existed in the form of Mn4+ in the xCuO/α-MnO2-200-DP catalyst. In order to show the redox characteristics of the prepared catalyst, the surface oxidation state of copper was also studied [39]. As can be seen from Figure 6b, these catalysts had two main peaks at 953.0 eV and 933.0 eV, namely Cu 2p1/2 and Cu 2p3/2. It was noteworthy that the peak intensity of the Cu 2p spectrum increased significantly with the increase in copper content, and the corresponding peak fitting results also showed that the proportion of Cu element increased. In order to clarify the properties of various oxygen-containing substances on the xCuO/α-MnO2-200-DP catalyst, the XPS spectra of O 1s of all the xCuO/α-MnO2-200-DP catalysts are shown in Figure 6c. According to the binding energy of surface elements, the binding energy of the xCuO/α-MnO2-T-DP catalyst in Table 3 decreased with the increase in CuO loading. Combined with the data after peak fitting in Table 2, 3CuO/α-MnO2-200-DP had the highest acromion area ratio of O 1s. Metal-support interactions between well-dispersed CuO and MnO2 support produce more surface oxygen and defects. These oxygen and defects predominated when the catalysts exhibited strong CO oxidation properties, and high oxygen vacancy provided a higher catalyst performance for CO catalytic oxidation. In conclusion, different CuO loadings and calcination temperatures together affect the formation of oxygen vacancy on the surface of the catalyst, and further affect the catalytic oxidation performance of CO.
3.1.4. H2-TPR Analysis
In order to study the interaction between catalyst support and CuO, a H2-TPR analysis was systematically carried out on the catalysts of commercial MnO2 and α-MnO2 nanowire that were loaded with CuO under different CuO loadings, different calcination temperatures and different loading methods. The typical H2-TPR curve is shown in Figure 7.
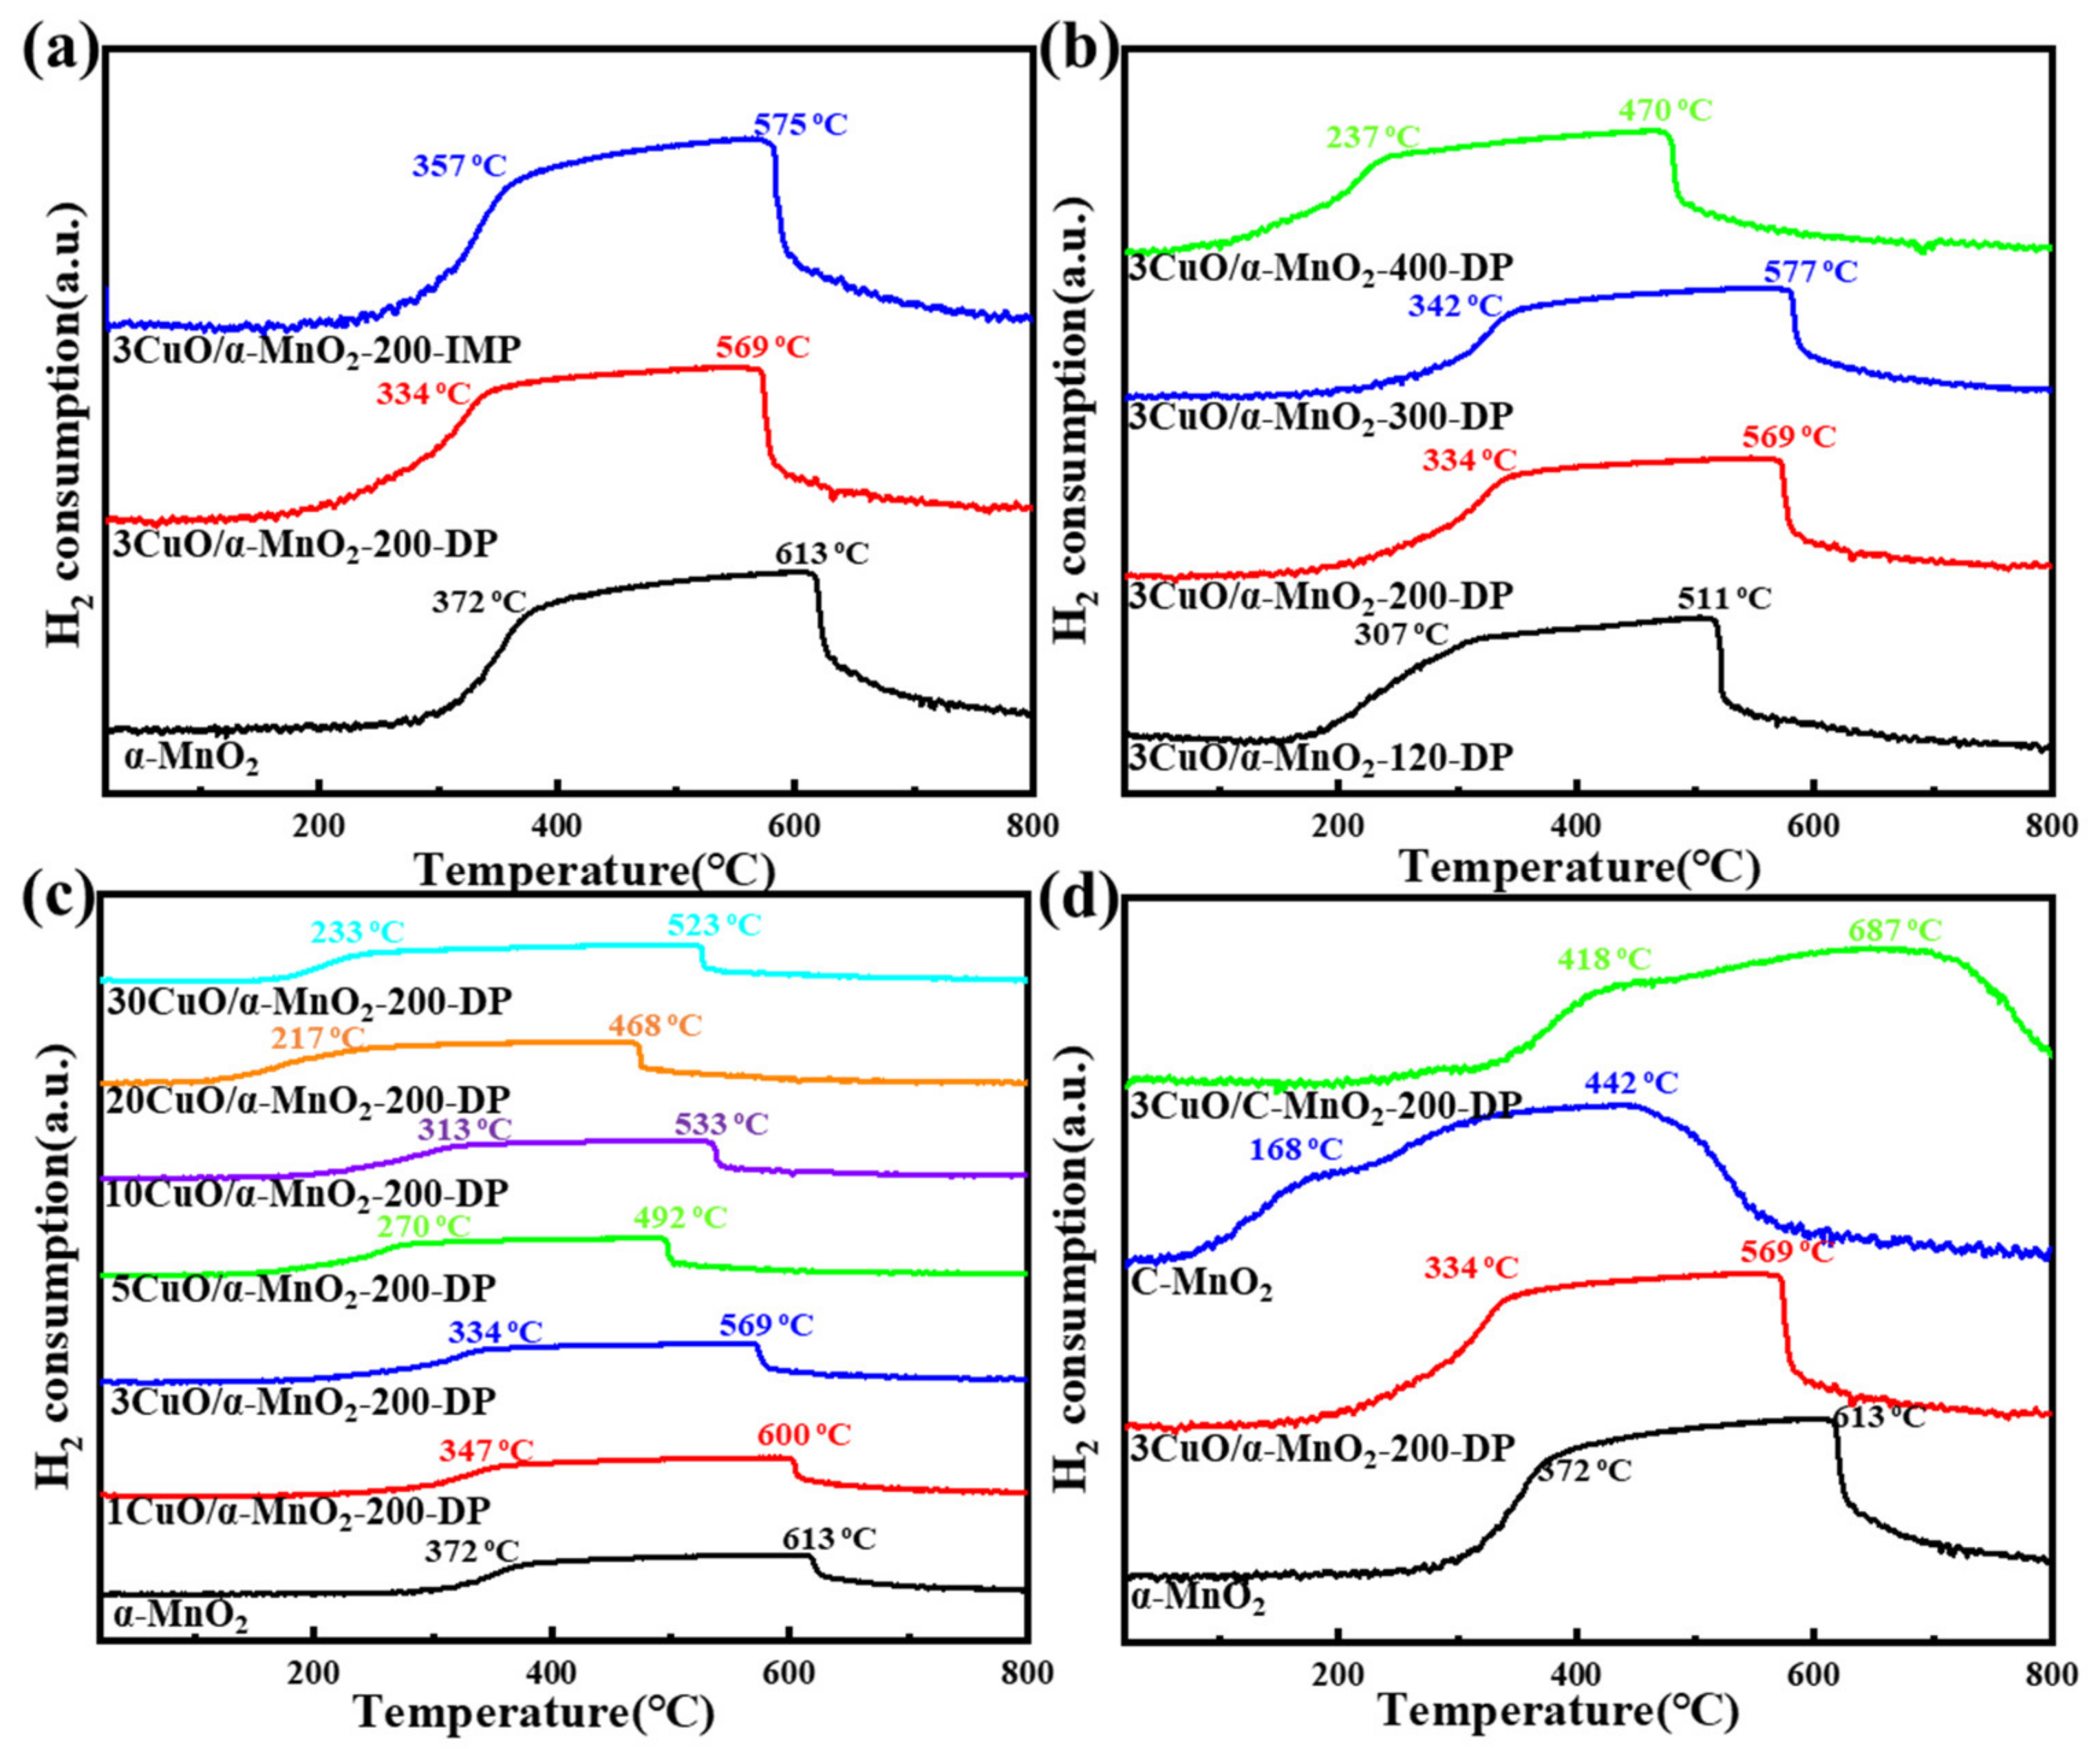
Figure 8a shows the H2-TPR curves of α-MnO2 nanowire catalyst under different loading modes. With the loading of CuO, the reduction peak of the catalyst moved towards a low temperature, and the reduction in catalyst by precipitation deposition was improved more obviously. This meant that the interaction between CuO and α-MnO2 nanowire was stronger. Figure 8b shows the H2-TPR curves of the 3CuO/α-MnO2-T-DP nanowire catalysts that were calcined at 120 °C, 200 °C, 300 °C and 400 °C. With the increase in calcination temperature, the relative position between the two reduction peaks of the catalyst basically remained unchanged, and the H2-TPR curve of the catalysts that were calcined at 200 °C and 300 °C moved to a higher temperature. The increase in CuO composition at this temperature required a higher temperature to completely reduce the catalyst. This indicated that the excellent reduction performance could be reduced by high loading. Figure 8c shows the H2-TPR curve of α-MnO2 nanowire with two main peaks, the maximum values of which were concentrated at 372 °C and 613 °C, respectively. The first peak at 372 °C was attributed to the reduction in MnO2 to Mn3O4, while the second peak at 613 °C was attributed to the reduction in Mn3O4 to MnO [40]. However, after loading different amounts of CuO, all the xCuO/α-MnO2-200-DP catalysts showed a two-stage reduction peak like that of pure α-MnO2 nanowires, and there was no characteristic reduction peak of CuO species. Meanwhile, the addition of CuO to α-MnO2 nanowire changed the reduction behavior of α-MnO2 nanowire. With the increase in CuO loading, the continuous reduction peaks of MnO2 to Mn3O4 and Mn3O4 to MnO also shift to lower temperatures. This finding clearly indicated that the CuO had a significant effect on the reduction performance of the xCuO/α-MnO2-200-DP catalyst. Figure 8d shows the H2-TPR curves of commercial MnO2 and α-MnO2 nanowire catalysts before and after CuO loading. Unlike α-MnO2 nanowire, the reduction peak of the commercial MnO2 catalyst that was loaded with CuO shifts to a high temperature. This meant that the reduction performance of commercial MnO2 that was loaded with CuO was significantly reduced, indicating that the interaction between CuO and commercial MnO2 was weak. The structural advantages of α-MnO2 nanowires and their ability to interact with oxides were shown from the side view.
3.2. Catalytic Performance for CO Oxidation
3.2.1. Catalytic Activity
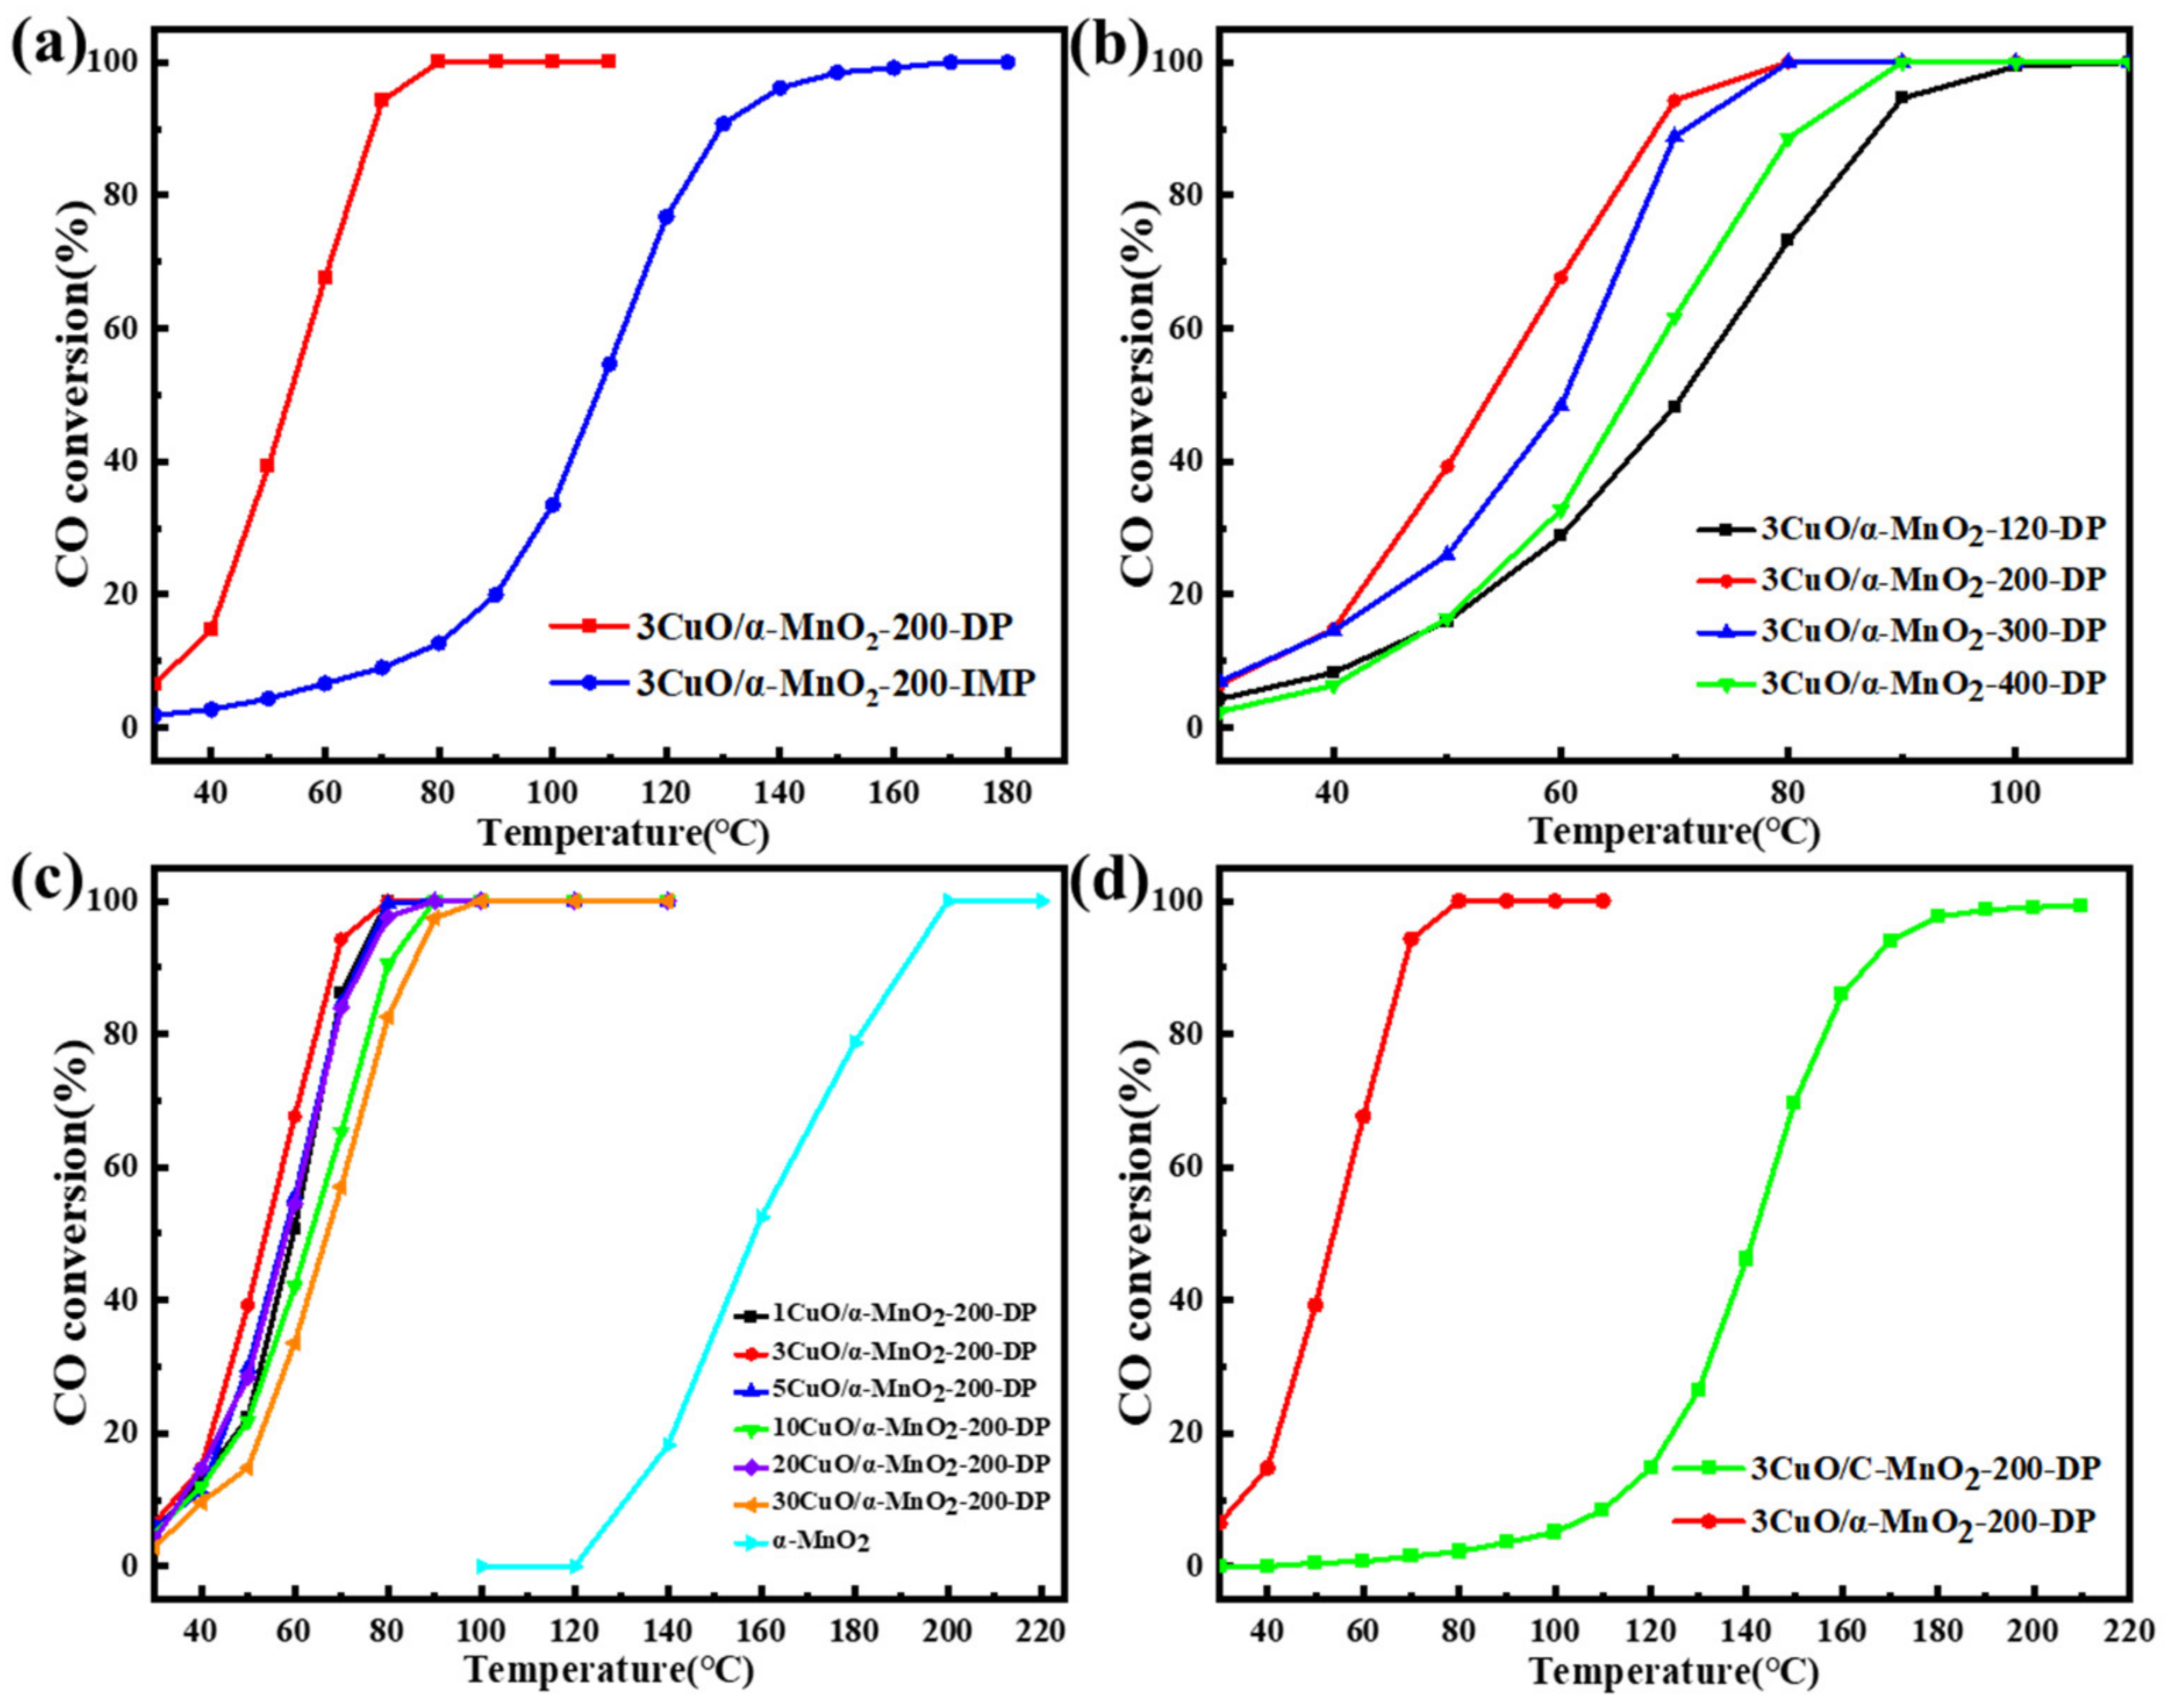
In order to study the influence of the loading mode on the catalytic activity, the catalytic oxidation reaction of 3CuO/α-MnO2-200-DP (deposition precipitation method) and the 3CuO/α-MnO2-200-IMP (initial impregnation method) catalyst CO was studied. The results are shown in Figure 9a. As can be seen in the figure, the 100% CO conversion temperature of the 3CuO/α-MnO2-200-DP catalyst was 80 °C. The catalytic activity of the 3CuO/α-MnO2-200-IMP catalyst was much lower than that of the 3CuO/α-MnO2-200-DP catalyst, and the complete transformation of CO can be realized until 170 °C. This shows that the sedimentation method has obvious advantages over the traditional initial impregnation method.
To study the influence of calcination temperature on the catalytic activity of the 3CuO/α-MnO2-T-DP catalyst, the CO catalytic oxidation reaction was studied at calcination temperatures of 200 °C, 300 °C and 400 °C, and catalyst samples dried only at 120 °C without calcination, as shown in Figure 9b. As can be seen from the figure, the catalytic activity of 3CuO/α-MnO2-T-DP catalyst decreases as the calcination temperature increases from 200 °C to 400 °C. The catalytic activity of catalysts that have been calcined at 120 °C, was lower than that of the catalyst samples that have been calcined at 200 °C to 400 °C. This may be because Cu(NO3)2·3H2O did not decompose completely due to the low temperature of catalyst samples that were calcined above 200 °C during the loading process. The calcination temperature of the catalysts had great influence on the dispersion, structure and metal–surface interaction strength of the catalysts. It can be seen from the XRD pattern that the CuO diffraction peak intensity of 3CuO/α-MnO2-T-DP catalyst was different to some extent. The CuO diffraction peak of 3CuO/α-MnO2-300-DP was the strongest, indicating that the CuO species were poorly dispersed. Therefore, the different catalytic activity of the 3CuO/α-MnO2-T-DP catalyst at different calcination temperatures may be related to the dispersion of CuO active sites. In addition, the difference in catalytic activity of 3CuO/α-MnO2-T-DP catalysts at different calcination temperatures may also be caused by the thermal shrinkage of the catalyst skeleton and the agglomeration of CuO species.
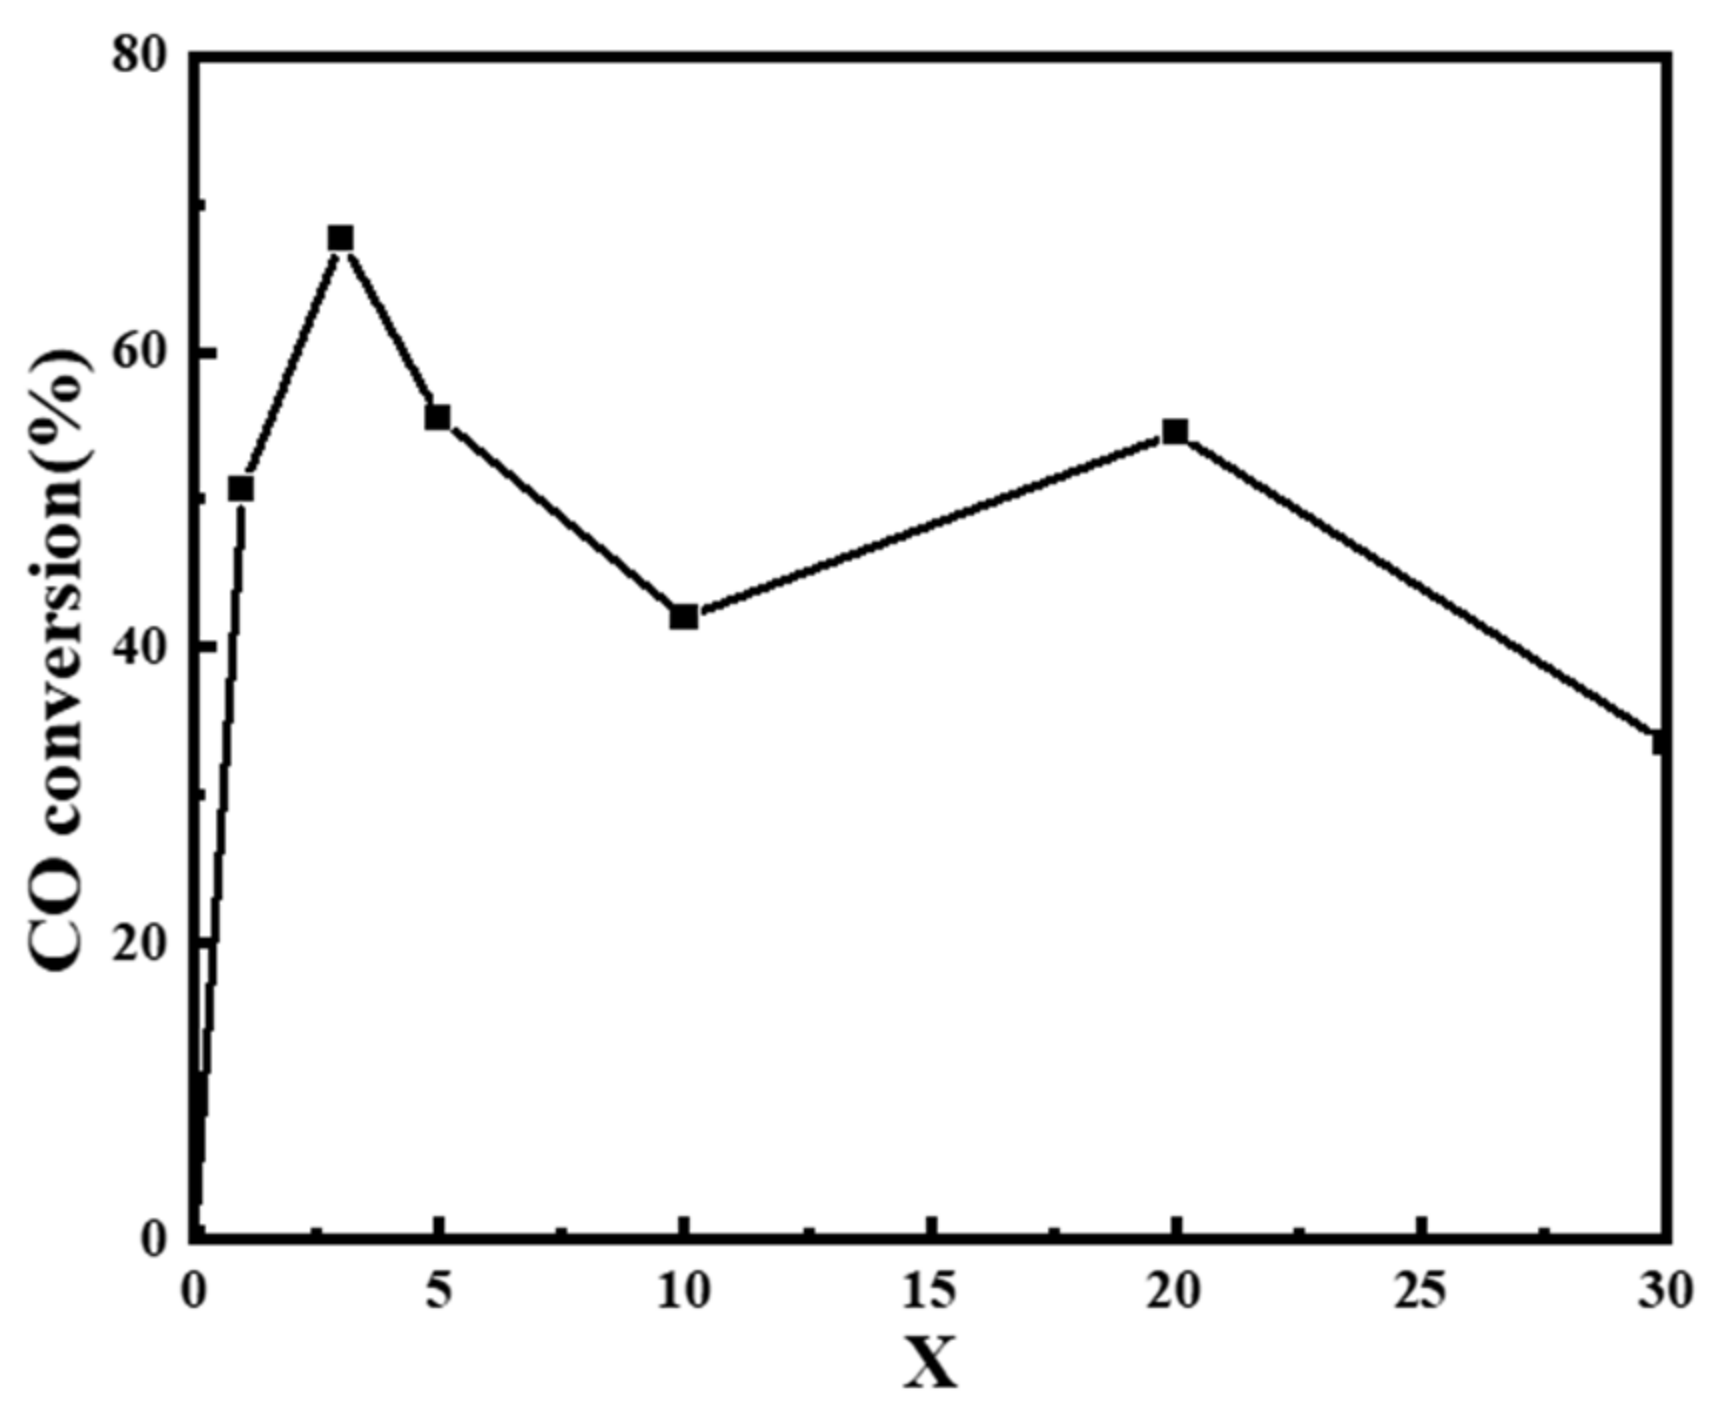
Secondly, the catalytic activity of CO oxidation on the xCuO/α-MnO2-200-DP catalyst with CuO loading was evaluated in detail, as shown in Figure 9c. As can be seen from the figure, pure α-MnO2 nanowire catalyst started to activate at 120 °C. With the increase in reaction temperature, CO conversion gradually increased until reaching 100% at about 200 °C. Compared with pure α-MnO2 nanowire carrier, the xCuO/α-MnO2-200-DP catalyst had higher catalytic activity, especially in the 30–100 °C region. These results indicated that CuO species were the main active center of CO oxidation and the main cause of CO oxidation at a low temperature. To show the difference more clearly in the catalytic activity of the xCuO/α-MnO2-200-DP catalysts with different CuO loads, the CO conversion of the xCuO/α-MnO2-200-DP catalysts was analyzed at 60 °C, as shown in Figure 10. When the CuO load increased from 0 wt% to 3 wt%, the catalytic activity of the xCuO/α-MnO2-200-DP catalyst was significantly enhanced at a low temperature. The 3CuO/α-MnO2-200-DP catalyst showed the highest catalytic activity among all the catalysts, which showed a significant advantage compared with previous studies. However, a further increase in CuO from 3 wt% to 30 wt% lead to a decrease in catalytic activity. The possible reason was that the one-dimensional structure of α-MnO2 nanowires, especially the aspect ratio of the catalyst, decreases significantly with the increase in CuO load, resulting in a poor dispersion of CuO on the surface of the supports.
Meanwhile, in order to study the influence of the nanowire structure and redox performance of the catalyst support on the catalytic activity, commercial MnO2 was used as the contrast carrier for the CO catalytic oxidation reaction and the same loading method was used to prepare the contrast catalyst. Figure 9d shows the catalytic activity of comparative catalysts. In the figure, the 100% CO conversion temperature of the 3CuO/α-MnO2-200-DP catalyst was 80 °C, while the CO conversion of the 3CuO/C-MnO2-200-DP catalyst was close to 100% only when the temperature was above 200 °C. The catalytic activity of the 3CuO/C-MnO2-200-DP catalyst was like the α-MnO2 nanowire support without the CuO load. The advantages of the structure and properties of α-MnO2 nanowire support were illustrated.
3.2.2. Long-Term Stability Test
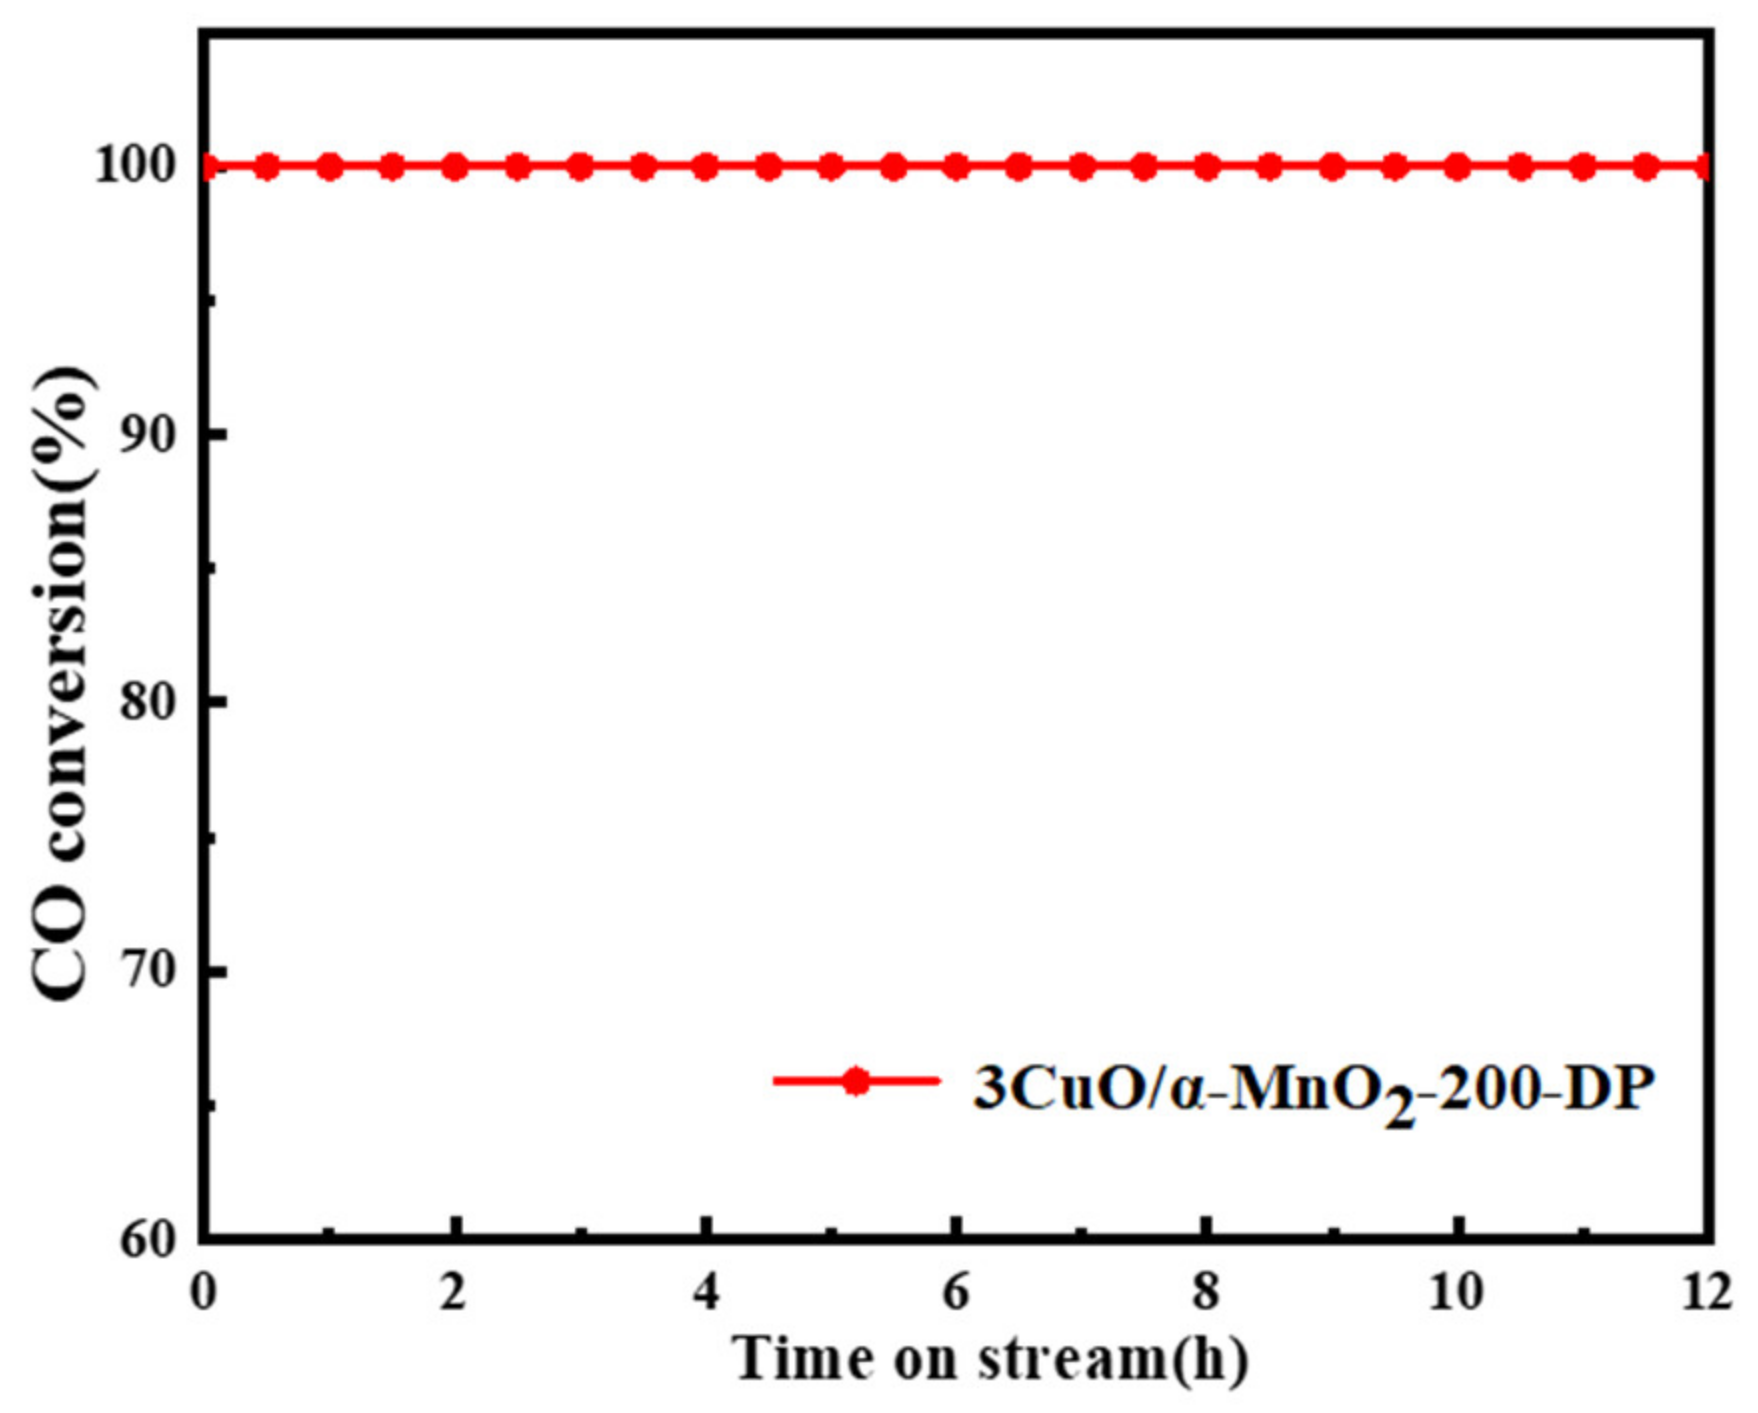
A long-term stability test was carried out to evaluate the catalytic stability of the prepared CuO-based catalyst under the specific reaction conditions (CO/O2/N2 = 1/20/79, GHSV = 12,000 mL·g−1·H−1, 80 °C, 1 atm). The CO oxidation stability of these catalysts was tested for 12 h, and 3CuO/α-MnO2-200-DP was selected as the representative catalyst. As can be seen from Figure 11, the 3CuO/α-MnO2-200-DP catalyst showed excellent stability during the entire 12 h stability test, with the activity remaining at 100% and no significant deactivation. These results indicate that the 3CuO/α-MnO2-200-DP catalyst not only had high temperature activity, but also had good stability.
4. Conclusions
In summary, a series of CuO/α-MnO2 nanowire catalysts with different CuO loadings, different calcination temperatures and different loading modes were synthesized as the supports of a CO catalytic oxidation catalyst. The slenderness ratio of the CuO/α-MnO2 nanowire catalyst decreases with the increase in loading capacity. The results showed that when CuO loading was 3 wt%, calcination temperature was 200 °C and the catalyst that was supported by the deposition precipitation method had the highest catalytic activity. Compared with the commercial MnO2 catalyst, the synthetic α-MnO2 nanowire catalyst has better redox performance and better low-temperature catalytic activity due to the particularity of the microstructure. Compared with commercial MnO2, it was a better catalyst support for CO catalytic oxidation. The CuO particles that were calcined at 200 °C by the precipitation deposition method showed better dispersion on the surface of a α-MnO2 nanowire support, which proved that the precipitation deposition method was superior to the traditional initial impregnation method. In addition, CuO as the active center of CO oxidation formed a strong intermetallic synergistic effect on the surface of the α-MnO2 nanowire support, which further enhanced the CO oxidation activity of the α-MnO2 nanowire support at a low temperature. Because of these advantages, α-MnO2 nanowire is considered as a promising support for the CO oxidation of CuO-based catalysts, and has stronger catalytic activity, especially at low temperatures.
Author Contributions
Conceptualization, M.C. and Y.C.; formal analysis, H.S. and P.G.; investigation, H.S. and Y.C.; resources, M.C.; data curation, Y.S.; writing—original draft preparation, Y.C.; writing—review and editing, L.X.; funding acquisition, M.C. All authors have read and agreed to the published version of the manuscript.
Funding
This research was funded by the National Natural Science Foundation of China (grant number 21976094, 22176100, 21871144) and the Postgraduate Research & Practice Innovation Program of Jiangsu Province in 2022 (KYCX22_1216).
Data Availability Statement
The data supporting the findings of this study are available by reason-able request to [email protected].
Conflicts of Interest
The authors declare no conflict of interest.
References
- Namasivayam, A.M.; Korakianitis, T.; Crookes, R.J.; Bob-Manuel, K.D.H.; Olsen, J. Biodiesel, Emulsified Biodiesel and Dimethyl Ether as Pilot Fuels for Natural Gas Fuelled Engines. Appl. Energy 2010, 87, 769–778. [Google Scholar] [CrossRef]
- Neidell, M.J. Air Pollution, Health, and Socio-Economic Status: The Effect of Outdoor Air Quality on Childhood Asthma. J. Health Econ. 2004, 23, 1209–1236. [Google Scholar] [CrossRef] [PubMed] [Green Version]
- Prado, O.J.; Veiga, M.C.; Kennes, C. Removal of Formaldehyde, Methanol, Dimethylether and Carbon Monoxide from Waste Gases of Synthetic Resin-Producing Industries. Chemosphere 2008, 70, 1357–1365. [Google Scholar] [CrossRef] [PubMed]
- Lee, J.G.; An, K. Catalytic Co Oxidation on Nanocatalysts. Top. Catal. 2018, 61, 986–1001. [Google Scholar] [CrossRef]
- Wang, L.; Wang, L.; Zhang, J.; Wang, H.; Xiao, F.-S. Enhancement of the Activity and Durability in CO Oxidation over Silica-Supported Au Nanoparticle Catalyst Via Ceox Modification. Chin. J. Catal. 2018, 39, 1608–1614. [Google Scholar] [CrossRef]
- Zheng, B.; Wu, S.; Yang, X.; Jia, M.; Zhang, W.; Liu, G. Room Temperature Co Oxidation over Pt/MgFe2O4: A Stable Inverse Spinel Oxide Support for Preparing Highly Efficient Pt Catalyst. ACS Appl. Mater. Interfaces 2016, 8, 26683–26689. [Google Scholar] [CrossRef]
- Camposeco, R.; Hinojosa-Reyes, M.; Castillo, S.; Nava, N.; Zanella, R. Synthesis and Characterization of Highly Dispersed Bimetallic Au-Rh Nanoparticles Supported on Titanate Nanotubes for CO Oxidation Reaction at Low Temperature. Environ. Sci. Pollut. Res. 2021, 28, 10734–10748. [Google Scholar] [CrossRef]
- Zhang, X.; Li, G.; Tian, R.; Feng, W.; Wen, L. Monolithic Porous CuO/CeO2 Nanorod Composites Prepared by Dealloying for CO Catalytic Oxidation. J. Alloys Compd. 2020, 826, 154149. [Google Scholar] [CrossRef]
- Kong, F.; Zhang, H.; Chai, H.; Liu, B.; Cao, Y. Insight into the Crystal Structures and Surface Property of Manganese Oxide on Co Catalytic Oxidation Performance. Inorg. Chem. 2021, 60, 5812–5820. [Google Scholar] [CrossRef]
- Murthy, P.R.; Munsif, S.; Zhang, J.-C.; Li, W.-Z. Influence of CeO2 and ZrO2 on the Thermal Stability and Catalytic Activity of Sba-15-Supported Pd Catalysts for Co Oxidation. Ind. Eng. Chem. Res. 2021, 60, 14424–14433. [Google Scholar] [CrossRef]
- Sun, L.; Zhan, W.; Li, Y.-A.; Wang, F.; Zhang, X.; Han, X. Understanding the Facet-Dependent Catalytic Performance of Hematite Microcrystals in a Co Oxidation Reaction. Inorg. Chem. Front. 2018, 5, 2332–2339. [Google Scholar] [CrossRef]
- Baidya, T.; Murayama, T.; Nellaiappan, S.; Katiyar, N.K.; Bera, P.; Safonova, O.; Lin, M.; Priolkar, K.R.; Kundu, S.; Rao, B.S.; et al. Ultra-Low-Temperature Co Oxidation Activity of Octahedral Site Cobalt Species in CO3O4 Based Catalysts: Unravelling the Origin of the Unique Catalytic Property. J. Phys. Chem. C 2019, 123, 19557–19571. [Google Scholar] [CrossRef]
- Lou, Y.; Wang, L.; Zhao, Z.; Zhang, Y.; Zhang, Z.; Lu, G.; Guo, Y.; Guo, Y. Low-Temperature CO Oxidation over CO3O4-Based Catalysts: Significant Promoting Effect of Bi2O3 on CO3O4 Catalyst. Appl. Catal. B Environ. 2014, 146, 43–49. [Google Scholar] [CrossRef]
- Cui, Y.; Xu, L.; Chen, M.; Lv, C.; Lian, X.; Wu, C.-E.; Yang, B.; Miao, Z.; Wang, F.; Hu, X. Co Oxidation over Metal Oxide (La2O3, Fe2O3, PrO2, Sm2O3, and MnO2) Doped Cuo-Based Catalysts Supported on Mesoporous Ce0.8Zr0.2O2 with Intensified Low-Temperature Activity. Catalysts 2019, 9, 724. [Google Scholar] [CrossRef] [Green Version]
- Ren, Y.; Ma, Z.; Qian, L.; Dai, S.; He, H.; Bruce, P.G. Ordered Crystalline Mesoporous Oxides as Catalysts for Co Oxidation. Catal. Lett. 2009, 131, 146–154. [Google Scholar] [CrossRef]
- Song, H.; Xu, L.; Chen, M.; Cui, Y.; Wu, C.-E.; Qiu, J.; Xu, L.; Cheng, G.; Hu, X. Recent Progresses in the Synthesis of MnO2 Nanowire and Its Application in Environmental Catalysis. RSC Adv. 2021, 11, 35494–35513. [Google Scholar] [CrossRef]
- Zhao, G.-Y.; Li, H.-L. Electrochemical Oxidation of Methanol on Pt Nanoparticles Composited MnO2 Nanowire Arrayed Electrode. Appl. Surf. Sci. 2008, 254, 3232–3235. [Google Scholar] [CrossRef]
- Ren, Y.; Ma, Z.; Dai, S. Nanosize Control on Porous Beta-MnO2 and Their Catalytic Activity in Co Oxidation and N2O Decomposition. Materials 2014, 7, 3547–3556. [Google Scholar] [CrossRef] [Green Version]
- Jampaiah, D.; Velisoju, V.K.; Venkataswamy, P.; Coyle, V.E.; Nafady, A.; Reddy, B.M.; Bhargava, S.K. Nanowire Morphology of Mono- and Bidoped Alpha-MnO2 Catalysts for Remarkable Enhancement in Soot Oxidation. ACS Appl. Mater. Interfaces 2017, 9, 32652–32666. [Google Scholar] [CrossRef]
- Du, H.; Wang, Y.; Arandiyan, H.; Younis, A.; Scott, J.; Qu, B.; Wan, T.; Lin, X.; Chen, J.; Chu, D. Design and Synthesis of CeO2 Nanowire/MnO2 Nanosheet Heterogeneous Structure for Enhanced Catalytic Properties. Mater. Today Commun. 2017, 11, 103–111. [Google Scholar] [CrossRef]
- Saputra, E.; Muhammad, S.; Sun, H.; Patel, A.; Shukla, P.; Zhu, Z.H.; Wang, S. Alpha-MnO2 Activation of Peroxymonosulfate for Catalytic Phenol Degradation in Aqueous Solutions. Catal. Commun. 2012, 26, 144–148. [Google Scholar] [CrossRef]
- Liang, S.; Bulgan, F.T.G.; Zong, R.; Zhu, Y. Effect of Phase Structure of MnO2 Nanorod Catalyst on the Activity for Co Oxidation. J. Phys. Chem. C 2008, 112, 5307–5315. [Google Scholar] [CrossRef]
- Zhang, Y.; Deng, S.; Luo, M.; Pan, G.; Zeng, Y.; Lu, X.; Ai, C.; Liu, Q.; Xiong, Q.; Wang, X.; et al. Defect Promoted Capacity and Durability of N-MnO2-X Branch Arrays Via Low-Temperature NH3 Treatment for Advanced Aqueous Zinc Ion Batteries. Small 2019, 15, 1905452. [Google Scholar] [CrossRef]
- Selvakumar, K.; Duraisamy, V.; Venkateshwaran, S.; Arumugam, N.; Almansour, A.I.; Wang, Y.; Liu, T.X.; Kumar, S.M.S. Development of Alpha-MnO2 Nanowire with Ni- and (Ni, Co)-Cation Doping as an Efficient Bifunctional Oxygen Evolution and Oxygen Reduction Reaction Catalyst. ChemElectroChem 2022, 9, e202101303. [Google Scholar] [CrossRef]
- Wang, J.; Luo, H.; Liu, P. Highly Dispersed Gold Nanoparticles on Metal-Doped Alpha-MnO2 Catalysts for Aerobic Selective Oxidation of Ethanol. Catal. Commun. 2020, 142, 106030. [Google Scholar] [CrossRef]
- Li, X.; Cheng, H.; Liang, G.; He, L.; Lin, W.; Yu, Y.; Zhao, F. Effect of Phosphine Doping and the Surface Metal State of Ni on the Catalytic Performance of Ni/Al2O3 Catalyst. Catalysts 2015, 5, 759–773. [Google Scholar] [CrossRef] [Green Version]
- Hashem, A.M.; Abuzeid, H.M.; Narayanan, N.; Ehrenberg, H.; Julien, C.M. Synthesis, Structure, Magnetic, Electrical and Electrochemical Properties of Al, Cu and Mg Doped MnO2. Mater. Chem. Phys. 2011, 130, 33–38. [Google Scholar] [CrossRef]
- Gao, J.; Jia, C.; Zhang, L.; Wang, H.; Yang, Y.; Hung, S.-F.; Hsu, Y.-Y.; Liu, B. Tuning Chemical Bonding of MnO2 through Transition-Metal Doping for Enhanced CO Oxidation. J. Catal. 2016, 341, 82–90. [Google Scholar] [CrossRef]
- Zhang, Z.; Tian, Y.; Zhao, W.; Wu, P.; Zhang, J.; Zheng, L.; Ding, T.; Li, X. Hydroxyl Promoted Preferential and Total Oxidation of Co over Epsilon-MnO2 Catalyst. Catal. Today 2020, 355, 214–221. [Google Scholar] [CrossRef]
- Xu, R.; Wang, X.; Wang, D.S.; Zhou, K.B.; Li, Y.D. Surface Structure Effects in Nanocrystal MnO2 and Ag/MnO2 Catalytic Oxidation of CO. J. Catal. 2006, 237, 426–430. [Google Scholar] [CrossRef]
- Tuan Sang, T.; Tripathi, K.M.; Kim, B.N.; You, I.-K.; Park, B.J.; Han, Y.H.; Kim, T. Three-Dimensionally Assembled Graphene/Alpha-MnO2 Nanowire Hybrid Hydrogels for High Performance Supercapacitors. Mater. Res. Bull. 2017, 96, 395–404. [Google Scholar]
- Qian, K.; Qian, Z.; Hua, Q.; Jiang, Z.; Huang, W. Structure-Activity Relationship of CuO/MnO2 Catalysts in CO Oxidation. Appl. Surf. Sci. 2013, 273, 357–363. [Google Scholar] [CrossRef]
- Kumar, J.P.; Ramachatyulu, P.V.R.K.; Prasad, G.K.; Singh, B. Montmorillonites Supported with Metal Oxide Nanoparticles for Decontamination of Sulfur Mustard. Appl. Clay Sci. 2015, 116, 263–272. [Google Scholar] [CrossRef]
- Papadas, I.T.; Ioakeimidis, A.; Vamvasakis, I.; Eleftheriou, P.; Armatas, G.S.; Choulis, S.A. All-Inorganic P-N Heterojunction Solar Cells by Solution Combustion Synthesis Using N-Type FeMnO3 Perovskite Photoactive Layer. Front. Chem. 2021, 9, 803. [Google Scholar] [CrossRef]
- Tafur, J.P.; Abad, J.; Roman, E.; Fernandez Romero, A.J. Charge Storage Mechanism of MnO2 Cathodes in Zn/MnO2 Batteries Using Ionic Liquid-Based Gel Polymer Electrolytes. Electrochem. Commun. 2015, 60, 190–194. [Google Scholar] [CrossRef]
- Kawai, J.; Maeda, K.; Nakajima, K.; Gohshi, Y. Relation between Copper L X-ray Fluorescence and 2p X-ray Photoelectron Spectroscopies. Phys. Rev. B 1993, 48, 8560–8566. [Google Scholar] [CrossRef]
- Du, J.; Xiao, G.; Xi, Y.; Zhu, X.; Su, F.; Kim, S.H. Periodate Activation with Manganese Oxides for Sulfanilamide Degradation. Water Res. 2020, 169, 115278. [Google Scholar] [CrossRef]
- Mckinney P V, Reduction of palladium oxide by carbon monoxide. J. Am. Chem. Soc. 1932, 54, 4498–4504. [CrossRef]
- Freitas, I.C.; Damyanova, S.; Oliveira, D.C.; Marques, C.M.P.; Bueno, J.M.C. Effect of Cu Content on the Surface and Catalytic Properties of Cu/ZrO2 Catalyst for Ethanol Dehydrogenation. J. Mol. Catal. A Chem. 2014, 381, 26–37. [Google Scholar] [CrossRef]
- Sun, M.; Lan, B.; Lin, T.; Cheng, G.; Ye, F.; Yu, L.; Cheng, X.; Zheng, X. Controlled Synthesis of Nanostructured Manganese Oxide: Crystalline Evolution and Catalytic Activities. CrystEngComm 2013, 15, 7010–7018. [Google Scholar] [CrossRef]
Figure 1.
XRD patterns of (a) 3CuO/α-MnO2-200-DP and 3CuO/α-MnO2-200-IMP catalysts under different loading methods; (b) 3CuO/α-MnO2-T-DP (T = 120, 200, 300, 400) catalysts with different calcination temperatures; (c) xCuO/α-MnO2-200-DP (x = 0, 1, 3, 5, 10, 20, 30) catalysts with different CuO loading; (d) α-MnO2 nanowire, commercial MnO2 (C-MnO2) and corresponding catalysts.

Figure 2.
SEM images of α-MnO2 nanowire support (a,b), 5CuO/α-MnO2-200-DP (c,d) and 30CuO/α-MnO2-200-DP (e,f) catalysts.
Figure 2.
SEM images of α-MnO2 nanowire support (a,b), 5CuO/α-MnO2-200-DP (c,d) and 30CuO/α-MnO2-200-DP (e,f) catalysts.

Figure 3.
STEM and EDS element mapping images showing the spatial distribution of Mn and Cu elements: (a,b) 3CuO/α-MnO2-200-DP, (c,d) 3CuO/α-MnO2-200-IMP.
Figure 3.
STEM and EDS element mapping images showing the spatial distribution of Mn and Cu elements: (a,b) 3CuO/α-MnO2-200-DP, (c,d) 3CuO/α-MnO2-200-IMP.

Figure 4.
XPS spectra of Mn 2p (a), Cu 2p (b), O 1s (c) and survey spectrum (d) for 3CuO/α-MnO2-200-DP and 3CuO/α-MnO2-200-IMP catalysts under different loading methods.
Figure 4.
XPS spectra of Mn 2p (a), Cu 2p (b), O 1s (c) and survey spectrum (d) for 3CuO/α-MnO2-200-DP and 3CuO/α-MnO2-200-IMP catalysts under different loading methods.

Figure 5.
XPS spectra of Mn 2p (a), Cu 2p (b) and O 1s (c) for 3CuO/α-MnO2-T-IMP catalysts with different calcination temperatures.
Figure 5.
XPS spectra of Mn 2p (a), Cu 2p (b) and O 1s (c) for 3CuO/α-MnO2-T-IMP catalysts with different calcination temperatures.

Figure 6.
XPS spectra of Mn 2p (a), Cu 2p (b) and O 1s (c) for xCuO/α-MnO2-200-DP catalysts with different CuO loading.
Figure 6.
XPS spectra of Mn 2p (a), Cu 2p (b) and O 1s (c) for xCuO/α-MnO2-200-DP catalysts with different CuO loading.

Figure 7.
XPS spectra of Mn 3s for catalysts.

Figure 8.
H2-TPR profiles of (a) α-MnO2, 3CuO/α-MnO2-200-DP and 3CuO/α-MnO2-200-IMP catalysts under different loading methods; (b) 3CuO/α-MnO2-T-DP (T = 120, 200, 300, 400) catalysts with different calcination temperatures; (c) xCuO/α-MnO2-200-DP (x = 0, 1, 3, 5, 10, 20, 30) catalysts with different CuO loading; (d) α-MnO2 nanowire, commercial MnO2 (C-MnO2) and corresponding catalysts.

Figure 9.
(a) 3CuO/α-MnO2-200-DP and 3CuO/α-MnO2-200-IMP catalysts under different loading modes; (b) 3CuO/α-MnO2-T-DP (T = 120, 200, 300, 400) catalysts; (c) xCuO/α-MnO2-200 (x = 0, 1, 3, 5, 10, 20, 30) catalyst; and (d) CO conversion of pure α-MnO2 nanowires and commercial MnO2 catalysts supported by CuO by precipitation deposition at different reaction temperatures.

Figure 10.
CO conversion and conversion of xCuO/α-MnO2-200-DP (x = 0, 1, 3, 5, 10, 20, 30) catalysts with different CuO loading at 60 °C.
Figure 10.
CO conversion and conversion of xCuO/α-MnO2-200-DP (x = 0, 1, 3, 5, 10, 20, 30) catalysts with different CuO loading at 60 °C.

Figure 11.
Stability of 3CuO/α-MnO2-200-DP catalyst at 80 °C for 12 h.


Table 1.
The surface atomic concentration ratio of Mn, Cu, O of the catalysts based on XPS.
| Samples | Mn (%) | Cu (%) | O (%) |
|---|---|---|---|
| α-MnO2 | 21.1 | / | 46.4 |
| 1CuO/α-MnO2-200-DP | 20.8 | 0.9 | 45.8 |
| 3CuO/α-MnO2-200-DP | 18.1 | 2.9 | 51.1 |
| 5CuO/α-MnO2-200-DP | 18.0 | 4.0 | 44.6 |
| 10CuO/α-MnO2-200-DP | 17.8 | 5.6 | 43.8 |
| 20CuO/α-MnO2-200-DP | 16.5 | 7.0 | 39.4 |
| 30CuO/α-MnO2-200-DP | 10.0 | 16.9 | 40.0 |
| 3CuO/α-MnO2-120-DP | 20.4 | 1.2 | 45.5 |
| 3CuO/α-MnO2-300-DP | 17.7 | 2.2 | 44.4 |
| 3CuO/α-MnO2-400-DP | 16.9 | 2.0 | 41.5 |
| 3CuO/α-MnO2-200-IMP | 17.6 | 1.7 | 45.9 |
Table 2.
O 1 s peak areas of the catalysts based on XPS.
| Samples | O 1s Main Peak Area | O 1s Shoulder Peak Area | O 1s Shoulder Peak Area Ratio (%) |
|---|---|---|---|
| α-MnO2 | 129,671.0 | 32,166.2 | 19.8 |
| 1CuO/α-MnO2-200-DP | 140,985.7 | 32,068.2 | 18.5 |
| 3CuO/α-MnO2-200-DP | 118,838.6 | 32,724.9 | 21.6 |
| 5CuO/α-MnO2-200-DP | 138,945.0 | 32,733.5 | 19.1 |
| 10CuO/α-MnO2-200-DP | 137,120.8 | 34,822.0 | 20.3 |
| 20CuO/α-MnO2-200-DP | 129,100.5 | 33,846.1 | 20.7 |
| 30CuO/α-MnO2-200-DP | 129,861.6 | 32,378.3 | 20.0 |
| 3CuO/α-MnO2-120-DP | 129,997.5 | 32,051.5 | 19.8 |
| 3CuO/α-MnO2-300-DP | 132,452.1 | 34,305.7 | 20.6 |
| 3CuO/α-MnO2-400-DP | 134,830.5 | 33,962.0 | 20.1 |
| 3CuO/α-MnO2-200-IMP | 134,777.2 | 32,518.3 | 19.4 |
Table 3.
Binding energies of surface elements in xCuO/α-MnO2-T catalysts.
| Samples | Cu 2p3/2 | O 1s | Mn 2p3/2 |
|---|---|---|---|
| α-MnO2 | / | 529.8 | 642.3 |
| 1CuO/α-MnO2-200-DP | 933.2 | 529.7 | 642.2 |
| 3CuO/α-MnO2-200-DP | 933.3 | 529.7 | 642.2 |
| 5CuO/α-MnO2-200-DP | 933.2 | 529.6 | 642.1 |
| 10CuO/α-MnO2-200-DP | 933.2 | 529.6 | 642.1 |
| 20CuO/α-MnO2-200-DP | 933.1 | 529.6 | 642.1 |
| 30CuO/α-MnO2-200-DP | 933.1 | 529.6 | 642.1 |
| 3CuO/α-MnO2-120-DP | 933.2 | 529.6 | 642.1 |
| 3CuO/α-MnO2-300-DP | 933.3 | 529.6 | 642.1 |
| 3CuO/α-MnO2-400-DP | 933.4 | 529.7 | 642.2 |
| 3CuO/α-MnO2-200-IMP | 933.3 | 529.7 | 642.2 |
Publisher’s Note: MDPI stays neutral with regard to jurisdictional claims in published maps and institutional affiliations. |
© 2022 by the authors. Licensee MDPI, Basel, Switzerland. This article is an open access article distributed under the terms and conditions of the Creative Commons Attribution (CC BY) license (https://creativecommons.org/licenses/by/4.0/).
Share and Cite
MDPI and ACS Style
Cui, Y.; Song, H.; Shi, Y.; Ge, P.; Chen, M.; Xu, L. Enhancing the Low-Temperature CO Oxidation over CuO-Based α-MnO2 Nanowire Catalysts. Nanomaterials 2022, 12, 2083. https://0-doi-org.brum.beds.ac.uk/10.3390/nano12122083
AMA Style
Cui Y, Song H, Shi Y, Ge P, Chen M, Xu L. Enhancing the Low-Temperature CO Oxidation over CuO-Based α-MnO2 Nanowire Catalysts. Nanomaterials. 2022; 12(12):2083. https://0-doi-org.brum.beds.ac.uk/10.3390/nano12122083
Chicago/Turabian StyleCui, Yan, Huikang Song, Yiyu Shi, Pengxiang Ge, Mindong Chen, and Leilei Xu. 2022. "Enhancing the Low-Temperature CO Oxidation over CuO-Based α-MnO2 Nanowire Catalysts" Nanomaterials 12, no. 12: 2083. https://0-doi-org.brum.beds.ac.uk/10.3390/nano12122083
Note that from the first issue of 2016, this journal uses article numbers instead of page numbers. See further details here.